Abstract
Aminoglycoside antibiotics are small-molecule drugs that bind RNA. The affinity and specificity of aminoglycoside binding to RNA can be increased through chemical modification, such as guanidinylation. Here, we report the binding of guanidinoneomycin B (GNB) to an RNA helix from the HIV-1 frameshift site. The binding of GNB increases the melting temperature (Tm) of the frameshift-site RNA by at least 10°8C, to a point at which a melting transition is not even observed in 2m urea. A structure of the complex was obtained by using multidimensional heteronuclear NMR spectroscopic methods. We also used a novel paramagnetic-probe assay to identify the site of GNB binding to the surface of the RNA. GNB makes major-groove contacts to two sets of Watson–Crick bases and is in van der Waals contact with a highly structured ACAA tetraloop. Rings I and II of GNB fit into the major groove and form the binding interface with the RNA, whereas rings III and IV are exposed to the solvent and disordered. The binding of GNB causes a broadening of the major groove across the binding site.
Keywords: antibiotics, guanidinoglycosides, NMR spectroscopy, RNA recognition, RNA structures
Introduction
The expression of the enzymes of human immunodeficiency virus 1 (HIV-1) requires a programmed —1 ribosomal frameshift between the gag and pol reading frames.[1] Without the —1 frameshift, translation is terminated at a stop codon at the 3′ end of gag, and only the Gag polyprotein, which contains structural proteins, is produced. The —1 frameshift allows the translation of the pol genes, which are expressed in the form of a Gag-Pol fusion protein. Upon proteolysis, Gag–Pol gives rise to the reverse transcriptase, protease, and integrase enzymes in addition to the structural proteins contained in Gag. The frameshift occurs with 5–10% efficiency; thus, a 20:1–10:1 ratio of Gag to Gag–Pol results.[1–4] The stoichiometry is highly conserved among retroviruses and is important for viral-RNA dimerization and propagation.[5] An increase or decrease in frameshift efficiency leads to a significant reduction in the production of infective virus particles.[6, 7]
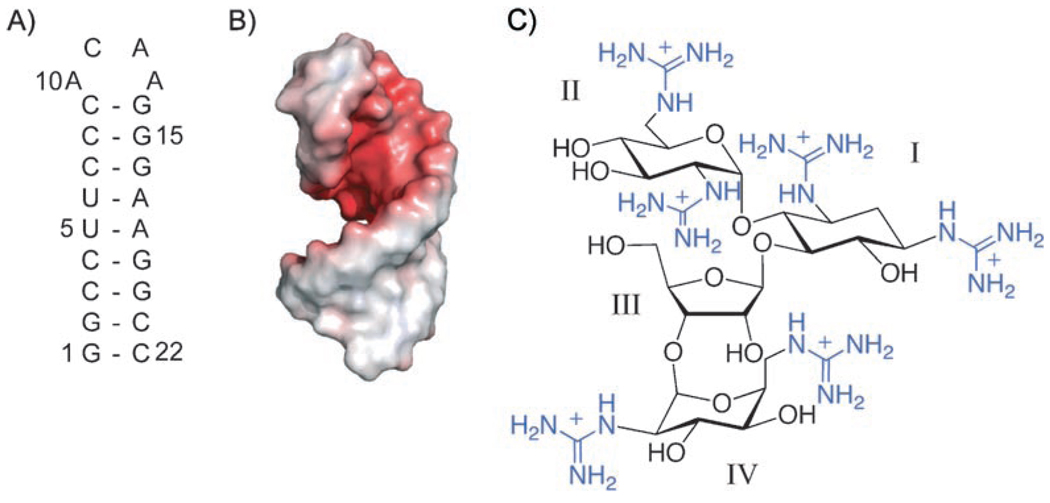
The frameshift event is induced by two RNA elements between the gag and pol genes in the viral RNA: a heptanucleotide slippery sequence (UUUUUUA) within which the frameshift occurs, and a highly conserved stem-loop structure immediately downstream from the slippery site (Figure 1A).[1, 2, 8] We determined the structure of the stem loop of the HIV-1 frameshift site by NMR spectroscopy[9, 10] (Figure 1A, B). The stem loop is highly thermostable, with Tm>90°C.[10] The ribosomal frame-shifting efficiency for HIV-1 is directly correlated to the thermal stability of the stem loop.[8,11] The precise mechanism by which the HIV-1 frameshift site induces ribosomal frameshifting remains unknown. The stem loop may be a poor substrate for the ribosomal helicase[12] or function as a thermodynamic obstacle to the translating ribosome.[11]
Figure 1.
HIV-1 frameshift site and guanidinoneomycin B. A) Sequence and secondary structure of the stem-loop RNA of the HIV-1 frameshift site. The numbering for the stem-loop RNA construct begins with the 5′ guanosine residue as 1. B) Electrostatic surface potential of the frameshift-site stem loop. Electrostatic potential is indicated by color (red = −4 kT/e, white = 0 kT/e, blue = +4 kT/e). C) Chemical structure of guanidinoneomycin B. The numbering of the individual glycosidic rings is indicated with Roman numerals. Guanidinium groups are in blue.
Owing to its critical function and extremely high sequence conservation, the frameshift-site stem loop is an attractive target for drug development.[6, 13, 14] Small molecules that bind the frameshift site may alter its structure or stability and thereby affect frameshift efficiency. A novel but toxic small molecule that increases the rate of frameshifting has been shown to inhibit HIV-1 replication in vivo.[6]
The electrostatic surface of the frameshift-site stem-loop structure reveals a highly electronegative pocket (Figure 1 B). Seven G–C pairs in the stem loop contribute to a pronounced electronegative potential in the major groove. We hypothesized that this electronegative pocket, which is capped by a structured ACAA tetraloop, would make an attractive binding site for positively charged small molecules.
Aminoglycosides are a large family of naturally occurring cationic polyamines, which have been reported to bind to a wide variety of RNA structures.[15–27] The binding affinity of this class of molecules is driven by electrostatic interactions between the ammonium groups of the aminoglycosides and the RNA;[28, 29] hence, aminoglycosides with larger numbers of amino groups are typically more potent RNA binders.[30] Aminoglycosides bind preferentially to RNA over DNA and tend to bind in the major groove of RNA.[31, 32] They bind to RNA sites otherwise occupied by metal ions.[33–36] Shape complementarity between the covalently linked ammonium groups and the negative electrostatic potential of the RNA is required for specific binding.[29, 37] Despite the ability of aminoglycosides to bind at specific sites of RNA, the major contribution of electro static interactions to binding gives rise to a high degree of promiscuity in RNA–aminoglycoside binding.[30] The synthetic modification of aminoglycosides has been a major focus in the search for antiviral and antitumor agents.[38–40]
Guanidinoglycosides are a synthetically produced family of small molecules in which the ammonium groups of aminoglycosides have been replaced by guanidinium groups in an effort to improve the RNA-binding affinity and specificity of aminoglycosides (Figure 1C).[41] Guanidinoglycosides have been shown to bind RNA,[41] to enter cells efficiently,[42] and to inhibit HIV-1 replication in vivo.[43] Like their aminoglycoside precursors, guanidinoglycosides bind preferentially to RNA over DNA and show selectivity between RNA molecules.[41] They were also shown to have a higher binding affinity and selectivity than aminoglycosides by using the HIV-1 Rev-response-element RNA as a model system.[41]
Here, we describe our investigations into the 1:1 binding of guanidinoneomycin B (GNB) to the HIV-1 frameshift site. The solution structure of the complex was determined by using multidimensional heteronuclear NMR spectroscopic methods. We present the first structural view of HIV-1 frameshift-site RNA in a complex with a small molecule.
Results
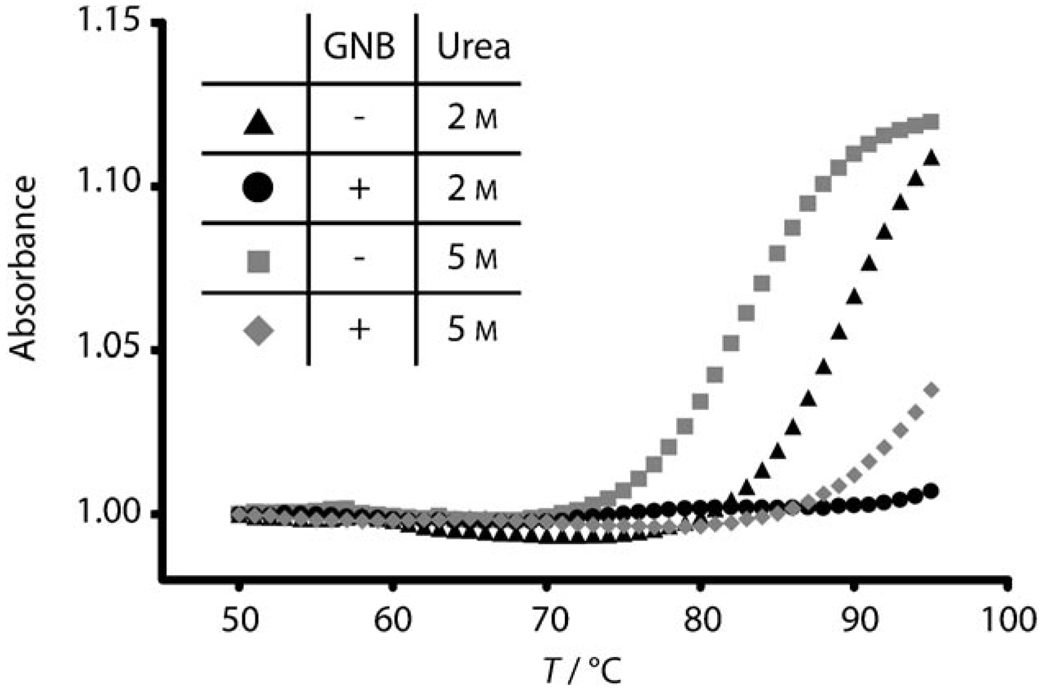
Several different aminoglycoside drugs and their derivatives were screened for their ability to stabilize the frameshift-site RNA by UV spectrophotometric analysis of thermodynamic melting profiles (data not shown). The guanidinoglycoside derivative of neomycin B, GNB,[43] was the most stabilizing of all compounds tested. No RNA melting transition was observed in the presence of 2.5 µm GNB, even when 2m urea was added as a denaturant (Figure 2). We reasoned that the lack of an observable melting transition was due to a very high thermodynamic stability induced by GNB binding. In 5 m urea, the free RNA exhibits a single melting transition centered at 83°C. This thermal stability is consistent with the results of previous studies.[10] The addition of GNB increases the melting transition to at least 93°C, although the large increase in the stability of the complex does not allow visualization of the entire melting curve (Figure 2). Therefore, we conclude that GNB binds the HIV-1 stem loop and is capable of increasing significantly its already considerable thermodynamic stability.
Figure 2.
Thermodynamic denaturation profiles of the HIV-1 frameshift-site RNA with and without GNB at varying concentrations of urea. UV absorbance at 260 nm is plotted versus temperature for the frameshift-site stem-loop RNA (2 µm) in the absence of GNB with urea at a concentration of 2 m (▲) or 5 m ( ). The sample of the GNB-bound RNA contained RNA (2 µm) in the presence of GNB (2.5 µm) with urea at a concentration of 2m (●) or 5 m (
 ). The RNA–GNB complex was formed at high concentration (1.2 mm RNA+1.5 mm GNB) and diluted immediately prior to analysis. The low-temperature baseline absorbance was normalized to 1 for all samples.
NMR spectroscopic analysis of the RNA–GNB complex
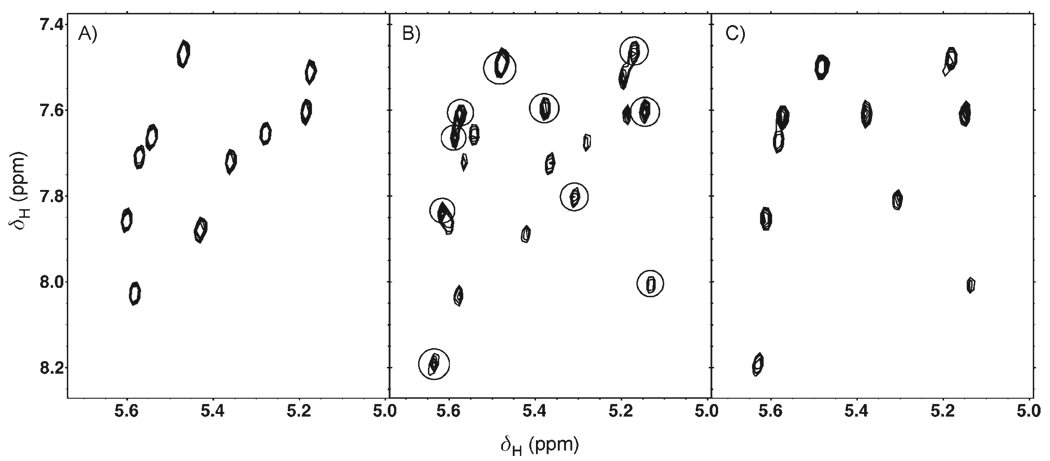
GNB binding to the frameshift-site stem loop was monitored by 2D 1H,1H TOCSY (Figure 3). The 2D TOCSY fingerprint of a well-folded RNA molecule contains a single correlation for each pyrimidine base in the molecule and provides a simple diagnostic for both the folding of RNA and its interactions with ligands.[44] The 2D TOCSY spectrum of the frameshift-site stem-loop RNA contains 10 well-dispersed peaks, one for each pyrimidine base (Figure 3A). Upon the addition of a sub-stoichiometric amount of GNB (0.6:1), a second set of 10 peaks, which correspond to the bound RNA conformation, was observed (Figure 3B). The presence of two complete sets of peaks indicates slow exchange from the bound to the unbound conformation. At a GNB–RNA stoichiometry of 1.25:1, only peaks corresponding to the bound conformation were observed (Figure 3C); this indicates that the RNA is completely bound by GNB. The single set of ten peaks for the bound conformation indicates that the RNA adopts a single, well-defined conformation upon GNB binding.
Figure 3.
Monitoring of GNB binding to the frameshift-site stem-loop RNA by 1H,1H TOCSY (750 MHz). A) The frameshift-site stem loop (RNA: 1.2 mm) in the absence of GNB. B) The frameshift-site stem loop (RNA: 1.2 mm) with GNB (0.75 mm). Peaks from the bound conformation are indicated with circles. C) The frameshift-site stem loop (RNA: 1.2 mm) with GNB (1.5 mm). All cross-peaks shown correspond to H5–H6 correlations of pyrimidine residues.
Chemical-shift-mapping experiments revealed significant chemical-shift changes throughout the RNA molecule upon GNB binding, except at the 5′ and 3′ ends. This observation is consistent with a Coulombic end effect, which suggests that the binding of cationic ligands to the ends of nucleic acids is less favorable than binding at central locations.[45] Significant chemical-shift perturbations were observed primarily in the major groove (data not shown). Therefore, the major groove is the likely binding region. The distribution of chemical-shift changes throughout the length of the RNA major groove made it impossible to characterize the GNB-binding site more precisely by this method.
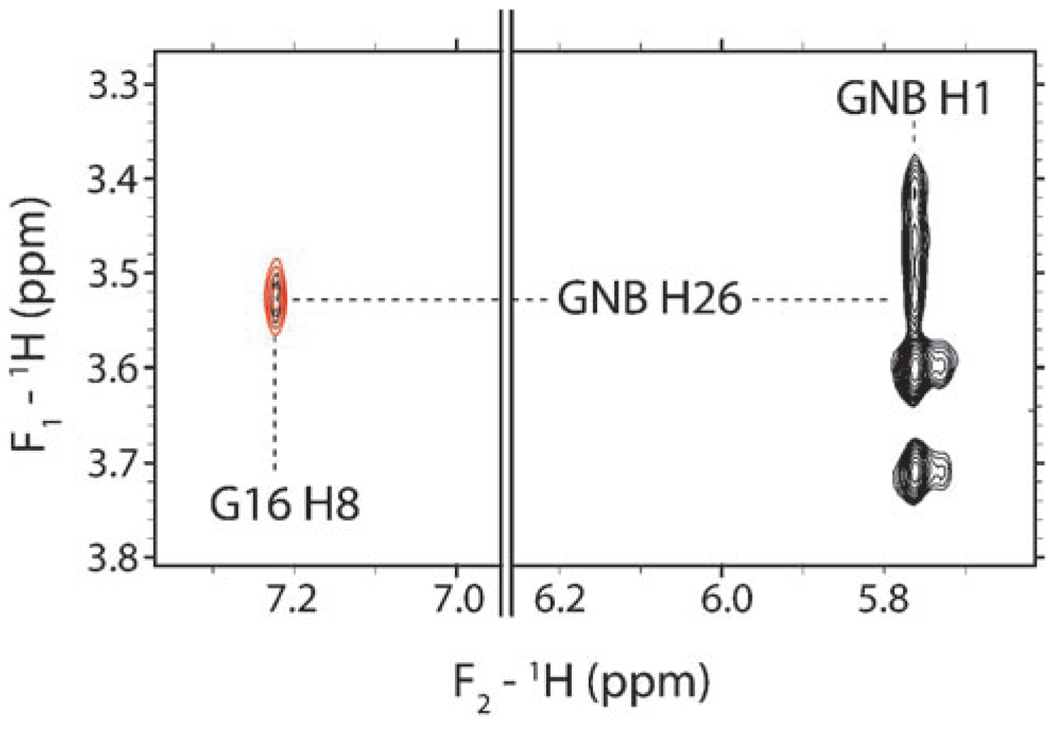
Intermolecular interactions between GNB and the RNA were identified by a combination of standard 2D 1H,1H NOESY experiments and filtered, edited NOESY experiments of 13C/15N-labeled RNA and unlabeled GNB. Only intermolecular NOEs were observed in the filtered and edited NOESY experiments.[46] Four intermolecular NOEs were observed between rings I and II of GNB and the frameshift-site stem loop RNA. An intermolecular NOE to G16 is shown as an example (Figure 4). No intermolecular NOEs were observed between rings III and IV of GNB and the RNA.
Figure 4.
1H,1H NOESY (750 MHz) of the RNA–GNB complex. An intramolecular NOE between H1 and H1′ of GNB and an intermolecular NOE between H1 of GNB and H8 of G16 of the RNA are observed (black contours). An f1-filtered/f2-edited 1H,1H NOESY spectrum is overlayed (red contours). Only intermolecular NOEs are observed in such an f1-filtered/f2-edited spectrum.
In contrast to the small number of intermolecular NOEs, the conformation of the GNB molecule was defined relatively well by 66 intramolecular NOEs and six residual dipolar couplings (RDCs). Intramolecular NOEs for GNB were observed between all of the rings, except between rings I and IV (Figure 1C; data not shown). Thus, rings I and IV appear to be distant from one another in the structure. Intramolecular NOEs between rings II and IV indicate that GNB folds upon binding to bring rings II and IV into close proximity.
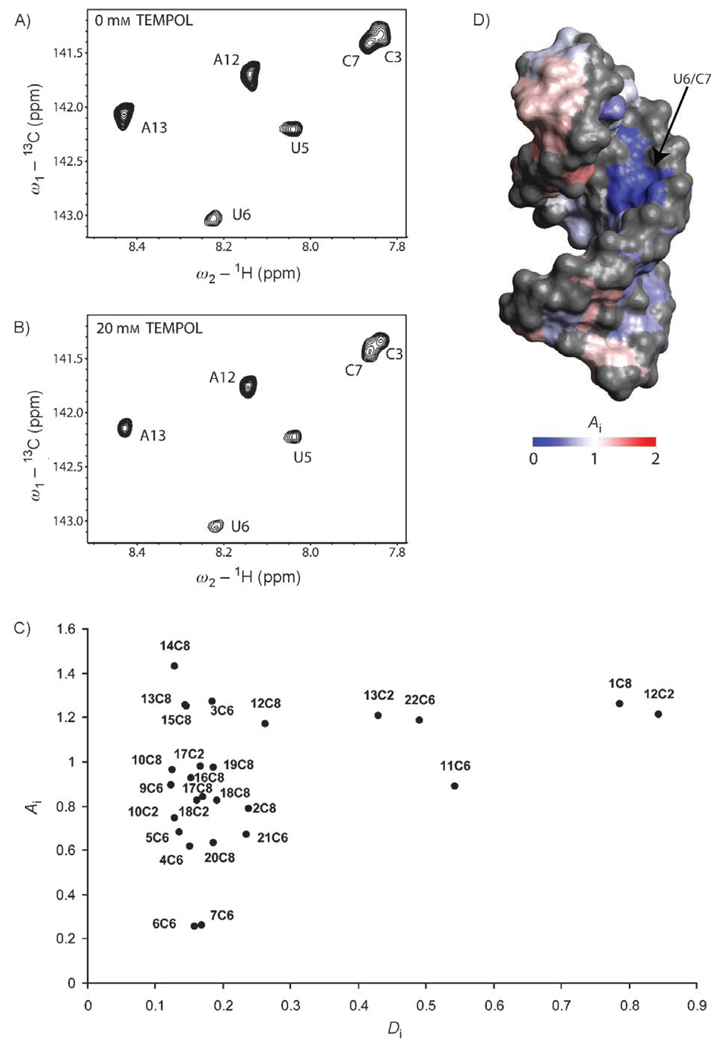
As only a limited number of intermolecular NOEs were observed, we sought to develop a different method for determining the location of GNB binding to the RNA. We reasoned that a small paramagnetic probe could be used to investigate the surface accessibility of the free and bound frameshift-site stem-loop RNA, and that GNB binding should “protect” the RNA from the probe. Tempol, a small paramagnetic molecule with a radius of 3.7 Ǻ, is an effective probe of the molecular-surface accessibility of proteins.[47, 48] However, to our knowledge, this method has not been used to investigate the surface accessibility of RNA. Tempol causes distance-dependent paramagnetic-relaxation enhancement, which is observed as an attenuation of the NMR signal. The extent of attenuation depends upon the specific accessibility of the observed nuclei.[49] Higher surface exposure results in higher degrees of tempol-induced attenuation.
The degree of attenuation can be described by an attenuation index (Ai), which is determined from the integration of peak volumes. The Ai values can be compared to the atomic-depth index (Di), which is a quantitative description of the proximity of an atom to the molecular surface.[50] The tempol-induced attenuation pattern for the free RNA correlates well with the previously determined structure.[9] The greatest signal attenuation is observed for the 5′ and 3′ termini of the RNA and for the apical tetraloop, which are the most solvent accessible and dynamic regions of the molecule (data not shown).
Tempol probing of the complex between the frameshift-site stem loop and GNB (Figure 5A, B) yielded differential changes in the attenuation pattern relative to those observed with the free RNA. A plot of Ai versus Di shows a rough correlation between these two parameters (anomalous Ai values are addressed in the Discussion). For example, the most exposed atoms belong to residues near the ends of the molecule (G1, A12, C11, A13, and C22). These atoms have the highest Di values, and, as expected, the corresponding signals show the greatest attenuation by the probe (highest Ai values; Figure 5 C). In contrast, atoms that are stacked in the helix generally have low Di values and Ai values between 0.6 and 1. However, U6 and C7 have much lower Ai values (0.25 and 0.26, respectively) than would be predicted on the basis of their atomic depth in the structure of the free RNA (Figure 5 C). These data suggest that U6 and C7 are shielded from tempol-induced attenuation, either directly or indirectly, by GNB binding. Indeed, tempol probing revealed that the U6 and C7 Ai values are on average twice as high for the free RNA. This result is consistent with the conferral of protection from the paramagnetic probe by the ligand. The mapping of the Ai values to the surface of the molecule provides a visual indication of where GNB may interact with the RNA (Figure 5D). Interestingly, C7 and G16 form a base pair in the upper middle portion of the RNA helix. Both the attenuation and NOE data indicate binding to this region.
Figure 5.
Measurement of surface accessibility through paramagnetic probing. A) 1H,13C HSQC spectrum of the RNA–GNB complex. B) 1H,13C HSQC spectrum of the RNA–GNB complex in the presence of tempol (20 mm). C) Attenuation (Ai) versus atom-depth index (Di) for the complex of the frameshift-site stem loop with GNB. Di values were calculated from the structure of the free RNA. D) Surface representation of the structure of the frameshift-site stem loop. The RNA is colored according to the degree of attenuation (Ai) in the presence of tempol (20 mm). Regions not investigated by paramagnetic probing are indicated in gray.
Solution structure
The NMR spectroscopic data were sufficient to derive well-defined structures for both the RNA and the GNB molecule (Table 1). The structure of GNB is defined by 66 intramolecular NOEs (16.5 per glycosidic ring) and six RDCs. Similarly, the conformation of the RNA is defined well by the NMR spectroscopic data. The relatively small number of intermolecular NOEs was sufficient, in conjunction with the RDCs, to orient the two –molecules in a complex.
Table 1.
Structural statistics for the 20 lowest-energy structures of the 100 structures calculated.
| NOE-derived distance restraints | 446 |
| RNA (intramolecular) | 380 |
| GNB (intramolecular) | 62 |
| dihedral restraints | 181 |
| hydrogen-bond restraints | 25 |
| rmsd (all heavy atoms) [Ǻ] | 1.61 |
| RNA only [Ǻ] | 0.99 |
| GNB only [Ǻ] | 2.49 |
| average NOE rmsd [Ǻ] | 0.019 |
| average dihedral rmsd [°] | 2.14 |
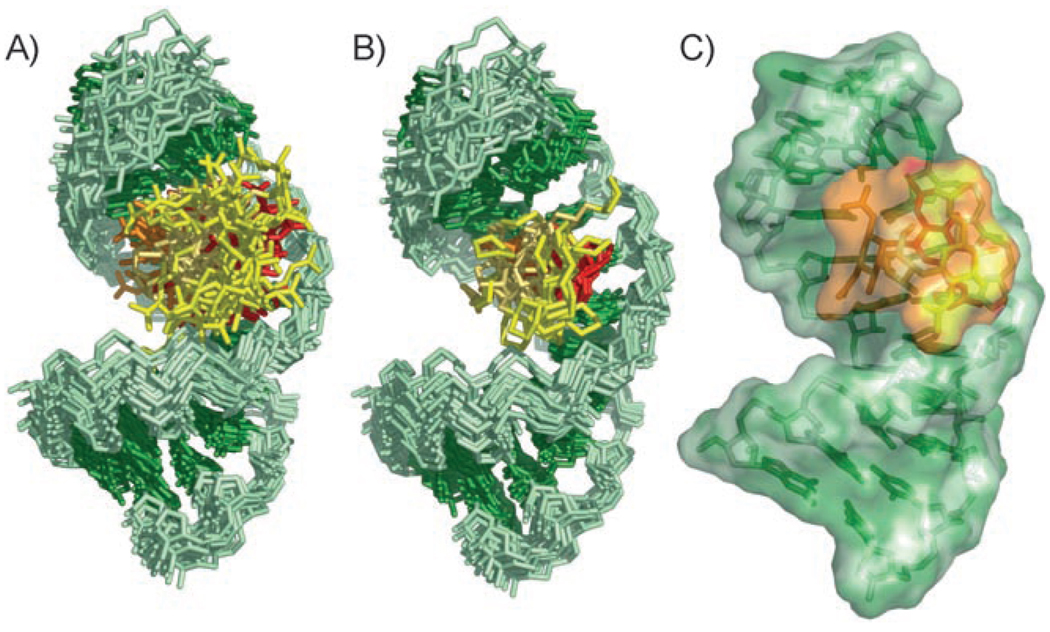
Structures of the RNA–GNB complex were calculated from a total of 446 NOE-derived distance restraints and 23 RDCs, as well as backbone-torsion-angle and hydrogen-bond restraints for the Watson–Crick pairs in the helical portion of the RNA (Table 1). The structures converge to a root-mean-square distance (rmsd) over all heavy atoms in the complex of 1.61 Ǻ (Figure 6A). Within this ensemble, GNB has an rmsd of 2.49 Ǻ over all heavy atoms. As a result of overlap and broadening of the peaks, restraints could not be determined for the GNB guanidinium groups; hence, these groups are poorly defined in the structure. The rmsd for GNB improves to 1.18 Ǻ when only the rings (and not the guanidinium groups) are considered.
Figure 6.
Structure derived by NMR spectroscopy of the HIV-1 frameshift-site stem-loop RNA complexed with GNB. The RNA is green, and rings I, II, III, and IV of GNB are colored orange, red, pale orange, and yellow, respectively. The view is into the major groove of the GNB-binding site of the RNA. A) Superimposition of the 20 lowest-energy structures over all heavy atoms. B) Superimposition of the 20 lowest-energy structures over all heavy atoms of the RNA and only the rings of GNB. The unrestrained guanidinium groups are omitted for clarity. C) Lowest-energy structure of the complex between the frameshift-site stem loop and GNB.
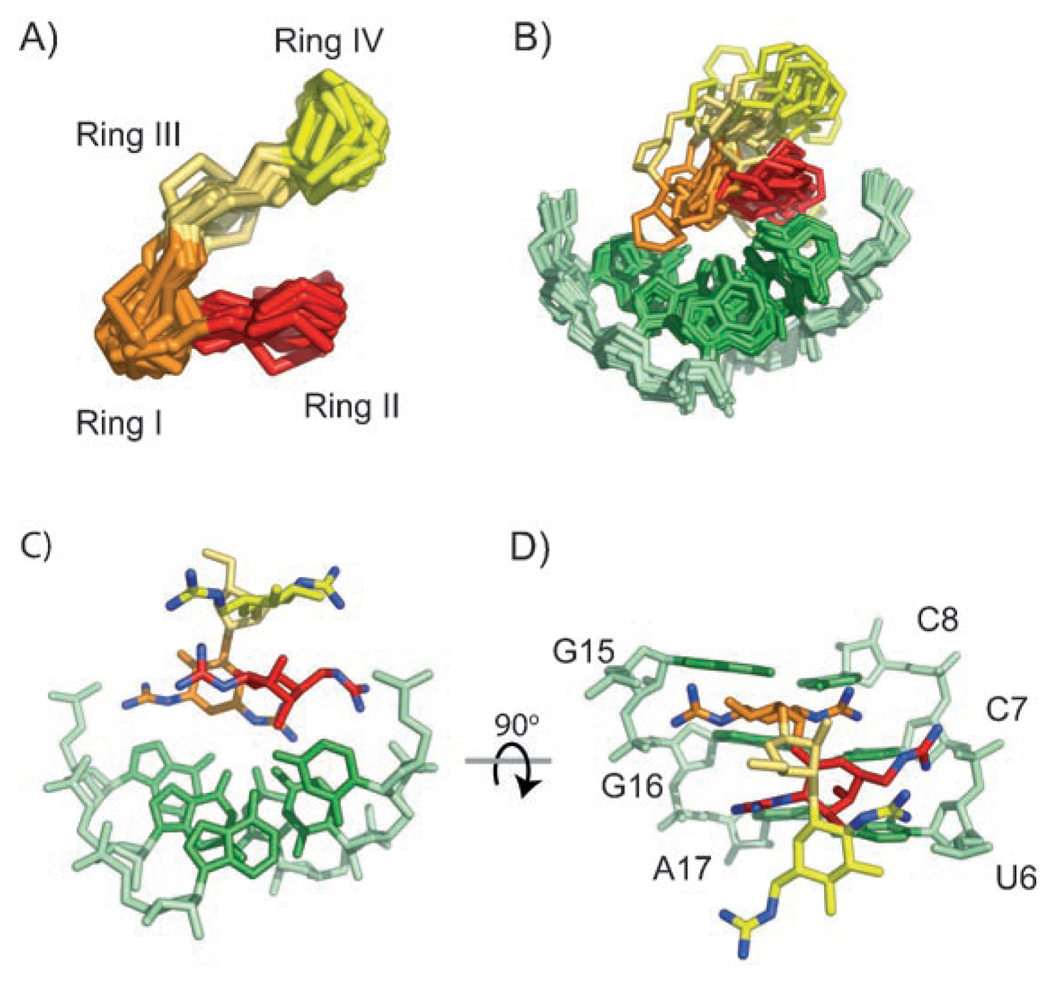
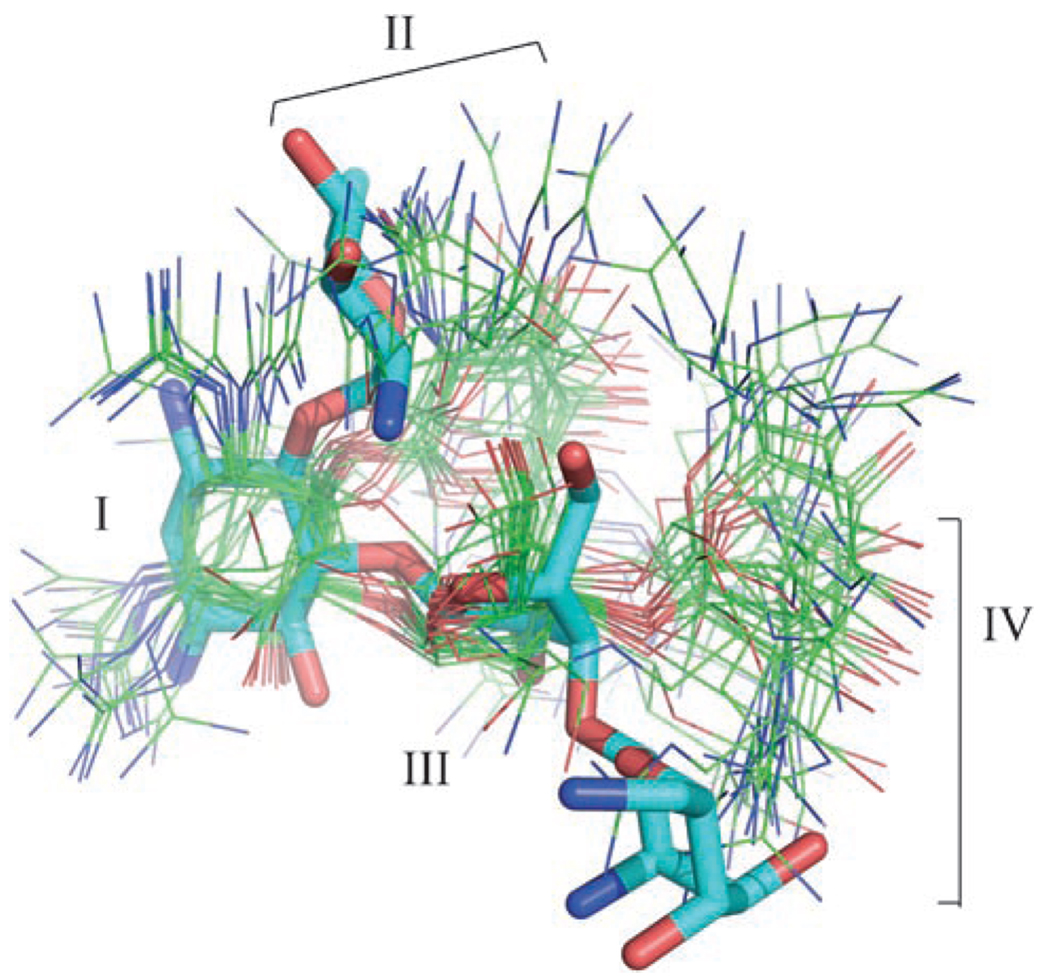
A significant bend at ring I causes GNB to adopt an L-shaped conformation upon binding the RNA, which brings rings II and IV into close proximity (Figure 7A). This bend is well defined by the 66 intramolecular NOEs observed for GNB. The glycosidic rings of GNB adopt chair conformations, with the guanidinium groups in equatorial positions, as expected. Rings I and II of GNB form the binding surface and adopt a well-defined conformation in the complex with the frameshift-site stem loop (Figure 7 B–D). Rings III and IV of GNB are distal to the binding interface and disordered in the structure (Figure 7 B). GNB interacts most directly with nucleotides C7, C8, and G16 (Figure 7D). The guanidinium groups may be capable of interacting with phosphate groups on neighboring nucleotides (Figure 7C, D), but their precise positions cannot be ascertained from the available data.
Figure 7.
GNB complexed with the HIV-1 frameshift-site stem loop. A) Superimposition of the lowest-energy structures of GNB in the complex over all heavy atoms in the rings of GNB. The guanidinium groups are omitted for clarity. B) Superimposition of the lowest-energy structures of the complex over all heavy atoms of rings I and II of GNB, and U6–C8 and G15–A17 of the RNA. C) Single representative structure showing the potential orientation of guanidinium groups. D) Structure in (C) rotated forward by 90°.
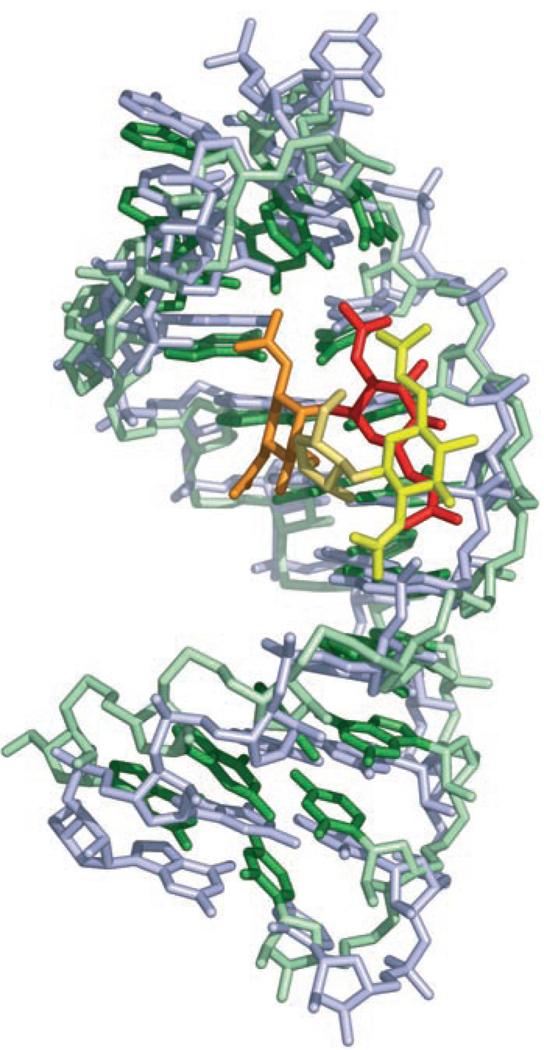
The major groove of the frameshift-site stem loop is widened slightly upon GNB binding (Figure 8), with an average distance increase of 4 Ǻ. The increase in the width of the major groove correlates to the positioning of GNB. The only other major structural change to the RNA upon GNB binding is a repositioning of the tetraloop (Figure 8). The ACAA tetraloop in the complex is well defined with a local rmsd of 0.52 Ǻ and adopts a fold that is similar to that observed in the free RNA. A12 is stacked upon A13; A10 and A13 are in close enough proximity to form a sheared AA pair within the loop; and the turn in the tetraloop occurs between A10 and C11 (Figure 6C). Although the overall tetraloop fold is unchanged, there is an rmsd of 2.78 Ǻ for the tetraloop in the free and bound conformations. A10 and C11 are better stacked in the structure of the RNA–GNB complex, with A10 positioned over the GNB ligand in the complex.
Figure 8.
Comparison of the free and bound RNA structures. The bound RNA structure is colored as in Figure 6. The free frameshift-site stem loop RNA (1PJY) is overlayed and shown in gray.
Discussion
GNB binds the frameshift-site stem-loop RNA to form a 1:1 complex. The preferred binding location of GNB on the RNA was determined by the identification of intermolecular NOEs between the RNA and the ligand (Figure 4) and paramagnetic attenuation experiments (Figure 5). We attempted to measure the dissociation constant for the complex between GNB and the RNA frameshift-site stem loop by isothermal titration calorimetry experiments. However, the observation of only small changes in enthalpy associated with binding precluded the determination of a binding constant by this method. It is possible that the binding of GNB could be driven entropically through the release of ordered water molecules that surround GNB and the RNA. Nevertheless, the presence of two complete sets of peaks in the NMR spectroscopic data for the free and bound conformations indicates that GNB is bound tightly to the RNA and does not dissociate on the NMR timescale (250 ms). Ligands that undergo such slow exchange on the NMR timescale typically have dissociation constants of 10−8m or less and are characterized by a diffusion-controlled on rate.[51] A slow off rate is also consistent with the large thermodynamic effect of binding at low micromolar concentrations of RNA and GNB (Figure 2).
Only four intermolecular NOEs were detected between GNB and the RNA. However, the chemical-shift data indicate that the complex forms a single, well-defined structure (Figure 3). There are few nonexchangeable hydrogen atoms on the GNB molecule, as it is highly substituted with guanidinium and hydroxy groups (Figure 1 C). The signals for the guanidinium and hydroxy groups are line broadened as a result of exchange with the solvent, which suggests that their contacts to the RNA are transient. The structure reveals that there are only five nonexchangeable hydrogen atoms on GNB within 6 Ǻ of the RNA. The distances between four of these five atoms and the RNA correspond to the assigned NOEs; this supports the hypothesis that only few intermolecular NOEs are observed as a result of the low number of nonexchangeable hydrogen atoms located close enough to the RNA for NOEs to occur.
The probing experiment with tempol is a new method for detecting the interaction of a ligand with RNA. In analogy to “footprinting” experiments in molecular biology, ligand binding results in the protection of a region of the RNA from the paramagnetic effects of the tempol probe. There is a correlation between the tempol attenuation data and the structures of the free and bound forms of the RNA. The most pronounced difference in attenuation is observed at U6 and C7; these nucleotides are at the GNB-binding site. C8 is also contacted directly by GNB; however, its aromatic H6 resonance unfortunately occurs in a region of spectral overlap in the paramagnetic sample. Therefore, the corresponding peak could not be integrated reliably.
Besides the identification of ligand-interaction sites, the tempol attenuation experiment may identify regions of the molecule that are dynamic and exposed transiently to solvent. The observed attenuation for A13, G14, and G15 (Figure 5 C), which form the 3′ side of the conserved ACAA tetraloop and adjacent stem, suggests that these residues may experience dynamic motions that allow them greater access to the tempol probe. Their attenuation (Ai) values are greater than would be predicted from their position relative to the surface of the molecule (Di values). Other shape-dependent factors, such as the motion of solvent molecules at the RNA surface, could also justify the anomalous probing data.[47, 52]
In the bound state, GNB adopts an L-shaped conformation through a significant bend at ring I (Figure 7 A). The pronounced bend at ring I is also observed for paromomycin bound to rRNA[21, 53] and thus may be a preferred conformation for aminoglycosides and guanidinoglycosides when bound to RNA. (Note that the nomenclature for ring I is not always consistent, and this ring is also referred to as ring II). Rings I and II of GNB fit snugly into the major groove of the RNA and contact the U6, C7, C8, and G16 bases (Figure 7 B–D). Four of the six guanidinium groups are attached to rings I and II, which probably explains why the contact of this portion of the ligand with the RNA is preferred (Figure 7C, D). Interestingly, rings I and II of the neomycin class of aminoglycosides are sufficient to confer binding specificity to a model ribosomal-A-site RNA molecule.[19, 21] A comparison of our GNB structure determined by NMR spectroscopy with the X-ray crystal structure at a resolution of 2.4 Ǻ of neomycin B bound to RNA[54] reveals interesting differences. Rings I and III of the structures can be superimposed with an rmsd of 1.0 Ǻ, but rings II and IV of GNB are each rotated by approximately 6 Ǻ relative to those of neomycin B (Figure 9). The conformational differences between the RNA-bound forms of neomycin B and GNB may be due to the guanidinium groups, as the pattern and distribution of equatorial substituent groups are known to modulate the structure and dynamics of aminoglycosides.[55]
Figure 9.
Overlay of the RNA-bound GNB structures with the X-ray crystal structure (at a resolution of 2.4 Ǻ) of neomycin B bound to RNA (PDB ID: 2et4). The structures were superimposed over the common heavy atoms of the central rings (I and III) only.
Although the rmsd of GNB is only 2.5 Ǻ (Table 1), the positions of rings I and II are well defined relative to the RNA and therefore limit the conformational space occupied by the guanidinium groups. Within the ensemble of the NMR-derived structures, the guanidinium groups are generally oriented towards the RNA phosphate backbone, as well as towards the bases U6, C7, and C8 (Figure 7C, D). Potential ionic interaction sites for the GNB guanidinium groups include the phosphate groups of U6, C7, and G15. The preferred binding site contains tandem C–G pairs, which present multiple hydrogen-bond acceptors in the major groove. Tandem C–G pairs are electrostatic hot spots for the interaction of magnesium ions with the RNA major groove.[56] It is therefore not surprising that GNB, which has a charge of +6, binds to the C–G pairs within the accessible electronegative major groove. Furthermore, the structured ACAA tetraloop provides an overhanging “shelflike” surface that is within van der Waals contact of GNB (Figure 6). However, the apparent lack of specific contacts to the tetraloop suggests that GNB could bind to the major groove of many RNA structures. Indeed, GNB can displace competitively a Rev peptide bound to the HIV-1 Rev-response-element RNA.[41] As rings I and II are the only parts of GNB in contact with the RNA, the structure also suggests that the removal of rings III and IV should have little effect upon binding and might help reduce nonspecific interactions with RNA.
GNB binding stabilizes significantly the already highly stable frameshift-site stem loop. HIV-1 frameshift efficiency is related directly to the stability of this stem loop, and mutations that increase or decrease the stability of the stem loop lead to corresponding decreases in frameshift efficiency in vivo.[11] Moreover, changes in frameshift efficiency diminish significantly HIV-1 replication.[6, 7] The increase in thermodynamic stability observed upon the binding of GNB may be sufficient to alter frameshift efficiency and decrease the rate of viral replication. However, GNB is probably capable of binding to many RNA sequences and motifs. For the frameshift site to be targeted with a small-molecule drug, greater specificity for this site would be required. Nevertheless, we have demonstrated that a small molecule can bind to a preferential location on the HIV-1 frameshift site and perturb the RNA structure and stability. It may be possible to use the structural and thermodynamic information derived from this study to engineer new compounds capable of targeting the HIV-1 frameshift site with improved properties.
Experimental Section
RNA synthesis and purification
The sequence investigated corresponds to the most frequently occurring isolate among natural variants circulating in plasma (group M, subtype B; strain NL4-3), and begins at a naturally occurring GG dinucleotide, which facilitated large-scale in vitro RNA production with T7 RNA polymerase. RNA was transcribed in vitro by using purified His6-tagged T7 RNA polymerase and synthetic DNA oligonucleotides (Integrated DNA Technologies), as previously described.[9, 57–59] RNA was purified by denaturing 20% polyacrylamide gel electrophoresis, identified by UV absorption, and excised from the gel. The RNA was recovered by diffusion into 0.3m sodium acetate (pH 5.2) and precipitation with ethanol, then purified on a 6-mL DEAE (diethylaminoethyl) anion-exchange column. It was again precipitated with ethanol and then desalted on a 15-mL sephadex G-25 gel filtration column. The purified RNA was lyophilized, resuspended in water, and brought to pH 6.8 by the addition of 1 m NaOH. All NMR samples were 1 mm in RNA and 50 mm in NaCl. Fully 13C/15N-labeled RNA samples for NMR spectroscopy were prepared by using 13C/15N-labeled ribo-nucleotide triphosphates (rNTPs; Cambridge Isotope Laboratories). For the partial alignment of the complexes for RDC measurements, the filamentous bacteriophage Pf1 (17 mg/mL; ASLA, Riga, Latvia) was added to the 13C/15N-labeled samples.[60]
GNB synthesis and purification
GNB was synthesized and purified as described previously.[43] In brief, chloroform (3 mL), triethylamine (100 mL), and N,N′-bis(tert-butoxycarbonyl)-N′-triflylguanidine (300 mg; prepared according to ref. [61]) were added to a solution of neomycin sulfate (30 mg) in methanol (1 mL). The reaction mixture was stirred vigorously for 24 h until the multiple products observed by TLC (7% methanol in dichloromethane) converged into the fastest moving major spot and one minor spot. All volatiles were removed in vacuo. Flash chromatography (2–4% methanol in dichloromethane) afforded the desired product (46 mg, 22.4 mmol, 70%) as an off-white solid. The product was submitted directly to deprotection without further purification.
Trifluoroacetic acid (5 mL) and triisopropylsilane (50 µL) were added to a solution of tert-butoxycarbonyl-protected guanidinoneomycin B (45 mg) in dichloromethane (5 mL). The reaction mixture was stirred vigorously at room temperature for 3 h until TLC (12% methanol in chloroform) showed that all starting material had been consumed and the presence of one baseline spot. Water (25 mL) was added, and the resulting mixture was washed with chloroform (2 × 15 mL) and diethyl ether (2 × 15 mL). The aqueous layer was evaporated in vacuo to yield the desired product as a white solid, which was dissolved in 0.1% TFA/water (1 mL) and lyophilized to dryness. Analytical reversed-phase HPLC (C-18, 5–20% acetonitrile−0.1% TFA/water−0.1% TFA, 30 min) showed one major peak. Purification by HPLC (C-18, 5–20% acetonitrile−0.1% TFA/water−0.1% TFA, 30 min) yielded the desired product (18 mg, 20.7 µmol, 95%) as a white solid. MS: m/z calculated for C29H58N18O13 : 866.44; found: 434.28 [M+2H]2+, 867.27 [M+H]+.
NMR spectroscopy
All NMR spectra were obtained on Varian Inova and Bruker DMX spectrometers at the National Magnetic Resonance Facility at Madison (NMRFAM). Spectrometers used for data collection were equipped with a cryogenically cooled proton, carbon, nitrogen (HCN) probe with a single z-axis gradient or a conventional HCN triple-resonance probe.
Exchangeable resonances were assigned by 2D NOESY (mixing time: 150 ms; samples in 90% H2O/10% D2O, 283 K) and reference to previous chemical-shift assignments.[9] A 1-1 spin-echo or water-gate pulse sequence was used for water suppression for samples in 90% H2O/10% D2O. For experiments in 99.99% D2O, the residual HDO resonance was suppressed with a low-power presaturation pulse. Nonexchangeable resonances were assigned by reference to 2D NOESY spectra (mixing times: 50, 100, 200, 300, 400 ms), 2D TOCSY spectra, and 2D 1H,13C HSQC spectra of the RNA in 99.99% D2O at 303 K, as described previously.[57–59] GNB resonances were assigned by 2D 1H,13C HSQC and HMBC at natural 13C abundance, 2D 1H,15N HSQC at natural 15N abundance, 2D 1H,1H TOCSY, and NOESY, and reference to previous chemical-shift assignments for neomycin B.[19] 13C-filtered and edited NOESY experiments of fully 13C/15N-labeled RNA samples complexed with unlabeled GNB were performed as described previously.[46] Data were processed by using XWINNMR or NMRPipe software.[62] Resonance assignments were completed by using the program Sparky (http://www.cgl.ucsf.edu/home/sparky/).
Interproton distances
NOE distances were measured semiquantitatively from NOESY spectra. Intense NOEs observable at short mixing times (50 ms) were assigned as strong (1.8–3.6 Ǻ), medium-intensity NOEs were grouped as medium (1.8–5 Ǻ), and low-intensity NOEs observable only at long mixing times (200–400 ms) were grouped as weak (3–7 Ǻ).
Torsion-angle constraints
The backbone torsion angles (α, β, χ, δ, ε, and η) of the nucleotides in the stem (G1–C9, G14–C22) were restrained to A-form values, which were consistent with NOESY and RDC data. The backbone torsion angles of the tetraloop (A10–A13) were left unrestrained. 1H,1H TOCSY with a mixing time of 40 ms was used to analyze sugar-pucker conformations. Nucleotides with strong H1′–H2′ and H1′–H3′ cross peaks (C11, A12) were restrained to the C2′-endo range; nucleotides within the stem did not have H1′–H2′ cross peaks and were thus restrained to the C3′-endo range. The nucleotide A13 displayed an intermediate H1′–H2′ coupling indicative of an averaging of sugar puckers, and its sugar pucker was therefore left unrestrained. Analysis of the peak volumes of intranucleotide and internucleotide H1′(aromatic) and H2′- (aromatic) NOEs revealed that all nucleotides are in the anti range, and thus the torsion angle χ was restrained to 160 ± 15°. No torsion-angle constraints were used for GNB.
Analysis of residual dipolar coupling
The 1JC,H values were measured by 1H,13C HSQC experiments with unlabeled samples in 90% H2O/10% D2O at 303 K for both isotropic and partially oriented samples. RDCs were measured by determining the difference between the 1JC,H values for isotropic and partially aligned samples. PALES software (http://spin,niddk.nih.gov/bax/software/PALES) was used to estimate the values for the axial (Da) and rhombic (R) components of the alignment tensor from converged, low-energy structures calculated in the absence of RDCs. Structure calculations were made with Xplor-NIH[63] with a grid-search procedure[64] to obtain the optimal Da (−14.1) and R (0.19) values, whereby lowest overall energies were used as the targets.
Structure calculations
CNS 1.1[65] was used to calculate starting RNA structures in the absence of GNB from NOE distance and dihedral restraints. The structure calculations followed closely the default values for the NMR spectroscopic structure determination of nucleic acids with CNS 1.1. First, an extended (completely unfolded) structure was generated, from which 100 structures were calculated from random initial velocities. The structures were subjected to 60 ps (in 15-fs time steps) of restrained molecular dynamics in torsion-angle space, followed by 90 ps of slow cooling and 30 ps (in 5-fs time steps) of restrained molecular dynamics in Cartesian coordinate space. Only very weak (10 kcalmol−1 Ǻ −2) planarity restraints between Watson–Crick-paired bases were enforced during the CNS calculations, and hydrogen bonds were maintained by distance restraints. The RNA structures derived from the CNS calculations were refined against 1H,13C RDCs (aromatic and ribose H1′) with Xplor-NIH[63] by using identical distance and torsion-angle restraints. GNB was introduced into the structure calculations at random orientations during the Xplor-NIH calculations.[66] Angle and bond parameters as well as atomic charges for rings I–IV of GNB (Figure 1C) were calculated by using the software Gaussian version 03 (http://www.gaussian.com) at the Hartree–Fock level with the 6-31G* basis set. Restrained electrostatic potential (RESP) atomic charges were derived by applying the RESP module of the AMBER 7.0 package[67] to the Gaussian electrostatic potential (ESP) charges. Parameters for the acetalic functions were taken from GLYCAM.[68] Finally, the 20 lowest-energy structures were subjected to a final round of refinement by using an implicit solvent in AMBER 9.0. In all AMBER calculations, the AMBER99 force field[69] was used along with the generalized Born model[70] to mimic solvent. The salt concentration was fixed at 0.05m. A 50-ps simulated-annealing protocol was used for the RNA–GNB complex. The complex was refined by using NOE-derived distances, hydrogen-bond restraints for the Watson–Crick pairs, and torsion angles, as summarized in Table 1. RDCs were not used during the AMBER refinement. Square-well penalty functions were used for all NMR restraints with the force constants 32 kcal mol−1 Ǻ−2, 62 kcal mol−1 Ǻ−2, and 32 kcal mol−1 rad−2 for NOEs, hydrogen bonds, and torsion angles, respectively. A 0.5-fs time step was used for the integration of the Newton motion equations, and a 15-Ǻ cutoff was used for nonbonded atoms. The relative weights of the valence-angle energy, van der Waals terms, torsion energy, and improper torsional terms were increased gradually during the simulated annealing to maintain the planarity of the aromatic rings and proper local geometries. Structures were viewed and analyzed by using MOL-MOL.[71] The structures in the figures were produced by using PyMOL (http://www.pymol.org).
Tempol attenuation experiments
NMR samples of the free and GNB-bound frameshift-site stem-loop RNA were prepared as described above. Paramagnetic NMR samples contained tempol (20 mm) and were prepared by adding a solution of tempol (2m; 4-hydroxy-2,2,6,6-tetramethyl-piperidine 1-oxyl; Sigma–Aldrich) directly to the sample in the NMR tube. Two-dimensional 1H,13C HSQC spectra at natural 13C abundance were acquired on a 600-MHz Bruker DMX spectrometer. Cross-peak volumes were measured with a greater than 90% confidence level by using the Sparky integration tool. The cross-peak volumes were autoscaled according to Equation (1),[48] in which is the autoscaled volume of peak i from the paramagnetic or diamagnetic spectra, is the measured peak volume from the paramagnetic or diamagnetic spectra, and n is the number of peaks measured.
| (1) |
Hence, the autoscaled volume is equal to the measured volume divided by a scaling factor that corresponds to the mean cross-peak volume over n molecular locations. Paramagnetic attenuations, Ai, were calculated from the autoscaled diamagnetic and paramagnetic peak volumes, υd and υp, respectively, according to Equation (2):
| (2) |
The structure with the surface colored according to the degree of attenuation (Ai) in the presence of tempol (Figure 5D) was displayed by using the program MOLMOL.[71]
The 3D atom depths, reported as depth indexes, Di, were calculated by using the SADIC software[50] for all aromatic carbon atoms analyzed by NMR spectroscopy. Di is defined according to Equation (3), in which Vi,r is the exposed volume of a sphere of radius r (sampling radius) centered on atom i, and V0,r is the total volume of the same sphere.
| (3) |
The sampling radius was set to 10 Ǻ. The probe radius, used for the computation of the macromolecular surface, was set to 3.7 Ǻ, which corresponds to the molecular radius of tempol (calculated with the MOLMOL software package).[71]
UV spectroscopy
Thermal-stability studies were conducted on purified RNAs by using a Cary Model 100 Bio UV/Visible spectrophotometer equipped with a Peltier heating accessory and temperature probe. All free RNA samples contained sodium phosphate buffer (10 mm, pH 7.0), RNA (10 µm), KCl (200 mm), and urea at the specified concentration. All samples of the GNB–RNA complex contained a preformed complex of RNA (2 µm) and GNB (3 µm), sodium phosphate buffer (10 µm, pH 7.0), RNA (10 µm), KCl (200 mm), and urea at the specified concentration. Samples were heated from 25 to 90°C at a rate of 1° min−1, and absorption data were collected at 260 nm in increments of 1 °C. Thermodynamic values and transition temperatures (Tm) were calculated from normalized data by using SigmaPlot version 8.0 (SPSS Science) when appropriate. For the process of unfolding (F→U), when ΔCp=0, Equation (4) and Equation (5) apply, in which Θ is the fraction of RNA in the unfolded state, R is the gas constant, and T is the temperature in Kelvin.
| (4) |
| (5) |
To fit a curve to the absorption data, the pretransitional and post-transitional baselines were determined by linear curve fitting.[72] These baselines were used to find the fraction of unfolded RNA as a function of temperature and subsequently values of ΔH, ΔS, and Tm.[72]
Coordinates
Structure coordinates have been deposited with the Protein Data Bank (accession code: 2JUK).
Acknowledgements
We thank Jared Davis, Ryan Marcheschi, Nicholas Reiter, and Dipa Sashital for helpful discussions, and Marco Tonelli, Milo Westler, and the National Magnetic Resonance Facility at Madison (NMRFAM)for assistance with NMR spectroscopic studies. This study made use of the NMRFAM (www.nmrfam.wisc.edu), which is supported by the National Institutes of Health (grants P41RR02301 (Biomedical Research Technology Program, National Center for Research Resources)and P41M66326 (National Institute of General Medical Sciences)). Equipment in the facility was purchased with funds from the University of Wisconsin, the National Institutes of Health (P41M66326, P41RR02301, RR02781, RR08438), the National Science Foundation (DMB-8415048, BIR-9214394), and the U.S. Department of Agriculture. This research was supported by NIH grants GM072447 to S.E.B. and AI47673 to Y.T., and by a Sullivan Wisconsin Distinguished Graduate Fellowship to D.W.S.
References
- 1.Jacks T, Power MD, Masiarz FR, Luciw PA, Barr PJ, Varmus HE. Nature. 1988;331:280. doi: 10.1038/331280a0. [DOI] [PubMed] [Google Scholar]
- 2.Parkin NT, Chamorro M, Varmus HE. J. Virol. 1992;66:5147. doi: 10.1128/jvi.66.8.5147-5151.1992. [DOI] [PMC free article] [PubMed] [Google Scholar]
- 3.Park J, Morrow CD. J. Virol. 1991;65:5111. doi: 10.1128/jvi.65.9.5111-5117.1991. [DOI] [PMC free article] [PubMed] [Google Scholar]
- 4.Kim YG, Maas S, Rich A. Nucleic Acids Res. 2001;29:1125. doi: 10.1093/nar/29.5.1125. [DOI] [PMC free article] [PubMed] [Google Scholar]
- 5.Shehu-Xhilaga M, Crowe SM, Mak J. J. Virol. 2001;75:1834. doi: 10.1128/JVI.75.4.1834-1841.2001. [DOI] [PMC free article] [PubMed] [Google Scholar]
- 6.Hung M, Patel P, Davis S, Green SR. J. Virol. 1998;72:4819. doi: 10.1128/jvi.72.6.4819-4824.1998. [DOI] [PMC free article] [PubMed] [Google Scholar]
- 7.Dulude D, Berchiche YA, Gendron K, Brakier-Gingras L, Heveker N. Virology. 2006;345:127. doi: 10.1016/j.virol.2005.08.048. [DOI] [PubMed] [Google Scholar]
- 8.Telenti A, Martinez R, Munoz M, Bleiber G, Greub G, Sanglard D, Peters S. J. Virol. 2002;76:7868. doi: 10.1128/JVI.76.15.7868-7873.2002. [DOI] [PMC free article] [PubMed] [Google Scholar]
- 9.Staple DW, Butcher SE. Nucleic Acids Res. 2003;31:4326. doi: 10.1093/nar/gkg654. [DOI] [PMC free article] [PubMed] [Google Scholar]
- 10.Staple DW, Butcher SE. J. Mol. Biol. 2005;349:1011. doi: 10.1016/j.jmb.2005.03.038. [DOI] [PubMed] [Google Scholar]
- 11.Bidou L, Stahl G, Grima B, Liu H, Cassan M, Rousset JP. RNA. 1997;3:1153. [PMC free article] [PubMed] [Google Scholar]
- 12.Takyar S, Hickerson RP, Noller HF. Cell. 2005;120:49. doi: 10.1016/j.cell.2004.11.042. [DOI] [PubMed] [Google Scholar]
- 13.Baril M, Dulude D, Gendron K, Lemay G, Brakier-Gingras L. RNA. 2003;9:1246. doi: 10.1261/rna.5113603. [DOI] [PMC free article] [PubMed] [Google Scholar]
- 14.Dinman JD, Ruiz-Echevarria MJ, Czaplinski K, Peltz SW. Proc. Natl. Acad. Sci. USA. 1997;94:6606. doi: 10.1073/pnas.94.13.6606. [DOI] [PMC free article] [PubMed] [Google Scholar]
- 15.Moazed D, Noller HF. Nature. 1987;327:389. doi: 10.1038/327389a0. [DOI] [PubMed] [Google Scholar]
- 16.Griffey RH, Hofstadler SA, Sannes-Lowery KA, Ecker DJ, Crooke ST. Proc. Natl. Acad. Sci. USA. 1999;96:10129. doi: 10.1073/pnas.96.18.10129. [DOI] [PMC free article] [PubMed] [Google Scholar]
- 17.Kirk SR, Tor Y. Bioorg. Med. Chem. 1999;7:1979. doi: 10.1016/s0968-0896(99)00170-4. [DOI] [PubMed] [Google Scholar]
- 18.Walter F, Vicens Q, Westhof E. Curr. Opin. Chem. Biol. 1999;3:694. doi: 10.1016/s1367-5931(99)00028-9. [DOI] [PubMed] [Google Scholar]
- 19.Fourmy D, Recht MI, Puglisi JD. J. Mol. Biol. 1998;277:347. doi: 10.1006/jmbi.1997.1552. [DOI] [PubMed] [Google Scholar]
- 20.Fourmy D, Yoshizawa S, Puglisi JD. J. Mol. Biol. 1998;277:333. doi: 10.1006/jmbi.1997.1551. [DOI] [PubMed] [Google Scholar]
- 21.Lynch SR, Gonzalez RL, Puglisi JD. Structure. 2003;11:43. doi: 10.1016/s0969-2126(02)00934-6. [DOI] [PubMed] [Google Scholar]
- 22.Lynch SR, Puglisi JD. J. Mol. Biol. 2001;306:1037. doi: 10.1006/jmbi.2000.4420. [DOI] [PubMed] [Google Scholar]
- 23.Puglisi JD, Tan R, Calnan BJ, Frankel AD, Williamson JR. Science. 1992;257:76. doi: 10.1126/science.1621097. [DOI] [PubMed] [Google Scholar]
- 24.Yoshizawa S, Fourmy D, Eason RG, Puglisi JD. Biochemistry. 2002;41:6263. doi: 10.1021/bi0121609. [DOI] [PubMed] [Google Scholar]
- 25.Yoshizawa S, Fourmy D, Puglisi JD. Embo J. 1998;17:6437. doi: 10.1093/emboj/17.22.6437. [DOI] [PMC free article] [PubMed] [Google Scholar]
- 26.Faber C, Sticht H, Schweimer K, Rosch P. J. Biol. Chem. 2000;275:20660. doi: 10.1074/jbc.M000920200. [DOI] [PubMed] [Google Scholar]
- 27.Raghunathan D, Sanchez-Pedregal VM, Junker J, Schwiegk C, Kalesse M, Kirschning A, Carlomagno T. Nucleic Acids Res. 2006;34:3599. doi: 10.1093/nar/gkl494. [DOI] [PMC free article] [PubMed] [Google Scholar]
- 28.Hendrix M, Priestley ES, Joyce GF, Wong CH. J. Am. Chem. Soc. 1997;119:3641. doi: 10.1021/ja964290o. [DOI] [PubMed] [Google Scholar]
- 29.Tor Y, Hermann T, Westhof E. Chem. Biol. 1998;5:R277. doi: 10.1016/s1074-5521(98)90286-1. [DOI] [PubMed] [Google Scholar]
- 30.Weizman H, Tor Y. In: Carbohydrate-Based Drug Discovery. Wong CH, editor. Weinheim: Wiley-VCH; 2005. p. 661. [Google Scholar]
- 31.Chen Q, Shafer RH, Kuntz ID. Biochemistry. 1997;36:11402. doi: 10.1021/bi970756j. [DOI] [PubMed] [Google Scholar]
- 32.Jiang L, Patel DJ. Nat. Struct. Biol. 1998;5:769. doi: 10.1038/1804. [DOI] [PubMed] [Google Scholar]
- 33.Earnshaw DJ, Gait MJ. Nucleic Acids Res. 1998;26:5551. doi: 10.1093/nar/26.24.5551. [DOI] [PMC free article] [PubMed] [Google Scholar]
- 34.Mikkelsen NE, Johansson K, Virtanen A, Kirsebom LA. Nat. Struct. Biol. 2001;8:510. doi: 10.1038/88569. [DOI] [PubMed] [Google Scholar]
- 35.Hermann T, Westhof E. J. Mol. Biol. 1998;276:903. doi: 10.1006/jmbi.1997.1590. [DOI] [PubMed] [Google Scholar]
- 36.Clouet-d'Orval B, Stage TK, Uhlenbeck OC. Biochemistry. 1995;34:11186. doi: 10.1021/bi00035a025. [DOI] [PubMed] [Google Scholar]
- 37.Arya DP, Xue L, Willis B. J. Am. Chem. Soc. 2003;125:10148. doi: 10.1021/ja035117c. [DOI] [PubMed] [Google Scholar]
- 38.Litovchick A, Evdokimov AG, Lapidot A. Biochemistry. 2000;39:2838. doi: 10.1021/bi9917885. [DOI] [PubMed] [Google Scholar]
- 39.Sucheck SJ, Greenberg WA, Tolbert TJ, Wong CH. Angew. Chem. 2000;112:1122. doi: 10.1002/(sici)1521-3773(20000317)39:6<1080::aid-anie1080>3.0.co;2-b. Angew. Chem. Int. Ed. 2000, 39, 1080. [DOI] [PubMed] [Google Scholar]
- 40.Kirk SR, Luedtke NW, Tor Y. J. Am. Chem. Soc. 2000;122:980. [Google Scholar]
- 41.Luedtke NW, Baker TJ, Goodman M, Tor Y. J. Am. Chem. Soc. 2000;122:12035. doi: 10.1021/jo001142e. [DOI] [PubMed] [Google Scholar]
- 42.Luedtke NW, Carmichael P, Tor Y. J. Am. Chem. Soc. 2003;125:12374. doi: 10.1021/ja0360135. [DOI] [PubMed] [Google Scholar]
- 43.Baker TJ, Luedtke NW, Tor Y, Goodman M. J. Org. Chem. 2000;65:9054. doi: 10.1021/jo001142e. [DOI] [PubMed] [Google Scholar]
- 44.Lind KE, Du Z, Fujinaga K, Peterlin BM, James TL. Chem. Biol. 2002;9:185. doi: 10.1016/s1074-5521(02)00106-0. [DOI] [PubMed] [Google Scholar]
- 45.Ballin JD, Shkel IA, Record MT., Jr Nucleic Acids Res. 2004;32:3271. doi: 10.1093/nar/gkh646. [DOI] [PMC free article] [PubMed] [Google Scholar]
- 46.Peterson RD, Theimer CA, Wu H, Feigon J. J. Biomol. NMR. 2004;28:59. doi: 10.1023/B:JNMR.0000012861.95939.05. [DOI] [PubMed] [Google Scholar]
- 47.Niccolai N, Spiga O, Bernini A, Scarselli M, Ciutti A, Fiaschi I, Chiellini S, Molinari H, Temussi PA. J. Mol. Biol. 2003;332:437. doi: 10.1016/s0022-2836(03)00852-0. [DOI] [PubMed] [Google Scholar]
- 48.Molinari H, Esposito G, Ragona L, Pegna M, Niccolai N, Brunne RM, Lesk AM, Zetta L. Biophys. J. 1997;73:382. doi: 10.1016/S0006-3495(97)78078-0. [DOI] [PMC free article] [PubMed] [Google Scholar]
- 49.Niccolai N, Ciutti A, Spiga O, Scarselli M, Bernini A, Bracci L, Di Maro D, Dalvit C, Molinari H, Esposito G, Temussi PA. J. Biol Chem. 2001;276:42455. doi: 10.1074/jbc.M107387200. [DOI] [PubMed] [Google Scholar]
- 50.Varrazzo D, Bernini A, Spiga O, Ciutti A, Chiellini S, Venditti V, Bracci L, Niccolai N. Bioinformatics. 2005;21:2856. doi: 10.1093/bioinformatics/bti444. [DOI] [PubMed] [Google Scholar]
- 51.Pellecchia M. Chem. Biol. 2005;12:961. doi: 10.1016/j.chembiol.2005.08.013. [DOI] [PubMed] [Google Scholar]
- 52.De Simone A, Spadaccini R, Temussi PA, Fraternali F. Biophys. J. 2006;90:3052. doi: 10.1529/biophysj.105.073171. [DOI] [PMC free article] [PubMed] [Google Scholar]
- 53.Carter AP, Clemons WM, Brodersen DE, Morgan-Warren RJ, Wimberly BT, Ramakrishnan V. Nature. 2000;407:340. doi: 10.1038/35030019. [DOI] [PubMed] [Google Scholar]
- 54.Francois B, Russell RJ, Murray JB, Aboul-ela F, Masquida B, Vicens Q, Westhof E. Nucleic Acids Res. 2005;33:5677. doi: 10.1093/nar/gki862. [DOI] [PMC free article] [PubMed] [Google Scholar]
- 55.Corzana F, Cuesta I, Freire F, Revuelta J, Torrado M, Bastida A, Jiménez-Barbero J, Asensio JL. J. Am. Chem. Soc. 2007;129:2849. doi: 10.1021/ja066348x. [DOI] [PubMed] [Google Scholar]
- 56.Butcher SE, Allain FH, Feigon J. Biochemistry. 2000;39:2174. doi: 10.1021/bi9923454. [DOI] [PubMed] [Google Scholar]
- 57.Reiter NJ, Nikstad LJ, Allmann AM, Johnson RJ, Butcher SE. RNA. 2003;9:533. doi: 10.1261/rna.2199103. [DOI] [PMC free article] [PubMed] [Google Scholar]
- 58.Davis JH, Tonelli M, Scott LG, Jaeger L, Williamson JR, Butcher SE. J. Mol. Biol. 2005;351:371. doi: 10.1016/j.jmb.2005.05.069. [DOI] [PubMed] [Google Scholar]
- 59.Sashital DG, Allmann AM, Van Doren SR, Butcher SE. Biochemistry. 2003;42:1470. doi: 10.1021/bi027137h. [DOI] [PMC free article] [PubMed] [Google Scholar]
- 60.Hansen MR, Hanson P, Pardi A. Methods Enzymol. 2000;317:220. doi: 10.1016/s0076-6879(00)17017-x. [DOI] [PubMed] [Google Scholar]
- 61.Feichtinger K, Sings HL, Baker TJ, Matthews K, Goodman M. J. Org. Chem. 1998;63:8432–8439. [Google Scholar]; Baker TJ, Goodman M. Synthesis. 1999:1423–1426. [Google Scholar]
- 62.Delaglio F, Grzesiek S, Vuister GW, Zhu G, Pfeifer J, Bax A. J. Biomol. NMR. 1995;6:277. doi: 10.1007/BF00197809. [DOI] [PubMed] [Google Scholar]
- 63.Schwieters CD, Kuszewski JJ, Tjandra N, Clore GM. J. Magn. Reson. 2003;160:65. doi: 10.1016/s1090-7807(02)00014-9. [DOI] [PubMed] [Google Scholar]
- 64.Clore GM, Gronenborn AM, Tjandra N. J. Magn. Reson. 1998;131:159. doi: 10.1006/jmre.1997.1345. [DOI] [PubMed] [Google Scholar]
- 65.Brünger AT, Adams PD, Clore GM, DeLano WL, Gros P, Grosse-Kunstleve RW, Jiang J-S, Kuszewski J, Nilges M, Pannu NS, Read RJ, Rice LM, Simonson T, Warren GL. Acta Crystallogr. Sect. D Biol Crystallogr. 1998;54:905. doi: 10.1107/s0907444998003254. [DOI] [PubMed] [Google Scholar]
- 66.Srinivasan J, Trevathan MW, Beroza P, Case DA. Theor. Chem. Acc. 1999;101:426. [Google Scholar]
- 67.Pearlman DA, Case DA, Caldwell JW, Ross WS, Cheatham TE, DeBolt S, Ferguson D, Siebel G, Kollman P. Comput. Phys. Commun. 1995;91:1. [Google Scholar]
- 68.Woods RJ, Dwek RA, Edge CJ, Fraser-Reid DJ. J. Phys. Chem. 1995;99:3832. [Google Scholar]
- 69.Wang J, Cieplak P, Kollman PA. J. Comput. Chem. 2000;21:1049. [Google Scholar]
- 70.Cramer CJ, Truhlar DG. Chem. Rev. 1999;99:2161. doi: 10.1021/cr960149m. [DOI] [PubMed] [Google Scholar]
- 71.Koradi R, Billeter M, Wüthrich K. J. Mol. Graph. 1996;14:51. doi: 10.1016/0263-7855(96)00009-4. [DOI] [PubMed] [Google Scholar]
- 72.Breslauer KJ. Methods Enzymol. 1995;259:221. doi: 10.1016/0076-6879(95)59046-3. [DOI] [PubMed] [Google Scholar]


