

Abstract
Neuroscientists, psychologists, clinicians, and economists have long been interested in how individuals weigh information about potential rewarding and aversive stimuli to make decisions and to regulate their emotions. However, we know relatively little about how appetitive and aversive systems interact in the brain, as most prior studies have investigated only one valence of reinforcement. Previous work has suggested that primate orbitofrontal cortex (OFC) represents information about the reward value of stimuli. We therefore investigated whether OFC also represents information about aversive stimuli, and, if so, whether individual neurons process information about both rewarding and aversive stimuli. Monkeys performed a trace conditioning task in which different novel abstract visual stimuli (conditioned stimuli, CSs) predicted the occurrence of one of three unconditioned stimuli (USs): a large liquid reward, a small liquid reward, or an aversive air-puff. Three lines of evidence suggest that information about rewarding and aversive stimuli converges in individual neurons in OFC. First, OFC neurons often responded to both rewarding and aversive USs, despite their different sensory features. Second, OFC neural responses to CSs often encoded information about both potential rewarding and aversive stimuli, even though these stimuli differed in both valence and sensory modality. Finally, OFC neural responses were correlated with monkeys' behavioral use of information about both rewarding and aversive CS-US associations. These data indicate that processing of appetitive and aversive stimuli converges at the single cell level in OFC, providing a possible substrate for executive and emotional processes that require using information from both appetitive and aversive systems.
Introduction
Organisms must frequently access information about both potential rewarding and aversive stimuli to guide their decision-making, emotional responses, and actions. Most studies have investigated how only one valence of association is processed, leaving unclear whether and where information about appetitive and aversive stimuli converges in the brain. We hypothesized that this convergence might occur at the level of single cells in the orbitofrontal cortex (OFC).
The OFC is a brain area involved in emotional regulation and adaptive decision-making (Izquierdo et al., 2004; Murray and Izquierdo, 2007; O'Doherty, 2007; Wallis, 2007)—processes requiring the merging of information about rewarding and aversive stimuli. It has extensive bidirectional connections with limbic areas such as the amygdala (Carmichael and Price, 1995; Ghashghaei and Barbas, 2002; Ongür et al., 2003; Barbas, 2007; Ghashghaei et al., 2007), it plays a role in regulating affective responses to stimuli (Baxter et al., 2000; Izquierdo et al., 2005; Kalin et al., 2007; Machado and Bachevalier, 2007), and its neurons respond to rewards and reward-predicting cues (Thorpe et al., 1983; Schoenbaum et al., 1998; Tremblay and Schultz, 1999, 2000; Wallis and Miller, 2003; Roesch and Olson, 2004; Padoa-Schioppa and Assad, 2006; Kennerley et al., 2009). Most prior electrophysiological studies of OFC in primates have focused on cues associated with reward, and have demonstrated that OFC neurons respond differentially to conditioned stimuli (CSs) associated with different sizes or flavors of reward (Wallis and Miller, 2003; Padoa-Schioppa and Assad, 2006, 2008). A few studies have suggested that primate OFC may encode aversive as well as appetitive associations (Thorpe et al., 1983; Hosokawa et al., 2007); however, these experiments used operant tasks in which aversive stimuli could be avoided after learning. Because avoiding an aversive stimulus can itself be a rewarding experience and activate reward pathways in the brain (Seymour et al., 2005; Kim et al., 2006), we chose to characterize neural activity in relation to aversive events by using a paradigm in which negative reinforcement was unavoidable.
To test the hypothesis that single OFC neurons process information provided by both appetitive and aversive systems, we used a version of classical (Pavlovian) conditioning (Pavlov, 1927) in which abstract visual CSs were paired with rewarding and aversive unconditioned stimuli (USs): liquid rewards and aversive air-puffs, respectively. By using classical conditioning procedures, we ensured that positive and negative reinforcement would follow CS presentation with a consistent probability. In this way, we uncovered several lines of evidence that individual neurons in OFC, in concert with behavior, indeed combine information about positive and negative reinforcements. First, we found that many OFC neurons respond to two types of primary reinforcement—liquid rewards and aversive air-puffs—despite their differing valences and sensory properties. Second, OFC neurons often encode information about CSs that predict reward, including different levels of reward, as well as CSs that predict aversive reinforcement. Finally, we found that OFC neural responses closely track monkeys' behavioral responses as they use information about rewarding and aversive events to assess positive and negative cues during learning.
Materials and Methods
General methods
During experiments, monkeys sat in a Plexiglas primate chair (Crist Instruments) with their eyes 57 cm in front of a 21 inch Sony CRT monitor. Monkeys were under constant visual observation by the experimenter by way of an infrared video camera feed. Our general methods for experimental control and electrophysiological recording in rhesus monkeys have been described previously (Paton et al., 2006; Belova et al., 2007, 2008). All animal procedures conformed to National Institutes of Health guidelines and were approved by the Institutional Animal Care and Use Committees at New York State Psychiatric Institute and Columbia University.
Behavioral task
We used a trace conditioning procedure to induce learning about the associations with reinforcement of three novel abstract images (fractal patterns) in every experiment. A schematic diagram of the task is provided in Figure 1a. In each trial, monkeys foveated a central fixation point for 1 s, and then, while maintaining fixation, viewed an image for 300 ms (monkey R) or 350 ms (monkey L). During periods of fixation, we required the monkey to maintain its gaze within 3.5 degrees of the fixation spot, as measured with an infrared eye tracker (ASL, Applied Science Laboratories) that captured pupil images at 240 Hz. Images typically occupied an 8 degree square centered over the fovea. After image viewing, there was a 1.5 s delay (the trace interval), during which we no longer required fixation. Following the trace interval, we delivered, with 80% probability, a large liquid reward after the strong positive image, a smaller liquid reward after the weak positive image (1.0/1.8 ml of water for large reward, 0.6/0.8 ml for small reward, for monkeys L/R respectively), or a 100 ms 40–60 psi air-puff directed at the monkey's face after the negative image. Air-puffs, when they occurred, were directed at one of two possible locations on the monkey's face, chosen randomly on every trial. This randomization was used to minimize habituation to the US.
Figure 1.
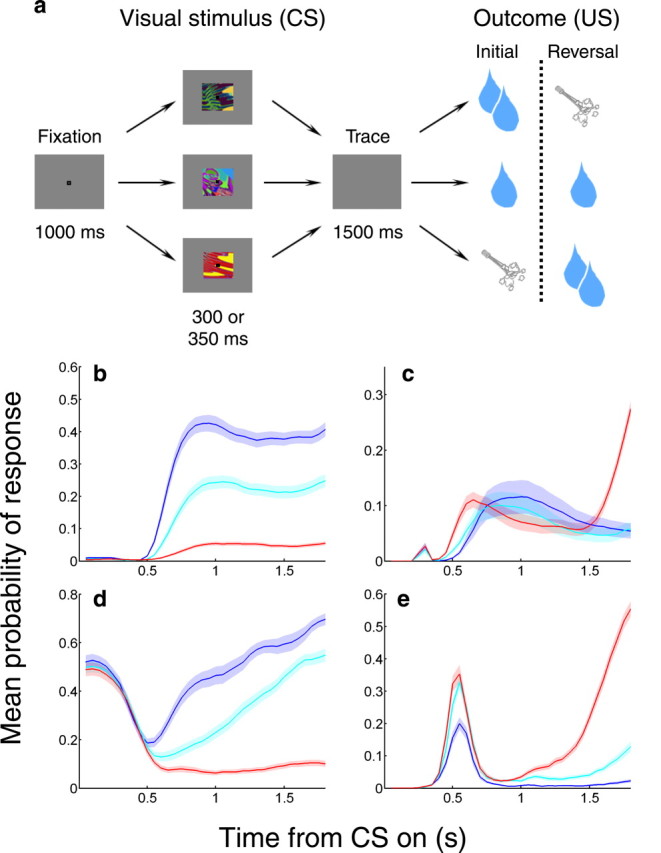
Task and behavior. a, Trace conditioning task. Top and bottom rows, Images reverse associations with large rewards and air-puffs. Middle row, Image is always associated with small reward. b–e, Mean probability of licking (b, d) or blinking (c, e) for monkey L (b, c) and monkey R (d, e) as a function of time during the trial, averaged over all sessions for each subject. Blue, Probability of behavior during large reward trials; cyan, small reward trials; red, air-puff trials. Shaded areas, SEM.
All three trial types were presented in pseudo-random order, separated by a 3 s intertrial interval. We waited for a variable number of trials after monkeys learned the initial reinforcement contingencies (learning usually took fewer than 5 trials of each condition); then, without warning, we reversed the images paired with large reward and air-puff. There was only one reversal per session, which generally occurred after 30–60 presentations of each stimulus. Upon reversal, the image initially associated with large reward now preceded air-puff delivery, and the image initially associated with air-puff now preceded a large reward. The image associated with small reward kept the same reinforcement contingencies. We assessed monkeys' learning by monitoring licking and blinking on-line during the experiment (see data collection section).
Data collection
Behavioral measures.
We assessed monkeys' anticipatory licking and blinking to determine whether they had learned the associations between visual stimuli and rewards and air-puffs, as we described previously (Paton et al., 2006). As we have previously observed, anticipatory licking was generally higher following images paired with reward, and anticipatory blinking was generally higher following images paired with air-puff. To measure licking, we placed the reward delivery tube ∼1 cm away from the monkey's mouth. Every millisecond, we measured whether the monkey's tongue interrupted an infrared beam passing between the monkey's mouth and the reward delivery tube. We measured anticipatory blinking using our infrared eye tracker. The eye tracker transiently loses its signal when the eye closes, and outputs a characteristic voltage, which we stored and analyzed off-line. The loss of the eye position signal corresponded to eye closures as visualized from the infrared camera that monitored the monkey during the experiment. For the purposes of some analyses, we scored each trial according to whether the monkey licked and/or closed its eyes in the 500 ms preceding reinforcement, as we have done previously (Paton et al., 2006).
Electrophysiological recordings.
We recorded neural activity from 217 neurons in the right OFC of two rhesus monkeys (Macaca mulatta): 141 cells from a 6 kg female (monkey L) and 76 cells from a 13 kg male (monkey R). We positioned the recording chamber over area 13 of OFC based on anatomical information acquired using MRI (see below). In each recording session, we individually advanced four conventional tungsten microelectrodes with a maximum diameter of 125 μm (impedance: ∼2 MΩ; FHC Instruments) into OFC through dura-puncturing guide tubes using a motorized multielectrode drive (NAN). Guide tubes were supported within a Cilux grid with holes spaced 1.3 mm apart. We used the Plexon system for signal amplification, filtering, digitizing of spike waveforms, and spike sorting using a principal component analysis platform (on-line with off-line verification). We included all well isolated neurons in this study; monkeys either performed a fixation task or no task during the search for well isolated neurons.
Reconstruction of recording sites.
The localization of area 13 of OFC in each monkey was performed using magnetic resonance imaging (MRI). Each monkey was anesthetized with isoflurane, intubated and imaged in a 1.5 tesla research magnet in the Columbia University Department of Radiology. These images were used to guide placement of recording chambers. One to 2 weeks after the placement of a recording chamber, we returned to the MRI scanner to image with an electrode inserted in one of the grid-holes and directed toward OFC. These images were used to reconstruct recording sites. The neuronal sample was taken from overlapping regions of OFC in the two monkeys. Based on comparison of MR images with a monkey brain atlas (Paxinos et al., 2000), we tentatively assign our recording sites primarily to areas 13m and 13a; for a small number of neurons, recording sites may have extended to area 14o (using the subdivision classification of OFC by Ongür and Price, 2000).
Data analysis
Construction of behavior curves.
To construct licking and blinking probability curves (Fig. 1b–e), we divided the trial into nonoverlapping time bins of 50 ms. Within each bin, we calculated the amount of time spent licking or blinking and divided by the bin size. To obtain the licking or blinking curve for a session, we averaged each bin across all trials. To obtain the population licking and blinking curves, we averaged the curves across all sessions for each subject.
Identification of neural responses to conditioned stimuli.
Most analyses were performed on spike data from two time intervals during the trial: the CS interval (90–440 ms after image onset for monkey L; 90–390 ms after image onset for monkey R) and the trace interval (90–1500 ms after the image turned off). These time intervals were chosen based on an analysis of response latencies, described below.
To define a time epoch during which cells responded to visual stimuli, we conducted an analysis of visual response latency for every cell. We compared activity from the 500 ms time interval preceding image onset to activity from the first 500 ms following image onset. First, for the activity preceding image onset, we constructed a histogram of the number of spikes occurring in 20 ms bins shifted by 1 ms across the time interval. Next, we evaluated neural activity from the time interval following image presentation. We determined whether each 20 ms bin, slid in 1 ms steps, had a response that met the criterion: i.e., a firing rate that exceeded 99% of the bins in the histogram of activity before CS onset (for increases in firing rate) or was <95% of the bins (for decreases in firing rate). We defined response latency as occurring at the beginning of the first of 20 consecutive overlapping bins (39 ms of time) that met a criterion response. After performing this analysis of visual response latency on all 217 OFC cells, we selected 90 ms after image onset as the beginning of the CS interval because >90% of the latencies were >90 ms. The end of the CS interval was similarly defined as 90 ms after image disappearance. The trace interval was defined as beginning at the end of the CS interval and ending at reinforcement presentation.
Classification of cells as value-coding.
To determine the degree to which neural responses are modulated by association with reinforcement, or by sensory characteristics of the image itself, we performed a two-way ANOVA with image value and image identity as main factors. The ANOVA was performed separately on spike counts from the CS and trace intervals for each cell, as cells could encode image value at different times during the trial. If there was a significant effect of image value in either or both intervals (p < 0.01), the cell was classified as value-coding. We found a few cells (n = 4) that had opposite image value preferences in the CS and trace intervals, and these were excluded from further analysis. Neurons in OFC that were categorized as “non-value-coding” exhibited a variety of responses to conditioned stimuli; these included neural responses that were similar for all three conditioned images, as well as responses that were strongest (or weakest) for the stimulus associated with a weak reward. In addition, a substantial proportion of OFC neurons, both value-coding and non-value-coding, showed a significant main effect of image identity in the ANOVA, or an interaction effect of image value and image identity (p < 0.01).
Lick- and blink-triggered spike histograms.
We searched for potential activity related to licks or blinks by constructing, for each cell and for the population, peri-event spike histograms centered on licks or blinks. The lick-triggered histograms were constructed separately for licks occurring in two different time intervals: the last 1 s of the trace interval, and the last 1 s of the intertrial interval (before fixation point onset). The blink-triggered histograms were constructed separately for blinks occurring in two different time intervals: the last 1 s of the trace interval, and the first 1 s of the US interval (just after reinforcement onset, or in the case of omitted reinforcements, just after reinforcement would have occurred). We did not examine blinks during the intertrial interval because there were generally too few of them to analyze. For each of the above-mentioned time intervals, we constructed histograms for the 500 ms before and after licks and blinks. To create population versions of the histograms (see Fig. 4), we normalized each individual histogram by dividing by its median firing rate and then averaged across all individual cells in a group.
Figure 4.

Population neural activity in OFC is not related to motor responses. a, b, Population lick-triggered PSTH for positive value-coding cells, centered on licks in the trace interval (a) or intertrial interval (b). Note that the response profiles for the two intervals do not resemble each other. c, d, Population lick-triggered PSTH for negative value-coding cells, centered on licks in the trace interval (c) or intertrial interval (d). Note that the response profiles in both intervals are similar to those for positive value-coding cells, suggesting that the relationship between spiking and licking does not explain the valence of encoding. e, f, Population blink-triggered PSTH for positive value-coding cells, centered on blinks in the trace interval (e) or US interval (f). Note that the response profiles for the two intervals do not resemble each other. g, h, Population blink-triggered PSTH for negative value-coding cells, centered on blinks in the trace interval (g) or US interval (h). Note that the response profiles in both intervals are similar to those for positive value-coding cells. The apparent peak in f and h may be related to air-puff, which often occurs just before blinks during this time interval.
To identify the onsets of candidate lick or blink responses, we applied the same response latency analysis described above. In this case, we compared neural activity in 20 ms bins during the 300 ms preceding licks or blinks to the activity in the interval 300–600 ms before the behavior. The criterion for a response was the same as above, except that the first of 40 consecutive overlapping bins, of which 90% exceeded threshold, was defined as the onset of a response (see Fig. 5a,b). Because this analysis rarely identified responses in both time intervals for a given motor response, we also used a version of the analysis with less stringent criteria—20 overlapping bins, 80% exceeding threshold—to analyze the onset of a wider group of potential responses to licking and blinking (see Fig. 5c,d).
Figure 5.

OFC cells do not exhibit motor responses related to licking or blinking. We identified the onset of a change in neural activity (if present) during the 300 ms preceding a lick or blink. Licks were examined in two time intervals: the last 1 s of the trace interval and the last 1 s of the intertrial interval (ITI). Blinks were examined in two time intervals: the last 1 s of the trace interval, and the first 1 s of the US interval. a, b, Percentage of value-coding cells for which responses before licks (a) or blinks (b) are found in both intervals examined, one interval but not the other, or neither interval. c, d, We used a high-sensitivity version of the same analysis as in a, b to obtain a broader population of cells with candidate motor responses. For each cell that had an identified response in both intervals examined, we plotted the time of response onset in the trace interval against the time of response onset in the intertrial interval (licks, c) or US interval (blinks, d). Blue, Positive value-coding cells; red, negative value-coding cells.
Characterization of responses to reinforcement.
To identify cells with increases or decreases in firing in response to rewards and/or air-puffs (see Fig. 7), we compared firing rates in the 500 ms window before reinforcement with firing rates in two windows: the first 400 ms or the 400–800 ms following large reward or air-puff (Wilcoxon, p < 0.05). If a significant change was found in either or both of the two windows, the cell was categorized as having a firing rate increase or decrease in response to reward or air-puff. In the few cases in which significant changes in opposite directions were found in the two windows, the interval with the smaller average change in firing rate was discarded. It was necessary to use dual windows to fully capture reinforcement responses for two reasons: (1) some cells displayed biphasic responses with an early excitation followed by a later period of inhibition, or vice versa and (2) the duration of the large reward was quite long (1200–2000 ms, varying by monkey and session), and some cells changed activity after reward delivery with a correspondingly longer latency.
Figure 7.

Single neurons in OFC have a variety of reinforcement response profiles. a, Summary of reinforcement responses in positive value-coding OFC cells. “Incr.,” “decr.,” “None” refer to cells' responses to air-puff. Blue, Cells with excitatory responses to large reward; red, inhibitory responses to large reward; black, no response to large reward. b, Summary of reinforcement responses in negative value-coding cells. “Incr.,” “decr.,” “none” refer to cells' responses to large reward. Blue, Cells with excitatory responses to air-puff. Red, Inhibitory responses to air-puff. Black, No response to air-puff. c, Summary of reinforcement responses in non-value-coding cells. “Incr.,” “decr.,” “none” refer to cells' responses to large reward. Blue, Cells with excitatory responses to air-puff; red, inhibitory responses to air-puff; black, no response to air-puff.
After screening cells for responses to rewards and air-puffs using the analysis described above, we quantified the onset latency of these responses (see data shown in Fig. 6e,f) by comparing activity from the last 500 ms of the trace interval (“baseline”) to activity in the first 800 ms following the start of reinforcement. We then used the same latency analysis described above for visual responses (see Identification of neural responses to conditioned stimuli) to determine when the response to reinforcement increased or decreased compared with baseline. Some responses to air-puff occurred with a very short latency (<50 ms), whereas most air-puff responses, and the great majority of reward responses, occurred with latencies of 90–300 ms. The number of latencies (see Fig. 6e,f) is slightly smaller than the number of reward and air-puff responses (see Fig. 7) because the algorithm described above could not identify a latency in a small number of cases (e.g., when a response ramped up very slowly).
Figure 6.
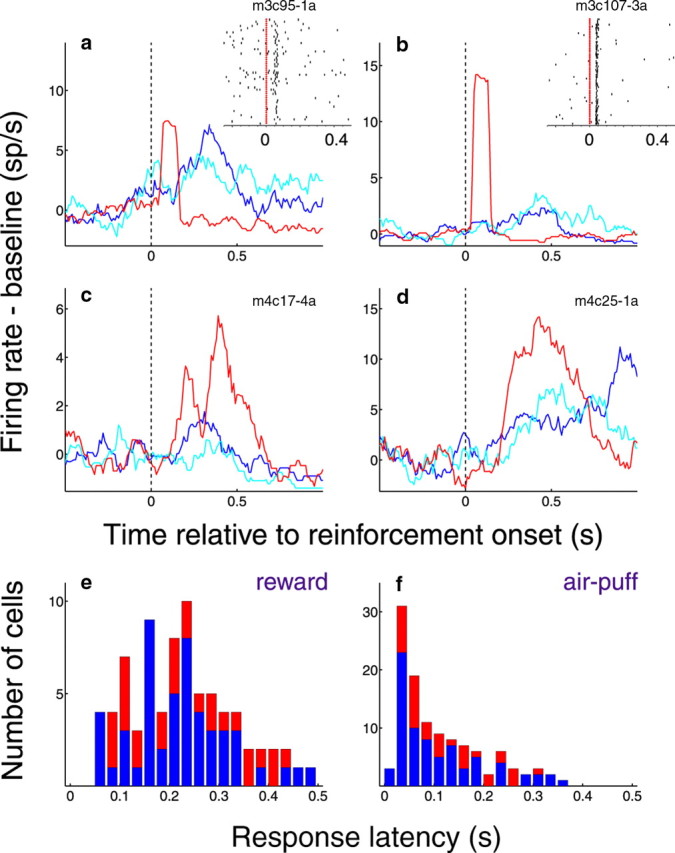
Many positive and negative value-coding cells respond to both rewards and air-puffs. a–d, Peristimulus histograms of neural activity aligned on reward or air-puff onset. Activity is normalized by subtracting from the firing rate the average of the preceding 500 ms of trace interval activity, and smoothed with a 100 ms moving average. Vertical dashed line, Time of reinforcement onset. Blue line, Activity in response to large reward; cyan line, activity in response to small reward; red line, activity in response to air-puff. a, b, Positive value-coding cells with excitatory responses to rewards and air-puff. Insets, Raster plots centered on air-puff presentation (red ticks). Each row of dots represents action potentials on one trial. c, d, Negative value-coding cells with excitatory responses to rewards and air-puffs, except to small reward in c. e, f, Distribution of latencies to respond to reward (e) or air-puff (f) in all cells for which such responses were identified. Latencies were not significantly different among positive, negative, and non-value-coding cells (pairwise Wilcoxons, p > 0.05), and were therefore combined. Blue, Increases in firing; red, decreases in firing.
ROC analyses.
We used an ROC analysis adapted from signal detection theory (Green and Swets, 1966) for three analyses. First, we used an ROC analysis to construct two discrimination indices for CS responses. The positive/weak-positive discrimination index represents a comparison between neural responses on strong positive trials and weak positive trials. We take the area under the ROC curve as an index of whether activity on strong positive trials is higher (area >0.5) or lower (area <0.5) than activity on weak positive trials. Similarly, the weak-positive/negative discrimination index represents a comparison between neural responses on weak positive and negative trials. When activity on weak positive trials is higher, the weak-positive/negative discrimination index is >0.5; when activity on weak positive trials is lower, the index will be <0.5. For each value-coding cell, we calculated these indices based on the interval (CS or trace) that had the greatest response difference between strong positive trials and negative trials. Statistical significance was established using a permutation test in which data were reshuffled 1000 times (criterion was p < 0.05). When the two indices were plotted against each other (as seen in Fig. 8a) the proportion of cells with significant indices in each quadrant was not different for the two subjects (χ2 test, p > 0.05). Moreover, the distributions of weak-positive/negative discrimination indices (for positive value-coding cells) and positive/weak-positive discrimination indices (for negative value-coding cells) were not different for the two subjects (Wilcoxon, p > 0.05 in each case). Therefore, we combined the data from the two monkeys for the analyses shown in Figure 8.
Figure 8.

OFC neurons process information about rewarding and aversive stimuli. a, Positive/weak-positive discrimination index, comparing activity on small and large reward trials, plotted against weak-positive/negative discrimination index, comparing activity on small reward and air-puff trials, for each value-coding cell. Green symbols, Positive cells; red symbols, negative cells. See above for key to symbols. Data points are nonrandomly distributed (χ2 test, p < 0.0001) for each monkey. b, Weak-positive/negative discrimination indices for all positive value-coding neurons. c, Positive/weak-positive discrimination indices for all negative value-coding neurons. In b and c: blue, significant discrimination index (p < 0.05, permutation test); red, nonsignificant discrimination index. Arrowheads, Mean of each distribution. d, e, Population average PSTH for all positive (d) and negative (e) value-coding neurons. Blue line, Large reward trials; cyan line, small reward trials; red line, air-puff trials. Vertical dotted line indicates image onset.
Second, we used an ROC analysis to identify negative value-coding cells that had “ramp-up” responses in anticipation of air-puff (Fig. 9). To do so, we compared activity in the last 500 ms of the trace interval to activity in the prior 500 ms (from 1000 to 500 ms before the end of the trace interval). Cells that had significantly higher activity in the last 500 ms of the trace interval compared with the previous 500 ms time window were identified as “ramping” cells (p < 0.05, permutation test).
Figure 9.

A subpopulation of OFC neural responses anticipate air-puff delivery. Population PSTH for negative OFC cells that increase their firing in anticipation of air-puff delivery (“ramp-up” activity) (n = 10, 22% of negative cells). Note that these cells on average also respond to air-puff but not to “no reward,” and the cells demonstrate differential responses to CSs associated with small and large rewards (see Results).
Third, we used an ROC analysis to construct two expectation indices for each value-coding cell. For each session, we sorted out two types of trials: trials with correct or incorrect behavioral expectation. For positive trials, correct expectation trials were trials in which the monkey licked, but did not blink, in the 500 ms before reward onset; incorrect expectation trials were trials in which the monkey blinked, but did not lick. For negative trials, correct expectation trials were trials in which the monkey blinked, but did not lick, in the 500 ms before air-puff onset; incorrect expectation trials were trials in which the monkey licked, but did not blink. For each cell, we calculated two expectation indices by comparing neural activity on “correct expectation” and “incorrect expectation” trials for each cell's preferred trial type (strong positive trials for positive cells, negative trials for negative cells) and nonpreferred trial type. Index values >0.5 indicated higher neural activity on correct expectation trials. All value-coding cells with an adequate number of incorrect expectation trials (3 or more) were included in the analysis. Again, statistical significance was established using a permutation test. The distributions of expectation indices were not different for the two subjects (Wilcoxon, p > 0.05 in each case); therefore we combined data from the two monkeys for the analyses shown in Figure 10c–f.
Figure 10.

Behavioral and neural responses to CSs reflect the incorporation of information about reward and aversive stimuli. a, Proportion of time spent licking (blue) or blinking (red) during the last 1.0 s of the trace interval on the first three trials of a daily session (left data points) and the last 20 trials of the initial learning block, before image value reversal (right data points). Error bars, SEM. Double asterisks, Significant difference between initial and subsequent trials (Wilcoxon, p < 0.001). b, Average normalized neural activity (Z-scores) on the first three trials of an experiment and the last 20 trials of the initial block. Error bars, SEM. Asterisk or double asterisk, significant difference between initial and subsequent trials (Wilcoxon, p < 0.05 or p < 0.001). Dagger, p = 0.09. c, d, Expectation indices for each neuron's preferred (c) and nonpreferred (d) trial type. Blue, Index significantly different from 0.5 (p < 0.05). Red, Index not significantly different from 0.5. Arrowhead indicates mean. e, f, Average neural activity as a function of time during the trial. Vertical dotted line indicates time of image onset.
Population-level peristimulus time histograms.
All population peristimulus time histograms (PSTHs) were constructed by first building individual PSTHs with 10 ms nonoverlapping bins. Within each bin, we normalized the firing rate by subtracting the mean and dividing by the SD of baseline activity. The baseline interval was defined as the 1000 ms before fixation point onset. We then averaged neural responses across experiments, and smoothed each histogram using a 100 ms moving average.
Comparison of initial trials and subsequent trials.
To compare neural and behavioral responses during and after the earliest trials of each session (see Fig. 10a,b), we chose to examine the first three trials of each image presentation and the last 20 trials of each image presentation in the initial block. Monkeys generally learned the reinforcement contingencies very quickly, so we used a small number of initial trials to capture prelearning behavior and neural activity. We analyzed neural activity for each cell in either the CS or trace interval, depending on which had the stronger CS-value-modulated signal. All value-coding cells (n = 86) were included. For each cell, we normalized neural activity by subtracting the mean and dividing by the SD of baseline activity (from the 1000 ms before CS onset), and then we obtained a population average for the initial trials and for the subsequent trials. Similarly, for each session, on each trial, we computed the proportion of time in which the monkey licked or blinked during the last 1 s of the trace interval. We then averaged the proportion of time spent either licking or blinking during the initial 3 trials and during the last 20 trials of the initial block over all sessions.
Results
Behavioral and neural responses during trace conditioning
We recorded from 217 OFC neurons in two monkeys while they performed the trace conditioning task shown in Figure 1a (Pavlov, 1927; Paton et al., 2006; Salzman et al., 2007). In each experiment, three novel CSs were paired with three different USs: either a large liquid reward, a small liquid reward, or an aversive air-puff to the face. We operationally define these CSs as having a strong positive, weak positive, or negative value, respectively, based on whether monkeys generally showed approach or defensive behaviors in reaction to the CSs. Monkeys quickly learned to associate each specific CS with a US, as we determined by monitoring two behavioral responses: licking at a spout in expectation of a reward (an approach behavior), and anticipatory eye closure (a defensive behavior, which we hereafter refer to as “blinking”) in expectation of an air-puff. On the whole, monkeys' licking behavior discriminated among all three outcomes (Fig. 1b,d), while blinking reliably discriminated between the two outcome valences (rewarded or associated with aversive stimuli) (Fig. 1c,e; p < 0.001 for all comparisons, Wilcoxon). After the original associations were learned, without warning we reversed the reinforcement contingencies for the strong positive and the negative images, and monkeys learned the new associations.
While monkeys performed this task, we recorded the activity of OFC neurons, targeting areas 13m and 13a (see Materials and Methods) (Ongür and Price, 2000; Paxinos et al., 2000). To separate the contribution to OFC neural activity of the CS's sensory characteristics and the CS's associated outcome, we examined activity before and after the reversal of reinforcement contingencies. We found that the associated reinforcement outcome had a significant effect on firing rate in a large fraction of individual OFC neurons (86/217; monkey L: 50, monkey R: 36), as determined by a two-way ANOVA with the associated outcome and the identity of the CS as main factors (p < 0.01 for outcome factor). We refer to these cells as “value-coding” because they responded differently to the same image when it was associated with reward versus air-puff. Note that the current experiment cannot disambiguate the value of the CS itself and the value of the expected outcome associated with the CS; we use the term “value” to denote either or both of these quantities. Many OFC neurons, both value-coding and non-value-coding, also showed a main effect of image identity in the CS and/or trace intervals, and were therefore classified as image-selective (p < 0.01; n = 53, 31 of which were also value-coding). This is consistent with previous reports of image selectivity in OFC neural responses (Wallis and Miller, 2003). The two-way ANOVA also revealed a significant interaction effect of image value and image identity for a large fraction of OFC neurons (n = 66), although the majority of these also showed a main effect of image value (39/66).
An example of an OFC neuron that responds differentially to CSs associated with rewarding and aversive stimuli is displayed in Figure 2a, in which the neuron's activity has been aligned on the presentation of the CS. The subject's licking behavior during the same experiment is shown in Figure 2b. This cell responded most strongly to an image when it was associated with large reward, and less strongly when the same image was associated with air-puff. In response to the weak positive image, associated with small reward, the neuron had an intermediate level of activity. Note that the subject's licking behavior in response to the weak positive image was also intermediate, compared with licking in response to the strong positive or negative image. A similar pattern can be seen in each of the other three examples shown in Figure 2c–h.
Figure 2.

OFC neurons and anticipatory licking differentiate among CSs. a, c, e, g, PSTHs for activity from four value-coding OFC neurons. PSTHs represent the average activity across trials. Blue, Average activity during large reward trials; cyan, average activity during small reward trials; red, average activity during air-puff trials. Vertical dotted lines indicate the time of image onset and offset. b, d, f, h, Mean probability of licking as a function of time during the trial, concurrent with recording of activity depicted in a, c, e, and g, respectively. Shading, SEM.
The neuron shown in Figure 2a had a strong response to the image, modulated by the image's associated reinforcement, in a time epoch restricted to the end of the CS interval and the beginning of the trace interval. Other cells had reinforcement-modulated activity that was sustained throughout the trace interval (as in Fig. 2c) or that emerged later in the trace interval (as in Fig. 2g). Based on the two-way ANOVA described above, we found that 16 cells encoded value during the CS interval, 51 during the trace interval, and 19 during both. For each OFC neuron with activity that significantly reflected CS value (ANOVA, p < 0.01), we identified the “preference” of the cell: did it respond more, on average, to an image when it was paired with large reward or with air-puff? On this basis, the cell shown in Figure 2a, which responded most strongly to an image when it was paired with reward, was categorized as a positive value-coding cell; a neuron that responded more strongly to an image when it was associated with air-puff—such as the cell whose activity is shown in Figure 2e—was categorized as a negative value-coding cell. Overall, we found a similar number of positive (41/86) and negative (45/86) value-coding neurons in OFC. Neurons with these different coding properties appear to be anatomically intermingled within area 13 (Fig. 3).
Figure 3.

Magnetic resonance images and reconstruction of recording sites. a, Coronal MRI using a 2D inversion recovery (IR) sequence in monkey L, showing the artifact from an electrode inserted dorsal to OFC. This slice is slightly anterior to areas from which we recorded (e.g., 4 mm from the slice shown in b). b, Coronal MRI from monkey L highlighting a typical area from which we recorded. This slice is located ∼30 mm from the interaural plane. c–f, Magnified images of the OFC in four consecutive slices (1 mm apart) from the MRI shown in b (c being the farthest posterior, f the farthest anterior). Symbols indicate properties of cells found at recording sites (see key above). g, Coronal MRI using a 2D IR sequence in monkey R, showing the artifact from an electrode inserted dorsal to OFC. This slice is slightly anterior to areas from which we recorded (e.g., 3 mm from the slice shown in h). h, Coronal MRI from monkey R highlighting a typical area from which we recorded. This slice is located ∼28 mm from the interaural plane. i–k, Magnified images of the OFC in three consecutive slices (1 mm apart) from the MRI shown in h (i being the farthest posterior, k the farthest anterior). Symbols are as in c–f.
OFC neural responses cannot be explained by motor-related activity
We next sought to determine whether activity that varied depending upon reinforcement contingencies was related to motor responses (licking or blinking). To accomplish this, for each value-coding cell, we constructed lick- and blink-triggered spike histograms for activity in two time intervals: for licks, the last 1 s of the trace interval and the last 1 s of the intertrial interval; and for blinks, the last 1 s of the trace interval and the first 1 s of the US interval. (There were too few blinks that occurred during the intertrial interval to serve as a basis for comparison.) We found that, overall, OFC neurons do not exhibit a consistent neural response in both intervals examined around the time of a lick or blink, as demonstrated by population-level lick- and blink-triggered spike histograms for positive and negative value-coding cells (Fig. 4). In all cases—licks and blinks, positive and negative value-coding cells—the response profiles found in the two intervals did not resemble each other, demonstrating a lack of consistent neural responses to the motor actions. Moreover, the response profiles for licking and blinking in both intervals were markedly similar for positive and negative value-coding cells. Therefore, it is highly unlikely that excitatory responses to licking (or inhibitory responses to blinking) could account for the elevated responses of positive value-coding cells to rewarding CSs and USs. Similarly, it is unlikely that excitatory responses to blinking (or inhibitory responses to licking) could account for the responses of negative value-coding cells.
To address this issue more quantitatively on a cell-by-cell basis, we used an analysis of response latency (see Materials and Methods) to identify candidate neural responses related to licks or blinks in the 300 ms preceding each motor act (Fig. 5). We examined candidate responses in the same pairs of time intervals described above. For the great majority of neurons, this analysis failed to identify a response in both intervals examined (78% of cells for licks; 89% of cells for blinks), again indicating that there was no consistent neural response related to the behavior (Fig. 5a,b). To cast a wider net for possible lick- or blink-related responses, we then applied the same analysis using less stringent criteria, leading to more cells for which responses were identified in both intervals. For each of these cells, we compared the onset times of the candidate motor responses in the two intervals examined (Fig. 5c,d); if a true motor response were present, one would expect responses to occur at similar times relative to the behavior in both intervals. On the contrary, in both cases (licking and blinking), the times of response onset were not correlated (licks, r = 0.11, p = 0.46; blinks, r = 0.03, p = 0.85). We repeated the above-mentioned analyses on non-value-coding cells, and found that they also showed no consistent responses related to links or blinks (data not shown).
Finally, in all cell populations examined, we observed virtually no candidate responses that fit the classical profile of a motor response. A canonical motor response is generally phasic and time-locked to just before or after a motor action; for example, just such motor responses to licking have been described in the posterior putamen (Apicella et al., 1991), but these bear little resemblance to the candidate responses identified by the analyses described above. Overall, we found no evidence that OFC neurons simply encode motor responses or stimulus-motor associations.
Single neurons combine information about reward and aversive stimuli
Responses to primary reinforcers
Consistent with the notion that OFC neurons receive information about both appetitive and aversive stimuli, neural responses were frequently modulated by the presentation of liquid rewards and aversive air-puffs. We found that many individual positive and negative value-coding OFC neurons respond to both reward and air-puff (23/41 positive cells; 15/45 negative cells; Wilcoxon, p < 0.05). In Figure 6, the wide variety of responses to primary reinforcers is exemplified by two positive value-coding cells (Fig. 6a,b) and two negative value-coding cells (Fig. 6c,d). Reinforcement responses had a wide range of latencies and durations; the distributions of response latencies are shown in Figure 6, e and f, respectively. Overall, neural responses to air-puff tended to occur with shorter latencies than responses to reward (Wilcoxon, p < 0.05). In fact, some OFC neurons' responses to air-puff were very fast and time-locked to the US (Fig. 6a,b, e.g., see inset raster plots). These rapid responses could be due to the auditory component of the air-puff, as the OFC receives both direct and indirect input from the belt and parabelt regions of the auditory cortex (Hackett et al., 1999; Romanski et al., 1999; Cavada et al., 2000)—areas which are known to respond with extremely short latencies to auditory stimuli (Recanzone et al., 2000; Lakatos et al., 2005).
As in the examples shown in Figure 6a–d, many positive value-coding cells in OFC have robust responses to air-puff, and many negative value-coding cells respond to reward. To quantify this trend, we classified cells according to whether their firing significantly increased or decreased during the 800 ms following reward or air-puff, compared with the 500 ms before reinforcement (Wilcoxon, p < 0.05). This confirmed that a large fraction of positive value-coding cells exhibit neural responses to air-puff, and a large fraction of negative value-coding cells have reward responses (Fig. 7a,b). Meanwhile, non-value-coding neurons in OFC (n = 131) also showed a variety of reinforcement response profiles; however, failure to respond to either US was more common in these cells than in value-coding cells (χ2 test, p < 0.05). These data imply that many individual neurons in OFC, particularly those that encode CS value, receive information about reinforcing stimuli with a different affective valence, and even a different modality, from the preferred CS and US.
Responses to conditioned stimuli
Next, we investigated whether OFC neurons' responses to CSs, as well as their responses to primary reinforcers, reflect processing of information about different levels of reward and aversive air-puff. We used an ROC analysis to construct two indices for each value-coding cell (see Materials and Methods). The “positive/weak-positive discrimination index” compared neural activity in response to the strong positive and weak positive images, while the “weak-positive/negative discrimination index” compared responses to the weak positive and negative images. When these indices are plotted against each other (Fig. 8a), the great majority of positive value-coding cells fall into the top right quadrant, indicating that responses to the CS predicting small reward are intermediate compared with responses to the CSs predicting large reward or air-puff. Similarly, the great majority of negative value-coding cells fall into the bottom left quadrant (nonrandom distribution by χ2 test, p < 0.0001), indicating that responses to the CS associated with small rewards are again intermediate to the other two.
In addition, we found that many individual positive value-coding cells had a significant weak-positive/negative discrimination index (21/41, 13 from monkey L and 8 from monkey R) (Fig. 8b) and many individual negative value-coding cells had a significant positive/weak-positive discrimination index (21/45; 11 from monkey L and 10 from monkey R) (Fig. 8c). These data imply, for example, that OFC neurons that respond most strongly to CSs predicting an aversive air puff are nevertheless likely to differentiate between CSs associated with different gradations of reward. Finally, a differential response to CSs across both valences is prominent in the overall activity of both the positive (Fig. 8d) and negative (Fig. 8e) value-coding cell populations. Taking into account population activity over the whole trial (CS and trace intervals), the level of neural responding is different among all three trial types (Wilcoxon, p < 0.001 in each case) for both positive and negative value-coding neurons; this statistically significant effect is also true for each subject considered individually (Wilcoxon, p < 0.001). Thus, positive and negative affective information about the subject's environment are reflected in the responses of single neurons in OFC.
We considered the possibility that OFC neurons' differential responses to CSs associated with small reward and CSs associated with air-puff are actually due to the different levels of reward—small reward or no reward, respectively—that are paired with these images. One reason this possibility might be deemed unlikely can be seen by examining a subset of negative value-coding cells with an activity profile that “ramps up” in anticipation of air-puff presentation (Fig. 9; n = 10, 4 from monkey L and 6 from monkey R). This ramping activity does not appear to anticipate “no reward,” rather than air-puff, because these cells tend to have a robust response to the air-puff itself, but little or no response when the air-puff does not occur on 20% of trials (Fig. 9). Indeed, to our knowledge, there are no prior reports of ramping activity in OFC that increases in anticipation of the absence of reward per se. Moreover, these “ramping” cells retain an important characteristic of negative value-coding cells as a whole: they have differential responses to the strong positive and weak positive CS (during the second half of the trace interval; Wilcoxon, p < 0.05). Therefore, just like the population of value-coding OFC cells as a whole, ramping cells show evidence of processing information about different levels of liquid reward and air-puff.
Processing of information about reward and aversive stimuli in neural signals and behavior
On each trial of the trace conditioning task, monkeys presumably must develop an expectation of reward or air-puff to appropriately modify their anticipatory behavior. Although the reinforcement contingencies of CSs remained constant for dozens of trials within a recording session, monkeys' assessment of those contingencies, as indicated by their anticipatory licking and blinking, was more variable. Two lines of evidence support the notion that OFC neural responses are linked to this behavioral variability. First, during initial learning of the CS-US associations, monkeys' anticipatory licking increased and blinking decreased for positive trials, and monkeys' anticipatory blinking increased and licking decreased for negative trials, indicating that monkeys' behavioral learning incorporated information about both rewarding and aversive stimuli (Fig. 10a). In parallel, for both positive and negative value-coding neurons, neural activity changed in a manner consistent with monkeys' behavioral changes (Fig. 10b). These data indicate that monkeys' assessment of information about rewarding and aversive stimuli, as by their anticipatory licking and blinking behavior, was reflected in the firing of OFC neurons, despite the absence of motor-related signals in OFC (Figs. 4, 5).
A second line of evidence, also supporting the relationship between behavioral variability and neural encoding in OFC, derived from an analysis of neural activity in relation to “correct” and “incorrect” anticipatory behavioral responses. For this analysis, we identified two types of trials: 1) trials in which the monkey displayed the correct expectation—i.e., licking and not blinking during the 500 ms before reward, or blinking and not licking during the 500 ms before air-puff and 2) trials in which the monkey displayed an “incorrect” expectation—i.e., not licking during the 500 ms before reward, or not blinking in the 500 ms before air-puff. By comparing neural activity during these two types of trials using an ROC analysis, we constructed two “expectation” indices for each value-coding cell: one for the cell's “preferred” trial type (rewarded or punished) and one for the “nonpreferred” trial type. An index value >0.5 indicates that neural activity was stronger when the monkey's behavior indicated a correct expectation of reinforcement. As shown in Figure 10, c and d, the distribution for preferred trials was significantly shifted to the right of 0.5 (Wilcoxon, p < 0.0001), whereas the distribution for nonpreferred trials was significantly shifted to the left (Wilcoxon, p < 0.01). Moreover, the population peristimulus time histograms (Fig. 10e,f) show that, for preferred trial types, trace interval activity was stronger when the monkey expected the correct reinforcement (Wilcoxon, p < 0.001); and for nonpreferred trial types, trace interval neural activity was stronger when monkeys incorrectly anticipated reinforcement (Wilcoxon, p < 0.05). These data demonstrate that OFC neural responses to CSs are linked to monkeys' trial-by-trial behavioral reactions to the stimuli, indicating that the processing of positive and negative affective information in OFC could contribute to monkeys' ongoing assessment of CSs and behavioral response selection.
Discussion
Animals frequently must access information about both possible rewarding and possible aversive events to produce adaptive decisions and emotional responses. Here we have provided three lines of evidence supporting the notion that the activity of individual neurons in OFC reflects a convergence of appetitive and aversive information in the brain. First, OFC neurons often modulate their firing rate upon presentation of both positive and negative USs—liquid reward and aversive air-puff—indicating that neurons likely receive inputs about both types of reinforcement. Second, OFC neurons exhibit responses that are modulated by the presentation of CSs associated with USs differing in both valence and sensory modality. For example, neurons that fire most strongly to a CS associated with an aversive air-puff nevertheless often respond differentially to CSs associated with different amounts of liquid reward. Finally, as monkeys' behavior incorporates information about both reward and aversive stimuli during learning, OFC neurons representing positive and negative contingencies change their responses in a predictable manner. Overall, these data provide evidence that OFC neurons could participate in general emotional and/or cognitive processes that require the processing of information about both rewarding and aversive stimuli.
We considered two alternative explanations for the differential responses we observed to CSs associated with different levels of reward or aversive air-puffs. First, we examined the possibility that responses related to licking or blinking could account for the differential activity; however, we did not find evidence of any motor-related activity in OFC (Figs. 4, 5), consistent with the idea that OFC neurons do not simply represent CS-motor associations (Tremblay and Schultz, 2000; Wallis and Miller, 2003; Padoa-Schioppa and Assad, 2006). Notably, trial-to-trial variability in monkeys' evaluation of the CS, as indicated by their anticipatory behavior, is correlated with neurons' firing rates (Fig. 10c–f), even though no motor signal is evident.
Second, we considered the possibility that OFC neural responses to CSs simply reflect anticipated reward amount, and do not incorporate information about aversive air-puffs; however, several lines of evidence make this possibility unlikely. First, a subpopulation of negative value-coding cells shows activity that “ramps up” in anticipation of air-puff presentation. These cells respond strongly to the air-puff itself, but have little or no response when the air-puff is omitted. In addition, as discussed above, both positive and negative value-coding neurons frequently show robust responses to the air-puff itself, indicating that they receive information about the air-puff. Finally, neural responses to the negative CS change in tandem with monkeys' anticipatory blinking responses during initial learning about associations with air-puff, and throughout the session on a trial-by-trial basis, indicating that OFC activity is correlated with monkeys' behavioral use of information about aversive stimuli.
Previous studies have shown that individual OFC neurons respond differentially to CSs predicting different rewards—whether rewards vary in magnitude, taste, or both—or to CSs predicting the same reward with different delays before delivery (Tremblay and Schultz, 1999, 2000; Wallis and Miller, 2003; Roesch and Olson, 2004; Padoa-Schioppa and Assad, 2006, 2008). Placing the data into an economic framework, recent studies have linked OFC neural responses to monkeys' subjective valuation of rewards and the cues that predict them (Padoa-Schioppa and Assad, 2006, 2008). Notably, prior studies have found some OFC neurons that respond most strongly to highly valued stimuli, and others that responded more strongly to lower-valued stimuli (Wallis and Miller, 2003; Padoa-Schioppa and Assad, 2006, 2008). These different neurons may correspond to the positive and negative value-coding neurons described here; however, here we provide evidence that OFC neurons also often encode information about conditioned and unconditioned aversive stimuli. In contrast to the current results, some prior studies have found a preponderance of OFC neurons that respond most strongly to stimuli predicting rewards delivered with a short delay as opposed to a long delay (Roesch and Olson, 2004, 2005). Our identification of a slightly more numerous population of OFC neurons preferring the aversive valence might be attributed to the enhanced salience and intensity of an aversive air-puff compared with a delayed reward.
The few prior studies that have investigated OFC responses during tasks involving aversive stimuli have used operant tasks in which aversive stimuli could be avoided (Thorpe et al., 1983; Schoenbaum et al., 2003; Saddoris et al., 2005; Hosokawa et al., 2007). In this type of task, once a subject learns to avoid punishments, the CS may not retain the same aversive value, as it is no longer reliably paired with the negative reinforcer; moreover, avoiding punishment can itself be rewarding and can activate brain structures associated with reward processing (Seymour et al., 2005; Kim et al., 2006). Consequently, it is difficult to interpret neural responses to an avoidable negative CS. In contrast to this approach, we used a classical conditioning procedure in which positive and negative reinforcement was reliably associated with CSs. We discovered that individual OFC neurons process information from both appetitive and aversive neural subsystems, suggesting that OFC activity could participate in the formation of a neural “currency” for evaluating stimuli with positive or negative valence (Montague and Berns, 2002). This seems to be the case even if the reward and aversive stimulus are of different sensory modalities.
A recent lesion study has suggested that rodent OFC may mediate the association of cues with the sensory properties of particular reinforcements (Burke et al., 2008). Some of the neurons we describe—those whose responses are not modulated by both valences of reinforcement—could mediate this type of process. However, the valence- and modality-spanning signals that we found in single neurons highlight the likelihood that primate OFC is also involved in the association of cues with more general affective properties. Consistent with this notion, prior studies have found that OFC neurons may respond similarly to stimuli associated with different rewards with the same subjective valuation (Padoa-Schioppa and Assad, 2006). The apparent differences between primate physiological data and the lesion study cited may reflect a lack of homology between rodent and primate OFC. Primates have a more developed OFC than rodents, with extensive granular and dysgranular cortex, including area 13; in contrast, rodent OFC is entirely agranular (Preuss, 1995; Ongür and Price, 2000; Barbas, 2007; Wise, 2008).
Although we show that many individual OFC neurons respond to aversive and rewarding stimuli on the same general scale, further work is needed to determine whether OFC neural activity encodes the aversive value of CSs in a continuous, quantitative manner, as has been shown for reward values (Padoa-Schioppa and Assad, 2006, 2008). The organization of neurons with different physiological properties also remains an open question. Neuroimaging research has suggested differential involvement for medial and lateral areas of OFC in tasks involving positive or negative stimulus-outcome associations (O'Doherty et al., 2001). This suggests that neurons with preferences for positively or negatively valued stimuli might reside in different areas of OFC; but because our study focused on a relatively limited area, we are not in a position to address the relative abundance of neurons with these coding properties throughout OFC. We did find, however, that neurons with different coding properties appear to be intermingled within area 13.
The OFC forms only one part of the complex neural circuits responsible for valuation, decision-making and the expression and regulation of emotions. Specifically, the OFC is reciprocally connected with several other brain areas involved in affect and/or cognition, including the amygdala, hippocampus, striatum, hypothalamus, and other parts of the prefrontal cortex (Carmichael and Price, 1995; Haber et al., 1995; Cavada et al., 2000). Furthermore, physiological and anatomical evidence suggests that the amygdala, which is highly interconnected with OFC (Carmichael and Price, 1995; Stefanacci and Amaral, 2000, 2002; Ghashghaei and Barbas, 2002; Barbas, 2007; Ghashghaei et al., 2007), is intimately involved in the valuation of stimuli (LeDoux, 2000; Paton et al., 2006) and interacts with OFC in this regard (Baxter et al., 2000; Schoenbaum et al., 2003; Saddoris et al., 2005). We chose to focus on the more posterior and medial aspects of OFC because they are densely interconnected with the limbic system (Carmichael and Price, 1995; Ongür and Price, 2000; Stefanacci and Amaral, 2000, 2002; Ghashghaei and Barbas, 2002; Barbas, 2007; Ghashghaei et al., 2007). Moreover, functional imaging experiments in humans show that both the OFC and amygdala are activated by tasks involving the manipulation of conditioned stimulus values (Gottfried et al., 2003; Morris and Dolan, 2004; Hare et al., 2008). In fact, we have previously found that amygdala neurons share many response properties with OFC neurons—including the fact that neural responses to CSs often reflect the processing of information about both reward amounts and air-puffs (Paton et al., 2006; Belova et al., 2008)—consistent with an intimate link between these two brain areas. Further study is required to clarify how the OFC, amygdala, and other brain areas interact to construct representations of affective associations such as those we have described, and how these representations are used to generate appropriate cognitive, behavioral, and emotional responses to rewarding and aversive stimuli.
Footnotes
This research was supported by the Keck Foundation, by grants from the National Institute of Mental Health (NIMH) (R01 MH082017), the National Eye Institute (NEI) (R24 EY015634), and the Sloan, James S. McDonnell, and Gatsby foundations, and by a Charles E. Culpeper Scholarship award from Goldman Philanthropic Partnerships to C.D.S. S.E.M. received support from a National Science Foundation graduate fellowship and from an individual NIMH National Research Service Award (F31 MH081620). We thank members of the Salzman laboratory and the Mahoney Center at Columbia for helpful comments and discussions, S. Dashnaw and J. Hirsch for MRI support, M. Belova and J. Paton for advice on scientific and technical issues, and K. Marmon for invaluable technical assistance.
References
- Apicella P, Ljungberg T, Scarnati E, Schultz W. Responses to reward in monkey dorsal and ventral striatum. Exp Brain Res. 1991;85:491–500. doi: 10.1007/BF00231732. [DOI] [PubMed] [Google Scholar]
- Barbas H. Specialized elements of orbitofrontal cortex in primates. Ann N Y Acad Sci. 2007;1121:10–32. doi: 10.1196/annals.1401.015. [DOI] [PubMed] [Google Scholar]
- Baxter MG, Parker A, Lindner CC, Izquierdo AD, Murray EA. Control of response selection by reinforcer value requires interaction of amygdala and orbital prefrontal cortex. J Neurosci. 2000;20:4311–4319. doi: 10.1523/JNEUROSCI.20-11-04311.2000. [DOI] [PMC free article] [PubMed] [Google Scholar]
- Belova MA, Paton JJ, Morrison SE, Salzman CD. Expectation modulates neural responses to pleasant and aversive stimuli in primate amygdala. Neuron. 2007;55:970–984. doi: 10.1016/j.neuron.2007.08.004. [DOI] [PMC free article] [PubMed] [Google Scholar]
- Belova MA, Paton JJ, Salzman CD. Moment-to-moment tracking of state value in the amygdala. J Neurosci. 2008;28:10023–10030. doi: 10.1523/JNEUROSCI.1400-08.2008. [DOI] [PMC free article] [PubMed] [Google Scholar]
- Burke KA, Franz TM, Miller DN, Schoenbaum G. The role of the orbitofrontal cortex in the pursuit of happiness and more specific rewards. Nature. 2008;454:340–344. doi: 10.1038/nature06993. [DOI] [PMC free article] [PubMed] [Google Scholar]
- Carmichael ST, Price JL. Limbic connections of the orbital and medial prefrontal cortex in macaque monkeys. J Comp Neurol. 1995;363:615–641. doi: 10.1002/cne.903630408. [DOI] [PubMed] [Google Scholar]
- Cavada C, Company T, Tejedor J, Cruz-Rizzolo RJ, Reinoso-Suarez F. The anatomical connections of the macaque monkey orbitofrontal cortex. A review. Cereb Cortex. 2000;10:220–242. doi: 10.1093/cercor/10.3.220. [DOI] [PubMed] [Google Scholar]
- Ghashghaei H, Barbas H. Pathways for emotion: interactions of prefrontal and anterior temporal pathways in the amygdala of the rhesus monkey. Neuroscience. 2002;115:1261–1279. doi: 10.1016/s0306-4522(02)00446-3. [DOI] [PubMed] [Google Scholar]
- Ghashghaei HT, Hilgetag CC, Barbas H. Sequence of information processing for emotions based on the anatomic dialogue between prefrontal cortex and amygdala. Neuroimage. 2007;34:905–923. doi: 10.1016/j.neuroimage.2006.09.046. [DOI] [PMC free article] [PubMed] [Google Scholar]
- Gottfried J, O'Doherty J, Dolan RJ. Encoding predictive reward value in human amygdala and orbitofrontal cortex. Science. 2003;301:1104–1107. doi: 10.1126/science.1087919. [DOI] [PubMed] [Google Scholar]
- Green DM, Swets JA. Signal detection theory and psychophysics. New York: Wiley; 1966. [Google Scholar]
- Haber SN, Kunishio K, Mizobuchi M, Lynd-Balta E. The orbital and medial prefrontal circuit through the primate basal ganglia. J Neurosci. 1995;15:4851–4867. doi: 10.1523/JNEUROSCI.15-07-04851.1995. [DOI] [PMC free article] [PubMed] [Google Scholar]
- Hackett TA, Stepniewska I, Kaas JH. Prefrontal connections of the parabelt auditory cortex in macaque monkeys. Brain Res. 1999;817:45–58. doi: 10.1016/s0006-8993(98)01182-2. [DOI] [PubMed] [Google Scholar]
- Hare TA, O'Doherty J, Camerer CF, Schultz W, Rangel A. Dissociating the role of the orbitofrontal cortex and the striatum in the computation of goal values and prediction errors. J Neurosci. 2008;28:5623–5630. doi: 10.1523/JNEUROSCI.1309-08.2008. [DOI] [PMC free article] [PubMed] [Google Scholar]
- Hosokawa T, Kato K, Inoue M, Mikami A. Neurons in the macaque orbitofrontal cortex code relative preference of both rewarding and aversive outcomes. Neurosci Res. 2007;57:434–445. doi: 10.1016/j.neures.2006.12.003. [DOI] [PubMed] [Google Scholar]
- Izquierdo A, Suda RK, Murray EA. Bilateral orbital prefrontal cortex lesions in rhesus monkeys disrupt choices guided by both reward value and reward contingency. J Neurosci. 2004;24:7540–7548. doi: 10.1523/JNEUROSCI.1921-04.2004. [DOI] [PMC free article] [PubMed] [Google Scholar]
- Izquierdo A, Suda RK, Murray EA. Comparison of the effects of bilateral orbital prefrontal cortex lesions and amygdala lesions on emotional responses in rhesus monkeys. J Neurosci. 2005;25:8534–8542. doi: 10.1523/JNEUROSCI.1232-05.2005. [DOI] [PMC free article] [PubMed] [Google Scholar]
- Kalin NH, Shelton SE, Davidson RJ. Role of the primate orbitofrontal cortex in mediating anxious temperament. Biol Psychiatry. 2007;62:1134–1139. doi: 10.1016/j.biopsych.2007.04.004. [DOI] [PMC free article] [PubMed] [Google Scholar]
- Kennerley SW, Dahmubed AF, Lara AH, Wallis JD. Neurons in the frontal lobe encode the value of multiple decision variables. J Cogn Neurosci. 2009;21:1162–1178. doi: 10.1162/jocn.2009.21100. [DOI] [PMC free article] [PubMed] [Google Scholar]
- Kim H, Shimojo S, O'Doherty JP. Is avoiding an aversive outcome rewarding? Neural substrates of avoidance learning in the human brain. PLoS Biol. 2006;4:e233. doi: 10.1371/journal.pbio.0040233. [DOI] [PMC free article] [PubMed] [Google Scholar]
- Lakatos P, Pincze Z, Fu KM, Javitt DC, Karmos G, Schroeder CE. Timing of pure tone and noise-evoked responses in macaque auditory cortex. Neuroreport. 2005;16:933–937. doi: 10.1097/00001756-200506210-00011. [DOI] [PubMed] [Google Scholar]
- LeDoux JE. Emotion circuits in the brain. Annu Rev Neurosci. 2000;23:155–184. doi: 10.1146/annurev.neuro.23.1.155. [DOI] [PubMed] [Google Scholar]
- Machado CJ, Bachevalier J. The effects of selective amygdala, orbital frontal cortex or hippocampal formation lesions on reward assessment in nonhuman primates. Eur J Neurosci. 2007;25:2885–2904. doi: 10.1111/j.1460-9568.2007.05525.x. [DOI] [PubMed] [Google Scholar]
- Montague PR, Berns GS. Neural economics and the biological substrates of valuation. Neuron. 2002;36:265–284. doi: 10.1016/s0896-6273(02)00974-1. [DOI] [PubMed] [Google Scholar]
- Morris JS, Dolan RJ. Dissociable amygdala and orbitofrontal responses during reversal fear conditioning. Neuroimage. 2004;22:372–380. doi: 10.1016/j.neuroimage.2004.01.012. [DOI] [PubMed] [Google Scholar]
- Murray EA, Izquierdo A. Orbitofrontal cortex and amygdala contributions to affect and action in primates. Ann N Y Acad Sci. 2007;1121:273–296. doi: 10.1196/annals.1401.021. [DOI] [PubMed] [Google Scholar]
- O'Doherty JP. Lights, camembert, action! The role of human orbitofrontal cortex in encoding stimuli, rewards, and choices. Ann N Y Acad Sci. 2007;1121:254–272. doi: 10.1196/annals.1401.036. [DOI] [PubMed] [Google Scholar]
- O'Doherty J, Kringelbach ML, Rolls ET, Hornak J, Andrews C. Abstract reward and punishment representations in the human orbitofrontal cortex. Nat Neurosci. 2001;4:95–102. doi: 10.1038/82959. [DOI] [PubMed] [Google Scholar]
- Ongür D, Price JL. The organization of networks within the orbital and medial prefrontal cortex of rats, monkeys and humans. Cereb Cortex. 2000;10:206–219. doi: 10.1093/cercor/10.3.206. [DOI] [PubMed] [Google Scholar]
- Ongür D, Ferry AT, Price JL. Architectonic subdivision of the human orbital and medial prefrontal cortex. J Comp Neurol. 2003;460:425–449. doi: 10.1002/cne.10609. [DOI] [PubMed] [Google Scholar]
- Padoa-Schioppa C, Assad JA. Neurons in the orbitofrontal cortex encode economic value. Nature. 2006;441:223–226. doi: 10.1038/nature04676. [DOI] [PMC free article] [PubMed] [Google Scholar]
- Padoa-Schioppa C, Assad JA. The representation of economic value in the orbitofrontal cortex is invariant for changes of menu. Nat Neurosci. 2008;11:95–102. doi: 10.1038/nn2020. [DOI] [PMC free article] [PubMed] [Google Scholar]
- Paton J, Belova M, Morrison S, Salzman C. The primate amygdala represents the positive and negative value of visual stimuli during learning. Nature. 2006;439:865–870. doi: 10.1038/nature04490. [DOI] [PMC free article] [PubMed] [Google Scholar]
- Pavlov IP. Conditioned reflexes. London: Oxford UP; 1927. [Google Scholar]
- Paxinos G, Huang X, Toga AW. The rhesus monkey brain in stereotaxic coordinates. San Diego: Academic; 2000. [Google Scholar]
- Preuss TM. Do rats have prefrontal cortex? The Rose-Woolsey-Akert program reconsidered. J Cogn Neurosci. 1995;7:1–24. doi: 10.1162/jocn.1995.7.1.1. [DOI] [PubMed] [Google Scholar]
- Recanzone GH, Guard DC, Phan ML. Frequency and intensity response properties of single neurons in the auditory cortex of the behaving macaque monkey. J Neurophysiol. 2000;83:2315–2331. doi: 10.1152/jn.2000.83.4.2315. [DOI] [PubMed] [Google Scholar]
- Roesch MR, Olson CR. Neuronal activity related to reward value and motivation in primate frontal cortex. Science. 2004;304:307–310. doi: 10.1126/science.1093223. [DOI] [PubMed] [Google Scholar]
- Roesch MR, Olson CR. Neuronal activity in primate orbitofrontal cortex reflects the value of time. J Neurophysiol. 2005;94:2457–2471. doi: 10.1152/jn.00373.2005. [DOI] [PubMed] [Google Scholar]
- Romanski LM, Bates JF, Goldman-Rakic PS. Auditory belt and parabelt projections to the prefrontal cortex in the rhesus monkey. J Comp Neurol. 1999;403:141–157. doi: 10.1002/(sici)1096-9861(19990111)403:2<141::aid-cne1>3.0.co;2-v. [DOI] [PubMed] [Google Scholar]
- Saddoris MP, Gallagher M, Schoenbaum G. Rapid associative encoding in basolateral amygdala depends on connections with orbitofrontal cortex. Neuron. 2005;46:321–331. doi: 10.1016/j.neuron.2005.02.018. [DOI] [PubMed] [Google Scholar]
- Salzman CD, Paton JJ, Belova MA, Morrison SE. Flexible neural representations of value in the primate brain. Ann N Y Acad Sci. 2007 doi: 10.1196/annals.1401.034. [DOI] [PMC free article] [PubMed] [Google Scholar]
- Schoenbaum G, Chiba A, Gallagher M. Orbitalfrontal cortex and basolateral amygdala encode expected outcomes during learning. Nat Neurosci. 1998;1:155–159. doi: 10.1038/407. [DOI] [PubMed] [Google Scholar]
- Schoenbaum G, Setlow B, Saddoris MP, Gallagher M. Encoding predicted outcome and acquired value in orbitofrontal cortex during cue sampling depends upon input from basolateral amygdala. Neuron. 2003;39:855–867. doi: 10.1016/s0896-6273(03)00474-4. [DOI] [PubMed] [Google Scholar]
- Seymour B, O'Doherty JP, Koltzenburg M, Wiech K, Frackowiak R, Friston K, Dolan R. Opponent appetitive-aversive neural processes underlie predictive learning of pain relief. Nat Neurosci. 2005;8:1234–1240. doi: 10.1038/nn1527. [DOI] [PubMed] [Google Scholar]
- Stefanacci L, Amaral DG. Topographic organization of cortical inputs to the lateral nucleus of the macaque monkey amygdala: a retrograde tracing study. J Comp Neurol. 2000;421:52–79. doi: 10.1002/(sici)1096-9861(20000522)421:1<52::aid-cne4>3.0.co;2-o. [DOI] [PubMed] [Google Scholar]
- Stefanacci L, Amaral DG. Some observations on cortical inputs to the macaque monkey amygdala: an anterograde tracing study. J Comp Neurol. 2002;451:301–323. doi: 10.1002/cne.10339. [DOI] [PubMed] [Google Scholar]
- Thorpe SJ, Rolls ET, Maddison S. The orbitofrontal cortex: neuronal activity in the behaving monkey. Exp Brain Res. 1983;49:93–115. doi: 10.1007/BF00235545. [DOI] [PubMed] [Google Scholar]
- Tremblay L, Schultz W. Relative reward preference in primate orbitofrontal cortex. Nature. 1999;398:704–708. doi: 10.1038/19525. [DOI] [PubMed] [Google Scholar]
- Tremblay L, Schultz W. Reward-related neuronal activity during go-nogo task performance in primate orbitofrontal cortex. J Neurophysiol. 2000;83:1864–1876. doi: 10.1152/jn.2000.83.4.1864. [DOI] [PubMed] [Google Scholar]
- Wallis JD. Orbitofrontal cortex and its contribution to decision-making. Annu Rev Neurosci. 2007;30:31–56. doi: 10.1146/annurev.neuro.30.051606.094334. [DOI] [PubMed] [Google Scholar]
- Wallis JD, Miller EK. Neuronal activity in primate dorsolateral and orbital prefrontal cortex during performance of a reward preference task. Eur J Neurosci. 2003;18:2069–2081. doi: 10.1046/j.1460-9568.2003.02922.x. [DOI] [PubMed] [Google Scholar]
- Wise SP. Forward frontal fields: phylogeny and fundamental function. Trends Neurosci. 2008;31:599–608. doi: 10.1016/j.tins.2008.08.008. [DOI] [PMC free article] [PubMed] [Google Scholar]