

Abstract
Rationale
Although ICUs with higher overall patient volume may achieve better outcomes than lower volume ICUs, there are few data on the effects of increasing patient loads on patients within the ICU.
Objectives
To examine the association of ICU occupancy on the patient outcomes within the same ICU.
Methods
We examined 200,499 patients in 108 ICUs using the Acute Physiology and Chronic Health Evaluation IV database in 2002 - 2005. Daily census on the day of admission was determined for each patient and defined in relation to the mean census. We used conditional logistic regression to compare inpatient outcomes of patients admitted on high census days to those admitted in the same ICU on low census days. We controlled for severity of illness at the patient level using data on clinical, demographic and physiologic variables on admission to the ICU.
Measurements and Main Results
Patients admitted on high census days had the same odds of inpatient mortality or transfer to another hospital as patients admitted on average or on low census days. These findings were robust to multiple alternative definitions of day of admission census and were confirmed in several subgroup analyses.
Conclusions
The ICUs in this data set are able to function as high-reliability organizations. They are able to scale up their operations to meet the needs of a wide-range of operating conditions while maintaining consistent patient mortality outcomes.
Keywords: Intensive care, mortality, volume, high-reliability organizations
Introduction
There is growing interest in concentrating critically ill patients into a smaller number of intensive care units (ICUs). This interest arises due to the increasing demand for critical care by a growing population at risk, (1) due to hospital closures, (2) as the result of payer-initiatives to achieve economies of scale, (3) and because of possible policy decisions to implement a regionalized system of care. (4, 5)
Several studies demonstrate that high volume ICUs provide improved outcomes for a range of serious conditions. (6-13) However, these cross-sectional studies do not address the effect of increasing patient volume within a hospital on outcomes; that is, they demonstrate average effects rather than marginal effects, although the marginal effects are quite relevant from a policy perspective. Results of studies of the effect of changes in patient volume on outcomes have been mixed. (14-16) We are unaware of any multi-center studies focusing on the relationship between day-to-day patient volume and ICU outcomes in the U.S.
In this study, we examine the association of daily ICU occupancy with the outcomes of patients admitted to that ICU on that day. We study a range of critical illnesses within the Acute Physiology and Chronic Health Evaluation (APACHE) IV database, containing detailed clinical and physiologic information on patients admitted to 108 ICUs. Day-of-admission census is our primary exposure variable because of the importance of rapid initial treatment for outcomes in many critical illnesses. (17-19) A fixed effects model is used at the ICU level to compare patients to others admitted within the same ICU, but on a different day.
Methods
Study Population and Data
Data came from patients admitted to ICUs participating in the APACHE clinical information system from January 2002 through June 2005. These units were diverse in size, geographic region, and teaching status. The APACHE program prospectively collects physiologic, clinical, demographic, and admission source data. Data are entered by teams who undergo intensive training and receive regular quality reviews. These data support several risk-adjustment models of ICU outcomes. (20-22)
All patients admitted to APACHE ICUs were eligible for the study. Patients undergoing coronary artery bypass grafting (CABG) were excluded as they have different risk-adjustment profiles than other critically ill patients. (21, 22) We also excluded ICUs caring for fewer than 100 patients in the data and the first 100 patients at a site to insure that our census measures were stable. Only a patient's first admission to the ICU during any given hospitalization was analyzed.
This manuscript was considered exempt from review by the University of Pennsylvania Institutional Review Board.
Variables
Our exposure of interest is the census of each ICU on the day of ICU admission. Census is defined as the total number of patients who spent at least 2 hours in each ICU on the calendar day on which a given patient was admitted. The mean census of each ICU across the study period was computed. In order to take into account differences between ICUs in their size and inherent uncertainty in determining the total capacity in each ICU, ICU census is analyzed as the ratio of the day-of-admission census to the mean census, divided into deciles. As sensitivity analyses, models were re-estimated using other parameterizations of our key exposure variable. We avoided using “mean census during the patient's ICU stay” or some similar construct as ICU census after admission for a patient is endogenous to our outcomes.
The primary outcomes were in-hospital mortality and discharge to another hospital. As a secondary outcome we examined length of stay in the ICU, which is recorded directly in the database; for these analyses we excluded 16,400 patients in 8 ICU's whose precise entrance and exit times within a given day are not in the dataset.
Risk Adjustment
Risk adjustment was performed using the APACHE IV risk adjustment formulae. The risk equations include the day one acute physiology score, age, select chronic health items, primary diagnosis, hospital admission source, pre-ICU length of stay, whether or not a sedated patient could have their Glasgow coma score assessed, whether or not a patient was receiving invasive mechanical ventilation, and whether or not the patient had received emergency surgery, as described elsewhere. (21, 22) Separate risk adjustment formulae are available for inpatient mortality and ICU length of stay.
For regressions examining the association with discharge to another hospital, we have adjusted for APACHE IV-predicted risk of death as a marker of severity of illness, as we are unaware of a validated risk-adjustment model for that precise outcome.
Statistical Analysis
In key analyses, the relationship between census and outcome was examined using multivariable conditional logistic and linear regression, adjusting for APACHE risk of death. All regression models were parameterized with an ICU-level fixed effect in order to fully control for all shared, time-invariant characteristics of the ICU (including the nominal capacity of the ICU – “how many beds the unit has”), without having to measure those characteristics. (23) Individual-level risk-adjusted predicted outcome was included in all regression models with linear, quadratic and cubic terms to insure flexibility. The regression results can be interpreted as the effect of the day-of-admission census comparing each patient to other patients admitted to the same ICU. An adjusted R2 measure is reported in the Appendix for each regression, re-scaled as maximum R2 is less than one for a dichotomous outcome. (24) Analyses were carried out in Stata 9.2 and SAS 9.0-9.2.
Results
We examined 200,499 patients admitted to 108 ICUs in 46 hospitals. Patient characteristics are in Table 1. The mean age was 61.5 years; the median Acute Physiology Score was 34. 63.1% of patients were discharged home, 13.3% died during their hospitalization. Characteristics of the ICUs are in Table 2. The average daily census was 12.8 across ICUs, with a median of 11 and an interquartile range of 9 to 15.
Table 1. Patient Characteristics (n = 200,499).
| Mean | S.D. | |
|---|---|---|
| Age | 61.54 | 17.60 |
| In-Hospital Death | 13.26% | (n = 26,583) |
| Emergent Surgery | 5.81% | (n = 11,654) |
| Post-Operative | 30.50% | (n = 61,158) |
| Predicted Mortality | 13.83% | |
| ICU Length of Stay | 3.94 | 6.29 |
| Predicted ICU Length of Stay | 3.69 | 2.32 |
| Admission Source | ||
| Operating Room | 30.50% | (n = 61,157) |
| Emergency Department | 37.43% | (n = 75,038) |
| Floor | 17.72% | (n = 35,524) |
| Transfer FROM another Hospital | 8.66% | (n = 17,369) |
| Direct Admission | 5.69% | (n = 11,411) |
| Discharge Destination | ||
| Home | 63.06% | (n = 126,433) |
| TO Another Hospital | 5.45% | (n = 10,919) |
| Dead | 13.26% | (n = 26,583) |
| Skilled Nursing Facility | 11.53% | (n = 23,112) |
| Other | 5.27% | (n = 10,575) |
| Missing | 1.43% | (n = 2,877) |
| Admission Diagnoses | ||
| Cardiac | 16.40% | (n = 32,880) |
| Sepsis | 5.67% | (n = 11,371) |
| Pneumonia | 3.90% | (n = 7,810) |
| Other Pulmonary (including COPD) | 8.92% | (n = 17,884) |
| Neurological (including Neurosurgery) | 13.72% | (n = 27,513) |
| Trauma | 7.40% | (n = 14,829) |
| Other Surgery | 15.26% | (n = 30,604) |
| All Other Admitting Diagnoses | 28.73% | (n= 57,608) |
Table 2. ICU characteristics (n=108).
| Mean Daily Census | 12.8 | |
| Median Daily Census | 11 | |
| Interquartile Range for Daily Census | 9 - 15 | |
| Median Total Patients | 1831 | |
| Interquartile Range for Total Patients | 1107 - 2869 | |
| Teaching Status | ||
| Member, Council of Teaching Hospitals | 38.0% | (n = 41) |
| Small Teaching Hospital | 27.8% | (n = 30) |
| Non-Teaching Hospital | 34.3% | (n = 37) |
| ICU Type | ||
| General | 35.2% | (n = 38) |
| Medical | 4.6% | (n = 5) |
| Cardiac | 5.6% | (n = 6) |
| Neurological | 8.3% | (n = 9) |
| Cardiothoracic | 25.0% | (n = 27) |
| Surgical | 19.4% | (n = 21) |
| Trauma | 1.9% | (n = 2) |
There was wide variability in the day-of-admission census. The lowest decile of patients were admitted to ICU's with a census at 65% of their mean daily census; the highest decile of patients were admitted to ICU's operating at 147% of their mean daily census.
Response to Unusually High Daily Census
Severity of illness as measured by Acute Physiology Scores (APS) of patients did not markedly change with increasing occupancy of the ICU. (Figure 1) In a fixed effects model comparing patients to other patients in the same ICU, there was a small decline in mean APS with increasing patient occupancy. (Appendix Table, A.I.) Patients admitted on the highest census days had an APS 2.57 (+/- 0.26 SE, p < 0.0001) lower than those on the lowest census days (comparing deciles 1 and 10).
Figure 1. Unadjusted Acute Physiology Score.
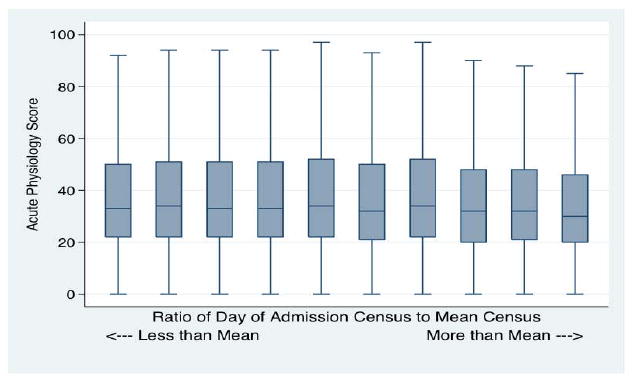
Across Deciles of Census Ratio. Box plot shows the median (center line) and interquartile range (box). There is little meaningful association with Census (on the horizontal axis).
There was little difference in mortality with increasing census on day of admission. As shown in Figure 2 without adjustment, patients admitted on the highest census days were slightly less likely to die as an inpatient; there was no increase in rates of transfers of patients to other hospitals with increasing census. As shown in Figure 3, there was no significant change in mortality with increasing census when a fixed effects regression is used to compare patients to others within the same ICU, and after adjustment for differences in predicted inpatient mortality using APACHE IV. (Appendix Table A.II; the joint test for the occupancy variables was insignificant at p=0.149.) Moreover, the estimates are quite precise, ruling out large associations – patients in the highest decile have an odds ratio for inpatient mortality of 0.98 (95% CI 0.91, 1.06) relative to those in decile 6 (the mean census). (Figure 3) Fixed effects models confirmed that there was no significant increase in rates of transfer to other hospitals with increasing census. (Appendix Table A.III.)
Figure 2. Unadjusted Mortality, Transfer Rates and ICU LOS.
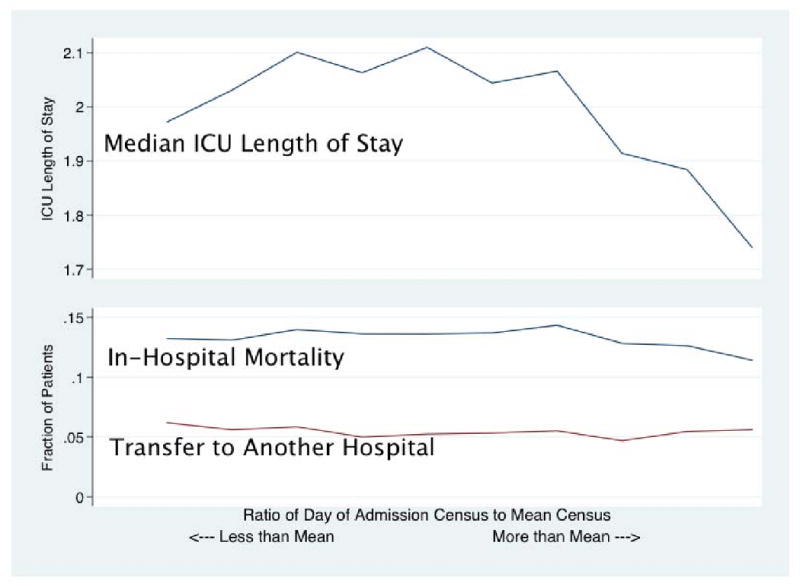
Across Deciles of Census Ratio (on the horizontal axis).
Figure 3. Conditional Logistic Regression for Mortality.
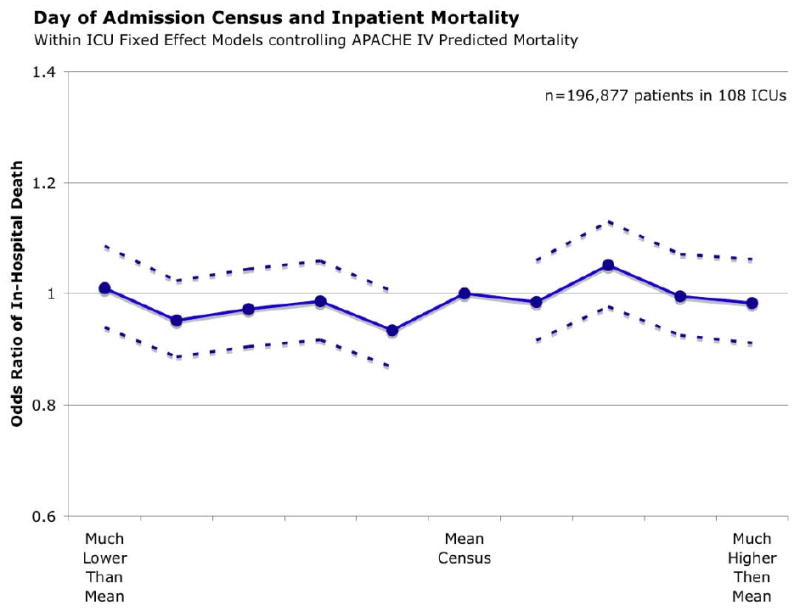
Ratio of Census to Mean Census Parameterized as Separate Indicator Variables for Each Decile and with Decile 6 as reference category.
Unadjusted length of stay in the ICU decreased modestly with increasing volume. This apparent effect disappeared when APACHE IV predicted length of stay was included as a covariate in the fixed effects regression. (Appendix Table A.IV.)
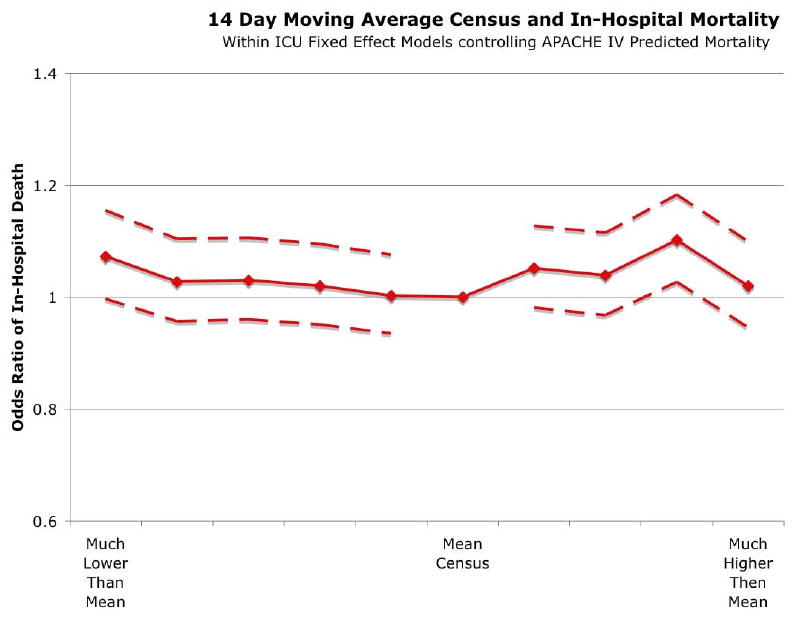
Sustained (14 Day) High Census
A very similar pattern was seen when examining the effects of the census over the 14 days prior to and including the day of admission. This was parameterized as a ratio of the 14-day moving average census to the mean census across the study period. There was no clinically significant change in the odds of death with increasing 14-day census in unadjusted or the fixed effects regression models. (See Figure 3 and Appendix Table A.V.) In the regression, the joint test for the occupancy variables was insignificant (p=0.21) Of note, there was an effect of occupancy on rates of transfers to other hospitals (joint test, p=0.0032), however, transfers were more common on days of the lowest occupancy. (Table A.VI)
Sensitivity Analyses
We conducted several sensitivity tests in order to confirm our mortality results, as shown in Table 3. In no case was there evidence of increased mortality with increased patient load.
Table 3. Sensitivity Analyses.
Our results were consistent across all of these analyses; full regression results are presented in the Appendix.
Subpopulations of Potential Interest:
|
Alternative Parameterizations:
|
Alternative Outcomes:
|
Discussion
Our results demonstrate that unusually high census on day-of-admission is not associated with clinically meaningful negative outcomes among critically ill patients across a range of conditions. This result was robust to alternative specifications of day-of-admission census, and was true in important subgroups, including the subset of highest acuity patients. This results is consistent with some US and UK past work (14, 15) although the results contradict a single-center study in a UK ICU. (16) While individual practitioners may suffer from the effects of increased workload, (25) the existing organizational structure in the ICUs in our data appear to be able to buffer patients from any mortal adverse effects of that increased workloads.
Why Might Increasing Census Worsen Patient Outcomes?
In economics, the finding of so-called “declining marginal productivity” is common. Beyond a certain point, a worker can not manufacture an item as quickly as the previous one. In the healthcare, this effect has been robustly studied in the Emergency Department (ED) crowding literature. Patients seen during busy periods in the ED have longer inpatient lengths of stay and poorer care. (26-28) Australian data suggests that ED crowding may even be associated with increased all-cause mortality. (29, 30) These results dovetail with the literature demonstrating improved outcome for patients with lower nursing ratios. (16, 25, 31)
Given these prior results suggesting that mortality of ICU patients would be increasing with day-of-admission census, our findings are reassuring. We find no evidence of a meaningful increase in mortality across a broad-range of observed census ratios. Our analysis has intentionally focused at the organizational level of the ICU as a whole. We look at the total number of patients cared for by an ICU in a day, as that may be under control of ICU managers and policy directors. This complements other research that has taken a more micro-level, looking at the workloads of a particular practitioner. At the organizational level, diverse compensating mechanisms exist to support individual practitioners. While studying the effectiveness of individual-level approaches (e.g. reducing nursing workloads) is valuable, there are also policy implications from studying the organizational aggregate effect.
Our data suggest that these ICUs are able to function as high-reliability organizations. They are able to safely scale up their operations as needed to meet the demands of a wide-range of operating conditions while maintaining consistent patient mortality outcomes. (32, 33) This is true when increased demand is acute – measured at a single-day level – or more chronic, measured across 2 weeks of sustained activity. Given the pessimism about the reliability of health care organizations, this finding is encouraging and suggests an area for detailed process studies. (34, 35) Our data do not allow us to investigate the particular processes that generate this aggregate mortality result, nor do they guarantee that the results are present for other measures of quality. But our data have important implications for regionalization of critical care, disaster planning, and selection of high quality critical care.
Implications
Regionalization is generally understood as a process of centralizing the care of patients of some type in designated centers of excellence, as in trauma and neonatal care. (36) Trauma networks have been associated with remarkable improvements in outcomes. (37-41) Leading critical care organizations are engaged in a discussion of regionalization of non-trauma critical care. (5, 12)
Analyses of the potential value of regionalization have emphasized the difference between average outcomes for patients cared for in low volume versus high volume hospital. Thus Krumholz and colleagues suggest that nearly 10,000 AMI patients might be saved each year were they to receive the same quality of care provided by the best hospitals.(42) Similar results have been found for non-post-operative mechanical ventilation. (43) These analyses assume, without data, that the average effectiveness of the ICU is the same as the marginal effect of the ICU. That is, they assume that ICUs will be able to provide the same quality of care for the patients during high occupancy as they have for the average of the preceding patients. The present study supports such an assumption, at least in the short-term.
In particular, the present study suggests that when assigning patients to providers to maximize the quality of care, across the observed range of variability, the highest quality providers are able to maintain their quality even at workloads much above their mean census. This implies, but does not prove, the viability of regionalization strategies, and related approaches such as concentrating high-risk procedures (3, 44) and when designing evacuations during disasters. Our results suggest that these ICUs maintain high quality despite high census – if the unit will accept the patient, it may be safe to send them.
Limitations
Our results have several limitations. First, they may not be generalize to all ICUs. The APACHE hospitals invested in information technology, and may not be representative of ICUs in the U.S. – or of the more constrained ICU resources typical of other developed countries. (45) Second, in any observational study an unobserved confounder might be present. Such a confounder would need to be associated with improved survival in the ICU and more common on high census days to explain our results. Third, given the importance of early response for several key critical illnesses, we have chosen to focus on census on day-of-admission. For some conditions, particularly safety-related complications such as catheter-related blood stream infections, the workload throughout the entire ICU stay may be more important. Fourth, limitations of our data require that we use inpatient mortality and inpatient discharge destination as key outcomes. We hope that replications of this work will use unambiguous 30 day outcomes. Fifth, our data do not address the outcomes of patients who could not be admitted to the ICU due to high census, so we cannot speak to population health effects—high census days may affect outcomes on the hospital ward or ED. Finally, we have chosen to use a minimally parametric fixed effects estimator. As such, our standard errors may be somewhat less precise than a model that made more restrictive assumptions; however, our point estimates suggest only very small effects, if any.
Conclusions
A diverse set of ICUs seems able to maintain consistent mortality outcomes across a range of daily censuses. Some ICUs display a hallmark of high reliability organizations: consistent outcomes despite wide range of operating conditions. Further, this implies, but does not yet prove, that patients may be concentrated in high volume ICUs without overwhelming those ICUs, and without thereby losing the potential benefits of concentration.
Acknowledgments
The authors would like to thank David A. Asch for his insightful comments.
Role of the Funding Source: This work was funded by NIH / NHLBI 5T32HL007891 and K08-HL091249 to TJI. The funder had no role in the specific project.
Appendix Table: Fixed Effects Regression Results
All regressions control for APACHE IV predicted mortality except as indicated.
Table A.I.
| Outcome | APS | *No Control for APACHE prediction* | ||
|---|---|---|---|---|
| Obs Used | 183774 | |||
| Subgroup | All | |||
| Beta | 95%CI LL | 95%CI UL | ||
| Lower Census | Decile 1 | reference | ||
| Decile 2 | -0.299 | -0.811 | 0.212 | |
| Decile 3 | -0.539 | -1.053 | -0.026 | |
| Decile 4 | -0.570 | -1.093 | -0.048 | |
| Ratio to Mean Census | Decile 5 | -0.801 | -1.317 | -0.285 |
| Decile 6 | -0.641 | -1.171 | -0.111 | |
| Decile 7 | -0.942 | -1.457 | -0.427 | |
| Decile 8 | -1.349 | -1.869 | -0.830 | |
| Higher Census | Decile 9 | -1.781 | -2.295 | -1.267 |
| Decile 10 | -2.570 | -3.085 | -2.055 | |
| F-Test for all Deciles | 16.39 | 9 d.f., p= | <.0001 | |
| R-Squared | 0.049149 | |||
Table A.II.
| Outcome | In-Hospital Death | |||
|---|---|---|---|---|
| Strata | 108 | |||
| Obs Used | 196877 | |||
| Subgroup | All | |||
| Odds Ratio | 95%CI LL | 95%CI UL | ||
| Lower Census | Decile 1 | 1.01 | 0.939 | 1.086 |
| Decile 2 | 0.952 | 0.886 | 1.023 | |
| Decile 3 | 0.972 | 0.905 | 1.044 | |
| Decile 4 | 0.986 | 0.917 | 1.059 | |
| Ratio to Mean Census | Decile 5 | 0.934 | 0.868 | 1.005 |
| Decile 6 | reference | |||
| Decile 7 | 0.985 | 0.916 | 1.06 | |
| Decile 8 | 1.051 | 0.977 | 1.13 | |
| Higher Census | Decile 9 | 0.995 | 0.925 | 1.071 |
| Decile 10 | 0.983 | 0.911 | 1.062 | |
| Wald Test for All Deciles | 13.3162 | 9 d.f., p= | 0.1488 | |
| Rescaled R-Squared | 0.3943 | |||
Table A.III.
| Outcome | Transferred to Another Hospital | |||
|---|---|---|---|---|
| Strata | 108 | |||
| Obs Used | 196877 | |||
| Subgroup | All | |||
| Odds Ratio | 95%CI LL | 95%CI UL | ||
| Lower Census | Decile 1 | 1.074 | 0.98 | 1.176 |
| Decile 2 | 1.024 | 0.934 | 1.123 | |
| Decile 3 | 1.056 | 0.963 | 1.158 | |
| Decile 4 | 0.99 | 0.899 | 1.09 | |
| Ratio to Mean Census | Decile 5 | 1.016 | 0.922 | 1.119 |
| Decile 6 | reference | |||
| Decile 7 | 0.946 | 0.86 | 1.041 | |
| Decile 8 | 0.957 | 0.869 | 1.054 | |
| Higher Census | Decile 9 | 1.029 | 0.937 | 1.129 |
| Decile 10 | 0.95 | 0.864 | 1.045 | |
| Wald Test for All Deciles | 16.4675 | 9 d.f., p= | 0.0577 | |
| Rescaled R-Squared | 0.0042 | |||
Table A.IV.
| Outcome | ICU LOS | * Controls for APACHE-predicted LOS * | ||
|---|---|---|---|---|
| Obs Used | 178657 | |||
| Subgroup | Full ICU LOS Data | |||
| Beta | 95%CI LL | 95%CI UL | ||
| Lower Census | Decile 1 | 0.143 | 0.018 | 0.268 |
| Decile 2 | 0.056 | -0.067 | 0.179 | |
| Decile 3 | 0.025 | -0.097 | 0.148 | |
| Decile 4 | 0.088 | -0.034 | 0.211 | |
| Ratio to Mean Census | Decile 5 | 0.117 | -0.007 | 0.242 |
| Decile 6 | reference | |||
| Decile 7 | -0.052 | -0.177 | 0.073 | |
| Decile 8 | 0.017 | -0.107 | 0.141 | |
| Higher Census | Decile 9 | 0.031 | -0.094 | 0.156 |
| Decile 10 | 0.048 | -0.081 | 0.177 | |
| F-Test for all Deciles | 1.77 | 9 d.f., p= | 0.0689 | |
| R-Squared | 0.186215 | |||
Table A.V.
| Outcome | In-Hospital Death | |||
|---|---|---|---|---|
| Strata | 108 | |||
| Obs Used | 196877 | |||
| Subgroup | All | |||
| Odds Ratio | 95%CI LL | 95%CI UL | ||
| Lower Census | Decile 1 | 1.073 | 0.997 | 1.155 |
| Decile 2 | 1.028 | 0.957 | 1.104 | |
| Decile 3 | 1.03 | 0.96 | 1.106 | |
| 14 Day Ratio to Mean Census | Decile 4 | 1.02 | 0.951 | 1.095 |
| Decile 5 | 1.003 | 0.935 | 1.076 | |
| Decile 6 | reference | |||
| Decile 7 | 1.052 | 0.981 | 1.128 | |
| Decile 8 | 1.039 | 0.968 | 1.115 | |
| Higher Census | Decile 9 | 1.102 | 1.027 | 1.183 |
| Decile 10 | 1.02 | 0.946 | 1.1 | |
| Wald Test for All Deciles | 12.1474 | 9 d.f., p= | 0.2051 | |
| Rescaled R-Squared | 0.3943 | |||
Table A.VI.
| Outcome | Transferred to Another Hospital | |||
|---|---|---|---|---|
| Strata | 108 | |||
| Obs Used | 196877 | |||
| Subgroup | All | |||
| Odds Ratio | 95%CI LL | 95%CI UL | ||
| Lower Census | Decile 1 | 1.029 | 0.935 | 1.133 |
| Decile 2 | 1.122 | 1.026 | 1.227 | |
| Decile 3 | 1.085 | 0.991 | 1.187 | |
| 14 Day Ratio to Mean Census | Decile 4 | 1.119 | 1.022 | 1.225 |
| Decile 5 | 1.023 | 0.933 | 1.121 | |
| Decile 6 | reference | |||
| Decile 7 | 1.005 | 0.916 | 1.103 | |
| Decile 8 | 0.953 | 0.868 | 1.046 | |
| Higher Census | Decile 9 | 1.01 | 0.921 | 1.108 |
| Decile 10 | 0.997 | 0.906 | 1.097 | |
| Wald Test for All Deciles | 24.7881 | 9 d.f., p= | 0.0032 | |
| Rescaled R-Squared | 0.0043 | |||
Table A.VII.
| Outcome | In-Hospital Death | |||
|---|---|---|---|---|
| Strata | 108 | |||
| Obs Used | 60454 | |||
| Subgroup | Post-Operative Patients | |||
| Odds Ratio | 95%CI LL | 95%CI UL | ||
| Lower Census | Decile 1 | 1.176 | 0.954 | 1.449 |
| Decile 2 | 1.026 | 0.837 | 1.258 | |
| Decile 3 | 1.021 | 0.836 | 1.247 | |
| Decile 4 | 0.966 | 0.788 | 1.185 | |
| Ratio to Mean Census | Decile 5 | 0.95 | 0.768 | 1.176 |
| Decile 6 | reference | |||
| Decile 7 | 0.961 | 0.776 | 1.19 | |
| Decile 8 | 1.04 | 0.852 | 1.27 | |
| Higher Census | Decile 9 | 0.963 | 0.783 | 1.185 |
| Decile 10 | 0.99 | 0.797 | 1.23 | |
| Wald Test for All Deciles | 6.0775 | 9 d.f., p= | 0.7321 | |
| Rescaled R-Squared | 0.1961 | |||
Table A.VIII.
| Outcome | In-Hospital Death | |||
|---|---|---|---|---|
| Strata | 108 | |||
| Obs Used | 136423 | |||
| Subgroup | Non-Post-Operative Patients | |||
| Odds Ratio | 95%CI LL | 95%CI UL | ||
| Lower Census | Decile 1 | 0.973 | 0.897 | 1.054 |
| Decile 2 | 0.936 | 0.864 | 1.014 | |
| Decile 3 | 0.961 | 0.887 | 1.04 | |
| Decile 4 | 0.989 | 0.914 | 1.071 | |
| Ratio to Mean Census | Decile 5 | 0.934 | 0.861 | 1.012 |
| Decile 6 | reference | |||
| Decile 7 | 0.986 | 0.909 | 1.069 | |
| Decile 8 | 1.054 | 0.971 | 1.144 | |
| Higher Census | Decile 9 | 1.012 | 0.933 | 1.098 |
| Decile 10 | 0.99 | 0.909 | 1.079 | |
| Wald Test for All Deciles | 13.8071 | 9 d.f., p= | 0.1294 | |
| Rescaled R-Squared | 0.3994 | |||
Table A.IX.
| Outcome | In-Hospital Death | |||
|---|---|---|---|---|
| Strata | 107 | |||
| Obs Used | 15464 | |||
| Subgroup | High Predicted Risk of Death | |||
| Odds Ratio | 95%CI LL | 95%CI UL | ||
| Lower Census | Decile 1 | 1.023 | 0.867 | 1.207 |
| Decile 2 | 0.876 | 0.747 | 1.029 | |
| Decile 3 | 0.995 | 0.85 | 1.166 | |
| Decile 4 | 0.936 | 0.798 | 1.098 | |
| Ratio to Mean Census | Decile 5 | 0.943 | 0.803 | 1.107 |
| Decile 6 | reference | |||
| Decile 7 | 0.962 | 0.819 | 1.13 | |
| Decile 8 | 1.168 | 0.986 | 1.384 | |
| Higher Census | Decile 9 | 0.997 | 0.844 | 1.179 |
| Decile 10 | 0.928 | 0.78 | 1.104 | |
| Wald Test for All Deciles | 14.3608 | 9 d.f., p= | 0.1101 | |
| Rescaled R-Squared | 0.1138 | |||
Table A.X.
| Outcome | In-Hospital Death | |||
|---|---|---|---|---|
| Strata | 108 | |||
| Obs Used | 152133 | |||
| Subgroup | Weekday Admissions | |||
| Odds Ratio | 95%CI LL | 95%CI UL | ||
| Lower Census | Decile 1 | 1.013 | 0.928 | 1.105 |
| Decile 2 | 0.924 | 0.848 | 1.007 | |
| Decile 3 | 0.968 | 0.890 | 1.052 | |
| Decile 4 | 0.977 | 0.899 | 1.062 | |
| Ratio to Mean Census | Decile 5 | 0.934 | 0.858 | 1.016 |
| Decile 6 | reference | |||
| Decile 7 | 0.979 | 0.901 | 1.064 | |
| Decile 8 | 1.043 | 0.960 | 1.133 | |
| Higher Census | Decile 9 | 0.971 | 0.894 | 1.054 |
| Decile 10 | 0.969 | 0.889 | 1.056 | |
| Wald Test for All Deciles | 11.953 | 9 d.f., p= | 0.216 | |
| Rescaled R-Squared | 0.390 | |||
Table A.XI.
| Outcome | In-Hospital Death | |||
|---|---|---|---|---|
| Strata | 108 | |||
| Obs Used | 44744 | |||
| Subgroup | Weekend Admissions | |||
| Odds Ratio | 95%CI LL | 95%CI UL | ||
| Lower Census | Decile 1 | 0.999 | 0.872 | 1.145 |
| Decile 2 | 0.999 | 0.871 | 1.145 | |
| Decile 3 | 0.974 | 0.848 | 1.120 | |
| Decile 4 | 0.994 | 0.861 | 1.147 | |
| Ratio to Mean Census | Decile 5 | 0.927 | 0.799 | 1.076 |
| Decile 6 | reference | |||
| Decile 7 | 1.003 | 0.859 | 1.170 | |
| Decile 8 | 1.094 | 0.937 | 1.278 | |
| Higher Census | Decile 9 | 1.117 | 0.948 | 1.316 |
| Decile 10 | 1.060 | 0.887 | 1.268 | |
| Wald Test for All Deciles | 8.1966 | 9 d.f., p= | 0.5145 | |
| Rescaled R-Squared | 0.405 | |||
Table A.XII.
| Outcome | In-Hospital Death | |||
|---|---|---|---|---|
| Strata | 37 | |||
| Obs Used | 67163 | |||
| Subgroup | Non-Teaching Hospital | |||
| Odds Ratio | 95%CI LL | 95%CI UL | ||
| Lower Census | Decile 1 | 0.974 | 0.852 | 1.113 |
| Decile 2 | 0.903 | 0.79 | 1.033 | |
| Decile 3 | 0.952 | 0.828 | 1.095 | |
| Decile 4 | 0.927 | 0.8 | 1.075 | |
| Ratio to Mean Census | Decile 5 | 0.919 | 0.799 | 1.056 |
| Decile 6 | reference | |||
| Decile 7 | 0.968 | 0.839 | 1.118 | |
| Decile 8 | 1.019 | 0.892 | 1.164 | |
| Higher Census | Decile 9 | 0.947 | 0.825 | 1.088 |
| Decile 10 | 0.993 | 0.865 | 1.14 | |
| Wald Test for All Deciles | 6.6208 | 9 d.f., p= | 0.6765 | |
| Rescaled R-Squared | 0.4025 | |||
Table A.XIII.
| Outcome | In-Hospital Death | |||
|---|---|---|---|---|
| Strata | 30 | |||
| Obs Used | 62958 | |||
| Subgroup | Small Teaching Hospital | |||
| Odds Ratio | 95%CI LL | 95%CI UL | ||
| Lower Census | Decile 1 | 0.941 | 0.828 | 1.07 |
| Decile 2 | 0.904 | 0.793 | 1.031 | |
| Decile 3 | 0.987 | 0.87 | 1.119 | |
| Decile 4 | 0.91 | 0.801 | 1.035 | |
| Ratio to Mean Census | Decile 5 | 0.881 | 0.77 | 1.008 |
| Decile 6 | reference | |||
| Decile 7 | 0.92 | 0.809 | 1.046 | |
| Decile 8 | 0.979 | 0.85 | 1.126 | |
| Higher Census | Decile 9 | 0.973 | 0.854 | 1.109 |
| Decile 10 | 0.91 | 0.798 | 1.038 | |
| Wald Test for All Deciles | 7.8223 | 9 d.f., p= | 0.5522 | |
| Rescaled R-Squared | 0.382 | |||
Table A.XIV.
| Outcome | In-Hospital Death | |||
|---|---|---|---|---|
| Strata | 41 | |||
| Obs Used | 66756 | |||
| Subgroup | Member of Council of Teaching Hospitals (COTH) | |||
| Odds Ratio | 95%CI LL | 95%CI UL | ||
| Lower Census | Decile 1 | 1.108 | 0.978 | 1.254 |
| Decile 2 | 1.029 | 0.918 | 1.155 | |
| Decile 3 | 0.949 | 0.848 | 1.061 | |
| Decile 4 | 1.077 | 0.967 | 1.198 | |
| Ratio to Mean Census | Decile 5 | 0.973 | 0.867 | 1.093 |
| Decile 6 | reference | |||
| Decile 7 | 1.044 | 0.93 | 1.172 | |
| Decile 8 | 1.124 | 1.002 | 1.261 | |
| Higher Census | Decile 9 | 1.043 | 0.927 | 1.174 |
| Decile 10 | 1.011 | 0.875 | 1.167 | |
| Wald Test for All Deciles | 12.889 | 9 d.f., p= | 0.1677 | |
| Rescaled R-Squared | 0.3981 | |||
Table A.XV.
| Outcome | In-Hospital Death | |||
|---|---|---|---|---|
| Strata | 108 | |||
| Obs Used | 196877 | |||
| Subgroup | All | |||
| Odds Ratio | 95%CI LL | 95%CI UL | ||
| Lower Census | Decile 1 | 0.958 | 0.890 | 1.030 |
| Decile 2 | 0.958 | 0.892 | 1.030 | |
| Decile 3 | 0.947 | 0.882 | 1.016 | |
| Absolute Difference from Mean Census | Decile 4 | 0.943 | 0.877 | 1.014 |
| Decile 5 | 0.928 | 0.862 | 0.999 | |
| Decile 6 | reference | |||
| Decile 7 | 0.93 | 0.864 | 1.001 | |
| Decile 8 | 0.995 | 0.925 | 1.069 | |
| Higher Census | Decile 9 | 0.999 | 0.928 | 1.075 |
| Decile 10 | 0.946 | 0.875 | 1.023 | |
| Wald Test for All Deciles | 10.335 | 9 d.f., p= | 0.324 | |
| Rescaled R-Squared | 0.3942 | |||
Table A.XVI.
| Outcome | In-Hospital Death | |||
|---|---|---|---|---|
| Strata | 108 | |||
| Obs Used | 178775 | |||
| Subgroup | Only first visit of first hospitalization | |||
| Odds Ratio | 95%CI LL | 95%CI UL | ||
| Lower Census | Decile 1 | 1.011 | 0.937 | 1.092 |
| Decile 2 | 0.953 | 0.883 | 1.028 | |
| Decile 3 | 0.967 | 0.896 | 1.042 | |
| Decile 4 | 0.987 | 0.915 | 1.065 | |
| Ratio to Mean Census | Decile 5 | 0.931 | 0.862 | 1.007 |
| Decile 6 | reference | |||
| Decile 7 | 0.995 | 0.921 | 1.076 | |
| Decile 8 | 1.036 | 0.959 | 1.119 | |
| Higher Census | Decile 9 | 0.994 | 0.920 | 1.074 |
| Decile 10 | 0.986 | 0.909 | 1.070 | |
| Wald Test for All Deciles | 10.6621 | 9 d.f., p= | 0.2996 | |
| Rescaled R-Squared | 0.4013 | |||
Table A.XVII.
| Outcome | Admitted after Cardiac Arrest | |||
|---|---|---|---|---|
| Strata | 108 | |||
| Obs Used | 196877 | |||
| Subgroup | All | |||
| Odds Ratio | 95%CI LL | 95%CI UL | ||
| Lower Census | Decile 1 | 1.041 | 0.893 | 1.213 |
| Decile 2 | 1.065 | 0.915 | 1.241 | |
| Decile 3 | 0.974 | 0.835 | 1.137 | |
| Decile 4 | 0.953 | 0.816 | 1.113 | |
| Ratio to Mean Census | Decile 5 | 1.072 | 0.917 | 1.253 |
| Decile 6 | reference | |||
| Decile 7 | 1.042 | 0.893 | 1.217 | |
| Decile 8 | 1.016 | 0.866 | 1.191 | |
| Higher Census | Decile 9 | 0.959 | 0.821 | 1.121 |
| Decile 10 | 0.919 | 0.784 | 1.078 | |
| Wald Test for All Deciles | 8.4609 | 9 d.f., p= | 0.4885 | |
| Rescaled R-Squared | 0.0003 | |||
Table A.XVIII.
| Outcome | Readmission to ICU within 7 Days of Discharge | |||
|---|---|---|---|---|
| Strata | 108 | |||
| Obs Used | 196877 | |||
| Subgroup | All | |||
| Odds Ratio | 95%CI LL | 95%CI UL | ||
| Lower Census | Decile 1 | 1.001 | 0.891 | 1.125 |
| Decile 2 | 0.986 | 0.88 | 1.105 | |
| Decile 3 | 1.02 | 0.911 | 1.143 | |
| Decile 4 | 1.078 | 0.963 | 1.206 | |
| Ratio to Mean Census | Decile 5 | 0.944 | 0.839 | 1.062 |
| Decile 6 | reference | |||
| Decile 7 | 1.007 | 0.895 | 1.132 | |
| Decile 8 | 1.004 | 0.896 | 1.126 | |
| Higher Census | Decile 9 | 1.034 | 0.922 | 1.16 |
| Decile 10 | 1.002 | 0.889 | 1.129 | |
| Wald Test for All Deciles | 5.9396 | 9 d.f., p= | 0.7459 | |
| Rescaled R-Squared | 0.0105 | |||
Table A.XIX.
| Outcome | ICU LOS | * Controls for APACHE-predicted LOS * | |||
|---|---|---|---|---|---|
| Obs Used | 178657 | ||||
| Subgroup | Full ICU LOS Data | ||||
| Beta | 95%CI LL | 95%CI UL | |||
| Lower Census | Decile 1 | -0.007 | -0.131 | 0.117 | |
| Decile 2 | 0.004 | -0.115 | 0.124 | ||
| Decile 3 | 0.016 | -0.102 | 0.135 | ||
| 14 Day Ratio to Mean Census | Decile 4 | -0.041 | -0.159 | 0.077 | |
| Decile 5 | -0.022 | -0.140 | 0.095 | ||
| Decile 6 | reference | ||||
| Decile 7 | 0.034 | -0.083 | 0.151 | ||
| Decile 8 | -0.051 | -0.170 | 0.067 | ||
| Higher Census | Decile 9 | -0.005 | -0.127 | 0.117 | |
| Decile 10 | 0.069 | -0.057 | 0.196 | ||
| F-Test for all Deciles | 0.61 | 9 d.f., p= | 0.7886 | ||
| R-Squared | 0.829409 | ||||
Footnotes
Dr. Kramer is employed by Cerner Corporation.
Dr. Kramer has stock ownership and stock options in Cerner Corporation.
All other authors have no potential conflicts of interest to disclose.
TJI has no potential or real conflicts of interest with this manuscript. AAK has no conflicts of interest; however, AAK an employee of the Cerner Corporation and own stock in such, which provides the APACHE data systems used as a basis of the analysis. JMK has no potential or real conflicts of interest with this manuscript.
References
- 1.Angus DC, Kelley MA, Schmitz RJ, et al. Current and Projected Workforce Requirements for Care of the Critically Ill and Patients With Pulmonary Disease. JAMA. 2000;2000(284):2762–2770. doi: 10.1001/jama.284.21.2762. [DOI] [PubMed] [Google Scholar]
- 2.Office of the Inspector General of the Department of Health and Human Services. Hospital Closure: 1999. 2001 [Google Scholar]
- 3.Birkmeyer JD, Dimick JB. Leapfrog Safety Standards: Potential Benefits of Universal Adoption. Washington, DC: The Leapfrog Group; 2004. [Google Scholar]
- 4.Hannan EL. Evaluating and Improving the Quality of Care for Acute Myocardial Infarction Can Regionalization Help? JAMA. 2006;295(18):2177–2179. doi: 10.1001/jama.295.18.2177. [DOI] [PubMed] [Google Scholar]
- 5.Barnato AE, Kahn JM, Rubenfeld GD, et al. Prioritizing the Organization and Management of Intensive Care Services in the United States: The PrOMIS Conference. Critical Care Medicine. 2007;35(4):1003–1006. doi: 10.1097/01.CCM.0000259535.06205.B4. [DOI] [PubMed] [Google Scholar]
- 6.Kahn JM, Goss CH, Heagerty PJ, et al. Hospital Volume and the Outcomes of Mechanical Ventilation. New England Journal of Medicine. 2006;355:41–50. doi: 10.1056/NEJMsa053993. [DOI] [PubMed] [Google Scholar]
- 7.lapichino G, Gattinoni L, Radrizzani D, et al. Volume of activity and occupancy rate in intensive care units. Association with mortality Intensive Care Medicine. 2004;30:290–297. doi: 10.1007/s00134-003-2113-4. [DOI] [PubMed] [Google Scholar]
- 8.Nathens AB, Jurkovich GJ, Maier RV, et al. Relationship Between Trauma Center Volume and Outcomes. JAMA. 2001;285(9):1164–1171. doi: 10.1001/jama.285.9.1164. [DOI] [PubMed] [Google Scholar]
- 9.Canto JG, Every NR, Magid DJ, et al. The Volume of Primary Angioplasty Procedures and Survival after Acute Myocardial Infarction. New England Journal of Medicine. 2000;342(21):1573–1580. doi: 10.1056/NEJM200005253422106. [DOI] [PubMed] [Google Scholar]
- 10.Magid DJ, Calonge BN, Rumsfeld JS, et al. Relation Between Hospital Primary Angioplasty Volume and Mortality for Patients With Acute MI Treated With Primary Angioplasty vs Thrombolytic Therapy. JAMA. 2000;284(24):3131–3138. doi: 10.1001/jama.284.24.3131. [DOI] [PubMed] [Google Scholar]
- 11.McGrath PD, Wennberg DE, Dickens JD, Jr, et al. Relation Between Operator and Hospital Volume and Outcomes Following Percutaneous Coronary Interventions in the Era of the Coronary Stent. JAMA. 2000;284(24):3139–3144. doi: 10.1001/jama.284.24.3139. [DOI] [PubMed] [Google Scholar]
- 12.Hannan EL, Wu C, Walford G, et al. Volume-Outcome Relationships for Percutaneous Coronary Interventions in the Stent Era. Circulation. 2005;112(8):1171–1179. doi: 10.1161/CIRCULATIONAHA.104.528455. [DOI] [PubMed] [Google Scholar]
- 13.Chen EW, Canto JG, Parsons LS, et al. Relation Between Hospital Intra-Aortic Balloon Counterpulsation Volume and Mortality in Acute Myocardial Infarction Complicated by Cardiogenic Shock. Circulation. 2003;108(8):951–957. doi: 10.1161/01.CIR.0000085068.59734.E4. [DOI] [PubMed] [Google Scholar]
- 14.Marcin JP, Romano PS. Impact of between-hospital volume and within-hospital volume on mortality and readmission rates for trauma patients in California. Critical Care Medicine. 2004;32(7):1477–1483. doi: 10.1097/01.ccm.0000127781.08985.03. [DOI] [PubMed] [Google Scholar]
- 15.Harrison DA, Lertsithichai P, Brady AR, et al. Winter excess mortality in intensive care in the UK: an analysis of outcome adjusted for patient case mix and unit workload. Intensive Care Medicine. 2004;30:1900–1907. doi: 10.1007/s00134-004-2390-6. [DOI] [PubMed] [Google Scholar]
- 16.Tarnow-Mordi WO, Hau C, Warden A, et al. Hospital mortality in relation to staff workload: a 4-year study in an adult intensive-care unit. The Lancet. 2000;356:185–189. doi: 10.1016/s0140-6736(00)02478-8. [DOI] [PubMed] [Google Scholar]
- 17.American College of Surgeons. Hospital's Pre-Review Questionnaire. 2005 [cited Available from: http://www.facs.org/trauma/prq.pdf.
- 18.Bradley EH, Herrin J, Wang Y, et al. Strategies for Reducing the Door-to-Balloon Time in Acute Myocardial Infarction. New England Journal of Medicine. 2006;355:2308–2320. doi: 10.1056/NEJMsa063117. [DOI] [PubMed] [Google Scholar]
- 19.Rivers E, Nguyen B, Havstad S, et al. Early Goal-Directed Therapy in the Treatment of Severe Sepsis and Septic Shock. New England Journal of Medicine. 2001;345(19):1368–1377. doi: 10.1056/NEJMoa010307. [DOI] [PubMed] [Google Scholar]
- 20.Knaus W, Wagner D, Zimmerman J, et al. Variations in mortality and length of stay in intensive care units. Annals of Internal Medicine. 1993;118(10):753–761. doi: 10.7326/0003-4819-118-10-199305150-00001. [DOI] [PubMed] [Google Scholar]
- 21.Zimmerman JE, Kramer AA, McNair DS, et al. Intensive care unit length of stay: Benchmarking based on Acute Physiology and Chronic Health Evaluation (APACHE) IV. Critical Care Medicine. 2006;34(10):2517–2529. doi: 10.1097/01.CCM.0000240233.01711.D9. [DOI] [PubMed] [Google Scholar]
- 22.Zimmerman JE, Kramer AA, McNair DS, et al. Acute Physiology and Chronic Health Evaluation (APACHE) IV: Hospital mortality assessment for today's critically ill patients. Critical Care Medicine. 2006;34(5):1297–1310. doi: 10.1097/01.CCM.0000215112.84523.F0. [DOI] [PubMed] [Google Scholar]
- 23.Allison PD. Fixed Effects Regression Methods for Longitudinal Data Using SAS. SAS Publishing; 2005. [Google Scholar]
- 24.Nagelkerke NJD. A Note on a General Definition of the Coefficeint of Determination. Biometrika. 1991;78:691–692. [Google Scholar]
- 25.Kane RL, Shamliyan TA, Mueller C, et al. The Association of Registered Nurse Staffing Levels and Patient Outcomes: Systematic Review and Meta-Analysis. Medical Care. 2007;45(12):1195–1204. doi: 10.1097/MLR.0b013e3181468ca3. [DOI] [PubMed] [Google Scholar]
- 26.Pines J, Hollander J, Localio A, et al. The association between emergency department crowding and hospital performance on antibiotic timing for pneumonia and percutaneous intervention for myocardial infarction. Academic Emergency Medicine. 2006;13(8):873–878. doi: 10.1197/j.aem.2006.03.568. [DOI] [PubMed] [Google Scholar]
- 27.Schull M, Vermuelen M, Slaughter G, et al. Emergency department crowding and thrombolysis delays in acute myocardial infarction. Annals of Emergency Medicine. 2004;44:577–585. doi: 10.1016/j.annemergmed.2004.05.004. [DOI] [PubMed] [Google Scholar]
- 28.Fishman PE, Shofer FS, Robey JL, et al. The Impact of Trauma Activations on the Care of Emergency Department Patients With Potential Acute Coronary Syndromes. Annals of Emergency Medicine. 2006;48(4):347–353. doi: 10.1016/j.annemergmed.2006.02.021. [DOI] [PubMed] [Google Scholar]
- 29.Sprivulis P, DaSilva J, Jacobs I, et al. The association between hospital overcrowding and mortality among patients admitted via Western Australian emergency departments. Medical Journal of Australia. 2006;184(5):208–212. doi: 10.5694/j.1326-5377.2006.tb00416.x. [DOI] [PubMed] [Google Scholar]
- 30.Richardson DB. Increase in patient mortality at 10 days associated with emergency department overcrowding. Medical Journal of Australia. 2006;184(5):213–216. doi: 10.5694/j.1326-5377.2006.tb00204.x. [DOI] [PubMed] [Google Scholar]
- 31.Aiken LH, Clarke SP, Sloane DM, et al. Hospital Nurse Staffing and Patient Mortality, Nurse Burnout, and Job Dissatisfaction. JAMA. 2002;288(16):1987–1993. doi: 10.1001/jama.288.16.1987. [DOI] [PubMed] [Google Scholar]
- 32.La Porte TR, Rochlin GI, Roberts KH. The Self-Designing High Reliability Organization: Aircraft Carrier Flight Operations At Sea. Naval War College Review. 1987 Autumn;90:76–90. [Google Scholar]
- 33.La Porte TR. High Reliability Organizations: Unlikely, Demanding, and At Risk. Journal of Contingencies and Crisis Management. 1996;4(2):60–72. [Google Scholar]
- 34.Gauthier AK, Davis K, Schoenbaum SC. Achieving a High-Performance Health System: High Reliability Organizations within a Broader Agenda. HSR: Health Services Research. 2006;41(4p2):1710–1720. doi: 10.1111/j.1475-6773.2006.00617.x. [DOI] [PMC free article] [PubMed] [Google Scholar]
- 35.Pronovost PJ, Berenholtz SM, Goeschel CA, et al. Creating High Reliability in Health Care Organizations. HSR: Health Services Research. 2006;41(4):1599–1617. doi: 10.1111/j.1475-6773.2006.00567.x. [DOI] [PMC free article] [PubMed] [Google Scholar]
- 36.Angus DC, Black N. Improving care of the critically ill: institutional and healthcare system approaches. Lancet. 2004;363:1314–1320. doi: 10.1016/S0140-6736(04)16007-8. [DOI] [PMC free article] [PubMed] [Google Scholar]
- 37.Mullins RJ, Veum-Stone J, Helfand M, et al. Outcomes of Hospitalized Injured Patients After Institution of a Trauma System in an Urban Area. JAMA. 1994;271(24):1919–1924. doi: 10.1001/jama.1994.03510480043032. [DOI] [PubMed] [Google Scholar]
- 38.Demetriades D, Martin M, Salim A, et al. The Effect of Trauma Center Designation and Trauma Volume on Outcome in Specific Severe Injuries. Annals of Surgery. 2005;242:512–519. doi: 10.1097/01.sla.0000184169.73614.09. [DOI] [PMC free article] [PubMed] [Google Scholar]
- 39.Demetriades D, Martin M, Salim A, et al. Relationship Between American College of Surgeons Trauma Center Designation and Mortality in Patients with Severe Trauma (Injury Severity Score > 15) Journal of the American College of Surgeons. 2006;202:212–215. doi: 10.1016/j.jamcollsurg.2005.09.027. [DOI] [PubMed] [Google Scholar]
- 40.Durham R, Pracht E, Orban B, et al. Evaluation of a Mature Trauma System. Annals of Surgery. 2006;243:775–785. doi: 10.1097/01.sla.0000219644.52926.f1. [DOI] [PMC free article] [PubMed] [Google Scholar]
- 41.MacKenzie EJ, Rivara FP, Jurkovich GJ, et al. A National Evaluation of the Effect of Trauma-Center Care on Mortality. New England Journal of Medicine. 2006;354(4):366–378. doi: 10.1056/NEJMsa052049. [DOI] [PubMed] [Google Scholar]
- 42.Krumholz HM, Normand SLT, Spertus JA, et al. Measuring Performance for Treating Heart Attacks and Heart Failure: The Case for Outcomes Measurement. Health Affairs. 2007;26(1):75–85. doi: 10.1377/hlthaff.26.1.75. [DOI] [PubMed] [Google Scholar]
- 43.Kahn JM, Linde-Zwirble WT, Wunsch H, et al. Potential Value of Regionalized Intensive Care for Mechanically Ventilated Medical Patients. American Journal of Respiratory and Critical Care Medicine. 2008;177:285–291. doi: 10.1164/rccm.200708-1214OC. [DOI] [PMC free article] [PubMed] [Google Scholar]
- 44.Birkmeyer JD, Birkmeyer CM, Wennberg DE, et al. Leapfrog safety standards: potential benefits of universal adoption. Washington: The Leapfrog Group; 2000. [Google Scholar]
- 45.Wunsch H, Rowan K, Angus DC. International Comparisons in Critical Care: A Necessity and Challenge. Current Opinion in Critical Care. 2007;13(6):725–731. doi: 10.1097/MCC.0b013e3282f1bb56. [DOI] [PubMed] [Google Scholar]