

Abstract
Using a highly reproducible and robust cell-based HTS assay, the authors screened a 100,000 compound library at 14 and 114 μM compound concentration against influenza strain A/Udorn/72 (H3N2). The “hit” rates (>50% inhibition of the viral cytopathic effect) from the 14 and 114 μM screens were 0.022% and 0.38%, respectively. The hits were evaluated for their antiviral activity, cell toxicity and selectivity in dose response experiments. The screen at the lower concentration yielded three compounds, which displayed moderate activity (SI50 = 10-49). Intriguingly, the screen at the higher concentration revealed several additional hits. Two of these hits were highly active with an SI50 > 50. Time of addition experiments revealed one compound that inhibited early and four other compounds that inhibited late in the virus life cycle; suggesting they affect entry and replication, respectively. The active compounds represent several different classes of molecules such as carboxanilides, 1-benzoyl-3-arylthioureas, sulfonamides and benzothiazinones, which have not been previously identified as having anti-viral/anti-influenza activity.
Keywords: influenza, HTS, high-throughput screening, antivirals
Introduction
Influenza viruses are negative-sense, single-stranded RNA viruses that infect the upper and lower respiratory tracts and cause substantial morbidity and mortality annually (1). In the United States, approximately 36,000 deaths are attributed to influenza or its complications each year (2-4). Influenza A viruses, which also infect a wide number of avian and mammalian species, pose a considerable public health burden with epidemic and pandemic potential (5,6). Approximately 20 to 40 percent of the world's population became ill during the catastrophic “Spanish” flu pandemic in 1918 which killed 675,000 people in the U.S. and an estimated 40–50 million people worldwide. The “Asian” flu pandemic of 1957 resulted in the deaths of approximately 69,800 people in the U.S. and 2.0 to 7.4 million worldwide (7). The current health burden of epidemic influenza, and the potential threat of a pandemic, has increased effort towards the discovery and development of antivirals and vaccines for the treatment of influenza disease.
Antiviral drugs for treatment of influenza target four of the ten influenza virus proteins; hemagglutinin (HA), neuraminidase (NA), M2 ion channel protein (M2) and polymerase (PA) (8). These include oseltamivir (NA), zanamivir (NA), amantadine (M2), rimantadine (HA) and ribavirin (PA). Of these, only oseltamivir and zanamivir are recommended for treatment of seasonal influenza in 2007-8 by the Centers for Disease Control and Prevention (9). Ribavirin 5′-monophosphate resembles GMP and can decrease cellular GTP pools due to the inhibition of the enzyme inosine monophosphate dehydrogenase (IMPDH); however, this decrease does not completely account for the observed antiviral activity for many viruses. Inhibitory effects have also been noted on the capping (10) and translation efficiency (11) of viral mRNA, as well as a direct suppressive effect on the viral polymerase activity in the case of influenza virus (10,12,13).
Remarkably, the most effective antivirals target each of the three surface proteins, M2, HA and NA. M2 acts as an ion channel during the early stages of entry. The two other surface proteins, HA and NA, are used to subtype influenza viruses with H1, H2, H3, N1, and N2 associated with human infections. HA binds to host cell sialic acid cell receptors facilitating penetration of epithelial cells by the virus. NA catalyzes the cleavage of sialic acid residues from glycoproteins, which allows the virus to bud from the plasma membrane unabated and hence, aides in virus spread. One drawback of current antivirals is that they must be administered within 48 hours of the onset of symptoms to be efficacious. Moreover, oseltamivir and zanamivir are expensive and time-consuming to synthesize. Recently, resistant variants to these drugs have also emerged. Whereas antivirals have played a key role in treatment, vaccines have and will continue to play a dominant role in the prevention of influenza (8). However, the design of effective influenza vaccines can be hindered by antigenic variation of NA and reassortment of HA and NA genes (14). Every year the influenza vaccine contains predicted influenza virus strain variants that have been derived from the surveillance of characterized virus strains from the previous year. Furthermore, in contrast to antivirals, vaccines can not be developed until a new viral strain emerges (15,16).
Clearly, the continued emergence of new influenza variants, drug-resistant mutants and potential pandemic strains demands our attention toward the discovery and development of more effective antiviral therapeutics. High-throughput screening (HTS) offers an important tool in acceleration of the discovery of new antiviral leads for new and emerging pathogens such as SARS CoV (17) and pandemic influenza. Toward this, we previously reported the development of a cell-based HTS that monitors virus-induced cytopathic effects (CPE) in MDCK cells (18). Unlike target-oriented approaches, this CPE HTS approach has the advantage that multiple targets can be screened in a single assay against any target involved in viral infection. Confirmatory assays that consist of dose response in a HTS format are easy to perform and provide valuable cytotoxicity data. In addition, lead compounds or unique targets can be identified for structure activity relationships (SAR). To date, we have screened 1.6 million compounds at BSL-2 and greater than 200,000 compounds at BSL3 using this cell-based viability assay for influenza. We have employed this assay to screen 100,000 compounds from ChemBridge at 14 and 114 μM. We report the discovery of 5 hits with anti-influenza activity. Four compounds, ARB-06-003174 (AACF-308027), ARB-06-011087 (AACF-316018), ARB-06-076399 (AACF-381531), and ARB-06-089154 (AACF-394288) showed inhibition late in the virus lifecycle (6 hr post-infection) suggesting they are affecting replication of the virus. Compound 06-018302 (323316) was efficacious early in the virus life cycle (0-3 hr post-infection) indicating it is affecting entry of the virus.
Materials and Methods
Cell growth conditions and media
Madin Darby Canine Kidney cells (ATCC CCL-34, American Tissue Culture Type) were maintained as adherent cell lines in Eagle minimum essential medium with 2 mM L-glutamine and 10% fetal bovine serum (FBS) at 37°C in a humidified 5% CO2 atmosphere as described previously (18). Cells were passaged as needed and harvested from flasks using 0.25% trypsin-EDTA. HTS validation included establishment of the coefficient of variation (CV) for the MDCK cells to ensure assay quality and read stability (18). Thus, cells used for the assay were not used past passage 70.
Compound library and controls
The positive control drug for this assay, ribavirin (12) (#196066, MP Biomedicals, Solon, OH) was solubilized at 8 mg/ml in dimethyl sulfoxide (DMSO; Sigma, St. Louis, MO). The stock solution was diluted to final concentration of 164 μM in assay media (DMEM without phenol red, 1.5% BSA, 4 mM L-glutamine, 100 U/mL penicillin and 100 μg/ml streptomycin; Gibco, Grand Island, NY) before each experiment and discarded afterwards. Final DMSO concentration in each well was 0.5%.
A collection of compounds selected for their conformance with the Lipinski rules (21) were purchased solubilized at 1 mg/mL in DMSO from ChemBridge Corporation (San Diego, CA). Before each experiment, all compounds were diluted to approximately 14 or 114 μM in assay media for the screen.
Influenza high-throughput screen
The high-throughput screen for the identification of potential inhibitors of Influenza virus has been previously described (18). Briefly, MDCK cells (3 × 10⁵ cells/mL) were dispensed into black, clear-bottom, 384-well plates at a density of 6,000 cells/well in 20 μl assay medium, using a WellMate (Matrix, Hudson, NH) and incubated 24 h at 37° C, 5% CO2, with high humidity. The next day, 5 μl of each compound was added to cells using a Biomek FX liquid handler (Beckman Coulter, Fullerton, CA). This resulted in a final drug concentration of 14 μM (0.5% DMSO) or 114 μM (<1% DMSO) for all samples. Within 30 min of compound addition, cells were infected with 5 μl of diluted virus at a concentration of 100 TCID50 doses using a WellMate (MOI of 0.005 PFU/cell). Virus was diluted from amplified virus stock prepared in egg allantoic fluid into assay media containing 15 mg/mL of N-acetyl trypsin, for a final virus stock dilution of 1:10,000 and a final N-acetyl trypsin concentration of 2.5 μg/mL. Internal controls consisted of wells containing cells only, cells infected with virus, and virus infected cells treated with ribavirin. Plates were incubated at 37° C, 5% CO2, for 72 h. After incubation, 30 μl of Cell Titer Glo (Promega, Madison, WI) were added to each well using a WellMate and incubated at RT for 10-30 min. Luminescence was measured using a Envision plate reader (Perkin Elmer, Wellesley, MA).
Secondary confirmatory assays
For dose response assays, compounds were serially diluted in serum-free media containing 0.5% DMSO final per well in a plate to plate matrix rather than in a well to well matrix. This allows 320 compounds in one plate to be diluted together resulting in a 10 point dose response dilution series. This method is referred to as “stacked plate”. It can be visualized as a serial dilution series proceeding vertically through a stack of plates with the high dose plate on top and the low dose plate on the bottom (final plate well concentration ranging from 147 μM to 0.285 μM and a final DMSO concentration of ≤1%). Plate to plate variability was controlled by normalizing the compound data using in-plate controls. Cell only values equal 100% inhibition of CPE and virus values equal 0% inhibition. For compounds, the percent inhibition is calculated as follows: 100*(Cmpd Lum - Median Virus Ctrl)/(Median Cell Ctrl - Med Virus Ctrl). We control for positional variation during assay development and validation where methods are developed to minimize or eliminate positional artifacts such as edge effects.
Plaque assay
We developed a plaque assay to confirm antiviral compound effect and determine the potency of “hit” compounds. This was accomplished by indirectly quantifying the amount of virus by staining for the presence of the influenza strain A/Udorn/72 N-protein. Briefly, 1 mL of MDCK cells (3 × 10⁵ cells/mL) were dispensed into 12-well plates and incubated 24 h at 37 °C, 5% CO2, with high humidity. The next day, media was removed and cells were infected with 200 μl of 100 TCID50 which corresponds to an MOI of 0.005 PFU/cell for 1 h adsorption at 37°C. Media was replaced after infection with 1 mL of media containing compounds to a final compound concentration of 57μM (0.5% DMSO) and plates were returned to 37°C. The infectious progeny virus produced in the supernatant were harvested after 48 h and measured with a low-viscosity-overlay plaque assay in conjunction with an immunostaining method. In brief, 50 μl from ten-fold serial dilutions of the supernatants were made in cell culture medium and were added to monolayers of MDCK cells in 96-well plates. The plates were incubated for 1 h at 37 °C and then 50 μl of the cell culture medium containing 2% of Avicel™ RC/CL (FMC Biopolymer, Princeton, NJ) was added into each well and returned to 37°C. 24 h later, cells were fixed with 4% paraformaldehyde in PBS and immunostained for viral N protein as described (19), but with some minor modifications. To detect the influenza N-protein, we used a goat polyclonal antibody made against influenza A virus (strain H3N2) (Virostat Inc. Portland, ME) for the primary antibody and a peroxidase-labeled anti-goat antibody for the secondary antibody; both were used at a dilution of 1 to 1,000. The plaque was developed with the peroxidase substrate, True Blue™ (KPL, Gaithersburg, MD). Measurements were performed in triplicate for each dilution of sample tested.
Time of addition compound screen
MDCK cells were plated in 96 well black tissue culture plates at 15,000 cells per well in 100 μl and incubated 24 h at 37°C, 5% CO2. Lead candidate compounds were diluted in media to give a final concentration of 57 μM and added to plates at -1, 0, 3, 6, 12 and 24 h post-infection. Cells were infected with influenza A/Udorn/72 at an MOI of 0.1 and were incubated at 37°C, 5% CO2. After 72 h, 20 μl MTS was added and plates were incubated an additional 2 h at 37°C, 5% CO2. Plates were read at an absorbance of 490nm on an Envision plate reader. Ribavirin was used as a control compound at a final concentration of 82μM.
Data analysis
Data was analyzed using ActivityBase software (IDBS, Inc, Guildford, UK). Percent cytopathic effect (CPE) inhibition was defined as *100. The definition of *100 is 100% Inhibition of Virus is equal to 100 times 1 minus the test compound minus the median of the virus divided by the median of the cell control minus the median of the virus (Inhibition of Virus = 100*(1 − (Test compound - Median Virus)/(Median Cells − Median Virus)). The cell viability is calculated separately in the Dose Response assays. Percent cell viability was defined as (test compound/cell control)*100. An active compound, or “hit”, was defined as a compound that exhibited a %CPE inhibition of >50% without compromising cell viability. Ten concentrations of each drug were added to 384 well plates in triplicate to measure the effective concentration at which the drug inhibited cell death at 50% in the presence (EC50) or absence of virus (IC50); with the IC50 defined as the cytotoxicity of the drug alone at 50%. The selective index (SI) was calculated as SI=IC50/EC50.
The Z factor values were calculated from 1 minus (3*standard deviation of cell control (σc) plus 3* standard deviation of the virus control (σv)/[mean cell control signal (μc) minus mean virus control signal (μv)] (20). The signal/background (S/B) was calculated from mean cell control signal (μc) divided by the mean virus control signal (μv). The signal/noise (S/N) was calculated from mean cell control signal (μc) minus mean virus control signal (μv) divided by the (standard deviation of the cell control signal (σc)2 minus the standard deviation of the virus control signal (σv))1/2.
Results and Discussion
Compound Screening Results
In an effort to identify a palette of novel lead compounds acting through new mechanisms, we employed a high-throughput cell-based assay that measures the influenza virus-induced CPE in MDCK cells (18). We screened a library of 100,000 compounds, which were selected for diversity and drug-likeness using the Lipinski criteria for drug-like compounds (21). A majority of this library of compounds, for example, had molecular weight ∼ 350, CLogP value ∼ 3.5, number of rotatable bonds ∼ 4, Topological Polar Surface Area (tPSA) ∼ 60 Å2 (22), hydrogen bond donors < 3, and hydrogen bond acceptors < 5, and were devoid of compounds with reactive functional groups. The selected library contained a variety of heterocyclic compounds such as: pyrroles, furans, thiophenes, indoles and their benzo analogs, isoindolines, imidazoles, pyrazoles, triazoles, isoxazoles, thiazoles, oxadiazoles, thiadiazoles, pyridines, quinolines, pyridazines, pyrimidines, pyrazines, quinazolines, quinoxalines, pyrrolidines, piperazines and morpholines. The initial screening was performed in duplicate at a concentration of 14 μM (Figure 1A). We identified 22 compounds that showed >50% inhibition of the influenza virus strain A/Udorn/72 for a “hit” rate of 0.022%. The screen at 14 μM gave very few hits, hence, a subset of 16,000 compounds was run 114 μM (Figure 1B) concentration to ascertain if our screening window lacked sensitivity for detection of hits. Indeed, we identified an additional 74 compounds that displayed >50% inhibition of the influenza virus for a hit rate of 0.46% in this pilot. This is an approximate twenty-one fold increase in the hit rate as compared to the screen at 14 μM (Figure 1A). Given the greater success, we screened the remaining 84,000 compounds at 114 μM with the recognition that our false positive rate would likely increase in the primary screen. The additional screening activity resulted in an additional 307 hits. In total, we identified an additional 381 compounds that displayed >50% inhibition of CPE by influenza virus for a hit rate of 0.38%. This was an approximate seventeen-fold increase in the hit rate as compared to screening at 14 μM. Four of the 381 compounds identified were previously discovered in the 14 μM screen; ARB-06-01916 (AACF-315846), ARB-06-067453 (AACF-372583), ARB-06-076399 (AACF-381531) and ARB-06-089154 (AACF-394288).
Fig. 1.


ChemBridge library screen of 16,000 compounds. (A) Average of duplicate ChemBridge compound screen at 14 μM. (B) ChemBridge screen at 114 μM. Compounds from ChemBridge, along with the influenza A/Udorn/72, were added to 6 ×10³ MDCK cells per well in 384-well plates. Inhibitory effects were assessed after 72 h as described in the Materials and Methods. Control drug used was ribavirin. CPE = cytopathic effect.
The hits were evaluated by measuring their antiviral activity, cell toxicity and selectivity in dose response experiments. We set our selective index (SI50) as follows: <4, not active; SI50 = 4-9, slightly active; SI = 10-49, moderately active; SI50 >50 highly active. Seven of compounds were slightly active, seventeen were moderately active and two were highly active. The EC50 curves of all the compounds, except for two, never reached the 90% effective range; due to the observed cellular toxicity of these compounds at higher concentrations. The inhibitory activities of selected compounds are shown in Table 1 and Figure 2.
Table 1.
Structures and Inhibitory Activities of Selected Compounds (μM)
| ARB Number | Structure | % Inhibition Cytopathic effect | EC50 μM | EC90 μM | IC50 μM | IC90 μM | SI50 | SI90 |
|---|---|---|---|---|---|---|---|---|
| 06-047279 | 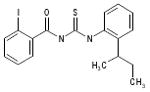 |
71 | 2.8 | >136.9 | >136.9 | >136.9 | >49.7 | 0 |
| 06-076399 | 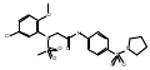 |
67 | 3.0 | >119.5 | >119.5 | >119.5 | >39.8 | 0 |
| 06-100378 | 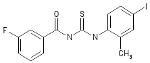 |
52 | 3.1 | >144.8 | >144.8 | >144.8 | >46.7 | 0 |
| 06-067081 | 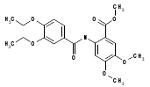 |
70 | 3.5 | >148.7 | >148.7 | >148.7 | >41.9 | 0 |
| 06-039665 | 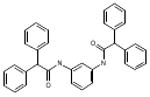 |
55 | 4.6 | >120.8 | 5.9 | >120.8 | 1.3 | 0 |
| 06-066995 | 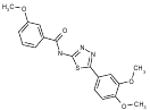 |
54 | 4.8 | >161.5 | >161.5 | >161.5 | >33.8 | 0 |
| 06-046310 | 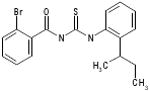 |
71 | 5.4 | 20.3 | >255.5 | >255.5 | >47.3 | >32.2 |
| 06-039422 | 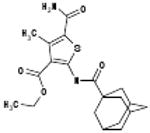 |
48 | 6.1 | >153.7 | >153.7 | >153.7 | >25.1 | 0 |
| 06-072422 | 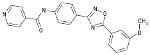 |
64 | 8.2 | >161.1 | >161.1 | >161.1 | >19.6 | 0 |
| 06-070333 | 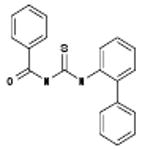 |
54 | 9.8 | 81.0 | 26.9 | >300.8 | 2.7 | >3.7 |
| 06-089154 | 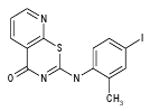 |
59 | 9.8 | >151.8 | >151.8 | >151.8 | >15.4 | 0 |
| 06-100287 | 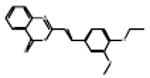 |
55 | 10.3 | >186.1 | >186.1 | >186.1 | >18.1 | 0 |
| 06-069269 | 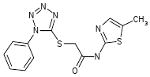 |
53 | 11.5 | >180.5 | >180.5 | >180.5 | >15.7 | 0 |
| 06-003174 | 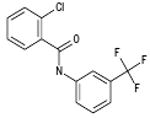 |
60 | 13.7 | >200.2 | 188.7 | >200.2 | 13.8 | 0 |
| 06-011087 | 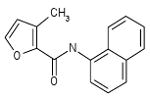 |
63 | 15.2 | >238.8 | >238.8 | >238.8 | >15.7 | 0 |
| 06-015735 | 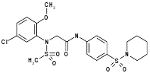 |
75 | 15.5 | >116.3 | >116.3 | >116.3 | >7.5 | 0 |
| 06-060912 | 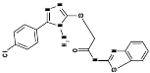 |
80 | 16.5 | >143.9 | >143.9 | >143.9 | >8.7 | 0 |
| 06-061324 | 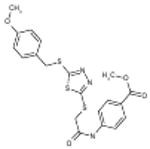 |
51 | 18.9 | >143.9 | >143.9 | >143.9 | >7.6 | 0 |
| 06-023109 | 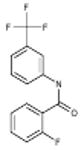 |
52 | 19.0 | >193.8 | >193.8 | >193.8 | >10.2 | 0 |
| 06-018302 | 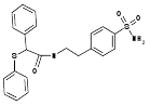 |
75 | 19.0 | >130 | >130 | >130 | >6.8 | 0 |
| 06-094955 |  |
54 | 25.0 | >248.7 | 206.5 | >248.7 | 8.3 | 0 |
| 06-001447 | 56 | 25.2 | >239.7 | >239.7 | >239.7 | >9.5 | 0 |
Fig. 2.
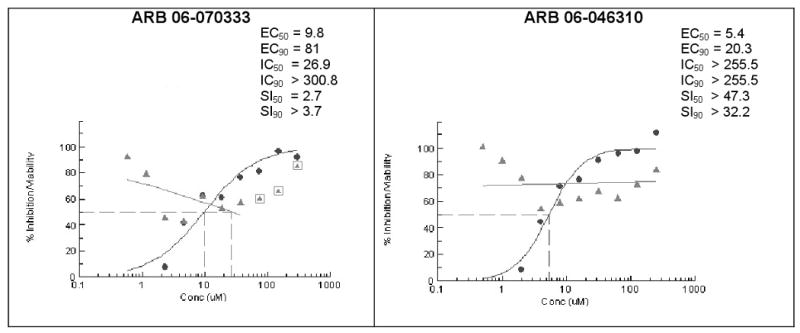
Dose-response confirmation of influenza inhibitor compounds. The EC, IC and SI values (●) are shown for ARB (AACF ID) numbers: ARB 06-070333 (AACF-375463) and ARB 06-046310 (AACF-351438). In parallel experiments, median inhibitory concentrations (Δ) (IC50 and IC90 drug concentrations that reduces cell viability by 50 and 90%, respectively) and selective indices (SI = IC/EC) at 72 hrs post-infection were also determined and are indicated.
Among these compounds, the two compounds the bissulfonamide, ARB-06-076399 and the pyridothiazinone, ARB-06-089154 were chosen as interesting lead compounds on the basis of several considerations including the fact that these two displayed at least three-log reduction from the control (pfu/mL) in a preliminary plaque reduction assay. A substructure search for analogues of these two compounds led to the identification of a total of 45 commercially available compounds as closely related analogues. Samples of these 45 compounds were procured and evaluated in dose response and toxicity assays against H3N2 virus. Two of these compounds were moderately active (SI50 = 10-49). Interestingly, two of the compounds; the 1-benzoyl-3-arylthioureas ARB-06-070333 (AACF-375463) and ARB-06-046310 (AACF-351438) displayed SI90 values of >3.7 and > 32.2 μM, respectively (Table 1 and Figure 2). Overall, we observed a 0.4% hit rate for compounds that inhibited CPE by >40%, with an 8% confirmation of hits by dose response based upon the criteria that a hit is confirmed if the compound has an SI50 value of greater than 4.
We have developed a plaque reduction assay for influenza virus in a 96-well format, which was used to screen 21 selected compounds from Table 1 as a confirmatory screen. The plaque reduction assays were performed in duplicate per compound. As is shown in Figure 3 and Table 2, seven of these compounds (33%) exhibited a two–log reduction or > 100 fold difference from the control in pfu/ml. These compounds are the carboxanilides ARB-06-003174 (AACF-308027) and ARB-06-011087 (AACF-316018), the 1-benzoyl-3-arylthioureas ARB-06-047279 (AACF-352407) and ARB-06-100378 (AACF-405513), the pyridothiazinone ARB-06-089154 (AACF-394288) and the sulfonamides ARB-06-018302 (AACF-323316) and ARB-06-076399 (AACF-381531).
Fig. 3.

Plaque reduction assay in MDCK cells. Influenza A/Udorn/72 (H3N2) was assayed for its sensitivity to twenty-one compounds. Supernatants were harvested from test (57 μM) or control compound (82 μM) treated influenza-infected MDCK cells at an MOI of 0.1. Serial ten-fold dilutions of the supernatants were added to monolayers of MDCK cells in 96-well plates. Cells were fixed after 24 h and immunostained. Plaque reduction assays were performed in triplicate per compound. CC indicates the uninfected cell control. VC indicates the untreated virus-infected control. RBV, ribavirin.
Table 2.
Influenza Virus (H3N2) Plaque Assay
| ARB Number | PFU | Log Reduction |
|---|---|---|
| Virus Control | 31255556 | 0 |
| 06-003174 | 1783 | 4 |
| 06-011087 | 14833 | 3 |
| 06-018302 | 2000 | 4 |
| 06-047279 | 1716 | 4 |
| 06-100378 | 1668000 | 1 |
| 06-076399 | 5750 | 3.5 |
| 06-089154 | 370 | 5 |
Finally, we employed an assay to determine the point in the influenza virus lifecycle that the DR and plaque assay hits inhibited. This screen allowed us to ascertain if the inhibition activity of the compound was early (entry) or late (replication) in the virus life cycle. In this screen, compounds were added in triplicate to plates at time points -1, 0, 3, 6, 12 and 24 hours p.i. (Figure 4). Four of these seven compounds, ARB-06-003174 (AACF-308027), ARB-06-011087 (AACF-316018), ARB-06-076399 (AACF-381531), and ARB-06-089154 (AACF-394288) showed activity 6 h p.i. suggesting they affect replication. Compound 06-018302 (323316) was efficacious early in the virus life cycle (0-3 h p.i.) indicating it is affecting entry of the virus. The results of compound ARB-06-047279 (AACF-352407) are inconclusive. Compound ARB-06-100378 (AACF-405513) showed a flat curve over the time course indicating no antiviral effect.
Fig. 4.

Time of addition compound screen against influenza A/Udorn/72 (H3N2). MDCK cells were plated in 96 well black tissue plates at 15,000 cells per well and incubated 24 h at 37°C, 5% CO2. Test compounds were diluted in media to give a final concentration of 57 μM and added to plates at time points -1, 0, 3, 6, 12 and 24 h post infection. Cells were infected with influenza A/Udorn/72 at an MOI of 0.1 and incubated 72 h at 37°C, 5% CO2. MTS was added and plates were incubated for an additional 2 h at 37°C, 5% CO2. The plates were read at an absorbance of 490nm on an Envision plate reader. Ribavirin was used as a control compound.
The aim of this study was to discover new potential influenza antiviral lead compounds using our high-throughput cell-based assay as the primary screen. In addition, we compared the effectiveness at a low (14 μM) and high concentration (114 μM) of compound. Of the total number of compounds screened, only 26 compounds met our criteria of activity: the efficacy EC50 value of <25 μM and with toxicity to efficacy SI50 of >10. We performed structure-activity relationship (SAR) analysis of each of these hits to identify and choose the most promising lead compounds. We selected 21 compounds for further analysis. In the plaque reduction assay, we identified seven compounds that exhibited a two–log reduction or > 100 fold difference from the control in pfu/mL. These compounds are grouped by structural class and the structures given in Figure 5. In view of these data, we believe that the design, synthesis, and evaluation of targeted analogues of these various scaffolds in an iterative fashion should lead us toward the identification of compounds possessing greatly improved potency and selectivity that can be developed into clinically useful therapeutic agents.
Fig. 5.

Structures of lead candidates
Acknowledgments
We appreciate the technical assistance of Sara McKellip, Clinton Maddox, Lakshmi Reddy, and Anna Manouvakhova. This work was supported by National Institutes of Health contract N01-AI-30047 (Dr. Michael Murray, principle investigator [PI]; Dr. Colleen B. Jonsson [Co-PI]). The compounds were made available for screening through NIAID N01-AI-15449 HTS Tuberculosis Drug Screening, Robert C. Goldman, project officer.
References
- 1.Lamb RA, Krug RM. Orthomyxoviridae: The Viruses and Their Replication. In: Fields BN, K DM, Howley PM, editors. Fundamental Virology. Philadelphia: Lippincott- Raven; 1996. pp. 605–647. [Google Scholar]
- 2.Thompson WW, Shay DK, Weintraub E, Brammer L, Bridges CB, Cox NJ, Fukuda K. Influenza-associated hospitalizations in the United States. Jama. 2004;292(11):1333–40. doi: 10.1001/jama.292.11.1333. [DOI] [PubMed] [Google Scholar]
- 3.Thompson WW, Shay DK, Weintraub E, Brammer L, Cox N, Anderson LJ, Fukuda K. Mortality associated with influenza and respiratory syncytial virus in the United States. Jama. 2003;289(2):179–86. doi: 10.1001/jama.289.2.179. [DOI] [PubMed] [Google Scholar]
- 4.Ford SM, Grabenstein JD. Pandemics, avian influenza A (H5N1), and a strategy for pharmacists. Pharmacotherapy. 2006;26(3):312–22. doi: 10.1592/phco.26.3.312. [DOI] [PubMed] [Google Scholar]
- 5.Webby RJ, Webster RG. Are we ready for pandemic influenza? Science. 2003;302(5650):1519–22. doi: 10.1126/science.1090350. [DOI] [PubMed] [Google Scholar]
- 6.Morens DM, Fauci AS. The 1918 influenza pandemic: insights for the 21st century. J Infect Dis. 2007;195(7):1018–28. doi: 10.1086/511989. [DOI] [PubMed] [Google Scholar]
- 7.Rogers DE, Louria DB, Kilbourne ED. The syndrome of fatal influenza virus pneumonia. Trans Assoc Am Physicians. 1958;71:260–73. [PubMed] [Google Scholar]
- 8.De Clercq E. Antiviral agents active against influenza A viruses. Nat Rev Drug Discov. 2006;5(12):1015–25. doi: 10.1038/nrd2175. [DOI] [PMC free article] [PubMed] [Google Scholar]
- 9.Fiore AE, Shay DK, Haber P, Iskander JK, Uyeki TM, Mootrey G, Bresee JS, Cox NJ. Prevention and control of influenza. Recommendations of the Advisory Committee on Immunization Practices (ACIP), 2007. MMWR Recomm Rep. 2007;56(RR-6):1–54. [PubMed] [Google Scholar]
- 10.Fernandez-Larsson R, O'Connell K, Koumans E, Patterson JL. Molecular analysis of the inhibitory effect of phosphorylated ribavirin on the vesicular stomatitis virus in vitro polymerase reaction. Antimicrob Agents Chemother. 1989;33(10):1668–73. doi: 10.1128/aac.33.10.1668. [DOI] [PMC free article] [PubMed] [Google Scholar]
- 11.Toltzis P, Huang AS. Effect of ribavirin on macromolecular synthesis in vesicular stomatitis virus-infected cells. Antimicrob Agents Chemother. 1986;29(6):1010–6. doi: 10.1128/aac.29.6.1010. [DOI] [PMC free article] [PubMed] [Google Scholar]
- 12.Eriksson B, Helgstrand E, Johansson NG, Larsson A, Misiorny A, Noren JO, Philipson L, Stenberg K, Stening G, Stridh S et al. Inhibition of influenza virus ribonucleic acid polymerase by ribavirin triphosphate. Antimicrob Agents Chemother. 1977;11(6):946–51. doi: 10.1128/aac.11.6.946. [DOI] [PMC free article] [PubMed] [Google Scholar]
- 13.Wray SK, Gilbert BE, Knight V. Effect of ribavirin triphosphate on primer generation and elongation during influenza virus transcription in vitro. Antiviral Res. 1985;5(1):39–48. doi: 10.1016/0166-3542(85)90013-0. [DOI] [PubMed] [Google Scholar]
- 14.Romanova J. The fight against new types of influenza virus. Biotechnol J. 2006;1(12):1381–92. doi: 10.1002/biot.200600159. [DOI] [PubMed] [Google Scholar]
- 15.Bright RA, Shay DK, Shu B, Cox NJ, Klimov AI. Adamantane resistance among influenza A viruses isolated early during the 2005-2006 influenza season in the United States. Jama. 2006;295(8):891–4. doi: 10.1001/jama.295.8.joc60020. [DOI] [PubMed] [Google Scholar]
- 16.Luke C, Subbarao K. Vaccines for pandemic influenza. Emerg Infect Dis. 2006;12(1):66–72. doi: 10.3201/eid1201.051147. [DOI] [PMC free article] [PubMed] [Google Scholar]
- 17.Severson WE, Shindo N, Sosa M, Fletcher T, 3rd, White EL, Ananthan S, Jonsson CB. Development and validation of a high-throughput screen for inhibitors of SARS CoV and its application in screening of a 100,000-compound library. J Biomol Screen. 2007;12(1):33–40. doi: 10.1177/1087057106296688. [DOI] [PMC free article] [PubMed] [Google Scholar]
- 18.Noah JW, Severson W, Noah DL, Rasmussen L, White EL, Jonsson CB. A cell-based luminescence assay is effective for high-throughput screening of potential influenza antivirals. Antiviral Res. 2007;73(1):50–9. doi: 10.1016/j.antiviral.2006.07.006. [DOI] [PubMed] [Google Scholar]
- 19.Matrosovich M, Matrosovich T, Garten W, Klenk HD. New low-viscosity overlay medium for viral plaque assays. Virol J. 2006;3:63. doi: 10.1186/1743-422X-3-63. [DOI] [PMC free article] [PubMed] [Google Scholar]
- 20.Zhang JH, Chung TD, Oldenburg KR. A Simple Statistical Parameter for Use in Evaluation and Validation of High Throughput Screening Assays. J Biomol Screen. 1999;4(2):67–73. doi: 10.1177/108705719900400206. [DOI] [PubMed] [Google Scholar]
- 21.Lipinski CA, Lombardo F, Dominy BW, F PJ. Experimental and computational approaches to estimate solubility and permeability in drug discovery and development settings. Adv Drug Delivery Rev. 1997;23:3–25. doi: 10.1016/s0169-409x(00)00129-0. [DOI] [PubMed] [Google Scholar]
- 22.Ertl P, Rohde B, Selzer P. Fast calculation of molecular polar surface area as a sum of fragment-based contributions and its application to the prediction of drug transport properties. J Med Chem. 2000;43(20):3714–7. doi: 10.1021/jm000942e. [DOI] [PubMed] [Google Scholar]