

Summary
Cholera toxin (CT) moves from the cell surface to the endoplasmic reticulum (ER) by retrograde vesicular transport. The catalytic subunit of CT (CTA1) then crosses the ER membrane and enters the cytosol in a process that involves the quality control mechanism of ER-associated degradation. The molecular details of this dislocation event have not been fully characterized. Here, we report that thermal instability in the CTA1 subunit - specifically, the loss of CTA1 tertiary structure at 37°C - triggers toxin dislocation. Biophysical studies found that glycerol preferentially stabilized the tertiary structure of CTA1 without having any noticeable effect on the thermal stability of its secondary structure. The thermal disordering of CTA1 tertiary structure normally preceded the perturbation of its secondary structure, but in the presence of 10% glycerol the temperature-induced loss of CTA1 tertiary structure occurred at higher temperatures in tandem with the loss of CTA1 secondary structure. The glycerol-induced stabilization of CTA1 tertiary structure blocked CTA1 dislocation from the ER and instead promoted CTA1 secretion into the extracellular medium. This, in turn, inhibited CT intoxication. Glycerol treatment also inhibited the in vitro degradation of CTA1 by the core 20S proteasome. Collectively, these findings indicate that toxin thermal instability plays a key role in the intoxication process. They also suggest the stabilization of CTA1 tertiary structure is a potential goal for novel anti-toxin therapeutic agents.
Keywords: cholera toxin, circular dichroism, endoplasmic reticulum-associated degradation, surface plasmon resonance, toxin translocation
Introduction
Cholera toxin (CT) is an AB5 protein toxin that ADP-ribosylates and activates the stimulatory α subunit of the heterotrimeric G protein (Gsα).1,2 The catalytic A moiety of CT is synthesized as a CTA protein of 27 kDa molecular mass. Nicking of CTA by the Vibrio cholerae hemagglutinin protease or other proteases generates a disulfide-linked CTA1/CTA2 heterodimer. Enzymatic activity is a property of the 22 kDa CTA1 subunit, while the 5 kDa CTA2 subunit interacts non-covalently with the B pentamer and thereby tethers CTA1 to the CTB domain. The cell-binding B moiety of CT is assembled from 12 kDa monomers as a homopentameric ring-like structure that adheres to GM1 gangliosides on the eukaryotic plasma membrane.
A substantial portion of surface-bound CT is delivered to the lysosomes and degraded, but the functional pool of toxin is instead transported to the endoplasmic reticulum (ER) through a series of vesicular trafficking events.3-6 The resident redox state of the ER reduces the CTA1/CTA2 disulfide bond, which then permits chaperone-assisted dissociation of CTA1 from CTA2/CTB5.7-9 The isolated CTA1 subunit subsequently crosses the ER membrane and enters the cytosol where it interacts with Gsα. Activated Gsα stimulates adenylate cyclase function and the production of cAMP. This leads to the opening of chloride channels on the apical face of intoxicated intestinal epithelial cells; the osmotic movement of water which follows chloride efflux into the gut generates the profuse watery diarrhea of cholera.1,2
To move from the ER to the cytosol, CTA1 uses the ER-associated degradation (ERAD) dislocation mechanism.9-13 ERAD recognizes misfolded or misassembled proteins in the ER and exports them to the cytosol for degradation by the 26S proteasome.14 CTA1 export probably occurs through Sec61 and/or Derlin-1 protein-conducting channels in the ER membrane.15-17 Although CTA1 is processed as an ERAD substrate, it avoids the standard ERAD route of ubiquitin-dependent proteasomal degradation because its arginine-over-lysine bias limits the number of potential sites for ubiquitin conjugation.18 Other AB toxins such as Shiga toxin and ricin also move from the cell surface to the ER and exploit ERAD for entry into the cytosol.19,20
Two major predictions have been derived from the ERAD model of CTA1 dislocation: (i) the C-terminal hydrophobic region of CTA1 (residues 162-192; the A13 subdomain) triggers ERAD-mediated toxin entry into the cytosol; and (ii) the translocated pool of CTA1 is stable in the eukaryotic cytosol.6,21 It is hypothesized that components of the ERAD machinery interact with the CTA13 subdomain and subsequently unfold the toxin for passage into the cytosol.9 CTA1 is then thought to spontaneously refold in the cytosol, producing a stable conformation that is resistant to proteasomal degradation.18
We have shown that the CTA13 subdomain is not required for toxin entry into the cytosol and that the translocated pool of CTA1 is not stable in the cytosol.10,22 Both observations may be linked to the unstable, heat-labile nature of the CTA1 subunit.23,24 CTA1 is held in a stable conformation when associated with other components of the holotoxin,24-26 but it can unfold spontaneously after dissociation from CTA2/CTB5.24 This unfolding event would activate the ERAD system and thereby promote CTA1 export to the cytosol. Following dislocation into the cytosol, CTA1 could retain significant enzymatic activity because of its association with host proteins such as the ADP-ribosylation factors that serve as co-factors to enhance CTA1 activity.23,24,27 However, the structural state of the isolated CTA1 subunit leaves it susceptible to ubiquitin-independent degradation by the core 20S proteasome.24 With this model of toxin-ERAD interactions, an inherent physical property of the CTA1 subunit (i.e., thermal instability) is linked to both toxin dislocation into the cytosol and toxin degradation in the cytosol. Our model suggests CTA1 is processed as a typical misfolded/unfolded ERAD substrate, whereas a prevailing model of toxin dislocation treats CTA1 as a stable protein that requires chaperone-assisted unfolding in order to move from the ER to the cytosol.6,9,16,18,28
According to our model, structural stabilization of the CTA1 subunit will inhibit CTA1 dislocation and thereby prevent CT intoxication. The thermal stabilization of CTA1 should also block its degradation by the 20S proteasome, which only acts upon unfolded substrates.29 To test these predictions, we examined the impact of glycerol on CTA1 structure, CTA1 dislocation / degradation, and CT intoxication. Glycerol is a chemical chaperone that stabilizes protein structures and is commonly used to disrupt ERAD-substrate interactions.30-34 Glycerol has also been shown, by an unknown mechanism, to protect cultured cells against intoxication with either ricin or Shiga toxin 2.35,36 In this work we show that glycerol prevents the temperature-induced loss of CTA1 tertiary structure, which in turn prevents CTA1 dislocation into the cytosol and productive intoxication. Glycerol also inhibited the in vitro degradation of CTA1 by the 20S proteasome. These observations provide mechanistic insight into the molecular events underlying CTA1-ERAD interactions and suggest a new therapeutic approach for anti-toxin countermeasures.
Results
Effect of glycerol on CTA1 protease sensitivity
As a first step toward evaluating the stabilizing effect of glycerol on CTA1 structure, we employed a protease sensitivity assay (Figure 1). A final concentration of 10% glycerol was used in order to maintain consistency with other reports that have used this concentration of glycerol to disrupt ERAD-substrate and/or host-toxin interactions.31-33,35,36 Protease sensitivity assays are used to probe the folding state of a protein, as proteins often become more susceptible to proteolysis upon (partial) unfolding.9,24,37 Samples of the reduced CTA1/CTA2 heterodimer were incubated in the absence or presence of 10% glycerol for 45 minutes at 4°C, 25°C, 33°C, 37°C, or 41°C. All samples were then placed on ice and exposed to thermolysin, a metalloendoprotease that cleaves the peptide bonds in proteins at the surface-exposed hydrophobic residues. EDTA and sample buffer were added after 45 minutes to halt the digests, and the samples were subsequently resolved by sodium dodecyl sulfate polyacrylamide gel electrophoresis (SDS-PAGE) with Coomassie staining. Since all protease treatments were performed at 4°C, differential degradation of the toxin samples could only result from temperature-induced changes to the structure of CTA1.
Figure 1.

Glycerol prevents the temperature-induced conversion of CTA1 to a protease-sensitive conformation. (a): 1 μg samples of the CTA1/CTA2 heterodimer were exposed to 10 mM β-ME for 5 min in the absence or presence of 10% glycerol before loading on a non-reducing SDS-PAGE gel. 1 μg of a CTA1/CTA2 heterodimer that was not exposed to β-ME was also run on the gel. Samples were visualized by Coomassie staining, which does not detect the dissociated 5 kDa CTA2 subunit. (b): Samples of the reduced CTA1/CTA2 heterodimer were placed in 20 mM sodium phosphate buffer (pH 7.0) lacking or containing 10% glycerol. After incubation at the stated temperatures for 1 hr, the samples were shifted to 4°C and exposed to thermolysin for 1 hr at 4°C. Samples were visualized by SDS-PAGE and Coomassie staining.
Previous work has shown that our reducing condition of 10 mM β-mercaptoethanol (β-ME) is sufficient for complete separation of CTA1 from CTA2;24 this result was also confirmed for CTA1/CTA2 heterodimers incubated with 10 mM β-ME and 10% glycerol (Figure 1(a)). CTA1 also ran as a 21 kDa monomer when reduced CTA1/CTA2 heterodimers were resolved by native PAGE, which confirmed that CTA1 and CTA2 did not remain associated by non-covalent interactions in either the absence or presence of glycerol (data not shown). Reduction of the CTA1/CTA2 disulfide bond is necessary to examine the temperature dependence of CTA1 protease sensitivity because the covalent association of CTA1 with CTA2 provides a degree of conformational stability to CTA1 which prevents its proteolysis by thermolysin.24
The isolated CTA1 subunit was largely resistant to thermolysin-mediated proteolysis when incubated at temperatures up to 33°C, but CTA1 shifted to a protease-sensitive state at 37°C. This was evidenced by a substantial weakening of the CTA1 band in the gel when the toxin was preincubated at temperatures above 33°C before thermolysin treatment (Figure 1(b)). Little change in CTA1 band intensities were observed in the temperature range of 4°C to 41°C for toxin samples treated with 10% glycerol, indicating that treatment with 10% glycerol prevented the transition of CTA1 to a protease-sensitive state at 37°C and 41°C. In contrast, under identical buffer conditions glycerol treatment did not prevent the thermolysin-mediated proteolysis of α-casein, a protein with an open and flexible conformation38 (data not shown). The inhibitory effect of glycerol on CTA1 proteolysis was thus unlikely to result from a direct inhibition of thermolysin activity. Instead, glycerol treatment appeared to keep CTA1 in a folded, protease-resistant conformation at 37°C and 41°C.
Effect of glycerol on CTA1 thermal stability
Biophysical experiments were performed in order to directly examine the impact of glycerol on CTA1 thermal instability (Figure 2). Near- and far-UV circular dichroism (CD) measurements were conducted on His6-tagged CTA1 in the absence or presence of 10% glycerol. Readings were taken during a step-wise increase in temperature from 18°C to 65°C. Near-UV CD measurements detected the disordering of CTA1 tertiary structure (Figures 2(a) and 2(c)), while far-UV CD measurements detected the unfolding of CTA1 secondary structure (Figures 2(b) and 2(d)). To avoid errors from sample-to-sample variability, both measurements were conducted near-simultaneously on the same sample. The data from these experiments were used to generate CTA1 thermal unfolding profiles (Figures 2(e) and 2(f)) which were, in turn, used to calculate the amount of initial (18°C) tertiary and secondary structure remaining in CTA1 at various temperatures (Table 1). The tertiary structure of CTA1 exhibited a transition temperature (Tm) of 34±1°C in the untreated control condition and a Tm of 39.5±1°C in the presence of glycerol (Table 1). Untreated CTA1 only retained 33% of its initial tertiary structure at 37°C, whereas glycerol-treated CTA1 retained 58% of its initial tertiary structure at 37°C. Consistent with this observation, bisANS fluorescence experiments suggested that 10% glycerol impedes CTA1 thermal unfolding and keeps the toxin in a partially folded conformation up to 38°C, similar to the molten globule state, while in the absence of glycerol CTA1 undergoes unfolding around 34-35°C (Figure S1). In contrast, the thermal unfolding profile of CTA1 secondary structure was not shifted by glycerol: in both the absence and presence of 10% glycerol, CTA1 exhibited a secondary structure Tm of 39±0.5°C and retained ~60% of its initial secondary structure at 37°C. These data delineate a significant effect of glycerol on the heat-sensitivity of CTA1 tertiary structure. The thermal disordering of CTA1 tertiary structure normally preceded the perturbation of CTA1 secondary structure,24 but in the presence of 10% glycerol the temperature-induced loss of CTA1 tertiary structure was shifted to higher temperatures and occurred in parallel with the loss of CTA1 secondary structure. Thus, glycerol treatment preferentially increased the thermal stability of the tertiary structure of CTA1 while exerting little effect on the secondary structure of the protein.
Figure 2.

Thermal stabilization of CTA1 by glycerol. (a-d): The temperature-induced unfolding of a purified, His6-tagged CTA1 protein in the absence (a-b) or presence (c-d) of 10% glycerol was monitored by near-UV CD (a, c) and far-UV CD (b, d). Both measurements were conducted near-simultaneously on the same sample after equilibration at each temperature for 4 min. Measurements were taken with a 4-mm optical path-length rectangular quartz cuvette at a protein concentration of 73 μg / ml in 20 mM sodium borate buffer (pH 7.4) containing 150 mM NaCl. The change in color from blue to red corresponds to a change in temperature from 18°C to 65°C. (e-f): Thermal unfolding profiles for CTA1-His6 in the absence (red) or presence (blue) of 10% glycerol were derived from the data presented in panels a-d. (e): For near-UV CD analysis, the mean residue molar ellipticities at 280 nm ([θ]280) were plotted as a function of temperature. (f): For far-UV CD analysis, the mean residue molar ellipticities at 220 nm ([θ]220) were plotted as a function of temperature.
Table 1.
Glycerol specifically prevents the thermal disordering of CTA1 tertiary structure
| Percent of Initial Structure Remaining at: | ||||||
|---|---|---|---|---|---|---|
| 25°C | 30°C | 33°C | 37°C | 41°C | Tm | |
| Near-UV CD | ||||||
| CTA1 | 90 | 72 | 56 | 33 | 16 | 34°C |
| CTA1 + glycerol | 92 | 82 | 73 | 58 | 42 | 39.5°C |
| Far-UV CD | ||||||
| CTA1 | 97 | 91 | 83 | 65 | 41 | 39°C |
| CTA1 + glycerol | 91 | 80 | 71 | 56 | 40 | 38.5°C |
The percentage of initial tertiary (near-UV CD) or secondary (far-UV CD) structure remaining in CTA1-His6 at the indicated temperatures was calculated from the thermal unfolding profiles presented in Figures 2(e) and 2(f), respectively. The amount of tertiary and secondary structure in CTA1-His6 at 18°C was set as an initial value of 100%; all other measurements were calculated as a percentage of this value.
Effect of glycerol on CTA1 dislocation
According to our model, the thermal stabilization of CTA1 should block its export to the cytosol. A previously described assay28 for monitoring CTA1 dislocation from the ER was used to test this prediction (Figure 3(a)). HeLa cells incubated on ice for 30 minutes with 1 μg / ml of CT were chased for 2 hours at 37°C in toxin-free medium that lacked or contained 10% glycerol. Previous studies have demonstrated that glycerol equilibrates across the plasma membrane with a t½ of 5 minutes,32 while it takes about 45 minutes for a fraction of surface-bound CT to reach the ER.5,16 Selective permeabilization of the plasma membrane with digitonin was used to partition the toxin-treated cells into two fractions that contained either (i) the plasma membrane and intact intracellular membranes or (ii) the cytosol. Control experiments demonstrated that protein disulfide isomerase (PDI), a soluble ER protein, was only found in the pellet fractions (i.e., ER and other membranes) of untreated and glycerol-treated cells. Furthermore, the cytosolic protein Hsp90 was found in the supernatant fractions (i.e., cytosol) of both untreated and glycerol-treated cells. Our fractionation procedure could thus clearly separate cell extracts into distinct organelle and cytosolic components. CTA1 was only detected in the pellet fraction after pulse labeling at 4°C, a temperature that blocks the endocytosis of surface-bound protein. However, as expected, a portion of surface-bound CTA1 entered the cytosolic fraction after a 2 hour chase at 37°C. Less CTA1 was found in the cytosol of glycerol-treated cells than in the cytosol of untreated control cells (Figure 3(a)). Semi-quantitative analysis of our dislocation assay indicated that 23 ± 8% of the total cellular pool of CTA1 was present in the cytosolic fraction of untreated cells, and 7 ± 4% of the total cellular pool of CTA1 was present in the cytosolic fraction of glycerol-treated cells (n = 2). In the two individual experiments, glycerol treatment resulted in a 3-fold or 5-fold reduction in cytosolic CTA1. This indicated that the glycerol-induced stabilization of CTA1 tertiary structure inhibited CTA1 dislocation into the cytosol.
Figure 3.

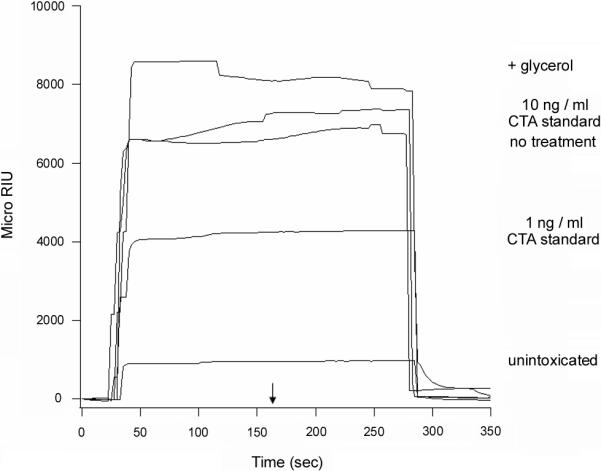
Glycerol treatment blocks CTA1 dislocation from the ER. HeLa cells were pulse-labeled at 4°C for 30 min with 1 μg / ml of CT. The cells were then chased for 2 hr at 37°C in toxin-free medium that lacked or contained 10% glycerol. Selective permeabilization of the plasma membrane with digitonin was used to partition cell extracts into separate membrane (pellet; P) and cytosolic (supernatant; S) fractions. (a): Both fractions were probed by Western blot to establish the distributions of cytosolic marker Hsp90, ER marker PDI, and CTA1. One of two representative experiments is shown. (b): A sensor slide coated with an anti-CTA antibody was used to detect the cytosolic pool of CTA1 from untreated (no treatment) or glycerol-treated (+ glycerol) cells by SPR. CTA standards (10 ng / ml and 1 ng / ml) were perfused over the sensor slide as positive controls. Cytosolic fractions from unintoxicated cells and cells intoxicated in the presence of BfA (+ BfA) were also generated for this experiment. One of four representative experiments is shown. The arrow indicates when the sample was removed from the perfusion buffer. At the end of each experiment, bound sample was stripped from the sensor slide with a 5 min PBST wash at pH 6.0.
Surface plasmon resonance (SPR) was used as an alternative method to detect the cytosolic pool of CTA1 (Figure 3(b)). Cytosolic fractions from intoxicated HeLa cells were prepared as described above and perfused over an SPR sensor slide that was coated with an anti-CTA antibody. No signal was obtained from the cytosol of unintoxicated HeLa cells and from the cytosol of intoxicated cells treated with brefeldin A (BfA), a drug that blocks toxin trafficking to the ER dislocation site.5,39 Cells intoxicated in the presence of 10% glycerol also failed to generate a positive cytosolic signal for CTA1 (n = 4). In contrast, we could reproducibly detect the cytosolic pool of CTA1 from intoxicated but otherwise untreated control cells. When this assay was repeated as a five hour time course experiment, we recorded a time-dependent increase in the cytosolic pool of CTA1. However, CTA1 could not be detected in the cytosol of glycerol-treated cells at 1, 2, 3, 4, or 5 hours of chase (Figure S2). The apparent discrepancy between this result and the result presented for Western blot analysis of toxin dislocation, in which a minor pool of CTA1 was detected in the cytosol of glycerol-treated cells (Figure 3(a)), stems from a procedural difference in the detection methods. For SPR analysis, the cytosolic fractions had to be diluted in order to obtain a sufficient volume of sample to run through the SPR instrument. This process apparently diluted the cytosolic pool of CTA1 from glycerol-treated cells to a level below the threshold of detection for SPR. However, both SPR and Western blot analysis recorded the same qualitative effect: less CTA1 was found in the cytosol of glycerol-treated cells than in the cytosol of untreated control cells. These collective observations provided additional support for our conclusion that the glycerol-induced thermal stabilization of CTA1 prevented toxin dislocation to the cytosol.
Effect of glycerol on CTA1 secretion from intoxicated cells
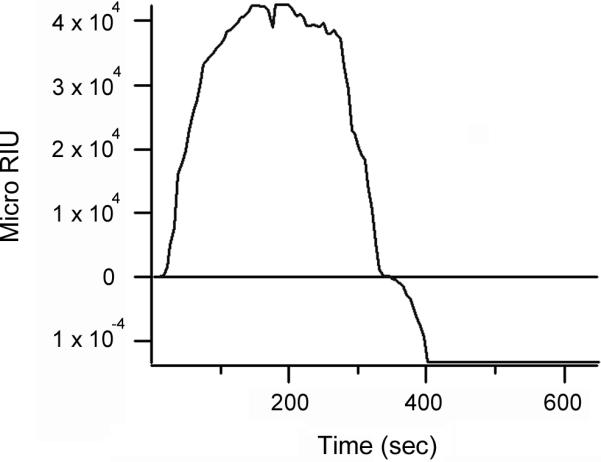
Misfolded or misassembled proteins and proteins with specific targeting determinants are effectively retained in the ER; all other proteins are packaged into vesicle carriers for transport to the Golgi apparatus and beyond.14 Stabilization of the CTA1 tertiary structure could therefore generate a folded toxin conformation that is recognized as secretory cargo and accordingly directed to vesicle traffic in the biosynthetic secretory pathway. In this case, glycerol treatment would result in the secretion of CTA1 from intoxicated cells. To examine this possibility, SPR was used to detect CTA1 in the extracellular medium of cells intoxicated in the absence or presence of 10% glycerol (Figure 4). A minimal background signal was detected when the medium from unintoxicated HeLa control cells was perfused over a SPR sensor slide that had been coated with an anti-CTA antibody. A positive signal was detected when the medium from intoxicated cells was perfused over the sensor slide, and an even stronger signal was obtained from the medium of intoxicated cells incubated with 10% glycerol (Figure 4). This indicated that, as previously reported, some amount of CTA1 was released into the medium during the normal intoxication process.3 However, a greater amount of CTA1 was released into the medium when the toxin was stabilized by glycerol treatment (Figure 4). No signal was detected when the experiment was performed with a sensor slide that had been coated with an anti-CTB antibody, thus demonstrating that the positive response from the CTA sensor slide did not result from the presence of CT holotoxin in the medium (data not shown). Similar results were obtained with Vero cells which, unlike HeLa cells, did not require GM1 pre-treatment before intoxication (Figure S3). Thus, the results of the HeLa secretion assay could not be attributed to GM1 treatment or to cell-type specific effects.
Figure 4.
Glycerol treatment stimulates CTA1 secretion from intoxicated cells. HeLa cells pulse-labeled at 4°C for 30 min with 1 μg / ml of CT were chased for 2 hr at 37°C in toxin-free medium that lacked (no treatment) or contained 10% glycerol (+ glycerol). Media samples from these cells and from unintoxicated control cells were then analyzed by SPR with a sensor slide that had been coated with an anti-CTA antibody. CTA standards (10 ng / ml and 1 ng / ml) were also perfused over the sensor slide as positive controls. One of four representative experiments is shown. The arrow indicates when the sample was removed from the perfusion buffer. At the end of each experiment, bound sample was stripped from the sensor slide with a 5 min PBST wash at pH 6.0.
Because CTA1 dissociates from CTA2/CTB5 in the ER,7-9 the secretion of CTA1 from glycerol-treated cells strongly suggested that 10% glycerol did not inhibit trafficking of the CT holotoxin to the ER. BfA, a drug that disrupts toxin transport to the ER,5,39 was used to strengthen this interpretation. When the SPR secretion assay was repeated with cells exposed to BfA, we could not detect an appreciable amount of CTA1 in the medium of intoxicated cells incubated in either the absence or presence of 10% glycerol (Figures 5(a) and 5(b)). Thus, toxin trafficking to the ER was a prerequisite for CTA1 secretion. The kinetics of secretion also indicated that intracellular toxin trafficking preceded the release of CTA1 into the medium: substantial amounts of extracellular CTA1 were not detected until 90 minutes into the chase period, after which a greater amount of CTA1 was released into the medium (Figures 5(a) and 5(b)). Analysis of these kinetic data and the data presented in Figure 4 indicated that glycerol-treated cells secreted twice as much CTA1 as the untreated control cells (Figure 5(c)). Given that only a minor fraction (~5%) of cell-associated CT reaches the ER,5,39 a two-fold increase in CTA1 secretion from glycerol-treated cells may represent the bulk of ER-localized toxin. It thus appeared that the glycerol-stabilized pool of CTA1 was treated as secretory cargo rather than as an ERAD substrate and was accordingly released into the extracellular medium.
Figure 5.

CTA1 secretion from intoxicated cells occurs in a time-dependent process that is inhibited by BfA. (a-b): HeLa cells pulse-labeled at 4°C for 30 min with 1 μg / ml of CT were chased for 30, 60, 90, or 120 min at 37°C in toxin-free medium that lacked (a) or contained (b) 10% glycerol. Media samples from these cells, from intoxicated cells chased for 120 min in the presence of 5 μg BfA / ml (120 min + BfA), and from unintoxicated control cells were then analyzed by SPR with a sensor slide that had been coated with an anti-CTA antibody. CTA standards (10 ng / ml and 1 ng / ml) were also perfused over the sensor slide as positive controls. The arrow indicates when the sample was removed from the perfusion buffer. At the end of each experiment, bound sample was stripped from the sensor slide with a 5 min PBST wash at pH 6.0. (c): To approximate the amount of CTA1 secreted from intoxicated cells, association rate constants were calculated from the SPR data obtained for the secreted pools of CTA1 and for the ten-fold serial dilutions of purified CTA that were perfused over the CTA sensor slide. The association rate constants for the CTA standards were plotted as a function of protein concentration (n = 3; averages ± standard deviations are shown). The slope of the resulting standard curve was then used to calculate the concentration of CTA1 in untreated and glycerol-treated media samples. The means ± standard errors of the means of five independent experiments are shown. CTA standards are presented as diamonds; untreated media samples are presented as an open square; and glycerol-treated media samples are presented as an open circle.
Effect of glycerol on CTA1 dissociation from the holotoxin
Results from the SPR secretion assays indicated that glycerol treatment did not prevent CTA1 dissociation from the holotoxin: if glycerol inhibited this event, CTA1 would be tethered to CTA2/CTB5 and could not enter the extracellular medium in a soluble state. An SPR-based experiment directly confirmed that glycerol treatment did not prevent CTA1 dissociation from the holotoxin (Figure 6). In this experiment, the CT holotoxin was appended to a GM1-coated sensor slide. Reduced PDI was then perfused over the sensor slide in the presence of 10% glycerol. Previous biochemical work has shown that reduced PDI facilitates the dissociation of CTA1 from CTA2/CTB5.9 Our SPR experiment confirmed this PDI-mediated event also occurs in the presence of 10% glycerol. Reduced PDI bound to CT and accordingly generated an increase in the measured refractive index. Although PDI was present in the perfusion buffer throughout the experiment, the refractive index began to drop precipitously 290 seconds into the experiment and eventually fell below the initial baseline value which represented the mass of the CT holotoxin. It thus appeared that both PDI and a component of the CT holotoxin were removed from the sensor slide. This would occur if PDI facilitated the dissociation of CTA1 from CTA2/CTB5: since the B pentamer was bound to the sensor slide, the release of CTA1 from the holotoxin would wash both PDI and CTA1 off the plate. To confirm that CTA1 was removed from the sensor-bound toxin, we perfused an anti-CTA antibody over the sensor slide. No signal was obtained with the anti-CTA antibody, thus indicating that CTA1 was absent from the PDI-treated toxin. In contrast, the anti-CTA antibody generated a robust signal when perfused over a sensor slide containing the intact CT holotoxin (data not shown).24 Additional control experiments with anti-CTB, anti-KDEL, or anti-PDI antibodies demonstrated that CTB and the KDEL-tagged CTA2 subunit, but not PDI, remained on the SPR sensor slide after the loss of CTA1 (data not shown).
Figure 6.
Glycerol does not inhibit the dissociation of CTA1 from CTA2/CTB5. After appending CT to an SPR sensor slide, a baseline measurement corresponding to the mass of the holotoxin was recorded. Reduced PDI was then perfused over the CT-coated sensor slide in the presence of 10% glycerol. PDI was present in the perfusion buffer for the duration of the experiment; an anti-CTA antibody was also added to the perfusion buffer 420 sec into the experiment.
Effect of glycerol on CT intoxication
The glycerol-induced block of CTA1 dislocation into the cytosol should prevent productive CT intoxication. To test this prediction, we monitored cAMP levels in untreated and glycerol-treated cells that had been continually exposed to varying concentrations of CT for 2 hours (Figure 7). Glycerol-treated cells were indeed resistant to CT. Whereas a 50% maximal response was obtained with 3 ng of CT / ml in the untreated control cells, 35 ng of CT / ml was required to elicit the same effect in glycerol-treated cells. This effect was most likely due to direct inhibition of the CT intoxication process, as control experiments found that glycerol did not inhibit forskolin-stimulated adenylate cyclase activity: cells treated with glycerol and forskolin produced 105% of the cAMP signal generated by cells treated with forskolin alone. Furthermore, our SPR experiments demonstrated that glycerol treatment did not prevent CT trafficking to the ER or CTA1 dissociation from the holotoxin. Thus, the glycerol-induced inhibition of CT intoxication most likely resulted from the glycerol-induced block of CTA1 dislocation to the cytosol.
Figure 7.

Glycerol treatment interferes with CT intoxication. CHO cells were incubated for 2 hrs with varying concentrations of CT in media lacking (circles) or containing (squares) 10% glycerol. cAMP levels were then assessed with the use of an [125I]-cAMP competition assay. Results (means ± SEMs of 4 independent experiments with triplicate samples) are expressed as percentages of the maximal CT response for all tested conditions.
Effect of glycerol on CTA1 degradation by the 20S proteasome
CTA1 is an in vitro substrate for ubiquitin-independent degradation by the 20S proteasome.24 This macromolecular complex forms the catalytic core of the 26S proteasome, which is generated by the addition of a 19S cap to one or both ends of the barrel-shaped 20S proteasome. The function of the 19S regulatory domain is ubiquitin recognition and ATP-dependent substrate unfolding, so the core 20S proteasome can only degrade a limited number of unfolded proteins in a ubiquitin- and ATP-independent process.29 To determine whether the stabilization of CTA1 tertiary structure inhibited toxin degradation by the 20S proteasome, we incubated a reduced CTA1/CTA2 heterodimer with the purified 20S proteasome for up to 20 hours in the absence or presence of 10% glycerol (Figure 8(a)). Degradation of the reduced, isolated CTA1 subunit by the 20S proteasome was detected after 3 hours of co-incubation in our control condition and was nearly complete by 20 hours of co-incubation. However, substantial inhibition of CTA1 degradation by the 20S proteasome was observed when the toxin was incubated with both 10% glycerol and the 20S proteasome. Glycerol did not inhibit α-casein degradation by the 20S proteasome (Figure 8(b)), which demonstrated that 10% glycerol did not directly impair the in vitro activity of the core 20S proteasome. The stabilization of CTA1 tertiary structure by glycerol thus prevented its ubiquitin-independent degradation by the 20S proteasome.
Figure 8.
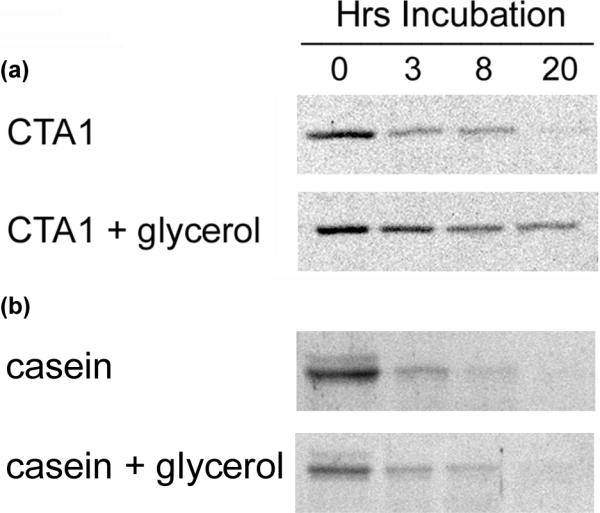
Glycerol inhibits CTA1 degradation by the 20S proteasome. (a): Reduced CTA1/CTA2 heterodimers were incubated at 37°C with 100 nM of the 20S proteasome in the absence or presence of 10% glycerol. Samples taken at the indicated time points were visualized by SDS-PAGE and Coomassie staining. One of two representative experiments is shown. (b): An identical protocol was followed with α-casein as the sample protein.
Discussion
Toxin-ERAD interactions were originally thought to involve the C-terminal hydrophobic region of CTA1, but recent work has shown that this domain is not required for CTA1 dislocation.22 An alternative ERAD trigger could derive from the unstable, heat-labile nature of the isolated CTA1 polypeptide.23,24 With this model, the global loss of CTA1 structure that accompanies its dissociation from the holotoxin would identify it as a misfolded protein for ERAD processing. We accordingly predicted that the thermal stabilization of CTA1 would prevent its export to the cytosol and, hence, productive intoxication. The results of our experiments with glycerol-treated cells, combined with biophysical studies on purified proteins, support this prediction. Our findings identify the thermal unfolding of CTA1 tertiary structure as a requirement for ERAD recognition and thus provide a novel molecular mechanism for ERAD-mediated CTA1 dislocation.
The thermal disordering of CTA1 tertiary structure normally preceded the thermal denaturation of CTA1 secondary structure by 5-6°C.24 However, here we show that in the presence of 10% glycerol the loss of CTA1 tertiary structure was shifted to higher temperatures and occurred concomitantly with the loss of CTA1 secondary structure. Glycerol did not affect the thermal perturbation of CTA1 secondary structure, so the glycerol-induced effects on toxin processing apparently resulted from the specific stabilization of CTA1 tertiary structure.
The near-UV CD signal around 280 nm that was used to track changes in CTA1 tertiary structure involves contributions from both Trp and Tyr residues. Two of the three CTA1 Trp residues that make substantial contributions to the near-UV CD signal are present in the C-terminal domain that has previously been shown to be in a partially unfolded state.23 The glycerol-induced stabilization of CTA1 tertiary structure may therefore involve an effect on the C-terminal A13 subdomain. In this scenario, unfolding of the CTA1 C-terminus would precede the loss of additional structure in the remainder of the toxin. Since the A13 subdomain is not necessary for CTA1 dislocation,22 the temperature-induced loss of structure in other regions of CTA1 would serve as the ERAD trigger. This possibility is consistent with our interpretation of the available data - namely, that the thermal unfolding of CTA1 tertiary structure is required to activate the ERAD system. Additional structural studies will delineate the process of CTA1 thermal unfolding which begins with the loss of tertiary structure. Here, we focused on the disruption of host-toxin interactions resulting from the glycerol-induced stabilization of CTA1 tertiary structure.
Control conditions ensured that the glycerol-induced effects were due to the impact of glycerol on CTA1 structure rather than to the action of glycerol on other components of the experiment. For example, we used α-casein, a protein with a flexible and open structure,38 to demonstrate that glycerol did not directly inhibit the proteolytic activities of thermolysin or the 20S proteasome. Additional experiments demonstrated that glycerol treatment did not disrupt (i) holotoxin trafficking to the ER; (ii) chaperone-assisted dissociation of CTA1 from CTA2/CTB5; (iii) secretion of the dissociated CTA1 subunit; or (iv) cAMP production from activated adenylate cyclase. Other studies have further shown that glycerol treatment does not affect the vesicular transport of secretory cargo, N-linked glycosylation in the endomembrane system, the functioning of chloride channels, or the ERAD-independent ER dislocation of the A subunit from Haemophilus ducreyi cytolethal distending toxin.32-34,40 Thus, the impact of glycerol on CTA1 processing is highly unlikely to result from generic cellular effects. It instead appears to have resulted specifically from the stabilization of CTA1 tertiary structure.
There is one established case in which glycerol treatment does have a general effect on cellular events: chemical chaperones such as glycerol stabilize the folding intermediates in protein biogenesis, and this has been shown to alter the processing of many ERAD substrates.30-34 CTA1 therefore acts as a typical misfolded/unfolded ERAD substrate, which contradicts a prevailing model of toxin-ERAD interactions that treats CTA1 as a stable protein.6,9,16,18,28
Glycerol treatment did not prevent CT trafficking to the ER or CTA1 dissociation from the holotoxin. However, glycerol treatment did prevent the ER-to-cytosol dislocation of CTA1. CT intoxication was consequently impaired in glycerol-treated cells. These effects, which specifically resulted from the stabilization of CTA1 tertiary structure, demonstrated the functional consequences of CTA1 thermal stabilization. The trigger for ERAD-mediated dislocation thus appears to derive from a global loss of CTA1 tertiary structure rather than from the presence of a specific domain or motif within the toxin. As such, CTA1 does not masquerade as misfolded protein to activate the ERAD system. CTA1 is instead recognized as an ERAD substrate because, upon holotoxin disassembly, the thermal disordering of its tertiary structure produces an unfolded toxin conformation.
The thermal stabilization of CTA1 blocked its ERAD-mediated dislocation to the cytosol and instead promoted its secretion into the extracellular medium. This suggested that the stabilized pool of CTA1 was not retained in the ER of glycerol-treated cells but was instead treated as normal secretory cargo and released into the medium. A relatively small portion of cell-associated CT (~5%) reaches the ER,5,39 so the two-fold increase in CTA1 secretion from glycerol-treated cells may represent the bulk of ER-localized toxin. Since the secreted pool of CTA1 was not linked to its cell-binding B subunit, it could not re-associate with target cells and was therefore functionally inactive. The release of CTA1 from glycerol-treated cells would also prevent its accumulation in the ER and any resulting ER stress response. Given these considerations, it appears that A chain thermal stabilization is a promising anti-toxin therapeutic strategy.
CTA1 is degraded in vivo by a relatively slow, ubiquitin-independent proteasomal mechanism.24 This process likely involves the core 20S proteasome, which can degrade CTA1 in an ATP- and ubiquitin-independent manner in vitro.24 The glycerol-induced inhibition of CTA1 degradation by the 20S proteasome indicated that the loss of toxin tertiary structure is responsible for targeting CTA1 to the 20S proteasome. This interpretation is consistent with a previous report that concluded the 20S proteasome recognizes substrates with disordered tertiary structures.41 Collectively, these data suggest that CTA1 degradation in the host cell cytosol results from the thermal disordering of CTA1 tertiary structure. The slow rate of CTA1 turnover in vivo, which under normal circumstances does not impact intoxication,18 most likely reflects inefficient processing by the 20S variant of the proteasome and / or CTA1 association with stabilizing host proteins such as the ADP-ribosylation factors.23,24
Our collective data indicates that CTA1 thermal instability plays an essential role in the intoxication process. Thus, the thermal stabilization of CTA1 is a novel target for anti-toxin therapeutics. We have provided proof-of-principle for this concept by demonstrating that the glycerol-induced stabilization of CTA1 tertiary structure blocks toxin dislocation from the ER and productive intoxication. Exposure to high concentrations of glycerol is not a viable therapeutic option, but other chemical chaperones or target-specific “pharmacological chaperones” can stabilize protein conformations without toxic side-effects.42 Other ER-dislocating toxins also contain thermally unstable A chains,37,43,44 so the use of chemical or pharmacological chaperones for toxin thermal stabilization may represent a new, general strategy for anti-toxin treatments.
Materials and Methods
Materials
Chemicals, thermolysin, α-casein, rabbit anti-CTA antibody, and ganglioside GM1 were purchased from Sigma-Aldrich (St. Louis, MO). CT was purchased from List Biological Laboratories (Campbell, CA). Cell culture reagents were purchased from Invitrogen (Carlsbad, CA). ATP and the purified CTA1/CTA2 heterodimer were purchased from Calbiochem (La Jolla, CA). The purified 20S proteasome was from Boston Biochem (Cambridge, MA). [35S]methionine was purchased from Perkin-Elmer (Boston, MA). Rabbit anti-Hsp90 and anti-PDI antibodies were purchased from Stressgen Bioreagents Corp. (Victoria, BC Canada); the horseradish peroxidase-conjugated goat anti-rabbit IgG antibody was from Jackson Immunoresearch Laboratories Inc. (West Grove PA); and Talon beads were from Clontech Laboratories (Mountain View, CA).
Protease sensitivity assay
A master mix containing 6 μg of CTA1/CTA2, 10 mM β-ME, and 20 mM sodium phosphate (pH 7.0) was prepared in a volume of 120 μl. A second master mix was prepared as above but with a final concentration of 10% glycerol. The mixes were divided into 20 μl aliquots and incubated at 4°C, 25°C, 33°C, 37°C, or 41°C for 45 minutes. The aliquots were then placed on ice for 10 minutes, after which 2 μl of thermolysin was added to all the samples for a 1 hour incubation at 4°C. Thermolysin, prepared as a 10 × stock in 50 mM CaCl2 and 100 mM Hepes (pH 8.0), was added to a final concentration of 0.04 mg/ml. Digestions were halted by the addition of ethylenediaminetetraacetic acid (EDTA) to a final concentration of 10 mM. Samples were analyzed by SDS-PAGE with 15% polyacrylamide gels. Coomassie staining was used to visualize the samples.
CTA1-His6 purification
Escherichia coli strain BL21 pLysS was transformed with an inducible CTA1-His6 expression plasmid22 and grown at 37°C in 1 liter Luria-Bertani broth to an A600 of 0.6. CTA1-His6 expression was induced by addition of 1 mM IPTG to the growth medium. The cells were pelleted after 4 hrs of induction, resuspended in extraction buffer (20 mM Tris-HCl, pH 7.0, 300 mM NaCl, 0.1% Triton X-100, 1% deoxycholate, 100 μg/ml of lysozyme, and 8 M urea), and lysed with three freeze-thaw cycles. The insoluble lysate fraction was removed with a 30 min, 12,000 × g spin. The soluble fraction was then supplemented with a protease inhibitor cocktail and incubated in batch with Talon resin for 30 min at room temperature. Unbound material in the supernatant was removed with a 5 min spin at 700 × g, and the resin was washed four times with extraction buffer containing 600 mM NaCl. To elute the bound toxin, the resin was placed in a column and exposed to increasing concentrations of imidazole in extraction buffer (10, 15, 20, 25, 35, 40, 45, and 100 mM imidazole; 2 mls for each concentration). Fractions of 0.5 ml volume were collected and analyzed by SDS-PAGE. Before experimental use, the fractions containing purified CTA1-His6 were dialyzed against five changes of 500 ml sodium phosphate buffer (pH 7.4) in order to facilitate the refolding of CTA1: the first step was for 2 hr at room temperature in 6 M urea buffer; the second step was overnight at 4°C in 4 M urea buffer; the third step was for 2 hrs at 4°C in 2 M urea buffer; the fourth step was for 1 hr at 4°C in urea-free buffer; and the last step was for 20 min at 4°C in urea-free buffer. Slide-a-lyzer 3500 MWCO dialysis cups (Pierce, Rockford, IL) were used for the procedure. After dialysis, CTA1-His6 was used immediately for experimentation.
CD measurements
A J-810 spectrofluoropolarimeter (Jasco Corp., Tokyo, Japan) with a Jasco PFD-425S Peltier temperature controller was used to study the temperature-dependent unfolding of CTA1-His6. Near- and far-UV CD measurements were performed with a 4-mm optical path-length rectangular quartz cuvette at a protein concentration of 73 μg / ml in 20 mM sodium borate buffer (pH 7.4) containing 150 mM NaCl. Thermal unfolding was carried out in the temperature range of 18-65°C. Samples were equilibrated for 4 minutes at each temperature, followed by measurements of CD spectra from 195 to 325 nm. Five scans were recorded and averaged per spectrum. The observed ellipticity was converted to mean residue molar ellipticity, [θ], in units of degrees×cm2×dmol−1 using [θ] = θobs/cnresl, where θobs is the measured ellipticity in millidegrees, c is the molar concentration of the protein, nres is the number of amino acid residues in the protein, and l is the optical path-length in millimeters. The temperature-dependent protein unfolding data were analyzed as previously described.24 The thermal unfolding profiles for CTA1-His6 were nearly identical to the profiles reported for native CTA1, which in the reduced state exhibited a secondary structure Tm of 37.5°C and a tertiary structure Tm of 32°C.24
The change in the near-UV CD signal at 280 nm reflects the local environment of Trp and Tyr residues and the conformation of the side chains of these residues.45,46 Changes in the local environment are caused by changes in the protein tertiary structure. A more tightly packed tertiary structure brings the main chain Cα atoms closer to the aromatic side chains and makes their local environment more chiral, thus affecting the aromatic side chain CD signal. As such, the changes in the near-UV CD signal around 280 nm reflect (i) changes in the local environment of Trp and Tyr residues and, thus, the protein tertiary structure; and (ii) the conformations of Trp and Tyr side chains. We accordingly interpreted the changes in this signal in terms of protein tertiary structure.
Dislocation and secretion assays
HeLa cells were seeded into 6 well plates and grown overnight to a density of 10,000 cells / well. Duplicate wells were used for each condition. To begin the experiment, the cells were incubated for 1 hour at 37°C in serum-free medium containing 100 ng / ml of ganglioside GM1. This medium was subsequently replaced with serum-free medium containing 1 μg / ml of CT. After a 30 minute incubation at 4°C, the cells were washed twice with phosphate buffered saline (PBS) and placed in toxin/serum-free medium that either lacked or contained 10% glycerol. The cells were then incubated for 2 hours at 37°C. Media samples were collected for analysis by SPR, and cells were lifted from the plate using 750 μl of 0.5 mM EDTA in PBS. Both wells for each condition were added to a single microcentrifuge tube which was spun at 5,000 × g for 5 minutes at room temperature. The supernatant was discarded, and the cell pellet was resuspended in 100 μl of 0.04% digitonin in HCN buffer (50 mM HEPES, pH 7.5, 150 mM NaCl, 2 mM CaCl2, 10 mM N-ethylmaleimide, and a protease inhibitor cocktail) for a 10 minute incubation at 4°C. The digitonin-treated cells were spun at 16,000 × g for 10 minutes at room temperature, after which the supernatant (i.e., cytosolic fraction) was collected and placed in a fresh microcentrifuge tube. For experiments involving Western blot analysis, 120 μl of 1 × sample buffer was added to the pellet and 20 μl of 4 × sample buffer was added to the supernatant.
Western blot
25 μl samples resolved by SDS-PAGE with 15% polyacrylamide gels were subsequently transferred to a PVDF membrane. The membrane was incubated overnight at 4°C with primary antibody (rabbit anti-Hsp90 at 1:20,000 dilution; rabbit anti-PDI at 1:5,000 dilution; or rabbit anti-CTA at 1:20,000 dilution). The membrane was then incubated at room temperature for 30 minutes with a secondary antibody (horseradish peroxidase-conjugated goat anti-rabbit IgG at 1:20,000 dilution). ECL Plus Western blotting detection reagents (GE Healthcare) were used for protein detection according to the manufacturer's instructions. Separate blots were run for each protein.
For semi-quantitative analysis of our dislocation assay, the amount of cytosolic CTA1 was calculated with the following equation: % cytosolic CTA1 = CTA1 supernatant signal / [CTA1 supernatant signal + CTA1 pellet signal]. This calculation provides an internal control, as the amount of cytosolic CTA1 is expressed as a ratio of total cell-associated CTA1 for each experimental condition. Thus, there is no direct comparison of band intensities between separate cell extracts representing control and experimental conditions (i.e., +/− glycerol treatment).
SPR analysis
Experiments were performed with a Reichert (Depew, NY) SR7000 SPR Refractometer. To generate sensor slides coated with an anti-CTA antibody, an EDC-NHS activation buffer was perfused over a Reichert gold-plated glass slide for 10 min at a flow rate of 5 μl / min. The same flow rate was used for all steps of the procedure. A 5 min wash with PBS (pH 7.4) containing 1% Triton X-100 (PBST) was used to remove the activation buffer, after which an anti-CTA antibody at 1:2000 dilution in PBST was perfused over the slide for 15 min. Unbound antibody was removed with a 5 min PBST wash, and the remaining active groups on the sensor slide were deactivated with a 3 min exposure to ethanolamine.
To detect the cytosolic or secreted pools of CTA1, PBST (pH 7.4) was perfused over the CTA sensor slide for 5 min to establish a baseline reading. Experimental samples were then flowed over the sensor slide. Before use, cytosolic fractions from the dislocation assay were diluted in HCN buffer to a final volume of 1 ml. This step was necessary in order to obtain a sufficient volume of sample to run through the SPR instrument. For the secretion assay, all media samples were standardized to a final concentration of 5% glycerol (2 ml final volume) in order to eliminate any differential effect glycerol might have on detection by the SPR instrument. CTA standards diluted in HCN buffer or 5% glycerol were used for the dislocation assay and secretion assay, respectively. Identical results were obtained for CTA standards diluted in either HCN buffer or HCN buffer containing cellular extracts generated from unintoxicated cells (data not shown); this demonstrated that the data obtained from our dislocation assay were not affected by the presence of cytosol. Experimental samples were removed from the perfusion buffer after exposure to the SPR sensor for approximately 180 sec. This process usually results in a loss of signal which reflects the dissociation rate constant. However, for these experiments, the strong antibody-antigen interaction prevented any significant loss of signal due to ligand dissociation. After each reading, bound ligand was stripped from the sensor slide with a 5 min PBST wash at pH 6.0. The Reichert Labview software was used for data collection.
Preliminary experiments found that the pellet fractions from our dislocation assay produced SPR signals that were off-scale in relation to the weaker signals from the cytosolic fractions. We therefore focused on the relative signal intensities of the cytosolic fractions. The disparity between organelle and cytosol signals for CTA1 was consistent with the small fraction of cell-associated CTA1 (~5%) that reaches the ER and, subsequently, the cytosol.5,39 An additional control experiment demonstrated that the cytosolic fractions did not contain a factor that inhibited the detection of CTA1: nearly identical SPR signals were obtained from 10 ng / ml of CTA in buffer and from 10 ng / ml of CTA that had been added to a cytosolic fraction obtained from unintoxicated HeLa cells.
The association rate constant derived from SPR data is directly proportional to ligand concentration.47 Thus, to determine the amount of CTA1 secreted from intoxicated cells, association rate constants were calculated for the SPR data obtained from the experimental samples of Figure 4, from the 120 min experimental samples from Figures 5(a) and 5(b), and from the ten-fold serial dilutions of purified CTA that were perfused over the sensor slide as controls for Figures 4 and 5. The BioLogic (Campbell, Australia) Scrubber 2 software was used to derive the association rate constants from our SPR data. The association rate constants for the CTA standards were plotted as a function of protein concentration. The slope of the resulting standard curve was then used to calculate the concentrations of CTA1 in untreated and glycerol-treated media samples.
For SPR experiments using PDI and the CT holotoxin, a gold plate sensor was coated with the GM1 ganglioside receptor of CT by a procedure described for the coating of ELISA plates.48 CT was then bound to the GM1-coated sensor by perfusing 1 ml of CT (10 μg / ml) over the slide for 15 min at a flow rate of 5 μl / min. The CT sensor was equilibrated at 37°C in PBST and 10% glycerol for 10 min at a flow rate of 45 μl / min. The SPR instrument was then calibrated with a baseline measurement corresponding to the mass of the bound CT holotoxin. PDI was subsequently perfused over the sensor at a flow rate of 45 μl / min. PDI was diluted to a final concentration of 100 μM in PBST containing 10% glycerol and 1 mM GSH. After 420 seconds, the PDI injection was replaced with an identical PDI buffer that also contained 80 μM of an anti-CTA antibody. This PDI / antibody mixture was perfused over the sensor slide at a flow rate of 45 μl / min for 420 seconds. Control experiments demonstrated that holotoxin disassembly did not occur upon exposure to either 1 mM GSH alone or to PDI in the absence of GSH.
Toxicity assay
CHO cells were seeded into 24 well plates and grown overnight to 80% confluency. The medium was removed and replaced with serum-free medium containing the stated concentrations of CT in the absence or presence of 10% glycerol. After a 2 hour incubation, the cells were washed with PBS and exposed to 0.25 mL of ice-cold acidic ethanol (1 M HCl: 100% EtOH at a 1:100 ratio) for 15 minutes at 4°C. The cell extracts were then transferred to microcentrifuge tubes and allowed to air dry at room temperature. cAMP levels were determined using an [125I]cAMP competition assay as per manufacturer's instructions (Amersham Biosciences). The basal levels of cAMP determined from unintoxicated cells were background-subtracted from the values obtained for toxin-treated cells; the maximal response from all conditions was arbitrarily set to 100%; and all other results were expressed as ratios of that 100% value. All conditions were performed in triplicate.
20S proteasome assay
A 100 μl master mix was prepared with 1 μg 20S proteasome, 5 μg substrate, 3 mM ATP, 10 mM β-ME, 10 mM MgCl2, 100 mM KCl, 0.1 mM CaCl2, and 50 mM Hepes (pH 7.5). A second master mix was prepared as above but with a final concentration of 10% glycerol. The mixtures were placed at 37°C, and 20 μl aliquots were removed at 0, 4, 8, and 20 hours of incubation. Samples were analyzed by SDS-PAGE with Coomassie staining.
Supplementary Material
Supplemental Figure Legends
Figure S1. Interaction of bisANS with CTA1 in the absence or presence of glycerol. 12 μM of a reduced CTA1/CTA2 heterodimer was incubated with 12 μM bisANS in the absence (a) or presence (b) of 10% glycerol. Fluorescence spectra were then recorded during a step-wise increase in temperature from 18°C to 55°C as represented by the change in color from blue to red. Experiments were performed using a J-810 spectrofluoropolarimeter with an excitation wavelength of 395 nm; excitation and emission slits were 2.5 nm and 5 nm, respectively. Control experiments both with and without glycerol demonstrated that bisANS fluorescence did not exhibit temperature-dependent changes in the absence of protein. These control experiments were performed over a range of temperatures from 18°C to 55°C. However, for clarity, only the measurements taken at 18°C and 55°C are shown as black lines. (a): The loss of fluorescence with increasing temperature indicated that CTA1 was undergoing a gradual transition to an unfolded state which no longer effectively shielded bisANS from water. Likewise, CTA1 samples treated with 2 or 6 M GdmHCl produced a weaker bisANS fluorescence signal than CTA1 samples incubated without denaturant (Ampapathi et. al. 2008 J. Mol. Biol. (377)748-760). (b): CTA1 samples treated with 10% glycerol produced an altered bisANS fluorescence signal. The bisANS signal dropped from 18°C to 32°C, increased from 34°C to 38°C, and dropped again at temperatures above 38°C. There was also a blue shift to the maximum emission wavelength when glycerol-treated CTA1 was heated to 38°C. An increase in fluorescence and a blue shift to the maximum emission wavelength occur when bisANS interacts with hydrophobic patches of molten globule folding intermediates. In contrast, native and unfolded variants of a protein do not produce these changes to bisANS fluorescence (Hawe, Sutter, and Jiskoot, 2008 Pharm. Research 25(7)1487-1499). Our data thus indicate that glycerol might exert its effect on CTA1 structure by impeding its thermal unfolding and keeping the toxin in a partially unfolded conformation, similar to the molten globule state, at physiological temperatures. (c): Changes to bisANS fluorescence were plotted as a function of temperature for both untreated (blue) and glycerol-treated (red) CTA1 samples. Consistent with our CD data, these experiments demonstrated that 10% glycerol altered the thermal unfolding properties of CTA1 and allowed it to maintain a partially folded conformation at physiological temperature.
Figure S2. Glycerol blocks the time-dependent appearance of CTA1 in the cytosol. HeLa cells were pulse-labeled at 4°C for 30 min with 1 μg / ml of CT. The cells were then chased for 1, 2, 3, 4, or 5 hr at 37°C in toxin-free medium that lacked or contained 10% glycerol. Selective permeabilization of the plasma membrane with digitonin was used to partition cell extracts into separate membrane and cytosolic fractions. An SPR sensor slide coated with an anti-CTA antibody was used to detect the cytosolic pools of CTA1 from untreated (green lines) or glycerol-treated (red lines). CTA standards (10 ng / ml, 1 ng / ml, and 0.1 ng / ml; black lines) were perfused over the sensor slide as positive controls. A cytosolic fraction from unintoxicated cells (blue line) was also generated for this experiment. A small pool of CTA1 was detected in the cytosol of untreated cells after 1 hr of chase. The amount of cytosolic CTA1 increased after 2 hr of chase and remained constant over 3 and 4 hr of chase. After five hours of chase, an additional increase in cytosolic CTA1 was detected. No cytosolic pool of CTA1 was detected at any time point for the glycerol-treated cells. At the end of each experiment, bound sample was stripped from the sensor slide with a PBST wash at pH 6.0.
Figure S3. CTA1 secretion from Vero cells. Vero cells pulse-labeled at 4°C for 30 min with 1 μg / ml of CT were chased for 2 hr at 37°C in toxin-free medium that lacked (no treatment) or contained 10% glycerol (+ glycerol). A separate set of intoxicated cells were chased in medium that contained either 5 μg / ml of BfA (+ BfA) or both 10% glycerol and 5 μg / ml of BfA (+ glycerol & BfA). Media samples from the intoxicated cells and from unintoxicated control cells were then analyzed by SPR with a sensor slide that had been coated with an anti-CTA antibody. CTA standards (10 ng / ml and 1 ng / ml) were also perfused over the sensor slide as positive controls. The arrow indicates when the sample was removed from the perfusion buffer. At the end of each experiment, bound sample was stripped from the sensor slide with a 5 min PBST wash at pH 6.0.
Acknowledgements
We thank Randall K. Holmes (University of Colorado Denver School of Medicine) for the CTA1-His6 construct. This work was supported by NIH grants K22 AI054568 and R03 AI067987 to K. Teter.
Abbreviations used
- BfA
brefeldin A
- CT
cholera toxin
- CD
circular dichroism
- ER
endoplasmic reticulum
- ERAD
ER-associated degradation
- EDTA
ethylenediaminetetraacetic acid
- β-ME
β-mercaptoethanol
- PBS
phosphate buffered saline
- PBST
PBS containing 1% Triton X-100
- PDI
protein disulfide isomerase
- SDS-PAGE
sodium dodecyl sulfate polyacrylamide gel electrophoresis
- Gsα
stimulatory α subunit of the heterotrimeric G protein
- SPR
surface plasmon resonance
- Tm
transition temperature
Footnotes
Publisher's Disclaimer: This is a PDF file of an unedited manuscript that has been accepted for publication. As a service to our customers we are providing this early version of the manuscript. The manuscript will undergo copyediting, typesetting, and review of the resulting proof before it is published in its final citable form. Please note that during the production process errors may be discovered which could affect the content, and all legal disclaimers that apply to the journal pertain.
Present address: Dr. Abhay H Pande Assistant Professor Department of Biotechnology National Institute of Pharmaceutical Education and Research (NIPER), Sec-67 S.A.S. Nagar (Mohali)-160062, India.
References
- 1.De Haan L, Hirst TR. Cholera toxin: a paradigm for multi-functional engagement of cellular mechanisms. Mol Membr Biol. 2004;21:77–92. doi: 10.1080/09687680410001663267. [DOI] [PubMed] [Google Scholar]
- 2.Sanchez J, Holmgren J. Cholera toxin structure, gene regulation and pathophysiological and immunological aspects. Cell Mol Life Sci. 2008;65:1347–1360. doi: 10.1007/s00018-008-7496-5. [DOI] [PMC free article] [PubMed] [Google Scholar]
- 3.Fishman PH. Internalization and degradation of cholera toxin by cultured cells: relationship to toxin action. J Cell Biol. 1982;93:860–865. doi: 10.1083/jcb.93.3.860. [DOI] [PMC free article] [PubMed] [Google Scholar]
- 4.Tran D, Carpentier JL, Sawano F, Gorden P, Orci L. Ligands internalized through coated or noncoated invaginations follow a common intracellular pathway. Proc Natl Acad Sci U S A. 1987;84:7957–7961. doi: 10.1073/pnas.84.22.7957. [DOI] [PMC free article] [PubMed] [Google Scholar]
- 5.Orlandi PA, Curran PK, Fishman PH. Brefeldin A blocks the response of cultured cells to cholera toxin. Implications for intracellular trafficking in toxin action. J Biol Chem. 1993;268:12010–12016. [PubMed] [Google Scholar]
- 6.Lencer WI, Tsai B. The intracellular voyage of cholera toxin: going retro. Trends Biochem Sci. 2003;28:639–645. doi: 10.1016/j.tibs.2003.10.002. [DOI] [PubMed] [Google Scholar]
- 7.Orlandi PA. Protein-disulfide isomerase-mediated reduction of the A subunit of cholera toxin in a human intestinal cell line. J Biol Chem. 1997;272:4591–4599. [PubMed] [Google Scholar]
- 8.Majoul I, Ferrari D, Soling HD. Reduction of protein disulfide bonds in an oxidizing environment. The disulfide bridge of cholera toxin A-subunit is reduced in the endoplasmic reticulum. FEBS Lett. 1997;401:104–108. doi: 10.1016/s0014-5793(96)01447-0. [DOI] [PubMed] [Google Scholar]
- 9.Tsai B, Rodighiero C, Lencer WI, Rapoport TA. Protein disulfide isomerase acts as a redox-dependent chaperone to unfold cholera toxin. Cell. 2001;104:937–948. doi: 10.1016/s0092-8674(01)00289-6. [DOI] [PubMed] [Google Scholar]
- 10.Teter K, Allyn RL, Jobling MG, Holmes RK. Transfer of the cholera toxin A1 polypeptide from the endoplasmic reticulum to the cytosol is a rapid process facilitated by the endoplasmic reticulum-associated degradation pathway. Infect Immun. 2002;70:6166–6171. doi: 10.1128/IAI.70.11.6166-6171.2002. [DOI] [PMC free article] [PubMed] [Google Scholar]
- 11.Teter K, Holmes RK. Inhibition of endoplasmic reticulum-associated degradation in CHO cells resistant to cholera toxin, Pseudomonas aeruginosa exotoxin A, and ricin. Infect Immun. 2002;70:6172–6179. doi: 10.1128/IAI.70.11.6172-6179.2002. [DOI] [PMC free article] [PubMed] [Google Scholar]
- 12.Teter K, Jobling MG, Holmes RK. A class of mutant CHO cells resistant to cholera toxin rapidly degrades the catalytic polypeptide of cholera toxin and exhibits increased endoplasmic reticulum-associated degradation. Traffic. 2003;4:232–242. doi: 10.1034/j.1600-0854.2003.00070.x. [DOI] [PubMed] [Google Scholar]
- 13.Winkeler A, Godderz D, Herzog V, Schmitz A. BiP-dependent export of cholera toxin from endoplasmic reticulum-derived microsomes. FEBS Lett. 2003;554:439–442. doi: 10.1016/s0014-5793(03)01217-1. [DOI] [PubMed] [Google Scholar]
- 14.Vembar SS, Brodsky JL. One step at a time: endoplasmic reticulum-associated degradation. Nat Rev Mol Cell Biol. 2008;9:944–957. doi: 10.1038/nrm2546. [DOI] [PMC free article] [PubMed] [Google Scholar]
- 15.Schmitz A, Herrgen H, Winkeler A, Herzog V. Cholera toxin is exported from microsomes by the Sec61p complex. J Cell Biol. 2000;148:1203–1212. doi: 10.1083/jcb.148.6.1203. [DOI] [PMC free article] [PubMed] [Google Scholar]
- 16.Bernardi KM, Forster ML, Lencer WI, Tsai B. Derlin-1 facilitates the retro-translocation of cholera toxin. Mol Biol Cell. 2008;19:877–884. doi: 10.1091/mbc.E07-08-0755. [DOI] [PMC free article] [PubMed] [Google Scholar]
- 17.Dixit G, Mikoryak C, Hayslett T, Bhat A, Draper RK. Cholera toxin up-regulates endoplasmic reticulum proteins that correlate with sensitivity to the toxin. Exp Biol Med (Maywood) 2008;233:163–175. doi: 10.3181/0705-RM-132. [DOI] [PubMed] [Google Scholar]
- 18.Rodighiero C, Tsai B, Rapoport TA, Lencer WI. Role of ubiquitination in retro-translocation of cholera toxin and escape of cytosolic degradation. EMBO Rep. 2002;3:1222–1227. doi: 10.1093/embo-reports/kvf239. [DOI] [PMC free article] [PubMed] [Google Scholar]
- 19.Sandvig K, van Deurs B. Membrane traffic exploited by protein toxins. Annu Rev Cell Dev Biol. 2002;18:1–24. doi: 10.1146/annurev.cellbio.18.011502.142107. [DOI] [PubMed] [Google Scholar]
- 20.Lord JM, Roberts LM, Lencer WI. Entry of protein toxins into mammalian cells by crossing the endoplasmic reticulum membrane: co-opting basic mechanisms of endoplasmic reticulum-associated degradation. Curr Top Microbiol Immunol. 2005;300:149–168. doi: 10.1007/3-540-28007-3_7. [DOI] [PubMed] [Google Scholar]
- 21.Hazes B, Read RJ. Accumulating evidence suggests that several AB-toxins subvert the endoplasmic reticulum-associated protein degradation pathway to enter target cells. Biochemistry. 1997;36:11051–11054. doi: 10.1021/bi971383p. [DOI] [PubMed] [Google Scholar]
- 22.Teter K, Jobling MG, Sentz D, Holmes RK. The cholera toxin A13 subdomain is essential for interaction with ADP-ribosylation factor 6 and full toxic activity but is not required for translocation from the endoplasmic reticulum to the cytosol. Infect Immun. 2006;74:2259–2267. doi: 10.1128/IAI.74.4.2259-2267.2006. [DOI] [PMC free article] [PubMed] [Google Scholar]
- 23.Ampapathi RS, Creath AL, Lou DI, Craft JW, Jr., Blanke SR, Legge GB. Order-disorder-order transitions mediate the activation of cholera toxin. J Mol Biol. 2008;377:748–760. doi: 10.1016/j.jmb.2007.12.075. [DOI] [PMC free article] [PubMed] [Google Scholar]
- 24.Pande AH, Scaglione P, Taylor M, Nemec KN, Tuthill S, Moe D, Holmes RK, Tatulian SA, Teter K. Conformational instability of the cholera toxin A1 polypeptide. J Mol Biol. 2007;374:1114–1128. doi: 10.1016/j.jmb.2007.10.025. [DOI] [PMC free article] [PubMed] [Google Scholar]
- 25.Goins B, Freire E. Thermal stability and intersubunit interactions of cholera toxin in solution and in association with its cell-surface receptor ganglioside GM1. Biochemistry. 1988;27:2046–2052. doi: 10.1021/bi00406a035. [DOI] [PubMed] [Google Scholar]
- 26.Surewicz WK, Leddy JJ, Mantsch HH. Structure, stability, and receptor interaction of cholera toxin as studied by Fourier-transform infrared spectroscopy. Biochemistry. 1990;29:8106–8111. doi: 10.1021/bi00487a017. [DOI] [PubMed] [Google Scholar]
- 27.Murayama T, Tsai SC, Adamik R, Moss J, Vaughan M. Effects of temperature on ADP-ribosylation factor stimulation of cholera toxin activity. Biochemistry. 1993;32:561–566. doi: 10.1021/bi00053a022. [DOI] [PubMed] [Google Scholar]
- 28.Forster ML, Sivick K, Park YN, Arvan P, Lencer WI, Tsai B. Protein disulfide isomerase-like proteins play opposing roles during retrotranslocation. J Cell Biol. 2006;173:853–859. doi: 10.1083/jcb.200602046. [DOI] [PMC free article] [PubMed] [Google Scholar]
- 29.Coux O, Tanaka K, Goldberg AL. Structure and functions of the 20S and 26S proteasomes. Annu Rev Biochem. 1996;65:801–847. doi: 10.1146/annurev.bi.65.070196.004101. [DOI] [PubMed] [Google Scholar]
- 30.Romisch K. A cure for traffic jams: small molecule chaperones in the endoplasmic reticulum. Traffic. 2004;5:815–820. doi: 10.1111/j.1600-0854.2004.00231.x. [DOI] [PubMed] [Google Scholar]
- 31.Shearer AG, Hampton RY. Structural control of endoplasmic reticulum-associated degradation: effect of chemical chaperones on 3-hydroxy-3-methylglutaryl-CoA reductase. J Biol Chem. 2004;279:188–196. doi: 10.1074/jbc.M307734200. [DOI] [PubMed] [Google Scholar]
- 32.Sato S, Ward CL, Krouse ME, Wine JJ, Kopito RR. Glycerol reverses the misfolding phenotype of the most common cystic fibrosis mutation. J Biol Chem. 1996;271:635–638. doi: 10.1074/jbc.271.2.635. [DOI] [PubMed] [Google Scholar]
- 33.Burrows JA, Willis LK, Perlmutter DH. Chemical chaperones mediate increased secretion of mutant alpha 1-antitrypsin (alpha 1-AT) Z: A potential pharmacological strategy for prevention of liver injury and emphysema in alpha 1-AT deficiency. Proc Natl Acad Sci U S A. 2000;97:1796–1801. doi: 10.1073/pnas.97.4.1796. [DOI] [PMC free article] [PubMed] [Google Scholar]
- 34.Brown CR, Hong-Brown LQ, Biwersi J, Verkman AS, Welch WJ. Chemical chaperones correct the mutant phenotype of the delta F508 cystic fibrosis transmembrane conductance regulator protein. Cell Stress Chaperones. 1996;1:117–125. doi: 10.1379/1466-1268(1996)001<0117:ccctmp>2.3.co;2. [DOI] [PMC free article] [PubMed] [Google Scholar]
- 35.Sandvig K, Madshus IH, Olsnes S. Dimethyl sulphoxide protects cells against polypeptide toxins and poliovirus. Biochem J. 1984;219:935–940. doi: 10.1042/bj2190935. [DOI] [PMC free article] [PubMed] [Google Scholar]
- 36.Quinones B, Massey S, Friedman M, Swimley MS, Teter K. Novel cell-based method to detect Shiga toxin 2 from Escherichia coli O157:H7 and inhibitors of toxin activity. Appl Environ Microbiol. 2009;75:1410–1416. doi: 10.1128/AEM.02230-08. [DOI] [PMC free article] [PubMed] [Google Scholar]
- 37.Argent RH, Parrott AM, Day PJ, Roberts LM, Stockley PG, Lord JM, Radford SE. Ribosome-mediated folding of partially unfolded ricin A-chain. J Biol Chem. 2000;275:9263–9269. doi: 10.1074/jbc.275.13.9263. [DOI] [PubMed] [Google Scholar]
- 38.Swaisgood HE. Review and update of casein chemistry. J Dairy Sci. 1993;76:3054–3061. doi: 10.3168/jds.S0022-0302(93)77645-6. [DOI] [PubMed] [Google Scholar]
- 39.Lencer WI, de Almeida JB, Moe S, Stow JL, Ausiello DA, Madara JL. Entry of cholera toxin into polarized human intestinal epithelial cells. Identification of an early brefeldin A sensitive event required for A1-peptide generation. J Clin Invest. 1993;92:2941–2951. doi: 10.1172/JCI116917. [DOI] [PMC free article] [PubMed] [Google Scholar]
- 40.Guerra L, Teter K, Lilley BN, Stenerlow B, Holmes RK, Ploegh HL, Sandvig K, Thelestam M, Frisan T. Cellular internalization of cytolethal distending toxin: a new end to a known pathway. Cell Microbiol. 2005;7:921–934. doi: 10.1111/j.1462-5822.2005.00520.x. [DOI] [PubMed] [Google Scholar]
- 41.Sacksteder CA, Whittier JE, Xiong Y, Li J, Galeva NA, Jacoby ME, Purvine SO, Williams TD, Rechsteiner MC, Bigelow DJ, Squier TC. Tertiary structural rearrangements upon oxidation of Methionine145 in calmodulin promotes targeted proteasomal degradation. Biophys J. 2006;91:1480–1493. doi: 10.1529/biophysj.106.086033. [DOI] [PMC free article] [PubMed] [Google Scholar]
- 42.Aridor M. Visiting the ER: the endoplasmic reticulum as a target for therapeutics in traffic related diseases. Adv Drug Deliv Rev. 2007;59:759–781. doi: 10.1016/j.addr.2007.06.002. [DOI] [PubMed] [Google Scholar]
- 43.Pande AH, Moe D, Jamnadas M, Tatulian SA, Teter K. The pertussis toxin S1 subunit is a thermally unstable protein susceptible to degradation by the 20S proteasome. Biochemistry. 2006;45:13734–13740. doi: 10.1021/bi061175+. [DOI] [PMC free article] [PubMed] [Google Scholar]
- 44.Mayerhofer PU, Cook JP, Wahlman J, Pinheiro TT, Moore KA, Lord JM, Johnson AE, Roberts LM. Ricin A chain insertion into endoplasmic reticulum membranes is triggered by a temperature increase to 37°C. J Biol Chem. 2009;284:10232–10242. doi: 10.1074/jbc.M808387200. [DOI] [PMC free article] [PubMed] [Google Scholar]
- 45.Sreerama N, Woody RW. Circular dichroism of peptides and proteins. In: Berova N, Nakanishi K, Woody RW, editors. Circular Dichroism: Principles and Applications. 2nd Edition John Wiley & Sons, Inc.; Hoboken, NJ: 2000. pp. 601–620. [Google Scholar]
- 46.Woody RW, Dunker AK. Aromatic and cysteine side-chain circular dichroism in proteins. In: Fasman GD, editor. Circular Dichroism and the Conformational Analysis of Biomolecules. Plenum Press; New York and London: 1996. pp. 109–157. [Google Scholar]
- 47.Homola J. Present and future of surface plasmon resonance biosensors. Anal Bioanal Chem. 2003;377:528–539. doi: 10.1007/s00216-003-2101-0. [DOI] [PubMed] [Google Scholar]
- 48.Bech E, Jakobsen J, Orntoft TF. ELISA-type titertray assay of IgM anti-GM1 autoantibodies. Clin Chem. 1994;40:1331–1334. [PubMed] [Google Scholar]
Associated Data
This section collects any data citations, data availability statements, or supplementary materials included in this article.
Supplementary Materials
Supplemental Figure Legends
Figure S1. Interaction of bisANS with CTA1 in the absence or presence of glycerol. 12 μM of a reduced CTA1/CTA2 heterodimer was incubated with 12 μM bisANS in the absence (a) or presence (b) of 10% glycerol. Fluorescence spectra were then recorded during a step-wise increase in temperature from 18°C to 55°C as represented by the change in color from blue to red. Experiments were performed using a J-810 spectrofluoropolarimeter with an excitation wavelength of 395 nm; excitation and emission slits were 2.5 nm and 5 nm, respectively. Control experiments both with and without glycerol demonstrated that bisANS fluorescence did not exhibit temperature-dependent changes in the absence of protein. These control experiments were performed over a range of temperatures from 18°C to 55°C. However, for clarity, only the measurements taken at 18°C and 55°C are shown as black lines. (a): The loss of fluorescence with increasing temperature indicated that CTA1 was undergoing a gradual transition to an unfolded state which no longer effectively shielded bisANS from water. Likewise, CTA1 samples treated with 2 or 6 M GdmHCl produced a weaker bisANS fluorescence signal than CTA1 samples incubated without denaturant (Ampapathi et. al. 2008 J. Mol. Biol. (377)748-760). (b): CTA1 samples treated with 10% glycerol produced an altered bisANS fluorescence signal. The bisANS signal dropped from 18°C to 32°C, increased from 34°C to 38°C, and dropped again at temperatures above 38°C. There was also a blue shift to the maximum emission wavelength when glycerol-treated CTA1 was heated to 38°C. An increase in fluorescence and a blue shift to the maximum emission wavelength occur when bisANS interacts with hydrophobic patches of molten globule folding intermediates. In contrast, native and unfolded variants of a protein do not produce these changes to bisANS fluorescence (Hawe, Sutter, and Jiskoot, 2008 Pharm. Research 25(7)1487-1499). Our data thus indicate that glycerol might exert its effect on CTA1 structure by impeding its thermal unfolding and keeping the toxin in a partially unfolded conformation, similar to the molten globule state, at physiological temperatures. (c): Changes to bisANS fluorescence were plotted as a function of temperature for both untreated (blue) and glycerol-treated (red) CTA1 samples. Consistent with our CD data, these experiments demonstrated that 10% glycerol altered the thermal unfolding properties of CTA1 and allowed it to maintain a partially folded conformation at physiological temperature.
Figure S2. Glycerol blocks the time-dependent appearance of CTA1 in the cytosol. HeLa cells were pulse-labeled at 4°C for 30 min with 1 μg / ml of CT. The cells were then chased for 1, 2, 3, 4, or 5 hr at 37°C in toxin-free medium that lacked or contained 10% glycerol. Selective permeabilization of the plasma membrane with digitonin was used to partition cell extracts into separate membrane and cytosolic fractions. An SPR sensor slide coated with an anti-CTA antibody was used to detect the cytosolic pools of CTA1 from untreated (green lines) or glycerol-treated (red lines). CTA standards (10 ng / ml, 1 ng / ml, and 0.1 ng / ml; black lines) were perfused over the sensor slide as positive controls. A cytosolic fraction from unintoxicated cells (blue line) was also generated for this experiment. A small pool of CTA1 was detected in the cytosol of untreated cells after 1 hr of chase. The amount of cytosolic CTA1 increased after 2 hr of chase and remained constant over 3 and 4 hr of chase. After five hours of chase, an additional increase in cytosolic CTA1 was detected. No cytosolic pool of CTA1 was detected at any time point for the glycerol-treated cells. At the end of each experiment, bound sample was stripped from the sensor slide with a PBST wash at pH 6.0.
Figure S3. CTA1 secretion from Vero cells. Vero cells pulse-labeled at 4°C for 30 min with 1 μg / ml of CT were chased for 2 hr at 37°C in toxin-free medium that lacked (no treatment) or contained 10% glycerol (+ glycerol). A separate set of intoxicated cells were chased in medium that contained either 5 μg / ml of BfA (+ BfA) or both 10% glycerol and 5 μg / ml of BfA (+ glycerol & BfA). Media samples from the intoxicated cells and from unintoxicated control cells were then analyzed by SPR with a sensor slide that had been coated with an anti-CTA antibody. CTA standards (10 ng / ml and 1 ng / ml) were also perfused over the sensor slide as positive controls. The arrow indicates when the sample was removed from the perfusion buffer. At the end of each experiment, bound sample was stripped from the sensor slide with a 5 min PBST wash at pH 6.0.