

Abstract
Retinotopic mapping is a basic feature of visual system organization, but its role in processing visual information is unknown. Mutant mice lacking the β2 subunit of nicotinic acetylcholine receptor have imprecise maps in both visual cortex (V1) and the superior colliculus (SC) due to the disruption of spontaneous retinal activity during development. Here, we use behavioral and physiological approaches to study their visual functions. We find that β2−/− mice fail to track visual stimuli moving along the nasotemporal axis in a subcortical optomotor behavior, but track normally along the dorsoventral axis. In contrast, these mice display normal acuity along both axes in the visual water task, a behavioral test of cortical functions. Consistent with the behavioral results, we find that V1 neurons in β2−/− mice have normal response properties, while SC neurons have disrupted receptive fields, including enlarged structure and decreased direction and orientation selectivity along the nasotemporal axis. The subcortical-specific deficits indicate that retinotopic map disruption has different impacts on the development of functional properties in V1 and the SC.
Introduction
Topographic mapping is a basic feature of neuronal projections in the nervous system, in which the spatial relationship between neurons in the origin structure is maintained in the target. In the visual system, topographically precise projections from retinal ganglion cells (RGCs) to their subcortical targets and to the cortex via the thalamus give rise to retinotopic maps in different visual structures. Although theoretical studies suggest that retinotopic organization reduces the global wiring cost by minimizing the distance between neurons representing adjacent points in the visual space (Chklovskii and Koulakov, 2004), its function in visual information processing remains largely unknown (Kaas, 1997; Weinberg, 1997).
The functional significance of retinotopic maps can be studied in mutant mice that have disrupted retinotopic projections due to developmental deficits. One of such mutant lines is that lacking the β2 subunit of nicotinic acetylcholine receptor (nAChR-β2−/−) (Picciotto et al., 1995; Xu et al., 1999). During development, waves of action potentials propagate across RGCs before eye opening (Galli and Maffei, 1988; Meister et al., 1991; Wong et al., 1993), and these spontaneous retinal waves are required for the refinement of synaptic connections in the visual system (Katz and Shatz, 1996; Huberman et al., 2008). In β2−/− mice, the precise structure of retinal waves is altered during the first postnatal week (Bansal et al., 2000; McLaughlin et al., 2003; Sun et al., 2008). Consequently, their retinotopic maps are scattered in both the primary visual cortex (V1) (Cang et al., 2005) and the superior colliculus (SC) (McLaughlin et al., 2003; Chandrasekaran et al., 2005; Mrsic-Flogel et al., 2005), a midbrain structure involved in a variety of visuomotor behaviors (Wurtz and Albano, 1980; Flandrin and Jeannerod, 1981; Freedman et al., 1996). Importantly, RGCs appear unaffected in β2−/− mice, having normal ON/OFF segregation (Bansal et al., 2000), spatial resolution (Rossi et al., 2001) and direction selectivity (Elstrott et al., 2008), making these mice a useful model to study the consequences of disrupting retinotopic maps on central visual functions.
With topographically imprecise input axons, the receptive fields of cortical and subcortical neurons may have disrupted spatial structure. Alternatively, individual neurons could still establish receptive fields of normal structures in altered locations. These two scenarios could have very different consequences on the tuning properties of single neurons and on visual behaviors of the whole animal. In this study, we find that the β2−/− mice fail to track stimuli moving along the nasotemporal (azimuth) axis in a subcortically driven optomotor behavior, but track normally along the dorsoventral (elevation) axis. In contrast, these mice display normal visual acuity along both axes in a behavioral test of cortical functions. Consistent with the behavioral results, V1 neurons in the β2−/− mice have normal visually evoked response properties. SC neurons in these mice, on the other hand, have abnormal receptive fields, including enlarged structure and disrupted direction and orientation selectivity along the azimuth axis. Together, the subcortical-specific deficits in β2−/− mice indicate that disruption of retinotopic map has different impacts on the functional properties in V1 and the SC.
Materials and Methods
Animals.
Mice lacking the β2 subunit of nicotinic acetylcholine receptors were generated originally in Dr. Art Beaudet's laboratory (Xu et al., 1999) at Baylor College of Medicine (Houston, TX) and backcrossed >20 generations onto the C57BL/6 background. We maintain colonies of heterozygous (β2+/−) and homozygous (β2−/−) mice in the animal facility at Northwestern University. Their genotypes were determined using the published protocol (Xu et al., 1999). Additional control experiments were performed on age-matched wild-type C57BL/6 mice. All animals were used in accordance with protocols approved by Northwestern University Institutional Animal Care and Use Committee.
Behavioral test of optokinetic head movement.
Optokinetic head movements of mice were examined with the apparatus developed by Glen Prusky and colleagues (CerebralMechanics) (Prusky et al., 2004; Douglas et al., 2005). In brief, the mouse was placed and allowed to move freely on an elevated platform surrounded by four computer monitors (Fig. 1A). The position and movement of the animal was monitored by a video camera positioned above the platform. The entire setup was enclosed with black acrylic glass to block environmental light, with mean luminance of 39 cd/m2 at the level of platform. During the test, a sinusoidal grating was drifting either vertically or horizontally on the monitors. WT mice tracked the grating with reflexive head movements in concert with its moving direction (see supplemental Video 1, available at www.jneurosci.org as supplemental material). The grating was clamped at 0.16 cycles per degree (cpd) because WT mice displayed higher contrast sensitivity at this spatial frequency (data not shown). Note that the test was repeated on a small number of animals with drifting gratings of lower spatial frequencies (0.04 and 0.08 cpd) and the same results were obtained (Fig. 1B; supplemental Fig. 1, available at www.jneurosci.org as supplemental material). For quantification, a standard testing session consisted of 10 consecutive trials, each of which was limited to 15 s. The moving direction of each trial was alternated consecutively between clockwise and counterclockwise for horizontally drifting gratings, or between upward and downward for vertically drifting gratings. A trial was considered “positive” if a head tracking behavior was observed within the 15 s limit. Such 10-trial sessions were performed 1–4 times for individual animals with the observer blind to their genotypes, often repeated for the same animals by a second observer independently (5 of 11 animals). The percentage of positive trials was used to quantify the difference between β2−/− mice and controls.
Figure 1.
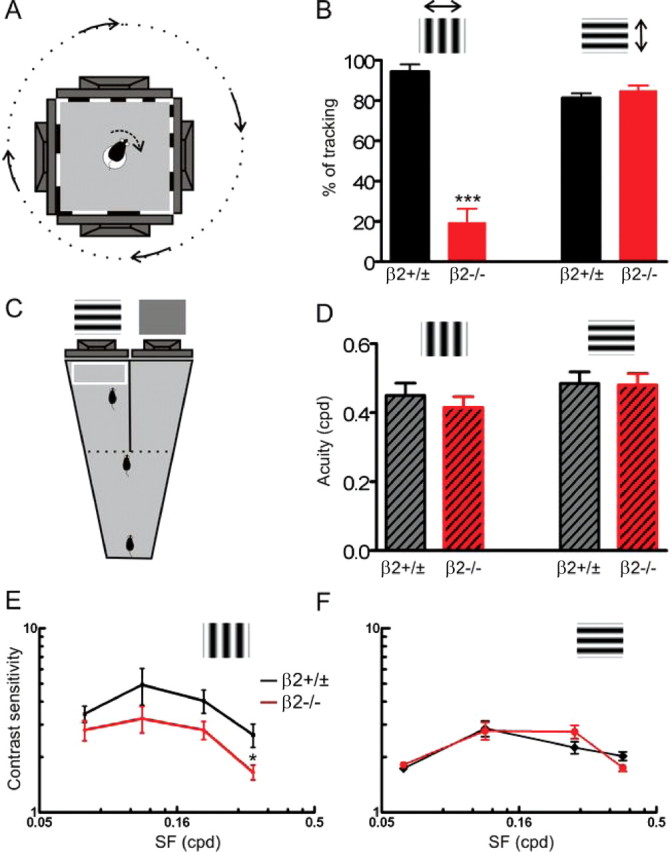
Direction-specific disruption of a subcortical visual behavior in β2−/− mice. A, A top-view diagram of the testing apparatus used in this study. B, β2−/− mice failed to track horizontally drifting vertical grating (p < 0.0001 compared with controls). No significant difference was observed between the two groups in the tracking of vertically drifting horizontal gratings (p = 0.27). C, Diagram of the visual water task, in which mice were trained to swim toward a grating-displaying monitor. D, β2−/− mice had normal visual acuity as tested in the visual water task for both vertical (p = 0.51) and horizontal (p = 0.92) grating stimuli. E, F, Contrast sensitivity of β2−/− (red) and control (black) mice for both vertical (E) and horizontal (F) gratings. Error bars represent SEM.
Visual water task.
Mice were trained to perform a forced-choice swimming test of visual discrimination. The testing apparatus was a custom-made trapezoidal shaped pool, 55 cm high, 140 cm long, 25 cm wide at the short end, and 80 cm wide at the long end (Fig. 1C). Two monitors were placed side by side next to the transparent wide end wall. A stationary sinusoidal grating, either vertical or horizontal, was displayed randomly on one of the monitors, while the other displayed uniform gray of the same mean luminance. During training and testing, the pool was filled with 22°C water to a depth of 15 cm. A moveable platform was submerged ∼1 cm below the water surface, directly underneath the monitor displaying the testing grating. A midline divider was placed between the monitors to partially bisect the tank. The divider extended from the transparent end wall to a variable endpoint, creating a choice line. The animals were released from the short end and swam toward the monitors. Once crossing the choice line, the animal was considered to have made a choice. The animal was rewarded quickly by being removed from the water if they chose the correct side and reached to the hidden escape platform or forced to swim longer if they chose incorrectly. Animals were trained using low-spatial-frequency gratings according to published procedures (Prusky et al., 2000; Prusky and Douglas, 2004) to achieve at least 80% accuracy in three consecutive sessions before testing (supplemental Fig. 2B, available at www.jneurosci.org as supplemental material). In the test of visual acuity, the spatial frequency of the testing grating was gradually increased, and the acuity was determined as the spatial frequency above which the success rate fell below 70% (supplemental Fig. 2C, available at www.jneurosci.org as supplemental material). Note that the tested spatial frequencies of the sinusoidal gratings were limited to those with full cycles on the monitor to eliminate differences in the mean luminance of the two monitors. Similarly, the animal's contrast sensitivity at a given spatial frequencies was determined by gradually decreasing the testing contrast to the point when the success rate fell below 70% (supplemental Fig. 2D, available at www.jneurosci.org as supplemental material).
In vivo physiology.
Adult mice between 2 and 10 months of age were anesthetized using urethane (1.2–1.3 g/kg in 10% saline solution, i.p.) and supplemented by the sedative chlorprothixene (10 mg/kg, i.m.) as previously described (Cang et al., 2008a). Atropine (0.3 mg/kg) and dexamethasone (2.0 mg/kg) were injected subcutaneously. Additional urethane (0.2–0.3 g/kg) was administered as needed. A tracheotomy was performed and electrocardiograph leads were attached across the skin to monitor the heart rate continuously throughout the experiment. The animal was placed in a stereotaxic apparatus on a heating pad. The animal's temperature was monitored with a rectal thermoprobe and maintained at 37°C though a feedback heater control module (Frederick Haer Company). Silicon oil was applied on both eyes to prevent from drying.
A craniotomy (∼4 mm2 for recording from the SC and ∼2 mm2 for V1) was performed on one hemisphere to expose the brain for recording. Tungsten microelectrodes (5–10 MΩ, FHC) were used to record from the SC and V1. Electrical signals, both spikes (filtered between 0.5 and 7 kHz and sampled at 25 kHz) and field potentials (filtered between 10 and 300 Hz and sampled at 800 Hz), were acquired using a System 3 workstation (Tucker Davis Technologies), and the spike waveforms were further sorted offline into single units using OpenSorter (Tucker Davis Technologies).
For recording from the SC, electrodes were inserted into the brain vertically at 0.7–1.5 mm lateral from the midline suture and 0.2–0.8 mm anterior from the lambda suture. As the electrode was advanced slowly to a depth of 1000–1500 μm, the surface of the SC could be identified by responses in local field potential and multiunit activity to ON–OFF flashes or sweeping bars at a specific location in the visual field. All cells in this study were encountered within 300 μm beneath the SC surface, corresponding to the superficial visual layers of the SC. For recording from V1, penetrations were made perpendicular to the pial surface at 2.8–3.3 mm lateral from the midline and 0.5–1.0 mm anterior from the lambda suture. Cells recorded across all layers were included in our analysis. The animals were killed at the end of recording with overdose of euthanasia solution (Euthasol from Virbac, 150 mg/kg, i.p.).
Visual stimuli and analysis of receptive field properties.
Visual stimuli were generated with Matlab programs developed originally by Dr. Cris Niell (Niell and Stryker, 2008) using the Psychophysics Toolbox extensions (Brainard, 1997; Pelli, 1997). The stimuli were displayed on a ViewSonic video monitor (40 × 30 cm, 60 Hz refresh rate, ∼35 cd/m2 mean luminance) placed 25 cm from the animal, contralateral to the recorded hemisphere. To determine receptive field structures of SC neurons, 5° light squares were flashed at different locations on a grid with 5° spacing. The flashes stayed ON for 500 ms on a gray background and OFF for 500 ms between stimuli, and were repeated for at least five times for each grid location in a pseudorandom sequence. Average spike rate in response to both flash onset and offset in the 1 s duration were calculated for each grid location. These values were linearly interpolated on the grid to give smooth images of receptive fields for figures (Fig. 2). The raw data, without interpolation, were fitted to a two-dimensional Gaussian with independent standard deviations, σx and σy, to quantify the receptive field size along the azimuth and elevation axes, respectively. The same procedure was applied for cortical neurons, except that sweeping short bars were used instead of flashing spots (Cang et al., 2008b). Specifically, light bars of either 2° × 6° or 4° × 8° were swept across the visual field at 30°/s along different horizontal and vertical positions. For sweeps at each position, the spikes were binned at 200 ms intervals, corresponding to 6° of visual space. The receptive field was then constructed using the position of the sweep along one axis and spike timing along the other. This process was repeated for all directions that evoked reliable responses, and the final size of the receptive field was calculated by weighting the average with the amplitude of the corresponding Gaussian fit of these directions.
Figure 2.

Abnormal receptive field structure of SC but not V1 neurons in β2−/− mice. A, Receptive field of a representative SC neuron in WT. The color scale represents the neuron's firing rate (spikes/s) in response to light squares flashing in the visual field. B, An example of enlarged receptive fields in the SC of β2−/− mutants. C, Quantification of receptive field size of SC neurons among different genotypes. The receptive fields in β2−/− mutants were enlarged along both azimuth (p < 0.001) and elevation (p < 0.001) axes compared with WT and β2+/− controls. No difference between WT and β2+/− mice was observed along either axis (p > 0.05). D–F, Examples (D, E) and quantification (F) of V1 receptive fields in WT (D) and β2−/− (E) mice. No difference of receptive field size was observed (p > 0.05). Error bars represent SEM.
We used drifting sinusoidal gratings to determine SC and V1 neurons' direction selectivity, orientation selectivity, and spatial tuning. In these experiments, the direction and spatial frequency of the gratings (full contrast unless otherwise indicated, and temporal frequency of 2 Hz) were varied between 0° and 360° (12 steps at 30° spacing, unless otherwise indicated) and 0.01 and 0.32 cycles/degree (6 logarithmic steps), respectively, in a pseudorandom order. The average spike rate during the 1.5 s presentation of each condition, subtracted with the spontaneous rate determined by a blank condition presentation, was calculated as the response magnitude (R). The preferred direction was determined as the one that gave maximum response, averaging across all spatial frequencies. The preferred spatial frequency was the one that gave the peak response at this direction. We then obtained a direction tuning curve at the preferred spatial frequency and calculated the direction selectivity index (DSI) as DSI = (Rpreferred − Ropposite)/(Rpreferred + Ropposite). Orientation selectivity index (OSI) was similarly calculated: OSI = (Rpreferred − Rorthogonal)/(Rpreferred + Rorthogonal), where Rorthogonal was the mean response of the two directions orthogonal to the preferred direction. Orientation tuning width was determined by obtaining the half-width at half-maximum response after fitting the tuning curve as the sum of two Gaussians (Niell and Stryker, 2008). Note that only cells that were well fitted were included in the analysis of tuning width.
We also studied responses of SC and V1 neurons to sweeping bars. A full-length single bar (5° wide) drifted perpendicular to their orientations at 30°/s and along different directions (12 steps at 30° spacing). The evoked responses were analyzed by computing peristimulus time histograms with bin size 100 ms. The peak firing rate (R) for each direction, with spontaneous rate subtracted, was used to generate the direction tuning curve and to calculate the DSI.
Statistical analysis.
All data values were presented as mean ± SEM, and differences in means were tested for significance using a Student's t test, unless otherwise indicated. Statistic analyses and graphing were done with Prism (GraphPad Software) and Matlab. In the figures, *p < 0.05, **p < 0.01, and ***p < 0.001.
Results
Disruption of subcortical but not cortical visual behavior in β2−/− mice
We first examined optomotor responses of β2−/− mice using a behavioral test (Fig. 1A) (Prusky et al., 2004). When presented with vertical sinusoidal gratings that were rotating along the nasotemporal (azimuth) axis in the visual field, wild-type (WT) and β2+/− mice displayed characteristic head movement in concert with the drifting stimuli (see supplemental Video 1, available at www.jneurosci.org as supplemental material). We quantified the occurrence of such optokinetic head tracking movement (see Materials and Methods) and found that the control mice tracked the stimulus almost every time it was shown (94.3 ± 3.7%, n = 5). In contrast, the β2−/− mice failed to track most times (19.7 ± 6.4%, n = 6, p < 0.0001) (Fig. 1B). Even for those considered as positive tracking, the head movements were often not in concert with the drifting grating as in the control mice. In other words, the optokinetic head movement, which is primarily mediated by subcortical visual centers (Douglas et al., 2005), was severely disrupted along the azimuth axis in the β2−/− mice. Surprisingly, when horizontal gratings were shown and drifting along the dorsoventral (elevation) axis in the visual field, the β2−/− mice displayed normal tracking behavior (see supplemental Video 2, available at www.jneurosci.org as supplemental material) and no difference was found between the β2−/− (85.1 ± 2.3%, n = 6) and control mice (81.3 ± 2.3%, n = 5; p = 0.27) (Fig. 1B). The same tests were also performed at lower spatial frequencies and similar observations were obtained (supplemental Fig. 1, available at www.jneurosci.org as supplemental material). Therefore, the disruption of optokinetic head movement was specific to the azimuth axis in the β2−/− mice.
We next tested whether visual behaviors in the β2−/− mice were similarly disrupted at the cortical level. We used a visual water task (Prusky et al., 2000), in which mice were trained to perform a swimming test of visual discrimination between one monitor displaying a sinusoidal grating and the other of uniform gray (Fig. 1C). During the training period, both β2−/− and control mice learned to perform the task with high accuracy after 15–20 sessions (supplemental Fig. 2B, available at www.jneurosci.org as supplemental material). We then determined their visual acuity by gradually increasing the spatial frequency (in cycles per degree, cpd) of the testing grating until the success rate fell below 70% (supplemental Fig. 2C, available at www.jneurosci.org as supplemental material). We tested vertical and horizontal orientations separately and found that the β2−/− mice had normal acuity (Fig. 1D) along both azimuth (0.42 ± 0.03 cpd, n = 4; compared with controls, 0.45 ± 0.04 cpd, n = 6; p = 0.51) and elevation (0.48 ± 0.03 cpd, n = 4; and controls, 0.49 ± 0.04 cpd, n = 6; p = 0.92) axes.
We also determined contrast thresholds of these mice at several spatial frequencies in the visual water task and inverted these values to obtain contrast sensitivity curves (Fig. 1E,F). In both β2−/− and control mice, these curves had a characteristic inverted “U” pattern (Douglas et al., 2005), with higher sensitivity at the mid range spatial frequencies. We saw a trend for the contrast sensitivity to be lower in the β2−/− mice along the azimuth axis (vertical gratings, n = 6 controls and 8 β2−/−), but a significant difference was only observed at 0.30 cpd (p = 0.02) (Fig. 1E). On the other hand, the values were indistinguishable between the two genotypes along the elevation axis (horizontal gratings, n = 8 controls and 7 β2−/−) (Fig. 1F). These results further indicate that visual cortical function is largely normal in the β2−/− mice.
Disruption of receptive field structure in the superior colliculus, but not in visual cortex, of β2−/− mice
It is surprising that β2−/− mice display a deficit in subcortical visual behavior but have normal cortical acuity, because our previous studies have shown that cortical retinotopic maps in these mice are more defective than subcortical maps (Cang et al., 2005). To investigate a possible neural correlate of the observed behavioral phenotypes, we examined visually evoked response properties of individual neurons in the central visual system. We focused our study on the primary visual cortex (V1) and the superior colliculus (SC), a midbrain structure that is involved in a variety of visuomotor behaviors (Wurtz and Albano, 1980; Flandrin and Jeannerod, 1981; Freedman et al., 1996).
We first determined the spatial structure of individual receptive fields in the superficial visual layers of the SC (sSC). sSC neurons' firing rates were determined in response to a light square flashing at different positions in the visual field and were used to construct their receptive fields. As shown in Figure 2A, WT receptive fields were compact and circular, with similar spatial extent along the azimuth and elevation axes. Almost all WT (54 of 59) receptive fields could be fitted to a two-dimensional Gaussian function, with standard deviation (hereafter referred to as radius) of 5.6 ± 0.2° along the azimuth axis and 4.9 ± 0.2° along elevation (Fig. 2C). Similar sizes of receptive fields were observed in β2+/− mice (azimuth: 6.4 ± 0.4° and elevation: 5.1 ± 0.3°, n = 64; p > 0.05 compared with WT, one-way ANOVA and Bonferroni posttest). In contrast, individual receptive fields in β2−/− mice were enlarged along both axes and more severely disrupted along the azimuth (Fig. 2B,C). On average, β2−/− receptive fields had an azimuth radius of 11.7 ± 0.6° and elevation radius of 7.3 ± 0.3° (n = 56 that can be fitted out of 78 cells), significantly greater than in WT and β2+/− (p < 0.001, one-way ANOVA and Bonferroni posttest). The β2−/− neurons had lower response magnitude compared with the controls (β2−/−: 8.4 ± 0.9 spikes/s; WT: 13.0 ± 2.5; and β2+/−: 16.2 ± 2.0; p < 0.001, one-way ANOVA and p < 0.05 between β2−/− and β2+/−). These results are consistent with a previous study of SC receptive fields in the β2−/− mouse (Chandrasekaran et al., 2005).
Most cortical neurons do not respond to flashing spots, so the above method of studying receptive field structure could not be effectively applied. Instead, we swept short bars along different horizontal and vertical positions and constructed receptive fields using the position of the sweep along one axis and spike timing along the other (Cang et al., 2008b; Niell and Stryker, 2008). Using this method, we found that the receptive fields of cortical neurons in WT, β2+/− and β2−/− mice were all of similar size (Fig. 2D–F) along both azimuth (WT: 5.7 ± 0.7°, n = 21; β2+/−: 4.5 ± 1.1°, n = 8; β2−/−: 6.2 ± 0.6°, n = 26; p = 0.27, one-way ANOVA) and elevation axes (WT: 4.2 ± 0.4°; β2+/−: 4.0 ± 1.2°; β2−/−: 4.5 ± 0.4°; p = 0.85). Together, these experiments indicate that receptive fields are spatially altered for sSC neurons, but not for cortical neurons, in β2−/− mice.
Abnormal direction and orientation selectivity of SC neurons in β2−/− mice
We next examined response properties of sSC and V1 neurons to drifting sinusoidal gratings, the same type of stimulus used in the optomotor test. The direction and spatial frequency of the gratings were varied between 0° and 360° (12 steps at 30° spacing) and 0.01 and 0.32 cpd (6 logarithmic steps), respectively. In the SC, the response magnitude was only slightly weaker in the β2−/− mice (11.8 ± 1.3 spikes/s, n = 57; compared with 16.0 ± 2.2 in WT and β2+/−, n = 80; p = 0.13). We observed a wide range of direction selectivity in the WT SC. An example of highly selective cells is shown in Figure 3. This cell responded strongly only over a particular range of directions (30–120°) and spatial frequencies (0.08 and 0.16 cpd). The tuning curve shown in Figure 3B demonstrates a complete preference of 90° (upward) movement over its opposite direction (270°), thus giving this neuron a direction selectivity index (DSI) of 1. On the other hand, many sSC neurons responded similarly to all directions and had small DSI. Overall, the mean DSI in the control mice was 0.36 ± 0.03. Across the population, ∼40% of sSC cells (n = 33 of 80) had DSI >0.33, a 2:1 ratio for the preferred direction over the opposite direction (Fig. 4A).
Figure 3.

Drifting grating-evoked responses of a direction-selective neuron in the SC. A, Spike rasters in response to drifting sinusoidal gratings of 12 directions and 6 spatial frequencies. Each column contains raster plots at one spatial frequency along 12 different directions. This neuron preferred upward moving (90°) gratings of 0.08 and 0.16 cpd. B, Direction tuning curve of this cell demonstrates its high selectivity for moving direction. C, Spatial frequency tuning curve of the same cell.
Figure 4.
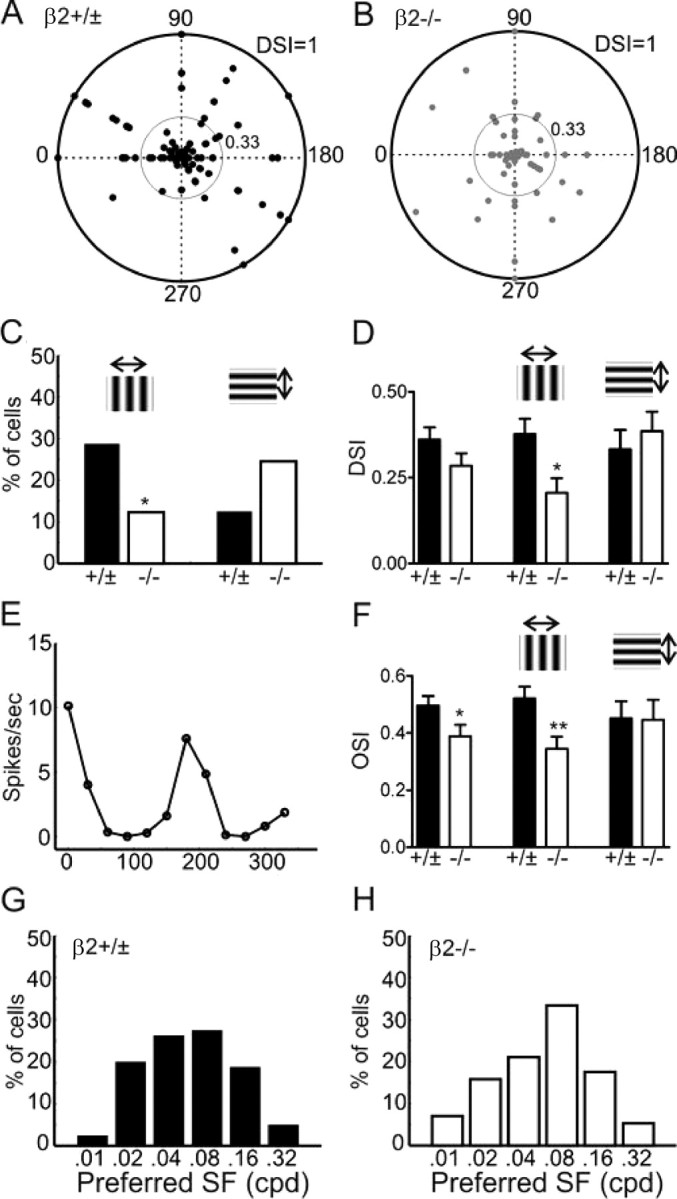
Disruption of direction and orientation selectivity along the azimuth axis in the SC of β2−/− mice. A, B, Polar plots of direction selectivity index (DSI, radii from the origin) and preferred direction (angles) of SC neurons in control (β2 +/±, in A) and β2−/− (B) mice. The outer circles in both plots represent DSI value of 1, and the inner circles of 0.33. C, Percentage of direction selective cells (DSI >0.33) preferring either horizontally (left) or vertically (right) moving gratings. D, Mean DSI of SC neurons in control and β2−/− mice, for all cells (left), cells with peak responses to horizontally moving gratings (middle), or to vertically moving gratings (right). E, Tuning curve of an orientation-selective SC neuron. F, Mean orientation selectivity index (OSI) of SC neurons in control and mutant mice, with cells grouped the same way as in (D). G, H, Distribution of the preferred spatial frequency (SF) of SC neurons in control (G) and β2−/− (H) mice. All error bars represent SEM.
In the β2−/− mice, sSC neurons had DSI of 0.29 ± 0.04, with 37% of cells (n = 21/57) having DSI >0.33 (Fig. 4B). Although both measurements were similar to the controls across the whole population (p = 0.14 for comparing mean DSI), the distribution of DSI in the β2−/− mice appeared abnormal along the horizontal axis (Fig. 4B). To quantify this observation, we divided the neurons into two groups based on their preferred directions, one preferring horizontally moving gratings (directions of 0° and 180°, and their immediate neighbors, 30°, 150°, 210°, and 330°) and the other preferring vertically moving gratings (60°, 90°, 120°, 240°, 270°, and 300°). In control mice, 29% of cells (n = 23/80) had DSI >0.33 and preferred horizontal motions. In contrast, only 12% of cells in β2−/− mice (n = 7/57) strongly preferred horizontal directions (Fig. 4C) (p < 0.05 compared with the controls, χ2 test). Interestingly, more β2−/− cells (25%, n = 14/57) preferred vertical directions than in the controls (13%, n = 10/80). The disruption of direction selectivity along the horizontal axis was still apparent when all cells were included in the analysis (instead of only those with DSI >0.33). For all the cells that had maximum responses to horizontally moving gratings, the mean DSI was much smaller in the β2−/− mice (0.21 ± 0.04, n = 32) than in the controls (0.38 ± 0.04, n = 51; p < 0.05) (Fig. 4D). In contrast, the DSI of cells that responded maximally to vertical motions was similar between the β2−/− (0.39 ± 0.06, n = 25) and controls (0.33 ± 0.06, n = 29; p = 0.51). In other words, the sSC neurons in β2−/− mice become much less selective for stimulus direction along the azimuth axis, but remain largely normal along the elevation axis.
To our surprise, we found that some sSC neurons displayed orientation selective responses to drifting gratings (Fig. 4E), a tuning property that had not been reported for SC neurons in mice (Drager and Hubel, 1975) but was recently observed for the most superficial neurons in rats (Girman and Lund, 2007). We calculated an orientation selectivity index (OSI) to quantify the degree of selectivity and found that there were fewer selective cells in the β2−/− (n = 27 of 57, 47%, had OSI >0.33) than in the controls (65%, n = 52 of 80). When the cells were divided into the same two groups based on their preferred directions, OSI was significantly smaller along the horizontal axis in the β2−/− mice (0.34 ± 0.04, n = 32; compared with the controls 0.52 ± 0.04, n = 51; p < 0.01) (Fig. 4F), but not along the vertical axis (β2−/−: 0.45 ± 0.06, n = 25; controls: 0.45 ± 0.07, n = 29; p = 0.95). The tuning width was similar between the β2−/− (39.9° ± 3.5°, n = 20) and the controls (37.0° ± 1.6°, n = 40; p = 0.38) (supplemental Fig. 3, available at www.jneurosci.org as supplemental material).
Finally, we examined spatial frequency tuning of sSC neurons. With some small variability, no difference of spatial frequency tuning was observed between the control and β2−/− mice (Fig. 4G,H). In both genotypes, most sSC neurons were tuned to the mid range of the tested spatial frequencies (Fig. 4G,H). It was somewhat surprising that the β2−/− neurons had normal spatial tuning given their enlarged receptive fields. We compared the receptive field size and the preferred spatial frequency of individual neurons and found no systematic relationship between the two in control (p = 0.73) or β2−/− mice (p = 0.14) (supplemental Fig. 4A, available at www.jneurosci.org as supplemental material). The lack of correlation is probably due to the fact that almost all sSC neurons respond to both ON and OFF stimuli within the same regions of their receptive fields (data not shown), like complex cells in the cortex. Similarly, the receptive field structure of sSC neurons as determined by our method did not predict orientation selectivity (supplemental Fig. 4B, available at www.jneurosci.org as supplemental material), suggesting a role of other factors such as intracollicular interactions in determining tuning properties.
Normal cortical responses to drifting gratings in β2−/− mice
We used the same visual stimuli to study response properties of cortical neurons in the β2−/− mice. The response magnitude was similar between the β2−/− cortical cells (8.0 ± 1.0 spikes/s, n = 73) and the controls (9.8 ± 1.1, n = 73; p = 0.23). In contrast to the disruption in the SC, V1 neurons of β2−/− mice showed normal orientation and direction selectivity (Fig. 5). First, V1 cells were highly selective for stimulus orientation in both control (OSI: 0.77 ± 0.03, with 67/73 cells having OSI >0.33) and β2−/− mice (0.70 ± 0.04, 60/73 having OSI >0.33; p = 0.15). DSI was also similar between them (controls: 0.33 ± 0.03; β2−/−: 0.34 ± 0.03; p = 0.93). No difference was seen even as the cells were grouped based on their preferred directions (Fig. 5C,D) (p > 0.2 for all comparisons), like in the above analysis of SC neurons. The tuning width was also similar between the two genotypes (p = 0.15) (Fig. 5E; supplemental Fig. 5, available at www.jneurosci.org as supplemental material). We next analyzed the linearity of the grating-evoked responses by calculating the F1/F0 ratio (Niell and Stryker, 2008). The distribution of F1/F0 ratio is nearly identical in β2−/− and control mice (Fig. 5F), with most cells being linear (F1/F0 > 1) in both (62% in β2−/− and 59% in controls). For spatial tuning, the majority of recorded V1 cells preferred low spatial frequencies of gratings, and similar distributions were found in control and mutant mice (Fig. 5G,H).
Figure 5.
Normal cortical responses to drifting gratings in β2−/− mice. A, Tuning curve of an orientation-selective neuron in the V1 of a β2−/− mouse. B, Spatial frequency tuning curve of the same cell. C, D, Mean OSI (C) and DSI (D) of V1 neurons in control and mutant mice, for all cells (left of each panel), cells with the preferred direction along the horizontal axis (middle), or along the vertical axis (right). E, Tuning width of control and β2−/− mice. F, Cumulative distribution of F1/F0 ratio of responses to drifting gratings for both control (black) and β2−/− (dotted gray line). G, H, Distribution of the preferred spatial frequency of V1 neurons in control (G) and β2−/− (H) mice. Error bars represent SEM.
We also examined cortical responses at different contrasts. In these experiments, we used gratings at individual neurons' preferred spatial frequencies and varied the direction with 15° spacing (24 steps) at 50% and 100% contrasts. The responses of each neuron were normalized by its maximum response magnitude. At 50% contrast, the normalized response to the preferred direction was slightly lower in the β2−/− mice (0.37 ± 0.04, n = 43; compared with 0.46 ± 0.04 in controls, n = 41; p = 0.15) (Fig. 6A), reminiscent of the trend of lower contrast sensitivity in the water maze test (Fig. 1E). More importantly, the orientation tuning width was contrast invariant in the β2−/− mice (Fig. 6B), an important feature of orientation selectivity recently confirmed in WT mice (Niell and Stryker, 2008). Together, these analyses indicate that cortical cells in the β2−/− mice have normal response properties to drifting gratings.
Figure 6.

Cortical orientation tuning remains contrast invariant in β2−/− mice. A, Normalized response at 50% contrast in WT and β2−/− mice. B, Tuning width at 50% (x-axis) and 100% (y-axis) contrast of individual neurons, with most points lying next to the unity line (the dotted line).
Abnormal SC responses to sweeping bars in β2−/− mice
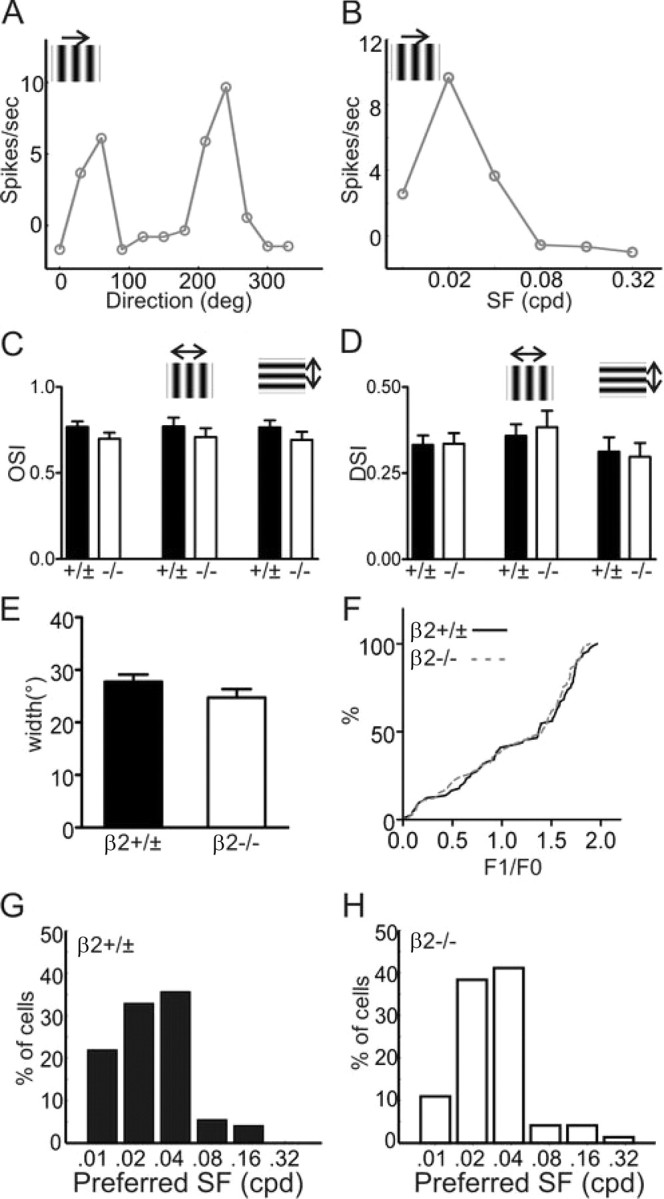
In addition to the drifting sinusoidal gratings, we also used sweeping bars to assay direction selectivity of sSC and V1 neurons (Fig. 7A). Many neurons only responded when the single light bar moved across their receptive fields along certain directions (Fig. 7B), displaying a high degree of direction selectivity (Fig. 7C). In the sSC, the DSI to the long bar stimuli was 0.41 ± 0.03 in the control mice (n = 70), similar to the value determined with drifting gratings. The sSC neurons in the β2−/− mice had a similar DSI distribution as in the controls (0.34 ± 0.03, n = 62; p = 0.28, Kolmogorov–Smirnov test) (Fig. 7D). However, when we separated the cells into horizontal- and vertical-motion-preferring groups, an obvious difference was seen. For the cells that preferred horizontally moving bars (Fig. 7E), the DSI distribution shifted to the left in the β2−/− mice (0.22 ± 0.04, n = 20; controls: 0.33 ± 0.05, n = 27; p < 0.05, K–S test). For vertical-motion-preferring cells (Fig. 7F), on the other hand, the DSI distribution was similar between control (0.46 ± 0.05, n = 43) and β2−/− mice (0.40 ± 0.04, n = 42; p = 0.49, K–S test). In other words, the direction selectivity in the SC was reduced along and only along the horizontal axis in the β2−/− mice, exactly like in the results obtained with drifting gratings. Also in agreement with those results, the direction selectivity in V1 determined this way was similar between control and β2−/− mice, whether considering all cells (Fig. 7G) (p = 0.77) or separating them based on their preferred directions (Fig. 7H,I) (p = 0.79 and 0.34, respectively).
Figure 7.

Abnormal responses to sweeping bars in the SC, but not V1, of β2−/− mice. A, Direction selectivity of SC and V1 neurons were studied with full-length bars drifting perpendicular to their orientations. B, Peristimulus time histograms of a SC neuron in response to long bars drifting along different directions. C, Direction tuning curve of the same cell, showing high selectivity. D, Cumulative distributions of the DSI of SC neurons. The distributions are similar between β2−/− (red) and control (black) mice (p = 0.28). E, F, DSI cumulative distributions for SC neurons with peak responses along the horizontal axis (E, p < 0.05 comparing β2−/− and control mice), or along the vertical axis (F, p = 0.49). G–I, Cumulative distributions of the DSI in V1, for all recorded neurons (G), neurons with peak responses along the horizontal axis (H), or along the vertical axis (I). No significant difference between β2−/− (red) and controls (black) was seen in any comparison.
Together, our physiological experiments demonstrate that the receptive fields and motion selective responses are disrupted at the single-cell level in the SC, but not V1, of the β2−/− mice. Such disruption is more severe or even exclusive along the azimuth axis, consistent with the behavioral deficit observed in these mice.
Discussion
Differences in the development of cortical and subcortical receptive field properties
A surprising finding in this study is the selective disruption of collicular, but not cortical, receptive fields in β2−/− mice. We and others have previously shown that retinotopic maps in both the SC and V1 of β2−/− mice are topographically scattered (Cang et al., 2005; Mrsic-Flogel et al., 2005) due to imprecise projections of afferent axons (McLaughlin et al., 2003; Cang et al., 2005; Chandrasekaran et al., 2005). In the absence of a precise map, individual neurons could still establish receptive fields of normal structures, but in altered locations. Alternatively, receptive fields of individual neurons could have disrupted structures. We have observed both scenarios in β2−/− mice, the former in V1, with normal structures and tuning properties despite disrupted geniculocortical map, and the latter in the SC, displaying enlarged structure and decreased direction and orientation selectivity.
What might account for the observed differences between SC and V1 receptive fields in β2−/− mice? A likely candidate is that the two structures develop in different time courses and use different plasticity rules. It was shown in rats that SC receptive fields around the time of eye opening had similar sizes (Binns and Salt, 1997) and direction selectivity (Fortin et al., 1999) as in adults, indicating limited refinement after eye opening (postnatal day 12–14 in rodents). Indeed, recent in vitro studies suggest that synaptic strength and precision reach adult level by P8 in WT mice (Chandrasekaran et al., 2007). This maturation process is delayed to the second postnatal week in β2−/− mice due to the disruption of early retinal waves, resulting in larger receptive fields (Chandrasekaran et al., 2007). Receptive fields in V1, on the other hand, are still immature at the time of eye opening. In rats, cortical receptive fields at P17–P19 are five times larger than in the adult and orientation selectivity is almost absent (Fagiolini et al., 1994). Dark rearing or monocular deprivation after eye opening impairs the normal refinement and maturation of these response properties (Fagiolini et al., 1994). In ferrets, cortical orientation selectivity is disrupted by visual deprivation (Chapman and Stryker, 1993; Chapman et al., 1996; Crair et al., 1998; White et al., 2001). Even more interestingly, direction selectivity of cortical neurons does not emerge until after eye opening in ferrets and visual experience of moving stimuli can drive this process (Li et al., 2006, 2008). Together, these and a number of in vitro studies (Desai et al., 2002; Maffei et al., 2004, 2006) suggest that visually evoked activity could selectively wire geniculocortical and intracortical circuits facing scrambled afferent axons to give cortical neurons normal response properties. Such an experience-dependent rewiring, if indeed occurring, should be limited by the severity of the input disruption. Cortical receptive fields are indeed enlarged in the mutant mice deficient in both retinal waves and the molecular guidance cue ephrin-As, presumably unable to overcome the effects of nearly abolished geniculocortical map (Cang et al., 2008b). Experience-dependent refinement was also observed for retinogeniculate synapses (Hooks and Chen, 2006, 2008), consistent with the normal geniculate receptive fields in the absence of precise retinogeniculate maps (Grubb et al., 2003; Grubb and Thompson, 2004).
Blocking early retinal activity in ferrets was shown to disrupt ocular dominance columns and lead to large receptive fields of binocular, but not monocular neurons, in the visual cortex (Huberman et al., 2006). Many of our recorded cortical neurons (Fig. 2) were in fact binocular, but we did not observe any increase in their receptive field size. The difference could be due to the strong contralateral bias in the mouse visual cortex, even within the binocular zone, compared with the ferret cortex. It is important to note that we were unable to reveal the receptive field structure of all recorded cortical cells, as a significant population of them, in both WT and mutant mice, did not respond to the short bar stimuli. Consequently, it is possible that some of these cells could have enlarged receptive fields. Even if this were true, however, all recorded cortical cells responded to drifting gratings with normal tuning properties despite the disrupted retinotopic map, in strong contrast to those in the SC.
Cross-analysis of behavioral and physiological results
Ablating visual cortex results in reduced acuity and contrast sensitivity in the visual water task (Prusky and Douglas, 2004), demonstrating that it is a behavioral test of cortical functions. The similar acuity between β2−/− mice and WTs in the water task indicates that their cortical function is largely normal. This is in contrast to a previous report using visually evoked potentials to show that β2−/− mice had lower cortical acuity (Rossi et al., 2001). The discrepancy is likely due to methodological differences. Visually evoked potentials measure averaged activity of a population of neurons in response to flashing gratings of different spatial frequencies. In β2−/− mice, the positions of individual receptive fields are topographically scattered (Cang et al., 2005), which might give rise to lower spatial resolution as the activity of many neurons is averaged. Our behavioral and physiological data thus suggest that the spatial structures and response properties of single receptive fields, which are normal in β2−/− mice, are more relevant to behavioral acuity. The trend of lower contrast sensitivity in the water maze test (Fig. 1E) and lower cortical responses at 50% contrast (Fig. 6A) suggests that β2−/− cortical functions may not be entirely normal at lower contrasts. Future studies will be needed to pinpoint systematically whether and where along the visual pathways the contrast sensitivity is altered in β2−/− mice.
Compared with the visual water task, less is known about which visual structures mediate optokinetic head tracking in the mouse. Because cortical lesions have no effect on visual acuity or contrast sensitivity in this test (Douglas et al., 2005), it must be mediated by subcortical structures. A possible candidate is the accessory optical system, as lesion experiments in lower vertebrates suggested that it is involved in optokinetic eye movement (Simpson, 1984). The SC, which is known to initiate head and eye movement in orienting behaviors (Wurtz and Albano, 1980), may also be involved in optokinetic responses. Unilateral lesions of the SC in cats and monkeys decreased or even eliminated optokinetic responses to stimuli moving along the temporal-to-nasal direction in the hemifield contralateral to the operated side (Denny-Brown, 1962; Flandrin and Jeannerod, 1981). Although the exact function of the SC in optokinetic head movement is unknown, our physiological results provide a possible neural correlate for the observed behavioral defects. The receptive fields of SC neurons in β2−/− mice are more than doubled along the azimuth axis and much fewer cells prefer horizontally moving gratings. The reduced direction selectivity along the azimuth axis is thus consistent with the behavioral deficit in optokinetic response.
Direction-specific disruptions of visual functions in β2−/− mice
The behavioral and receptive field deficits in the β2−/− mouse are exclusively or much more prominent along the azimuth axis. Similar asymmetric disruptions were also observed for large-scale mapping of retinogeniculate (Grubb et al., 2003), retinocollicular (Chandrasekaran et al., 2005), and geniculocortical projections (Cang et al., 2005). Given that correlated retinal activity still exists in the β2−/− mouse (Sun et al., 2008), it is conceivable that the remnant retinal waves travel predominantly along the elevation axis. In other words, the patterns of retinal activity in the β2−/− mouse may still carry retinotopic information along the elevation axis but not along the azimuth axis. Alternatively, activity-dependent refinement may contribute more to visual system development along the azimuth axis in WT animals, so that alteration of the patterned retinal activity preferably disrupts the azimuth axis. In support of this possibility, a recent study suggests that retinal waves travel preferentially along the nasotemporal axis in WT retinas and this bias is absent in β2−/− mice (B. K. Stafford, A. Sher, A. M. Litke, and D. A. Feldheim, unpublished work). Because the patterns of retinal activity have only been studied in vitro in WT and β2−/− mice, in vivo recordings, preferably from awake animals, are needed to address the above possibilities.
We have interpreted the SC receptive field deficits in β2−/− mice as resulting from disrupted retinotopic maps due to altered retinal waves during development. However, the deletion of the β2-nAChR subunit in the adult retina or the SC could also lead to abnormal response properties in the SC. The azimuth-specific disruption of direction and orientation selectivity in the β2−/− SC suggests that the above possibility is unlikely, because no asymmetric expression of the β2-nAChR subunit has been observed in the visual system. In addition, RGCs in β2−/− mice have normal spatial resolution (Rossi et al., 2001) and direction selectivity (Elstrott et al., 2008), indicating that deletion of the β2-nAChR subunit in the adult retina does not contribute to the observed receptive field deficits in the SC.
In summary, we have studied visual behaviors and receptive field properties of nAChR-β2−/− mice, an animal model for studying the role of early retinal waves in visual system development. Our experiments reveal previously unrecognized behavioral and physiological phenotypes in these mice and add new knowledge to the understanding of functional organization and development of the visual system.
Footnotes
This work was supported by U.S. National Institutes of Health (NIH) grants (EY018621 to J.C. and EY019034 to X.L.), a Sloan Research Fellowship, a Klingenstein Fellowship Award in Neurosciences, and a Brain Research Foundation Seed Grant to J.C. We thank Professors Larry Pinto and John Troy for sharing their behavior testing apparatuses, Dr. Cris Niell for providing the code of displaying visual stimuli, Dr. Dave Feldheim for sharing unpublished data and comments on the manuscript, and Dr. François Grimbert for discussions and comments.
References
- Bansal A, Singer JH, Hwang BJ, Xu W, Beaudet A, Feller MB. Mice lacking specific nicotinic acetylcholine receptor subunits exhibit dramatically altered spontaneous activity patterns and reveal a limited role for retinal waves in forming ON and OFF circuits in the inner retina. J Neurosci. 2000;20:7672–7681. doi: 10.1523/JNEUROSCI.20-20-07672.2000. [DOI] [PMC free article] [PubMed] [Google Scholar]
- Binns KE, Salt TE. Post eye-opening maturation of visual receptive field diameters in the superior colliculus of normal- and dark-reared rats. Brain Res Dev Brain Res. 1997;99:263–266. doi: 10.1016/s0165-3806(97)00004-7. [DOI] [PubMed] [Google Scholar]
- Brainard DH. The Psychophysics Toolbox. Spat Vis. 1997;10:433–436. [PubMed] [Google Scholar]
- Cang J, Rentería RC, Kaneko M, Liu X, Copenhagen DR, Stryker MP. Development of precise maps in visual cortex requires patterned spontaneous activity in the retina. Neuron. 2005;48:797–809. doi: 10.1016/j.neuron.2005.09.015. [DOI] [PMC free article] [PubMed] [Google Scholar]
- Cang J, Wang L, Stryker MP, Feldheim DA. Roles of ephrin-as and structured activity in the development of functional maps in the superior colliculus. J Neurosci. 2008a;28:11015–11023. doi: 10.1523/JNEUROSCI.2478-08.2008. [DOI] [PMC free article] [PubMed] [Google Scholar]
- Cang J, Niell CM, Liu X, Pfeiffenberger C, Feldheim DA, Stryker MP. Selective disruption of one Cartesian axis of cortical maps and receptive fields by deficiency in ephrin-As and structured activity. Neuron. 2008b;57:511–523. doi: 10.1016/j.neuron.2007.12.025. [DOI] [PMC free article] [PubMed] [Google Scholar]
- Chandrasekaran AR, Plas DT, Gonzalez E, Crair MC. Evidence for an instructive role of retinal activity in retinotopic map refinement in the superior colliculus of the mouse. J Neurosci. 2005;25:6929–6938. doi: 10.1523/JNEUROSCI.1470-05.2005. [DOI] [PMC free article] [PubMed] [Google Scholar]
- Chandrasekaran AR, Shah RD, Crair MC. Developmental homeostasis of mouse retinocollicular synapses. J Neurosci. 2007;27:1746–1755. doi: 10.1523/JNEUROSCI.4383-06.2007. [DOI] [PMC free article] [PubMed] [Google Scholar]
- Chapman B, Stryker MP. Development of orientation selectivity in ferret visual cortex and effects of deprivation. J Neurosci. 1993;13:5251–5262. doi: 10.1523/JNEUROSCI.13-12-05251.1993. [DOI] [PMC free article] [PubMed] [Google Scholar]
- Chapman B, Stryker MP, Bonhoeffer T. Development of orientation preference maps in ferret primary visual cortex. J Neurosci. 1996;16:6443–6453. doi: 10.1523/JNEUROSCI.16-20-06443.1996. [DOI] [PMC free article] [PubMed] [Google Scholar]
- Chklovskii DB, Koulakov AA. Maps in the brain: what can we learn from them? Annu Rev Neurosci. 2004;27:369–392. doi: 10.1146/annurev.neuro.27.070203.144226. [DOI] [PubMed] [Google Scholar]
- Crair MC, Gillespie DC, Stryker MP. The role of visual experience in the development of columns in cat visual cortex. Science. 1998;279:566–570. doi: 10.1126/science.279.5350.566. [DOI] [PMC free article] [PubMed] [Google Scholar]
- Denny-Brown D. The midbrain and motor integration. Proc R Soc Med. 1962;55:527–538. doi: 10.1177/003591576205500701. [DOI] [PMC free article] [PubMed] [Google Scholar]
- Desai NS, Cudmore RH, Nelson SB, Turrigiano GG. Critical periods for experience-dependent synaptic scaling in visual cortex. Nat Neurosci. 2002;5:783–789. doi: 10.1038/nn878. [DOI] [PubMed] [Google Scholar]
- Douglas RM, Alam NM, Silver BD, McGill TJ, Tschetter WW, Prusky GT. Independent visual threshold measurements in the two eyes of freely moving rats and mice using a virtual-reality optokinetic system. Vis Neurosci. 2005;22:677–684. doi: 10.1017/S0952523805225166. [DOI] [PubMed] [Google Scholar]
- Drager UC, Hubel DH. Physiology of visual cells in mouse superior colliculus and correlation with somatosensory and auditory input. Nature. 1975;253:203–204. doi: 10.1038/253203a0. [DOI] [PubMed] [Google Scholar]
- Elstrott J, Anishchenko A, Greschner M, Sher A, Litke AM, Chichilnisky EJ, Feller MB. Direction selectivity in the retina is established independent of visual experience and cholinergic retinal waves. Neuron. 2008;58:499–506. doi: 10.1016/j.neuron.2008.03.013. [DOI] [PMC free article] [PubMed] [Google Scholar]
- Fagiolini M, Pizzorusso T, Berardi N, Domenici L, Maffei L. Functional postnatal development of the rat primary visual cortex and the role of visual experience: dark rearing and monocular deprivation. Vision Res. 1994;34:709–720. doi: 10.1016/0042-6989(94)90210-0. [DOI] [PubMed] [Google Scholar]
- Flandrin JM, Jeannerod M. Effects of unilateral superior colliculus ablation on oculomotor and vestibulo-ocular responses in the cat. Exp Brain Res. 1981;42:73–80. doi: 10.1007/BF00235731. [DOI] [PubMed] [Google Scholar]
- Fortin S, Chabli A, Dumont I, Shumikhina S, Itaya SK, Molotchnikoff S. Maturation of visual receptive field properties in the rat superior colliculus. Brain Res Dev Brain Res. 1999;112:55–64. doi: 10.1016/s0165-3806(98)00157-6. [DOI] [PubMed] [Google Scholar]
- Freedman EG, Stanford TR, Sparks DL. Combined eye-head gaze shifts produced by electrical stimulation of the superior colliculus in rhesus monkeys. J Neurophysiol. 1996;76:927–952. doi: 10.1152/jn.1996.76.2.927. [DOI] [PubMed] [Google Scholar]
- Galli L, Maffei L. Spontaneous impulse activity of rat retinal ganglion cells in prenatal life. Science. 1988;242:90–91. doi: 10.1126/science.3175637. [DOI] [PubMed] [Google Scholar]
- Girman SV, Lund RD. Most superficial sublamina of rat superior colliculus: neuronal response properties and correlates with perceptual figure-ground segregation. J Neurophysiol. 2007;98:161–177. doi: 10.1152/jn.00059.2007. [DOI] [PubMed] [Google Scholar]
- Grubb MS, Thompson ID. Visual response properties in the dorsal lateral geniculate nucleus of mice lacking the β2 subunit of the nicotinic acetylcholine receptor. J Neurosci. 2004;24:8459–8469. doi: 10.1523/JNEUROSCI.1527-04.2004. [DOI] [PMC free article] [PubMed] [Google Scholar]
- Grubb MS, Rossi FM, Changeux JP, Thompson ID. Abnormal functional organization in the dorsal lateral geniculate nucleus of mice lacking the beta 2 subunit of the nicotinic acetylcholine receptor. Neuron. 2003;40:1161–1172. doi: 10.1016/s0896-6273(03)00789-x. [DOI] [PubMed] [Google Scholar]
- Hooks BM, Chen C. Distinct roles for spontaneous and visual activity in remodeling of the retinogeniculate synapse. Neuron. 2006;52:281–291. doi: 10.1016/j.neuron.2006.07.007. [DOI] [PubMed] [Google Scholar]
- Hooks BM, Chen C. Vision triggers an experience-dependent sensitive period at the retinogeniculate synapse. J Neurosci. 2008;28:4807–4817. doi: 10.1523/JNEUROSCI.4667-07.2008. [DOI] [PMC free article] [PubMed] [Google Scholar]
- Huberman AD, Speer CM, Chapman B. Spontaneous retinal activity mediates development of ocular dominance columns and binocular receptive fields in v1. Neuron. 2006;52:247–254. doi: 10.1016/j.neuron.2006.07.028. [DOI] [PMC free article] [PubMed] [Google Scholar]
- Huberman AD, Feller MB, Chapman B. Mechanisms underlying development of visual maps and receptive fields. Annu Rev Neurosci. 2008;31:479–509. doi: 10.1146/annurev.neuro.31.060407.125533. [DOI] [PMC free article] [PubMed] [Google Scholar]
- Kaas JH. Topographic maps are fundamental to sensory processing. Brain Res Bull. 1997;44:107–112. doi: 10.1016/s0361-9230(97)00094-4. [DOI] [PubMed] [Google Scholar]
- Katz LC, Shatz CJ. Synaptic activity and the construction of cortical circuits. Science. 1996;274:1133–1138. doi: 10.1126/science.274.5290.1133. [DOI] [PubMed] [Google Scholar]
- Li Y, Fitzpatrick D, White LE. The development of direction selectivity in ferret visual cortex requires early visual experience. Nat Neurosci. 2006;9:676–681. doi: 10.1038/nn1684. [DOI] [PubMed] [Google Scholar]
- Li Y, Van Hooser SD, Mazurek M, White LE, Fitzpatrick D. Experience with moving visual stimuli drives the early development of cortical direction selectivity. Nature. 2008;456:952–956. doi: 10.1038/nature07417. [DOI] [PMC free article] [PubMed] [Google Scholar]
- Maffei A, Nelson SB, Turrigiano GG. Selective reconfiguration of layer 4 visual cortical circuitry by visual deprivation. Nat Neurosci. 2004;7:1353–1359. doi: 10.1038/nn1351. [DOI] [PubMed] [Google Scholar]
- Maffei A, Nataraj K, Nelson SB, Turrigiano GG. Potentiation of cortical inhibition by visual deprivation. Nature. 2006;443:81–84. doi: 10.1038/nature05079. [DOI] [PubMed] [Google Scholar]
- McLaughlin T, Torborg CL, Feller MB, O'Leary DD. Retinotopic map refinement requires spontaneous retinal waves during a brief critical period of development. Neuron. 2003;40:1147–1160. doi: 10.1016/s0896-6273(03)00790-6. [DOI] [PubMed] [Google Scholar]
- Meister M, Wong RO, Baylor DA, Shatz CJ. Synchronous bursts of action potentials in ganglion cells of the developing mammalian retina. Science. 1991;252:939–943. doi: 10.1126/science.2035024. [DOI] [PubMed] [Google Scholar]
- Mrsic-Flogel TD, Hofer SB, Creutzfeldt C, Cloëz-Tayarani I, Changeux JP, Bonhoeffer T, Hübener M. Altered map of visual space in the superior colliculus of mice lacking early retinal waves. J Neurosci. 2005;25:6921–6928. doi: 10.1523/JNEUROSCI.1555-05.2005. [DOI] [PMC free article] [PubMed] [Google Scholar]
- Niell CM, Stryker MP. Highly selective receptive fields in mouse visual cortex. J Neurosci. 2008;28:7520–7536. doi: 10.1523/JNEUROSCI.0623-08.2008. [DOI] [PMC free article] [PubMed] [Google Scholar]
- Pelli DG. The VideoToolbox software for visual psychophysics: transforming numbers into movies. Spat Vis. 1997;10:437–442. [PubMed] [Google Scholar]
- Picciotto MR, Zoli M, Léna C, Bessis A, Lallemand Y, Le Novère N, Vincent P, Pich EM, Brûlet P, Changeux JP. Abnormal avoidance learning in mice lacking functional high-affinity nicotine receptor in the brain. Nature. 1995;374:65–67. doi: 10.1038/374065a0. [DOI] [PubMed] [Google Scholar]
- Prusky GT, Douglas RM. Characterization of mouse cortical spatial vision. Vision Res. 2004;44:3411–3418. doi: 10.1016/j.visres.2004.09.001. [DOI] [PubMed] [Google Scholar]
- Prusky GT, West PW, Douglas RM. Behavioral assessment of visual acuity in mice and rats. Vision Res. 2000;40:2201–2209. doi: 10.1016/s0042-6989(00)00081-x. [DOI] [PubMed] [Google Scholar]
- Prusky GT, Alam NM, Beekman S, Douglas RM. Rapid quantification of adult and developing mouse spatial vision using a virtual optomotor system. Invest Ophthalmol Vis Sci. 2004;45:4611–4616. doi: 10.1167/iovs.04-0541. [DOI] [PubMed] [Google Scholar]
- Rossi FM, Pizzorusso T, Porciatti V, Marubio LM, Maffei L, Changeux JP. Requirement of the nicotinic acetylcholine receptor beta 2 subunit for the anatomical and functional development of the visual system. Proc Natl Acad Sci U S A. 2001;98:6453–6458. doi: 10.1073/pnas.101120998. [DOI] [PMC free article] [PubMed] [Google Scholar]
- Simpson JI. The accessory optic system. Annu Rev Neurosci. 1984;7:13–41. doi: 10.1146/annurev.ne.07.030184.000305. [DOI] [PubMed] [Google Scholar]
- Sun C, Warland DK, Ballesteros JM, van der List D, Chalupa LM. Retinal waves in mice lacking the beta2 subunit of the nicotinic acetylcholine receptor. Proc Natl Acad Sci U S A. 2008;105:13638–13643. doi: 10.1073/pnas.0807178105. [DOI] [PMC free article] [PubMed] [Google Scholar]
- Weinberg RJ. Are topographic maps fundamental to sensory processing? Brain Res Bull. 1997;44:113–116. doi: 10.1016/s0361-9230(97)00095-6. [DOI] [PubMed] [Google Scholar]
- White LE, Coppola DM, Fitzpatrick D. The contribution of sensory experience to the maturation of orientation selectivity in ferret visual cortex. Nature. 2001;411:1049–1052. doi: 10.1038/35082568. [DOI] [PubMed] [Google Scholar]
- Wong RO, Meister M, Shatz CJ. Transient period of correlated bursting activity during development of the mammalian retina. Neuron. 1993;11:923–938. doi: 10.1016/0896-6273(93)90122-8. [DOI] [PubMed] [Google Scholar]
- Wurtz RH, Albano JE. Visual-motor function of the primate superior colliculus. Annu Rev Neurosci. 1980;3:189–226. doi: 10.1146/annurev.ne.03.030180.001201. [DOI] [PubMed] [Google Scholar]
- Xu W, Orr-Urtreger A, Nigro F, Gelber S, Sutcliffe CB, Armstrong D, Patrick JW, Role LW, Beaudet AL, De Biasi M. Multiorgan autonomic dysfunction in mice lacking the β2 and the β4 subunits of neuronal nicotinic acetylcholine receptors. J Neurosci. 1999;19:9298–9305. doi: 10.1523/JNEUROSCI.19-21-09298.1999. [DOI] [PMC free article] [PubMed] [Google Scholar]