Abstract
Background and purpose
It is important to find a reliable and bedside method, which can estimate the cerebral blood flow (CBF) of patients in clinical settings. Estimation of CBF by calculating a blood flow index (BFI) using continuous wave near-infrared spectroscopy (CW-NIRS) and indocyanine green (ICG) as an iv tracer has been proposed to be a feasible and promising method. To validate if the BFI method can detect relative changes in CBF we compared data with the established method 133Xenon single photon emission computer tomography (133Xe-SPECT).
Methods
Ten healthy subjects were investigated before and after a bolus of acetazolamide. NIRS data were obtained using a multi source detector separation configuration in order to assess a corrected BFI (BFIcorr) value, which attempts to eliminate contamination of skin blood flow.
Results
Data obtained showed no significant correlation between CBF changes measured by 133Xe-SPECT and BFIcorr (0.133, P = 0.732). After acetazolamide, a 49% increase in CBF was detected using the 133Xe-SPECT method, whereas no changes in any ICG variables were observed after acetazolamide.
Conclusion
The study shows that it is not possible to obtain reliable BFI data, which reflect changes in CBF after acetazolamide infusion, using the CW-NIRS and ICG method.
Keywords: acetazolamide, blood flow index, cerebral blood flow, indocyanine green, near-infrared spectroscopy, single photon emission computer tomography
Introduction
Conventional methods for assessing cerebral blood flow (CBF) are single photon emission computer tomography (SPECT), positron emission tomography (PET), transcranial Doppler and magnetic resonance imaging in humans. The limitations of these methods are that they are expensive, that the access is limited and in addition PET and SPECT expose patients to radiation.
Near-infrared spectroscopy (NIRS) is well established as a non-invasive method of detecting changes in brain total haemoglobin concentration and oxygenation. NIRS provides a unique opportunity for continuous and non-invasive bedside recording of brain oxygenation in patients with stroke [1,2] and head injury [3,4]. The method is based on the fact that near-infrared light can penetrate biological tissue and is predominantly absorbed by haemoglobin. The NIRS method has an excellent temporal resolution, whereas the spatial resolution is limited depending on the source detector (SD) distance and number of detectors [5,6].
The use of the optical dye indocyanine green (ICG) as an intravascular tracer to measure relative changes in CBF with NIRS has been suggested as an easy, safe and reliable method for serial bedside measurements of relative CBF changes within a subject [7,8]. The method is based on monitoring the first passage of an injected ICG bolus through the cerebral vasculature by NIRS and is believed to be a specific indicator of cerebral, not extracerebral, circulation [9]. The accuracy of the method was confirmed in a piglet model, in which the NIRS blood flow index (BFI), a relative measure of CBF, significantly correlated with the gold standard microspheres technique [9]. Human studies have shown that repeated measurements of BFI have an acceptable coefficient of variation during baseline recordings [8,10,11]. However, no studies so far have correlated the BFI method to established methods of measuring CBF in humans, such as SPECT or PET.
Furthermore, the vast majority of studies using NIRS measurement of an ICG bolus to estimate CBF were performed using a continuous wave (CW) system and a single SD separation configuration [1,8,10,12]. This method is known to be impaired by strong contamination of the cerebral signal from superficial tissue layers [13]. As an alternative to this commonly used configuration, Kohl-Bareis et al. [14] used a time-domain NIRS system and Steinbrink et al. [15] a frequency-domain NIRS system to track the passage of an ICG bolus in healthy subjects and patients undergoing cardiopulmonary bypass respectively. By measuring the time-of-flight of photons, they were able to get depth-resolved measurements of the bolus time course and therefore to distinguish between extracerebral and intracerebral signals. Furthermore, both studies showed that a conventional single-distance CW analysis would have failed to detect changes in CBF because the contamination by skin blood flow was too high at least in some subjects.
In the present study, we investigate an alternative approach where a simple CW system was used in a multi SD separation configuration. The method uses short SD (1 cm) separation to assess the contribution of skin blood flow, which contaminates the BFI values [13], and subtracts it from the signal obtained at larger SD (3 cm) separation. To test this method, we collected NIRS and Xe-SPECT data during and after an acetazolamide challenge. We correlated the relative changes found with the BFI method to CBF changes measured by 133Xe-SPECT.
Design and methods
We recruited 10 healthy subjects (six females and four males), mean age 24 years (range 18–27 years). Exclusion criteria were: (i) any daily medication apart from oral contraceptives and (ii) somatic or psychiatric disease. This study was approved by the Ethics Committee of the County of Copenhagen (HA-2007-0022). All subjects gave informed consent to participate in the study. This study was followed in accordance with the Helsinki Declaration of 1964, as revised in Edinburgh in 2000.
Experimental protocol
Before the experiment each subject underwent a general physical and neurological examination. The intake of coffee, tea, cocoa or other methylxanthine-containing foods or beverages was not allowed for the preceding 8 h before the start of the study. All procedures were performed in a quiet room at a temperature of 25°C. The subjects were placed in the supine position and a venous catheter was inserted into the right antecubital vein for drug infusion. The NIRS optodes were placed on the head and held in position with velcro bands. All subjects then rested for at least 30 min before baseline measurements. SPECT was measured 30 min (T−30) before, 15 min (T15) and 60 min (T60) after iv bolus of acetazolamide, which is a reversible inhibitor of the enzyme carbonic anhydrase and increases CBF by dilatation of arterioles [16]. An ICG bolus was injected and measured with NIRS every 15 min, starting 30 min before, and until 60 min after, the acetazolamide bolus (measurement times T−30, T−15, T0, T15, T30, T45 and T60). Thus, we obtained three BFI baseline measurements for each subject, and three BFI measurements simultaneously to the SPECT measurements.
Drug
Acetazolamide (Diamox®; Goldshield Pharmaceuticals Ltd., Surrey, UK), 1 g dissolved in 10 ml of sterile water, was given as a bolus over 2 min through the iv catheter.
NIRS and BFI acquisition
The kinetics of the iv bolus of ICG (ICG-pulsion®, Pulsion Medical systems, Munich, Germany) were monitored by CW-NIRS (NIRS2; TechEn Inc, Milford, MA, USA). Dosage of ICG was 0.1 mg/kg dissolved in sterile water (5 mg/ml). The agent was given as bolus through an iv catheter (18 gauge, maximum flow rate 103 ml/min) as quickly as possible. The NIRS optodes were placed bilateral on the forehead with one source (808 nm laser) and two detectors on each side, as lateral to the hairline as possible and taking care to avoid the midline sinus. The two detectors were placed with a distance of 1 and 3 cm lateral from the source. Thus, the detectors were measuring above the frontal cortex in the territory supplied by the middle cerebral artery (MCA). In addition, for two subjects, we used one source and three detectors at distances of 3, 4 and 5 cm, to assess if these SD distances would be more appropriate to detect changes in CBF.
Relative changes of ICG concentration were calculated according to a modified Beer-Lambert law using specific software developed at the Photon Migration Imaging Laboratory, Athinoula Martinos Center for Biomedical Imaging. The raw intensity I(t) for each channel was first low-pass filtered (1 Hz) to remove cardiac oscillations, then converted to changes in optical density ΔOD: ΔOD(t) = −ln[I(t)/I(baseline)]. We assessed the maximum ΔOD (ICGmax), the rise time (defined as time in seconds 10–90% of ICGmax) and time to increase (defined as time in seconds from end of bolus to 10% of ICGmax). BFI for a SD distance of 3 cm was calculated according to Kuebler et al. [9] as: BFI = ICGmax/rise time (indicated in OD/s).
A corrected BFI (BFIcorr, also indicated in OD/s) was calculated by estimating the variations of OD in the brain as the variations in OD at the long SD separations ΔODLong(t) (3 cm) corrected by the measurements at the short separation ΔODShort(t) (1 cm). This procedure is based on the assumption of a two-layer geometry of the head, where the first layer represents the skin and skull, and the second layer the brain. We make the further assumption that the SD pair at 1 cm separation is only sensitive to the superficial layer, whilst the change in intensity on the long SD is because of mixed contribution from both layers:
where Δμa,1 (t) and Δμa,Brain (t) are the changes in absorption in the first layer and the brain respectively, and LShort,1 is the partial pathlength of light in the first layer for the short SD, and LLong,1 and LLong,Brain are the partial pathlengths for the long SD in the first layer and the brain respectively [17]. We then define a corrected ΔOD for the brain by removing the contribution from the skin:
where r = LLong,1/Lshort,1 is a factor accounting for the relative contribution of the superficial layer to the long SD and short SD signals. Whilst r cannot be measured with a CW system, typical values can be found in the literature [18]. The results presented in the study were obtained with r = 1. We also processed the data with r varying between 0.7 and 1.5, to test different magnitudes of contribution from the skin, and did not find any significant changes in the results (data not shown).
SPECT
Single photon emission computer tomography was performed using a brain-dedicated gamma camera (Ceraspect; DSI, Waltham, MA, USA). The system uses a stationary annular NaI crystal and a fast rotating collimator. Inhaled 133Xe gas was used as a flow tracer, calculated in each pixel based on the clearance curve, output was the ki value [19]. To obtain CBF values in absolute terms (ml/min/100 g), a partition coefficient (λ) of 0.85 was used. Calculation of flow in the perfusion territories of each MCA (CBFMCA) and each hemisphere (CBFHEM) was performed by fitting standard vascular regions of interest on five transactional slices (OM-plane) of the brain. Four marks with ink pen were drawn on the skin to ensure accurate positioning of the subjects for each SPECT acquisition.
Vital signs
Heart rate and blood pressure were measured every 15 and 2 min after each ICG bolus, using an auto-inflatable cuff (ProPac Encore®; Welch Allyn Protocol, Beaverton, OR, USA). ECG (Cardiofax V; Nihon-Koden, Shinju-ku, Tokyo, Japan) was monitored on a LCD screen and recorded on paper every 10 min.
Statistics
All values are presented as mean ± SD over all subjects. We defined the time 30 min before acetazolamide infusion (T−30) as baseline and all NIRS and SPECT variables were converted to per cent changes from baseline.
The primary end-points were changes in NIRS variables (BFIcorr, BFI, ICGmax and rise time) and CBFMCA by SPECT after acetazolamide infusion. The variables were analysed for changes over time with univariate analysis of variance (ANOVA) with the fixed factors volunteer and time. Post hoc Dunnett’s test was applied to characterize which time points were statistically significant different from baseline.
The secondary end-point was correlation between SPECT and NIRS variables. The correlation coefficients were calculated at T15 and T60, where NIRS and SPECT variables were detected simultaneously and could be compared to baseline (T−30). For correlation analysis we used Spearman’s rank correlation coefficient test.
Exploratory end-points were differences in BFI and time to increase between SD pair separations of 1 (SD1) and 3 cm (SD3) by paired t-statistics in order to explore differences in ICG time of arrival and flow in the different compartments. Differences between CBFMCA and CBFHEM changes after acetozolamid were analysed by paired t-statistics to explore if CBF increase was different in the MCA territory compared to the whole hemisphere. Coefficients of variation for BFIcorr, BFI, ICGmax and rise time were calculated for the 3 baseline NIRS measurements before acetazolamide infusion to compare with previous studies. Side-to-side differences for both NIRS and SPECT variables were calculated by paired t-statistics, and as no statistical difference was found, a mean between both sides was calculated for each variable for further analysis.
All analysis was performed with SPSS for Windows 15.0 (SPSS Inc., Chicago, IL, USA). Five per cent (P < 0.05) was accepted as the level of statistical significance.
Results
All subjects completed the study. SPECT data on one subject was missing because of a technical problem. In two subjects, ICG infusion was missed at time T−15 and T45 due to lack of preparation time.
Near-infrared spectroscopy and dye-densitometer measurements were recorded after every injection of ICG and all were suitable for analysis. There was no side-to-side difference found in CBFMCA changes or BFI BFIcorr, ICGmax and rise time variables at baseline. Therefore, measurements of the right and left were grouped and calculated as the average of the two.
ICG variables by NIRS and SPECT
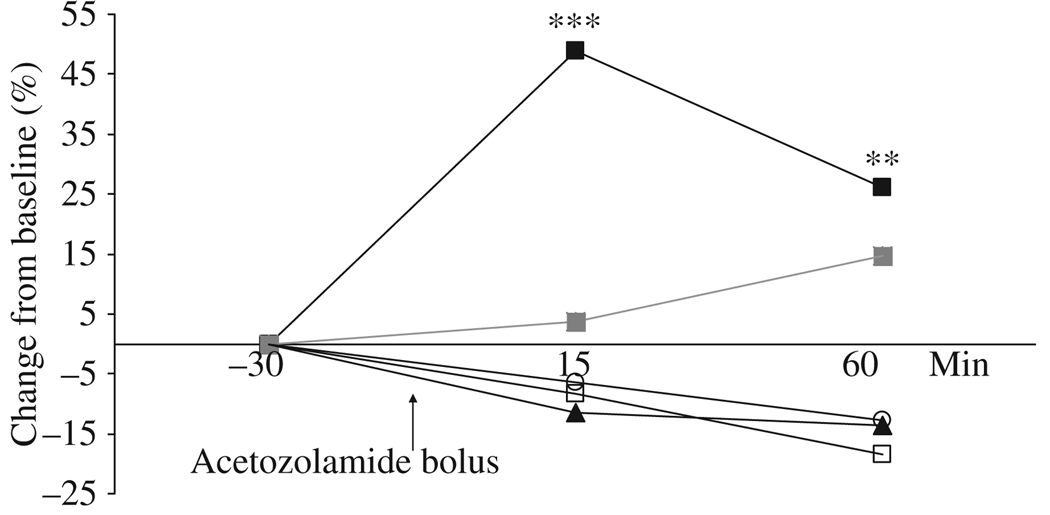
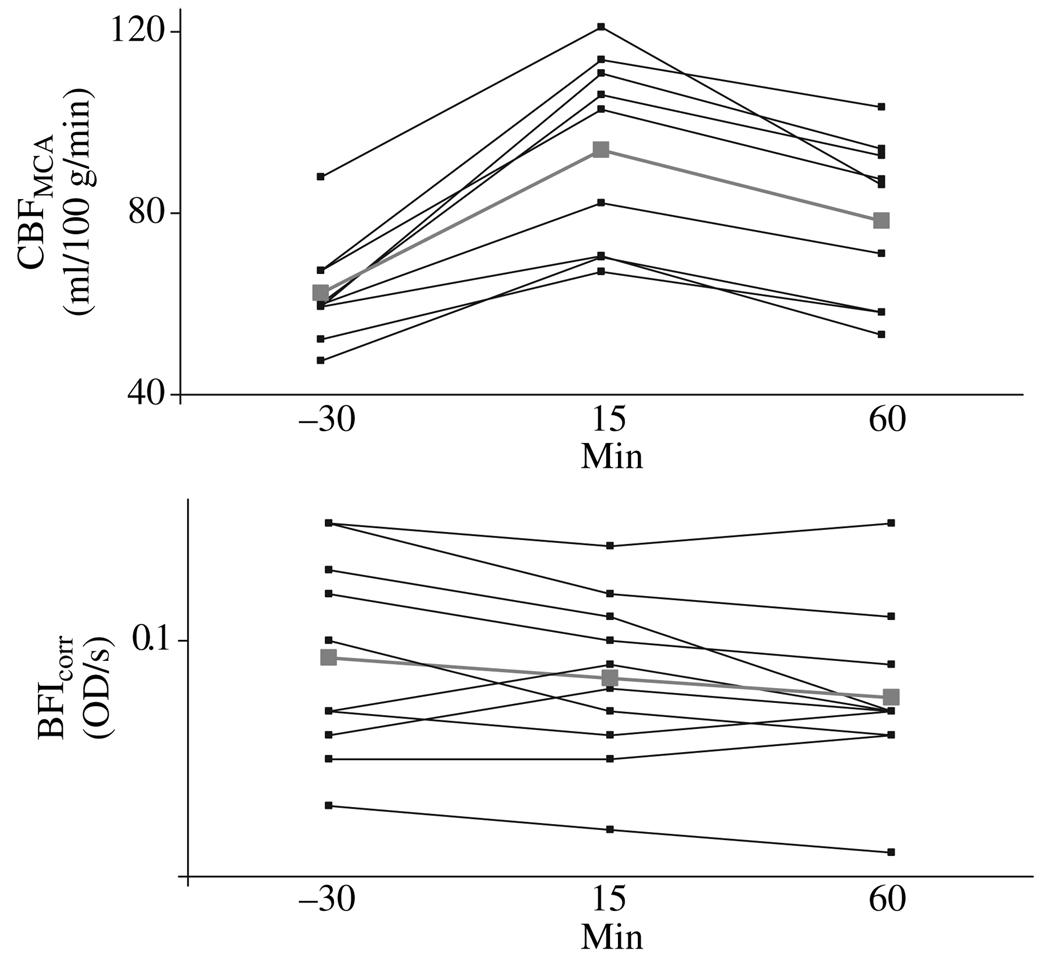
ANOVA showed no changes from baseline after acetazolamide over time measured with BFIcorr (P = 0.319), BFI (P = 0.331), ICGmax (P = 0.064) or rise time (P = 0.450) (Fig. 1). SPECT data showed changes from baseline after acetazolamide over time (P < 0.001). Post hoc analysis showed a 48.9 ± 6.8% increase in CBFMCA after the acetazolamide challenge at T15 (P < 0.001) and 26.0 ± 6.8% increase at T60 (P = 0.003) (Fig 1 and Fig 2).
Figure 1.
Increase in per cent from baseline for CBFMCA (■), BFI (○), BFIcorr (□), ICGmax (▲) and rise time ( ) after infusion of acetazolamide. A significant increase in CBFMCA was found 15 min (48.9 ± 6.6, *** P < 0.001) and 60 min (26.0 ± 6.8, ** P = 0.003) after acetazolamide bolus.
Figure 2.
Changes over time for CBFMCA and BFIcorr (in optical density, OD/s) individual measurements. Thick grey bars shown mean values. ANOVA showed now changes over time for BFIcorr values (P = 0.319). CBFMCA showed changes from baseline after acetazolamide over time (P < 0.001). Post hoc analysis showed a 48.9 ± 6.8% increase in CBFMCA after the acetazolamide challenge at T15 (P < 0.001) and 26.0 ± 6.8% increase at T60 (P = 0.003).
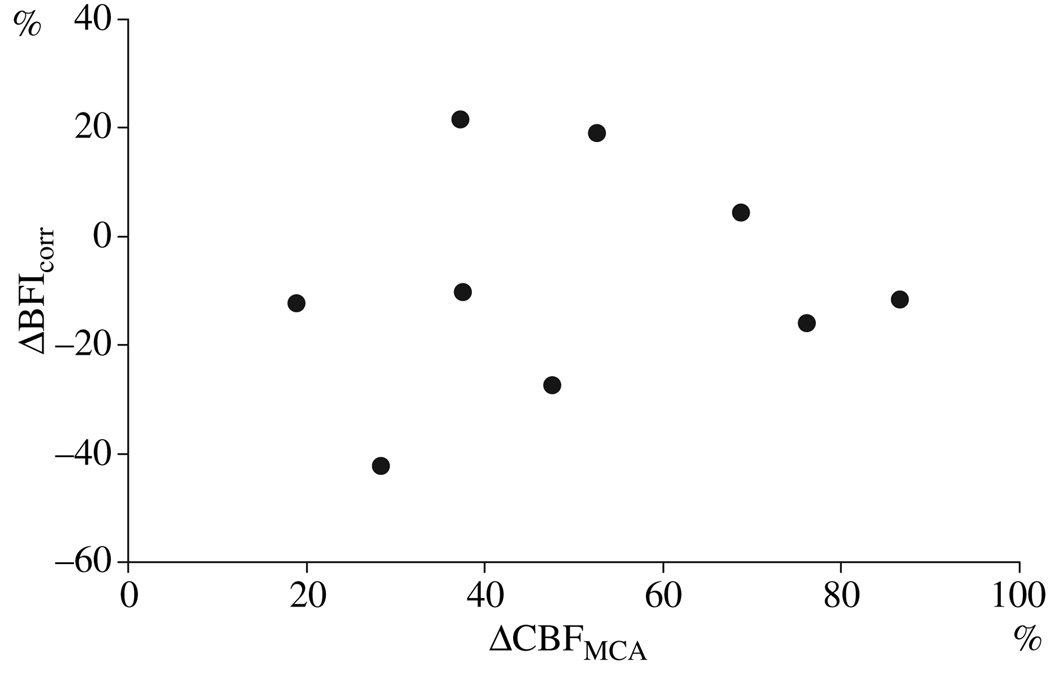
Spearman’s rank correlation coefficient showed no correlation of CBFMCA values with BFIcorr (Fig. 3), BFI or ICGmax (Table 1). However, at T60 a negative correlation between CBFMCA and rise time was found (−0.720, P = 0.029) (Table 1).
Figure 3.
Scatter diagram with changes of BFIcorr and CBFMCA from baseline in per cent 15 min after acetozolamide infusion. Correlation coefficient 0.133 (P = 0.732).
Table 1.
Spearman’s rank correlation coefficient of CBFMCA values with BFI (OD/s), BFIcorr (OD/s), ICGmax (OD) or rise time (s) at T15 and T60
|
T15 |
T60 |
|||
|---|---|---|---|---|
| CBFMCA | P-value | CBFMCA | P-value | |
| BFI | −0.250 | 0.516 | 0.517 | 0.154 |
| BFIcorr | 0.133 | 0.732 | 0.550 | 0.125 |
| ICGmax | 0.283 | 0.460 | 0.150 | 0.700 |
| Rise time | −0.050 | 0.898 | −0.720 | 0.029 |
A negative correlation was found for rise time at T60.
CBF, cerebral blood flow; MCA, middle cerebral artery; BFI, blood flow index; ICG, indocyanine green.
Exploratory end-points
We found larger time to increase and smaller BFI in SD pairs of 1 cm compared to the SD pairs of 3 cm at every time point shown in Table 2. There were no changes at any time in CBF values between CBFMCA and CBFHEM on either side. The mean coefficients of variation for the 3 baseline values of BFIcorr, BFI, ICGmax and rise time are shown in Table 3.
Table 2.
Comparison between different source detector distances
| Time (min) | Time to increase SD1 | Time to increase SD3 | P-value | BFISD1 | BFISD3 | P-value |
|---|---|---|---|---|---|---|
| −30 | 12.7 (±1.64) | 11.7 (±1.67) | <0.01 | 0.0353 (±0.0151) | 0.118 (±0.0398) | <0.01 |
| −15 | 13.9 (±0.995) | 12.9 (±1.22) | <0.01 | 0.0363 (±0.0153) | 0.107 (±0.0234) | <0.01 |
| 0 | 13.3 (±1.37) | 12.4 (±1.25) | <0.01 | 0.0331 (±0.0151) | 0.103 (±0.0236) | <0.01 |
| 15 | 13.2 (±1.23) | 12.0 (±1.78) | <0.01 | 0.0377 (±0.0192) | 0.107 (±0.0320) | <0.01 |
| 30 | 13.5 (±1.06) | 12.2 (±1.19) | <0.01 | 0.0361 (±0.0199) | 0.0971 (±0.0243) | <0.01 |
| 45 | 13.7 (±1.91) | 12.6 (±1.93) | <0.01 | 0.0459 (±0.0307) | 0.123 (±0.0445) | <0.01 |
| 60 | 11.8 (±4.42) | 10.8 (±4.08) | <0.01 | 0.0363 (±0.0135) | 0.0987 (±0.0295) | <0.01 |
Time to increase (s) and BFI (OD/s) in source detector pairs of 1 cm (SD1) compared to the source detector pairs of 3 cm (SD3). Variables are displayed ± SD.
BFI, blood flow index; OD/s, optical density per second.
Table 3.
Mean coefficient of variation for 3 baseline values of BFI (OD/s), BFIcorr (OD/s), ICGmax (OD) and rise time (s)
| Coefficient of variation | |
|---|---|
| BFI | 7.3 (±2.11) |
| BFIcorr | 13.0 (±8.37) |
| ICGmax | 6.1 (±4.08) |
| Rise time | 8.7 (±5.05) |
Variables are displayed ± SD in per cent.
BFI, blood flow index; OD/s, optical density per second; ICG, indocyanine green.
Additional experiments
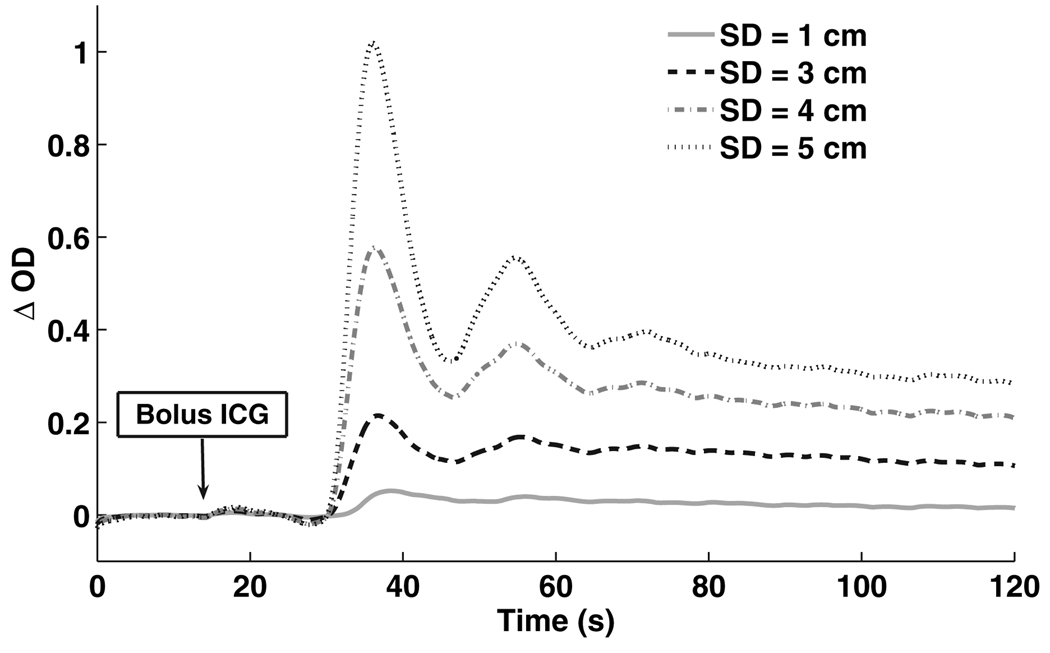
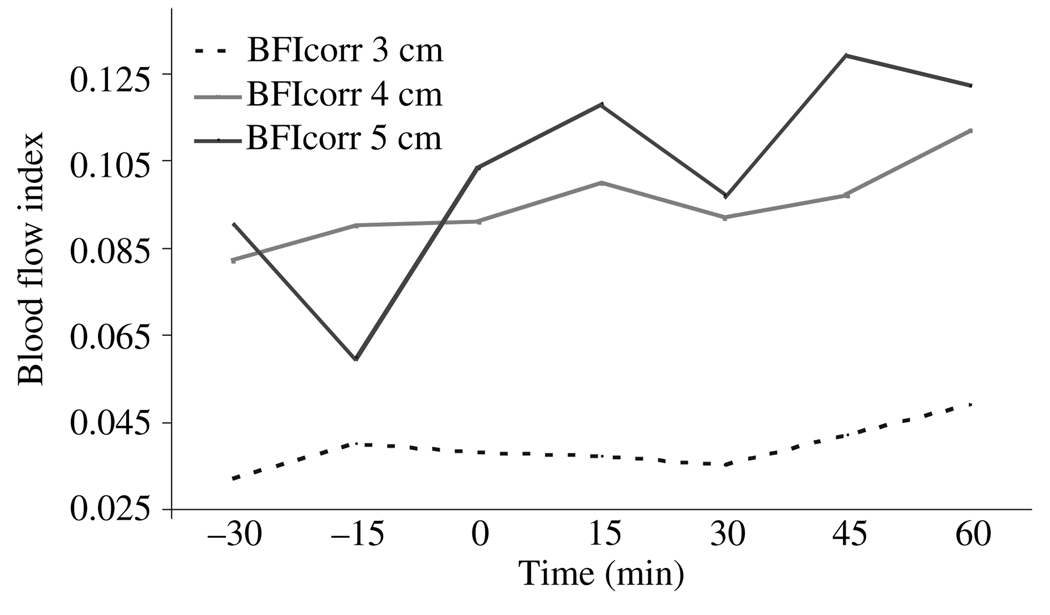
In two subjects, we used one source and three detectors at distances of 3, 4 and 5 cm, to assess if these SD distances would be more appropriate to detect changes in CBF. We found that BFI did increase with distance, and the peak of absorption became narrower and arrived earlier (Fig. 4). However, we did not see any trends in the BFI (or other ICG metrics) for the two subjects after acetazolamide at the longer 4 and 5 cm SD distances (Fig. 5).
Figure 4.
Optical density curve after an ICG bolus. Coloured lines show source detector of different distances. Y axis: ΔOD = delta optical density.
Figure 5.
Example of corrected blood flow index (BFIcorr, in optical density, OD/s) at seven consecutive measurements calculated at source detector distances of 3, 4 and 5 cm. Acetozolamide bolus given at time = 0.
Discussion
The major outcome of this study was that, despite correcting for extracerebral contamination, no changes in any ICG variables were observed after acetazolamide. In contrast the conventional SPECT method detected a 49% increase in CBF 15 min after the bolus was given. We found no correlation of CBFMCA values and ICG variables, except for a negative correlation with rise time at 60 min, which is most likely a type I error. The NIRS results were not caused by technical problems as the quality of NIRS and dye-densitometer measurements recorded after every injection of ICG were high. We found no difference in ICG values between hemispheres within subjects, which suggests that the ICG values are not completely random, though not suitable for detecting changes in CBF over time. Moreover, at longer SD separations, the BFI increased, and the peak of absorption became narrower and arrived earlier. This behaviour is characteristic of the bolus time course in the brain, and is consistent with larger separations being more sensitive to brain, whilst the time course at short distance is more characteristic of ICG perfusion in the skin.
Findings in relation to previous studies
Most studies using ICG dilution techniques have only measured baseline without comparison with a conventional measurement technique and without inducing any changes in blood flow [8,10,11]. These studies found an acceptable intrasubject coefficient of variation at baseline measurements ranging from 10% to 14%, which is comparable to 13% found in our study. The lack of correlation between NIRS recordings and CBF values obtained by SPECT found in this study is supported by Rothoerl et al. [20], who showed lack of correlation between ICG area under the curve and rise time compared with 133Xe-SPECT values found during baseline. Tachtsidis et al. [12] also failed to show any changes in ICG values after acetazolamide infusion using a single SD pair of 5 cm. Our study further explored the correlation between NIRS-ICG with SPECT by inducing a change in CBF as well as pursuing to eliminate extracerebral contamination. However, this study did not show changes in any ICG variables after diamox, which could indicate an increase in CBF.
Methodological aspects of NIRS
Extracerebral skin contamination of the signal contributes to the estimation of BFI [13]. Methodological studies have suggested, that in order to overcome this, it is necessary to estimate BFI with different SD pairs [13] or to use the depth sensitivity provided by time-domain [21] or frequency-domain instruments [15]. Using a multi-distance CW configuration, we did find a difference in time to increase and BFI between SD distance of 1 and 3 cm, which is consistent with predictions from methodological studies. However, even after correction of the 3 cm measurements by the 1 cm data, we did not observe any change for either BFIcorr or BFI after acetazolamide. Similarly, the estimated BFI increased with SD separation for distances of 3, 4 and 5 cm, suggesting larger sensitivity to the brain. However, the relative changes within each subject were all very similar for all SD separations, and no apparent response to the acetazolamide injection was visible at all. The coefficients of variations on baseline measurements found in this study are similar to other studies, suggesting that no experimental systematic errors in our approach of optical bolus tracking are responsible for the lack of changes in the calculated BFI.
Our multi-distance CW approach relies on the assumption that different SD separations have different sensitivities to skin and brain. These relative sensitivities cannot be measured experimentally, and were estimated based on values found in the literature. We also varied the relative contribution from each layer (by varying the parameter r), but did not find any values that yielded the CBF time course expected from the 133Xe-SPECT measurement. One possible explanation for the failure of the ICG method in detecting relative changes in blood flow could be a change in the relative contribution from skin and brain from one injection to the other, for instance through a change in the skin blood volume.
Another pitfall of the NIRS method could be a variable difference in arterial concentration after each venous bolus administration. Terborg et al. [1] showed differences between head side in a study on stroke patients, which indicates that comparison of relative CBF between hemispheres is possible, as long as hemispheres are compared after each ICG bolus, but repeated measurements might not be feasible because of arterial concentration differences. Furthermore, a more central injection of ICG might have shown better results, as the ICG become dispersed from the venous injection site to the measurement site [13]. It is also known that an increase in CBF after acetazolamide is followed by an increase in cerebral blood volume (CBV) [22] caused by arterial dilatation. An increase in CBV and arterial dilatation might dilute the ICG concentration, which will result in a decrease in ICGmax despite the predicted increase caused by an increase in CBF. This tendency can be seen in Fig. 1, though not significant.
Conclusion
Our study showed that with a CW system using a multi SD separation configuration it is not possible to obtain repeated BFI data, which reflect changes in CBF after acetazolamide infusion. We did not find any correlation between the relative changes found with the BFI method compared to CBF changes measured by 133Xe-SPECT.
When inducing changes over time and monitoring with a single SD pair CW-NIRS and ICG dilution fails to measure changes in BFI [12]. However, our study shows that even with multi-distance measurements, the contribution from skin perfusion cannot be eliminated. The use of CW-NIRS and the ICG dilution technique therefore seems inadequate to track changes of CBF over time within a subject.
The use of time-domain [14,23] or frequency-domain [15] instruments NIRS has been shown to enable discrimination between superficial and cerebral responses. However, validation of these methods with respect to standard methods like PET, SPECT and MR in detecting changes in CBF over time within a subject still remains to be achieved to provide confidence in the NIRS technique as a valid tool for CBF measurement.
Acknowledgements
The authors wish to thank laboratory technicians Annette Foldager for her dedicated and excellent assistance. We also want to thank Peter Dalgaard from the Department of Biostatistics, University of Copenhagen for advice with the statistical design of the study. This study was supported by the Lundbeck Foundation via the Lundbeck Foundation Center for Neurovascular Signaling (LUCENS).
References
- 1.Terborg C, Bramer S, Harscher S, Simon M, Witte OW. Bedside assessment of cerebral perfusion reductions in patients with acute ischaemic stroke by near-infrared spectroscopy and indocyanine green. Journal of Neurology, Neurosurgery, and Psychiatry. 2004;75:38–42. [PMC free article] [PubMed] [Google Scholar]
- 2.Damian MS, Schlosser R. Bilateral near infrared spectroscopy in space-occupying middle cerebral artery stroke. Neurocritical Care. 2007;6:165–173. doi: 10.1007/s12028-007-0010-3. [DOI] [PubMed] [Google Scholar]
- 3.Al-Rawi PG. Near infrared spectroscopy in brain injury: today’s perspective. Acta Neurochirurgica. Supplement. 2005;95:453–457. doi: 10.1007/3-211-32318-x_93. [DOI] [PubMed] [Google Scholar]
- 4.Haitsma IK, Maas AI. Monitoring cerebral oxygenation in traumatic brain injury. Progress in Brain Research. 2007;161:207–216. doi: 10.1016/S0079-6123(06)61014-5. [DOI] [PubMed] [Google Scholar]
- 5.Strangman G, Boas DA, Sutton JP. Non-invasive neuroimaging using near-infrared light. Biological Psychiatry. 2002;52:679–693. doi: 10.1016/s0006-3223(02)01550-0. [DOI] [PubMed] [Google Scholar]
- 6.Hoshi Y. Functional near-infrared optical imaging: utility and limitations in human brain mapping. Psychophysiology. 2003;40:511–520. doi: 10.1111/1469-8986.00053. [DOI] [PubMed] [Google Scholar]
- 7.Keller E, Wolf M, Martin M, Yonekawa Y. Estimation of cerebral oxygenation and hemodynamics in cerebral vasospasm using indocyanin green dye dilution and near infrared spectroscopy: a case report. Journal of Neurosurgical Anesthesiology. 2001;13:43–48. doi: 10.1097/00008506-200101000-00008. [DOI] [PubMed] [Google Scholar]
- 8.Wagner BP, Gertsch S, Ammann RA, Pfenninger J. Reproducibility of the blood flow index as noninvasive, bedside estimation of cerebral blood flow. Intensive Care Medicine. 2003;29:196–200. doi: 10.1007/s00134-002-1592-z. [DOI] [PubMed] [Google Scholar]
- 9.Kuebler WM, Sckell A, Habler O, et al. Noninvasive measurement of regional cerebral blood flow by near-infrared spectroscopy and indocyanine green. Journal of Cerebral Blood Flow and Metabolism. 1998;18:445–456. doi: 10.1097/00004647-199804000-00013. [DOI] [PubMed] [Google Scholar]
- 10.Gora F, Shinde S, Elwell CE, et al. Noninvasive measurement of cerebral blood flow in adults using near-infrared spectroscopy and indocyanine green: a pilot study. Journal of Neurosurgical Anesthesiology. 2002;14:218–222. doi: 10.1097/00008506-200207000-00008. [DOI] [PubMed] [Google Scholar]
- 11.Roberts IG, Fallon P, Kirkham FJ, et al. Measurement of cerebral blood flow during cardiopulmonary bypass with near-infrared spectroscopy. The Journal of Thoracic and Cardiovascular Surgery. 1998;115:94–102. doi: 10.1016/s0022-5223(98)70447-7. [DOI] [PubMed] [Google Scholar]
- 12.Tachtsidis I, Leung TS, Tisdall M, Delpy DT, Smith M, Elwell CE. Biomedical Optics 2006 Technical Digest. Washington, DC: Optical Society of America; 2006. Cerebral blood flow assessment with indocyanine green bolus transit detection by near-infrared spectroscopy before and after acetazolamide provocation in humans. ME67. [Google Scholar]
- 13.Leung TS, Tachtsidis I, Tisdall M, Smith M, Delpy DT, Elwell CE. Theoretical investigation of measuring cerebral blood flow in the adult human head using bolus indocyanine green injection and near-infrared spectroscopy. Applied Optics. 2007;46:1604–1614. doi: 10.1364/ao.46.001604. [DOI] [PubMed] [Google Scholar]
- 14.Kohl-Bareis M, Obrig H, Steinbrink J, Malak J, Uludag K, Villringer A. Noninvasive monitoring of cerebral blood flow by a dye bolus method: separation of brain from skin and skull signals. Journal of Biomedical Optics. 2002;7:464–470. doi: 10.1117/1.1482719. [DOI] [PubMed] [Google Scholar]
- 15.Steinbrink J, Fischer T, Kuppe H, et al. Relevance of depth resolution for cerebral blood flow monitoring by near-infrared spectroscopic bolus tracking during cardiopulmonary bypass. The Journal of Thoracic and Cardiovascular Surgery. 2006;132:1172–1178. doi: 10.1016/j.jtcvs.2006.05.065. [DOI] [PubMed] [Google Scholar]
- 16.Settakis G, Molnar C, Kerenyi L, et al. Acetazolamide as a vasodilatory stimulus in cerebrovascular diseases and in conditions affecting the cerebral vasculature. European Journal of Neurology. 2003;10:609–620. doi: 10.1046/j.1468-1331.2003.00675.x. [DOI] [PubMed] [Google Scholar]
- 17.Hiraoka M, Firbank M, Essenpreis M, et al. A Monte Carlo investigation of optical pathlength in inhomogeneous tissue and its application to near-infrared spectroscopy. Physics in Medicine and Biology. 1993;38:1859–1876. doi: 10.1088/0031-9155/38/12/011. [DOI] [PubMed] [Google Scholar]
- 18.Okada E, Firbank M, Schweiger M, Arridge SR, Cope M, Delpy DT. Theoretical and experimental investigation of near-infrared light propagation in a model of the adult head. Applied Optics. 1997;36:21–31. doi: 10.1364/ao.36.000021. [DOI] [PubMed] [Google Scholar]
- 19.Celsis P, Goldman T, Henriksen L, Lassen NA. A method for calculating regional cerebral blood flow from emission computed tomography of inert gas concentrations. Journal of Computer Assisted Tomography. 1981;5:641–645. doi: 10.1097/00004728-198110000-00006. [DOI] [PubMed] [Google Scholar]
- 20.Rothoerl RD, Schebesch KM, Faltermeier R, Woertgen C, Brawanski A. Lack of correlation between Xenon133 and near infrared spectroscopy/indocyanine green rCBF measurements. Neurological Research. 2003;25:528–532. doi: 10.1179/016164103101201779. [DOI] [PubMed] [Google Scholar]
- 21.Kohl-Bareis M, Obrig H, Steinbrink J, Malak J, Uludag K, Villringer A. Noninvasive monitoring of cerebral blood flow by a dye bolus method: separation of brain from skin and skull signals. Journal of Biomedical Optics. 2002;7:464–470. doi: 10.1117/1.1482719. [DOI] [PubMed] [Google Scholar]
- 22.Okazawa H, Yamauchi H, Sugimoto K, Toyoda H, Kishibe Y, Takahashi M. Effects of acetazolamide on cerebral blood flow, blood volume, and oxygen metabolism: a positron emission tomography study with healthy volunteers. Journal of Cerebral Blood Flow and Metabolism. 2001;21:1472–1479. doi: 10.1097/00004647-200112000-00012. [DOI] [PubMed] [Google Scholar]
- 23.Liebert A, Wabnitz H, Steinbrink J, et al. Time-resolved multidistance near-infrared spectroscopy of the adult head: intracerebral and extracerebral absorption changes from moments of distribution of times of flight of photons. Applied Optics. 2004;43:3037–3047. doi: 10.1364/ao.43.003037. [DOI] [PubMed] [Google Scholar]


