Abstract
An apparatus is described for the measurement of unsteady thrust and propulsive efficiency produced by biologically inspired oscillating hydrodynamic propulsors. Force measurement is achieved using a strain-gauge-based force transducer, augmented with a lever to amplify or attenuate the applied force and control the measurement sensitivity and natural frequency of vibration. The lever can be used to tune the system to a specific application and it is shown that, using the lever, the stiffness can be made to increase more rapidly than the measurement sensitivity decreases. Efficiency is computed from measurements of the time-averaged power imparted to the fluid. The apparatus is applied to two different propulsors, demonstrating the versatility of the system; wake visualizations are examined, which provide insight into the physical mechanisms of efficient propulsion.
1 Introduction
Recent interest in the hydrodynamics and performance of biologically inspired unsteady propulsors has created a need to make accurate measurements of unsteady forces and propulsive efficiencies. While there have been numerous methods proposed for the computation of the instantaneous or time-averaged forces on bodies moving with respect to a fluid (for example, Noca et al. 1997; Anderson et al. 1998; Peng et al. 2007), we describe a system to measure the applied force directly by means of a force transducer. Such an approach is advantageous in that detailed knowledge of the flowfield is not required and that necessary assumptions are minimal; however, it requires that the propulsor be tethered. In this investigation, we therefore consider propulsors fixed in a steady free stream and measure performance characteristics as if propelling a body of large inertia such that the unsteady forcing would produce negligible fluctuation in forward speed.
Previous investigations have used piezoelectric force and torque sensors to investigate the thrust performance of two-dimensional heaving and pitching airfoils (Triantafyllou et al. 1991; Anderson et al. 1998). These devices have extremely high stiffness so that the resonant frequencies are typically well beyond the relevant measurement frequencies. However, since they are charge-based devices, measuring small forces (of the order of mN) means small transducers with a limited capacitance, and so the output decays rapidly in time, making it difficult to measure relatively slowly varying forces accurately. An alternative is the use of strain-gauge-based load cells for dynamic force measurement (i.e. Dickinson et al. 1999, Ringuette et al. 2007). The primary difficulty in using these devices is the comparatively low stiffness for a transducer of a given accuracy, which can have the undesirable effect of making the sensitivity of the measurement device dependent on the forcing frequency.
Here, we present the design of a sensitive single-degree-of-freedom force balance that employs a commercial strain gauge force transducer. The properties of the transducer are improved and tuned to particular applications through the use of a lever to amplify or attenuate the applied force as necessary. As a result, the instrument can be optimized for use with a broad range of unsteady propulsors, and adjusted to improve accuracy in measuring instantaneous or time-averaged forces. The design and analysis of the system are presented in Sect. 2, and procedures for accurate measurement of thrust and efficiency are discussed. In Sect. 3, we provide two examples of its use. The first is a parametrically simple experiment on a rigid, low-aspect-ratio panel pitching about its leading edge (Buchholz and Smits 2008). In order to achieve sufficient sensitivity, the stiffness of the system must be reduced such that the resonant frequency of the system is comparable to the forcing frequency of the propulsor, and only time-averaged measurements are presented here. The second experiment is a propulsor consisting of an articulated fin approximating a batoid pectoral fin (Clark and Smits 2006). In this case, much larger forces are produced which permits sufficient stiffness in the force balance to measure time-resolved unsteady forces. Finally in Sect. 4, dye visualizations of the wake are presented, which elucidate some of the mechanisms of efficient thrust production.
2 Design and operation
The force balance was built around a water channel with a test section of width 0.46 m, depth 0.29 m, and length 2 m. Propulsion systems used with this apparatus consist of an actuator that penetrates the water surface from above and a mechanism that drives it in an oscillatory manner, powered by a DC servomotor.
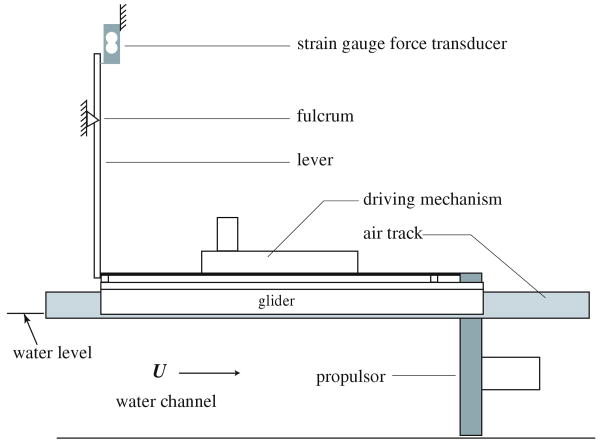
Figure 1 illustrates the mechanical components of the force balance. The propulsor and driving mechanism are supported by an air bearing sled (Daedalon Corporation) consisting of a pair of air tracks straddling the water channel and a pair of 0.91 m long gliders, allowing translational motion in the streamwise direction with minimal friction. A central building compressed air supply provided sufficient flow rate to adequately support the propulsors and mechanisms used with this instrument. Time-resolved and time-averaged streamwise thrust measurements were obtained using an Omega LCAE-600G strain-gauge-based force sensor, which was chosen for its relatively high stiffness for the required sensitivity, compared to other strain-gauge-based force sensors. The sensor had a 600 g capacity with nominally 0.02% nonlinearity and full-scale output of 1 mV/V. Excitation was ±5 VDC. The output signal was amplified using an Analog Devices AD623 instrumentation amplifier. The lever consisted of a slotted aluminum extrusion (80/20 Corporation part number 1050) to facilitate adjustment of the fulcrum position. The lever was not fixed to the car nor the load cell and thus only an applied force in the upstream direction can be measured. The instantaneous streamwise component of the thrust can be both positive and negative, therefore it is necessary to apply a positive load bias. This was accomplished by inclining the air bearing sled at a slight angle (<0.5°) such that gravity would cause the car to slide upstream and impinge on the lever.
Fig. 1.
Thrust measurement system. The air bearing sled, formed by the chassis and gliders riding on two parallel air tracks, impinges on a lever to amplify the thrust produced by the panel
The capacity of this apparatus to measure thrust is quite insensitive to the mechanical aspects of the propulsor; however, the specific techniques employed here to determine propulsive efficiency have been developed for use with a DC motor to drive the propulsion. For this work, a Pittman 30 VDC brushed servomotor with a 512 count/revolution quadrature encoder was used, powered by an Advanced Motion Controls BE12A6E amplifier. The motor has an integral gearbox with a 5.9:1 speed reduction.
Experimental control and data acquisition were performed by a Labview program running on a desktop computer equipped with a National Instruments PCI-MIO-16E-4 data acquisition (DAQ) card. A solenoid valve, activated by the computer, controlled air flow into the air tracks. The valve was opened in 22-s intervals, beginning with a 7 s delay (to allow initial oscillations to decay), followed by 15 s of data acquisition. The solenoid valve was subsequently closed and the compressor restored pressure to the system. For consistent and optimal performance, the valve was triggered to open at the peak of the compressor cycle, which was detected with a pressure switch mounted upstream of the solenoid valve. One cycle of data acquisition and pressure restoration (one measurement) required approximately 90 s (the compressor required approximately 68 s to restore the pressure) and was made to run continuously with each new cycle triggered by the pressure switch.
2.1 Control of sensitivity and resonant frequency
In a typical application of the apparatus, the relatively low stiffness of the strain gauge sensor (O(105) N/m) combined with the significant mass of the driving mechanism (≈ 8 kg) can yield resonant frequencies that are similar to the driving frequency of the propulsor. This clearly makes time-resolved measurements difficult; however, even time-averaged measurements can be challenging because of the large-amplitude oscillations generated when driving the propulsor near the resonant frequency of the system. In addition, the broad range of applications of the force balance motivates the capability to handle a wide range of loads. Modification of the force applied to the load cell using a lever with an adjustable fulcrum addresses both the frequency response, and the dynamic range.
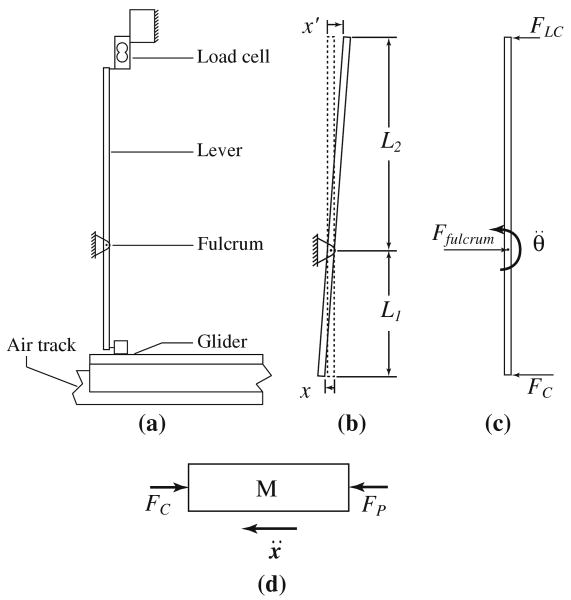
In the first part of this analysis, we derive some static properties of the lever-augmented force balance. Figure 2 gives a schematic diagram of the lever, load cell, and sled, showing applied forces and resulting displacements. FC is the contact force applied to the bottom of the lever. The lever ratio is R = L1/L2 such that the force applied to the load cell is FLC = FCR. In this analysis, we require that the load cell stiffness k is constant over the measurement range. Therefore, the displacement of the force transducer due to an applied load x′ is given by:
Fig. 2.
Schematic diagram of the lever, load cell, and air-bearing sled showing a components, b relevant dimensions (the dashed line shows the undeflected position of the lever), c free-body diagram of the lever showing applied horizontal forces, and d free-body diagram of the sled showing applied horizontal forces
| (1) |
and the resulting increment in displacement at the bottom of the lever is given by:
| (2) |
The modified stiffness keff of the lever and load cell system therefore varies as R−2:
| (3) |
We can define a mechanical sensitivity of the system Sm based on the change in deflection of the force transducer resulting from the increment in the force applied by the propulsor:
| (4) |
We have the perhaps unexpected but fortunate result that, while the stiffness of the system varies inversely with the square of the lever ratio (Eq. 3), the sensitivity is directly proportional to the lever ratio (Eq. 4). By reducing R, therefore, we can increase the stiffness of the system keff more rapidly than we decrease sensitivity. In general, we hope to find R < 1 such that sufficiently high sensitivity and stiffness are achieved at the same time.
The stiffness is important in that it governs the resonant frequency of the vibrating system formed by the load cell, lever, and unsteady propulsor. Neglecting any damping in the system, Fig. 2c and d give the instantaneous horizontal forces applied to the lever and sled, respectively, along with the relevant accelerations. Summing the moments about the lever fulcrum and the horizontal forces on the sled yields:
| (5) |
| (6) |
where IF is the moment of inertia of the lever about the fulcrum axis and M is the mass of the sled. The angular acceleration of the lever is expressed in terms of the sled displacement using the kinematic relation for small displacements:
| (7) |
Equations 5–7 give:
| (8) |
Taking into account Eqs. 1–3 yields the second-order differential equation for the forced harmonic oscillator:
| (9) |
where FP(t) = F0cos(ωit + φi), i = 0, 1, 2, …. For one component ω = ωi, the solution to (9) is:
| (10) |
The natural frequency of the system ω0 is given by:
| (11) |
and f0 = ω0/2π.
Substitution of (3) shows that the resonant frequency is inversely proportional to the lever ratio R:
| (12) |
Accurate dynamic force measurement requires optimal selection of both sensitivity and stiffness because the dynamic response of the system is a source of error for unsteady measurements in addition to the static measurement uncertainty of the load cell. Any real system will have a finite amount of dissipation which will damp out the vibrations given by the first two terms on the right side of Eq. 10, leaving only the forced term:
| (13) |
To accurately measure the instantaneous thrust produced by the propulsor, we are interested in acheiving a lever displacement x that is, at all times, proportional to the force:
| (14) |
To constrain the error due to dynamic effects to within P % of the correct value, we require that:
| (15) |
so that we require:
| (16) |
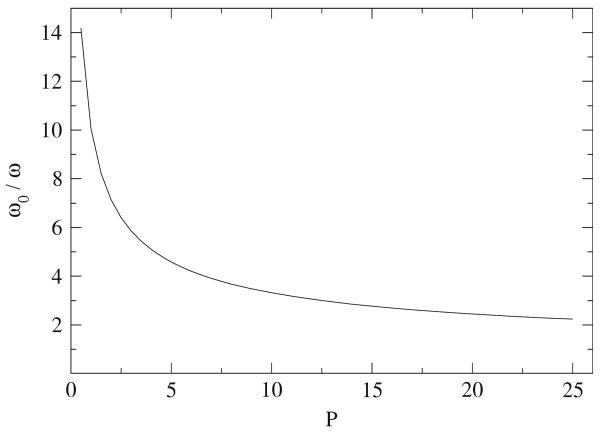
This relationship is plotted in Fig. 3. The mass of the propulsion system should first be minimized since the natural frequency varies as M−1/2. Then, for accurate time-resolved measurements, a lever ratio R < 1 will stiffen the system to improve the dynamic accuracy according to (16). However, since this will reduce the sensitivity, the forces measured by the transducer will be smaller, and therefore the relative (static) accuracy will be diminished. For a time-resolved measurement, the optimum lever ratio will produce equal static and dynamic measurement uncertainties.
Fig. 3.
The required ratio of resonant frequency to measured frequency in order to provide an accuracy within P %, as given by 16
2.2 Thrust and efficiency measurement
The thrust coefficient is defined:
| (17) |
where T may be time-averaged or instantaneous thrust, ρ is the density of the water, U is the freestream velocity in the water channel, and s is the planform area of the propulsor.
The Froude efficiency is the ratio of thrust power output to the total power input by the propulsor:
| (18) |
where, in this case, T is the time-averaged thrust generated by the panel and Pinp is the time-averaged power imparted to the fluid, given by:
| (19) |
Here, Pw and Pa are the power consumed by the motor when driving the panel in water and air, respectively, and ηw and ηa are the motor efficiencies at the respective motor operating conditions. The first term in (19) is the total mechanical power produced by the motor and the second term is the power dissipated in the mechanism due to friction. In our experiments, Pa measurements were made three to five times before and after acquisition of propulsive force and power measurements.
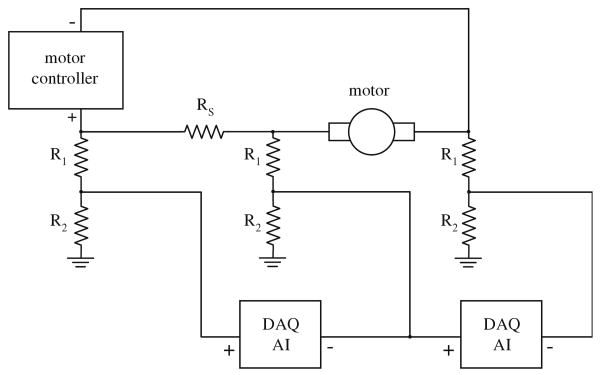
Motor power is obtained by measuring the voltages across the motor and a 2.00 Ω power resistor Rs in series with the motor:
| (20) |
where Pm is the electrical power drawn by the motor, and VR and Vm are the voltages measured across the series resistor and motor, respectively. Figure 4 shows the circuit used to measure these voltages across differential analog input channels on the DAQ card. Resistors R1 and R2 form voltage dividers which modify the voltage levels by a factor of R2/(R1 + R2) = 0.31 to prevent damage to the DAQ card. The voltage signals were sampled at 2,000 Hz.
Fig. 4.
Schematic of circuitry for motor power measurements
Motor efficiency curves were determined by measuring motor power while lifting calibrated weights with a pulley and string. The motor efficiency is given by:
| (21) |
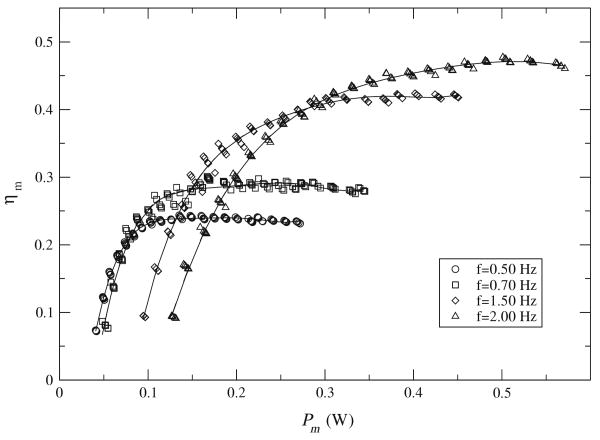
where ωm is the angular velocity of the motor output shaft, r is the radius of the pulley, m is the mass of the weight, and g is the acceleration of gravity. Efficiency curves are shown in Fig. 5 for the four motor speeds used in the investigation described in Sect. 3.1. Motor efficiencies are assigned to the thrust performance data by matching motor speed and motor voltage to the efficiency calibration data shown in Fig. 5.
Fig. 5.
Motor efficiencies as a function of motor input power for motor output shaft frequencies of 0.50, 0.70, 1.50, and 2.00 Hz (the frequencies at which the pitching panel described in Sect. 3.1 was actuated). The lines are fifth order polynomials fit to the data in order to assign motor efficiency values to the thrust performance data
3 Applications
The measurement system was used to investigate the thrust performance of two unsteady hydrodynamic propulsors. The first, a rigid, rectangular, flat panel pitching about its leading edge, is a parametrically simple propulsor designed to elucidate some of the basic mechanisms of unsteady hydrodynamic thrust production of low-aspect-ratio propulsors. The second, an articulated, flexible fin constructed to replicate some of the features of the pectoral fins of a batoid fish (such as a ray or skate), represents a more practical propulsor with more favorable performance characteristics.
The Strouhal number, St = fA/U, is the primary parameter governing thrust production of nominally two-dimensional unsteady propulsors (Triantafyllou et al. 1991), where f is the frequency of oscillation, A is a measure of the wake width, and U is the freestream speed, or translational speed of a vehicle or aquatic animal in still water. In the present work, we use the frequently used approximation that A is the peak-to-peak amplitude of the trailing edge of the propulsor (for the articulated fin, it is the average value over the trailing edge).
It is demonstrated here that, despite these two cases being highly disparate in terms of their form, performance, and scale, the measurement system described in this paper is an effective platform for both applications.
3.1 Low-aspect-ratio pitching panel
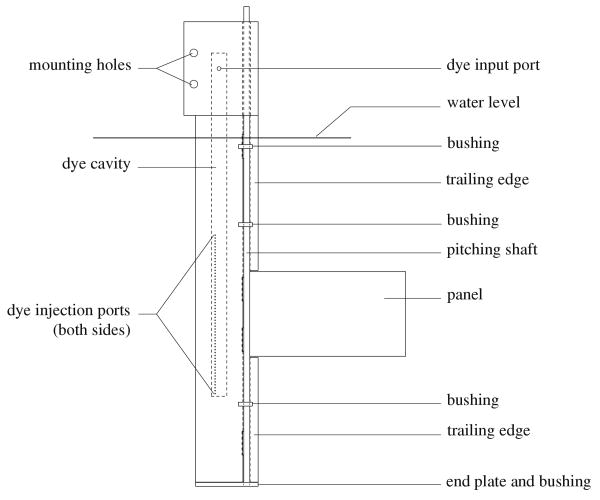
The panel was supported by a stationary, symmetric airfoil fairing based on a NACA 0012-64 airfoil, as shown in Fig. 6. The fairing, with chord length c = 50.8 mm was truncated at its trailing edge to allow the insertion of a 4.76 mm diameter stainless steel shaft, the pitching shaft, to which the leading edge of the oscillating panel was mounted. Tapered trailing edge segments were mounted above and below the panel. A four bar linkage mechanism was used to create a periodic rotation of the pitching shaft as described in Buchholz and Smits (2006). In order to visualize the wake, an array of dye injection ports on each side of the fairing was used to introduce rhodamine B and fluorescein dyes from separate cavities within the fairing.
Fig. 6.
The fairing and panel assembly
Four different panels were investigated with aspect ratios AR = S/C (S = span, C = chord = 120 mm) between 0.54 and 2.38 as described in Buchholz and Smits (2008). Each panel had a thickness of 2.5 mm and chord length C of 120 mm. Because this propulsor was optimized for simplicity and not thrust performance, the thrust coefficient and propulsive efficiency were low: time-averaged thrust was typically O(0.01) N, and the efficiency was O(0.1). To obtain adequate sensitivity, a lever ratio of R = 8 was used, which resulted in a resonant frequency of approximately 1.1 Hz. To capture the desired range of experimental parameters, pitching frequencies of f = 0.50, 0.70, 1.50, and 2.00 Hz were used. The applied force (Fappl in Fig. 2c) had a primary frequency of f, the dominant vibration frequency of the mechanism was f, and the dominant frequency of unsteady thrust production was 2f (the panel generates thrust while sweeping in both directions). Because of the proximity of the forcing frequencies to the resonant frequency of the system, only time-averaged measurements could be obtained. To minimize oscillations due to the dynamic response of the system, a dashpot was constructed, consisting of a stationary open container filled with SAE 85W-140 oil and a paddle mounted to the chassis.
Thrust and motor power measurements of a single panel aspect ratio and pitching amplitude were obtained for the entire range of Strouhal numbers of interest. Before and after acquisition of a data set, the load cell was statically calibrated throughout the measurement range in air using a series of weights hung on a string. A pulley was used to transfer tension in the string into a horizontal force on the chassis. Baseline power measurements (to determine Pa in Eq. 19) were also taken in sets of three to five measurements of 15 s duration.
The water channel was then filled, and thrust and power measurements were acquired at each Strouhal number in sets of six measurements, n = 0, 1, 2,…,5. The force sensor exhibited considerable drift in no-load output voltage over time. Therefore, the zero was re-calibrated after each thrust measurement by arresting the pitching motion and aligning the panel parallel to the free stream and acquiring a baseline force measurement. The baseline force measurement is therefore the net drag on the fairing and stationary panel. For n = 0, 2, 4, the panel is pitching, and thrust and power measurements were acquired. For n = 1, 3, 5, the baseline force measurements were acquired.
The uncertainty in the thrust and power measurement is dominated by scatter within the sets of three measurements for each condition, as well as within the baseline measurements. For each set of three measurements (n = 0, 2, 4 or 1, 3, 5), the uncertainty is given by the standard error of the mean:
| (22) |
and σ is the sample standard deviation of the measurement. The baseline measurements are subracted from the data set measurements to obtain the net thrust due to pitching, and the net power transmitted to the fluid. Uncertainties in the baseline and data set measurements are added in quadrature to obtain the overall uncertainty in thrust and power. For this application, thrust measurements have an uncertainty of approximately 20%, and power measurements have an uncertainty of approximately 5%.
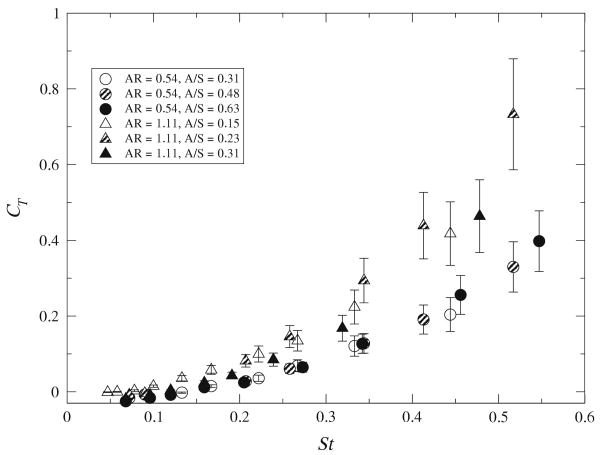
Figure 7 shows the variation in thrust coefficient with Strouhal number and the ratio A/S for panel aspect ratios of 0.54 and 1.11. As discussed in Buchholz and Smits (2008), the thrust coefficient increases monotonically with Strouhal number and with aspect ratio, but it is relatively insensitive to variations in A/S. The force transducer has an uncertainty of approximately 10−3 N which, with a lever ratio of 8, produces an uncertainty of approximately 10−4 N. However, the actual measured uncertainties are O(10−3) N. The unaccounted variation is likely attributed to the streamwise vibration of the propulsor. Due to the low stiffness of the measurement system, the sled would oscillate with peak-to-peak amplitudes up to 1 mm, which could cause a variation in the relative phase between the vibration and the panel pitching motion. Longer sampling times or a larger number of samples would improve the performance in this respect, but this was not possible in these experiments because of the limitations on the air supply available to us.
Fig. 7.
Thrust coefficient for panels with aspect ratios 0.54 and 1.11 as a function of Strouhal number and amplitude to span ratio. These data also appear in Buchholz and Smits (2008)
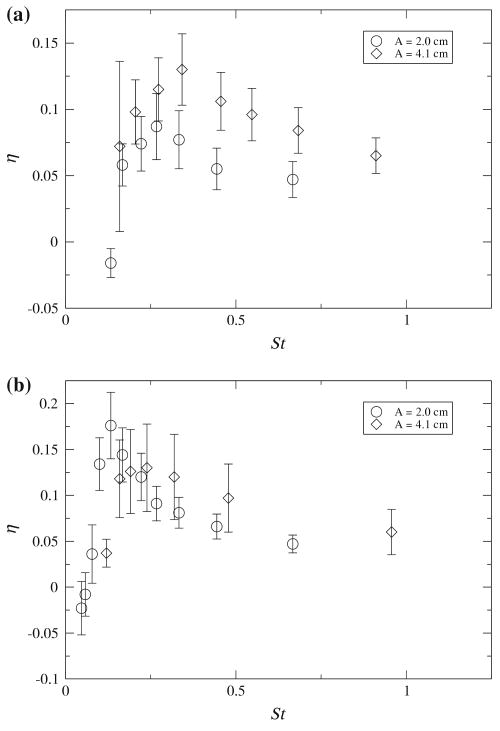
Figure 8 displays propulsive efficiencies for some of the cases illustrated in Fig. 7. In general, the efficiency curves rise sharply with increasing Strouhal number and reach a peak between 9 and 21% within 0.13 ≤ St ≤ 0.34 (for all combinations of aspect ratio and pitching amplitude), and then gradually decrease. These trends are typical of unsteady propulsors (i.e. Anderson et al. 1998; Dong et al. 2005), and the low efficiency levels are not unexpected for such simple propulsors.
Fig. 8.
Froude efficiency plots for panels of aspect ratio a 0.54 and b 1.11 as a function of Strouhal number and amplitude. Data for selected pitching amplitudes are shown
3.2 Articulated batoid fin
The fin has a semi-elliptical planform shape with a root chord of 0.24 m, a span of 0.22 m, with a NACA 0020 cross-section, a shape that replicates some features of the cross-section of a manta ray pectoral fin (Clark and Smits 2006). It was cast of flexible PVC (MF Manufacturing Company stock no. 2223) and was articulated by four rigid spars that penetrate the root of the fin, extending along the span of the fin as shown in Fig. 9. A spanwise array of dye ports was cast into each side of the fin at approximately the mid-chord point, in order to visualize the wake. A gear train drives four push rods which pivot the spars laterally to produce a streamwise traveling wave with a tip amplitude of 50 mm peak-to-peak. The phase shift φ, defined as the difference between the first and last actuating spar, is adjustable by changing the relative angular positions of the gears to provide a range of wavelengths in the fin. Thrust measurements were made at a constant flow velocity of 0.11 m/s, corresponding to a Reynolds number of 11,400 based on mean chord, while the Strouhal number was varied by modulating the frequency of the DC motor to produce flapping frequencies between 0 and 3 Hz. Further details of the experiment and results can be found in Clark and Smits (2006).
Fig. 9.
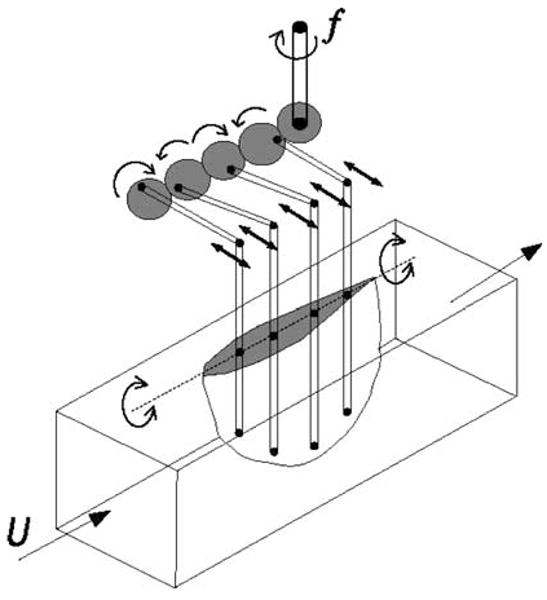
Mechanical model of the batoid fin
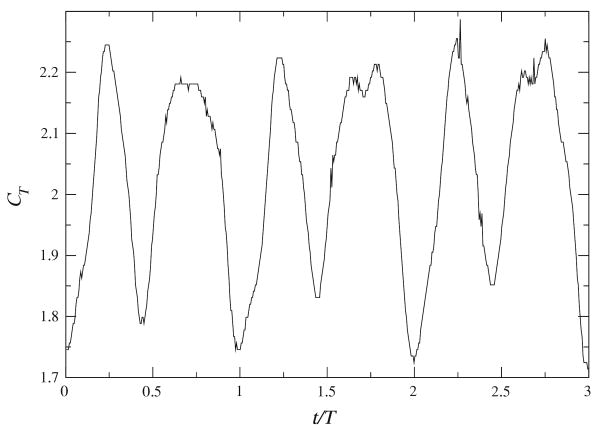
The articulated fin produced time-averaged thrust between 0.13 and 0.88 N, one to two orders of magnitude greater than that produced by the pitching panel. A lever ratio of 0.167 was used, producing a resonant frequency of 62 Hz,1 for which Eq. 16 predicts a maximum uncertainty of approximately 1% at a forcing frequency of 6 Hz due to unsteadiness, and thus it is feasible to obtain time-resolved thrust measurements. The static uncertainty of the load cell is between 1 and 5 % of the force attenuated by the lever, providing a reasonable match between the static and dynamic uncertainties as discussed in Sect. 2.1. As Fig. 10 indicates, the primary frequency in the thrust signal was double the flapping frequency, since the fin produces thrust on the up- and downstrokes of its motion (as did the pitching panel). The large-scale cycle-to-cycle variations in the waveform are due to asymmetry in the motion of the fin, water surface waves generated by the motion of the fin, and local irregularities in the cycle of the driving mechanism.
Fig. 10.
Time-resolved thrust coefficient produced by the articulated fin for three oscillation periods at St = 0.4, φ = 120°. The primary frequency in the thrust signal is twice that of the frequency of oscillation of the fin. There is a slight asymmetry between the upstroke and the downstroke as well as small cycle-to-cycle variations
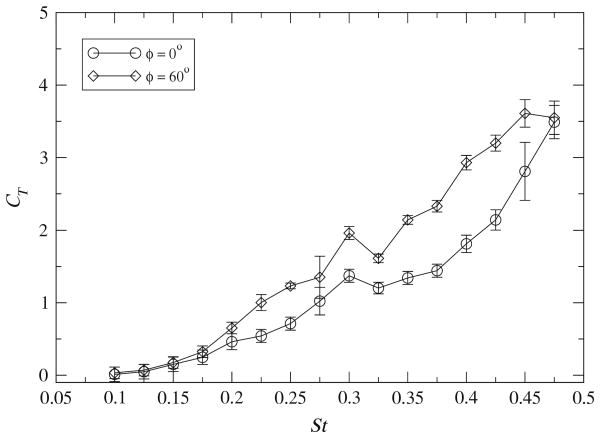
The calibration procedures used here were similar to those used in the pitching panel experiments. After filling the water channel, thrust measurements were acquired at each Strouhal number in sets of four. The time-averaged thrust data are shown in Fig. 11 for representative values of φ = 0 and 60°. The standard error of the mean (Eq. 22) in thrust measurements across all phase shifts and Strouhal numbers was less than 10%, which is in reasonable agreement with the estimated uncertainties given above. For Strouhal numbers less than 0.1, CT varied between −0.05 and 0.05. At these low Strouhal numbers, the accuracy of the measurement system was insufficient to resolve the effects of phase change. Although a single lever ratio was used for the entire Strouhal number range, it would be possible at lower Strouhal numbers to adjust the lever ratio to increase system sensitivity without compromising overall accuracy due to dynamic effects. As the Strouhal number increases the thrust coefficient increases, which is in accord with previous investigations. Strouhal numbers higher than 0.475 at the current Reynolds number could not be explored with the present configuration due to the limited power of the DC motor. For Strouhal numbers between 0.30 and 0.35, a plateau appears in the thrust data for all phase shifts, which may signal a transition in the mechanism of thrust production, reflected in a modification of the wake structure of the wake, as discussed by Clark and Smits (2006), which will be addressed in Sect. 4. Increased uncertainties are observed at St = 0.275 (near the beginning of the transition), which suggests an abrupt change such that the thrust is highly Strouhal number sensitive at that point. The maximum thrust was measured when the fin was actuated with phase shifts in the range 60° ≤ φ ≤ 90°, regardless of Strouhal number.
Fig. 11.
Time-averaged thrust coefficient of the articulated fin as a function of Strouhal number for traveling wave phase differentials φ = 0 and 60°. Uncertainties for St < 0.2 are estimated. These data also appear in Clark and Smits (2006)
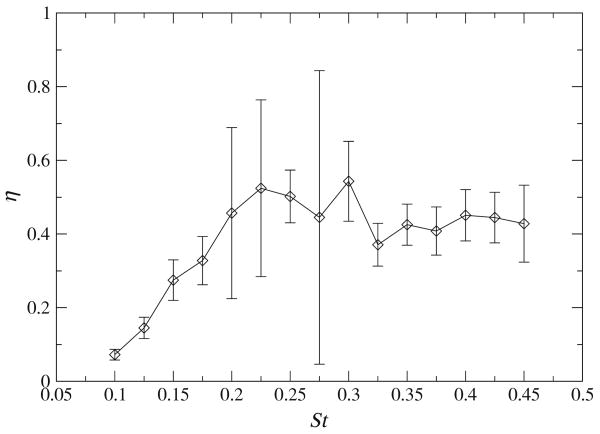
Froude efficiency measurements (Eq. 18) are presented in Fig. 12 for φ = 60°. The large uncertainty at St = 0.275 reflects the large uncertainty in thrust at that Strouhal number, as discussed above. The efficiency curve has a similar shape to that of the pitching panel, shown in Fig. 8, and peak efficiencies of approximately 50% are reasonable for this propulsor, compared with efficiencies of up to 87% measured by Anderson et al. (1998) on a highly optimized pitching and heaving high-aspect-ratio airfoil. The optimal Strouhal number range (0.2–0.3) is also similar to that predicted by Triantafyllou et al. (1991) for two-dimensional oscillating foils.
Fig. 12.
Propulsive efficiency of the articulated fin for a phase shifts of 60°, as a function of Strouhal number. Uncertainties for St < 0.2 are estimated. These data also appear in Clark and Smits (2006)
4 Thrust performance and wake structure
Recent investigations into the structure of wakes produced by finite-aspect-ratio unsteady propulsors has revealed two different types of wake patterns with variation in Strouhal number and other geometrical and kinematic parameters (Guglielmini 2004; Dong et al. 2005; Buchholz and Smits 2006; Clark and Smits 2006). The first, typically observed for Strouhal numbers not much greater than 0.3, represents a Kármán vortex street (in the case of net drag) or a reverse Kármán vortex street (for positive thrust production) in a plane of oscillation away from the edge of the wake, where the vorticity is oriented mainly in the spanwise direction. At higher Strouhal numbers, the wake is observed to bifurcate, forming two distinct trains of vortex structures spreading in the transverse direction with downstream distance. These patterns bear some similarity to the shedding patterns observed in the wakes of nominally two-dimensional oscillating foils (Anderson et al. 1998; Koochesfahani 1989), cylinders in cross-flow (Williamson and Roshko 1988), and co-flowing wakes and jets (Perry and Lim 1978).
Dye visualization and particle image velocimetry were used to investigate the structure of the wake produced by the pitching panels for the conditions under which thrust performance was measured, in order to provide insight into the physics of unsteady thrust generation. In general, for each fixed panel aspect ratio and pitching amplitude, the maximum measured efficiency (with variation in Strouhal number) corresponded to a wake structure resembling a reverse Kármán vortex street (except in cases where this type of wake pattern was not observed at any Strouhal number). Figure 13a illustrates such a wake for AR = 1.11 and A/S = 0.15 at St = 0.13, for which Fig. 8b shows a measured propulsive efficiency of η = 0.18. The streamwise vorticity formed by propulsors of finite aspect ratio interacts with the spanwise vorticity to cause a gradual evolution and transverse spreading of the wake with downstream distance. Figure 13b, corresponding to St = 0.33, shows a rapid bifurcation, for which Fig. 8b indicates a lower propulsive efficiency of 0.08. Side views of the wakes show that at St = 0.13 the spanwise vortices have a highly two-dimensional appearance; whereas the vortical structures shed at St = 0.33 exhibit a rapid spanwise compression just downstream of the trailing edge. Based on detailed low-Reynolds number investigations of these wakes, it has been proposed by Buchholz and Smits (2008) that, despite the very different appearance of the examples shown in Fig. 13, the topology of the vortex skeleton is essentially the same. Therefore, the apparent transition between the two wake patterns appears to be due to a redistribution of vorticity in the constituent structures such as to modify their interactions and transverse rate of growth.
Fig. 13.
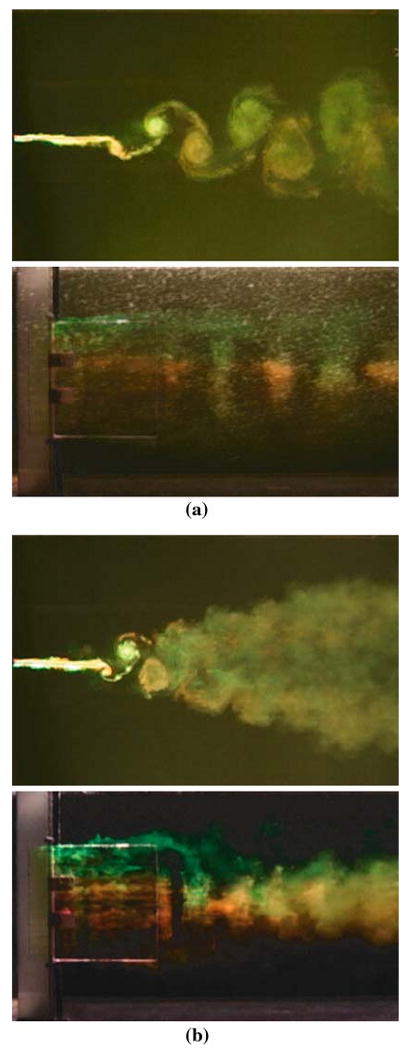
Dye visualization of the wake produced with the panel of AR = 1.11, A = 2 cm (A/S = 0.15) at a St = 0.13 (the optimal Strouhal number for this configuration: η = 0.18), ReC = 36,000, and b St = 0.33, ReC = 13,500. At the lower Strouhal number, the near wake represents a reverse Kármán vortex street, whereas at the higher Strouhal number, the wake rapidly bifurcates
Buchholz and Smits (2008) showed that for ReC = O(104) the primary parameters governing the propulsive efficiency of the finite-aspect-ratio pitching panel are Strouhal number and A/S. However, extreme values of other parameters, such as aspect ratio and the maximum angle of panel excursion (represented by the ratio A/C), can cause the efficiency to reduce. For 0.83 ≤ AR ≤ 2.38, the propulsive efficiency was not found to be sensitive to aspect ratio, but for AR = 0.54 the efficiency was consistently lower which can be observed by comparing the peak efficiency values in Fig. 8a and b. Flow visualization revealed a bifurcating wake under all conditions tested for AR = 0.54, even at the optimal St = 0.13, as shown in Fig. 14a where Fig. 8a reports η = 0.09. For such wakes, the flow is dominated by streamwise vorticity which prevents the quasi-two-dimensional organization of spanwise vorticity consistent with efficient thrust production. Likewise, for AR = 1.11 and large A/C = 0.34, the wake also lacks organization as shown in Fig. 14b, where two constituent wake structures are circled and can be compared with the simple spanwise vortices in Fig. 13a. Accordingly, Fig. 8b shows a reduced peak efficiency of η = 0.13 compared with η = 0.18 for A/S = 0.15. It is expected that flow separation is a factor in this case.
Fig. 14.
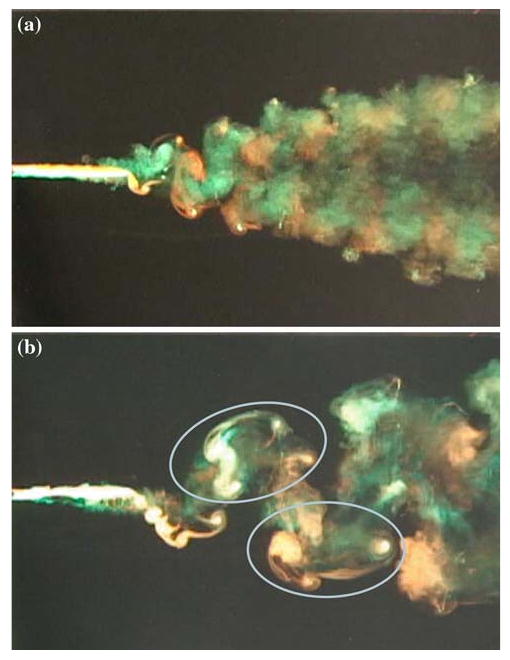
Wake visualizations under conditions of maximum measured propulsive efficiency for a AR = 0.54, A/S = 0.31, St = 0.27 and b AR = 1.11, A/S = 0.31, St = 0.24. In both cases, the simple wake structure observed in Fig. 13a was not observed at any Strouhal number. These images also appear in Buchholz and Smits (2008) (used with permission of the authors and Cambridge University Press)
Below the optimal Strouhal number the efficiency is very sensitive to Strouhal number, as Fig. 8a and b illustrate. Flow visualization at the same parameter values (not shown) reveals that for the Strouhal numbers below the optimal values displayed in Fig. 8, the wake has a wavy appearance, exhibiting little or no development within the field of view. Thus, with decreasing St, the rapid decay of the reverse Kármán wake structure shown in Fig. 13a, and the more complex structures shown in Fig. 14 is consistent with a rapid decrease in propulsive efficiency.
Dye visualization of the batoid fin wake at reduced ReC = 680 reveals a similar evolution with Strouhal number. Visualization at this low Reynolds number allowed interpretation of the wake, but viscous forces are expected to be more important than at the Reynolds number where thrust measurements were made (11,000). However, Buchholz and Smits (2008) demonstrated that, while the signs of vorticity in the wakes were reversed at low St, the global behaviors of wakes at ReC = O(100) and O(104) are similar for the pitching panel, and we expect the same affinity in the batoid fin. All flow visualizations were conducted at φ = 90°, which is within the range where maximum thrust was measured. Figure 15 shows dye patterns in the wake at St = 0.15 and 0.30, revealing a Kármán-like structure at the lower Strouhal number and a bifurcating wake at the higher Strouhal number. At St = 0.15, the wake consists of spanwise vortices of alternating sign, shed by the trailing edge. As illustrated in Clark and Smits (2006), the circulation of each vortex, which results from the distribution of bound vorticity on the fin, is expected to vary along the span of the fin, with the spanwise component diminishing to zero at the root (where the fin is symmetric and stationary), and at the tip (where the chord vanishes). The signs of vorticity in the vortex street of Fig. 15a indicate drag, which is consistent with the wake behavior of the pitching panel at similar Reynolds numbers (Buchholz and Smits 2006, 2008), while producing thrust for ReC = O(104) as Fig. 7 indicates. The large uncertainties observed in the thrust and efficiency data (Figs. 11, 12) for 0.2 > St < 0.3 suggest a distinct transition over a small Strouhal number range (as initially suggested by Clark and Smits 2006), where the wake structure may be bistable, in contrast to the continuous evolution seen for the pitching panel wake. We propose two possible mechanisms for this difference. First, because the fin undergoes a heaving motion it is likely that, with increasing Strouhal number, a dynamic stall vortex is shed from the leading edge (these structures would be difficult to visualize in the present experiment due to the placement of the dye ports), which may cause or be concurrent with a distinct transition in wake structure. Second, because the fin is made of a flexible material, its kinematics are only partly specified by the motion of the spars, with the remainder governed by a fluid–structure interaction which may have multiple stable oscillatory modes for a given actuation scheme.
Fig. 15.
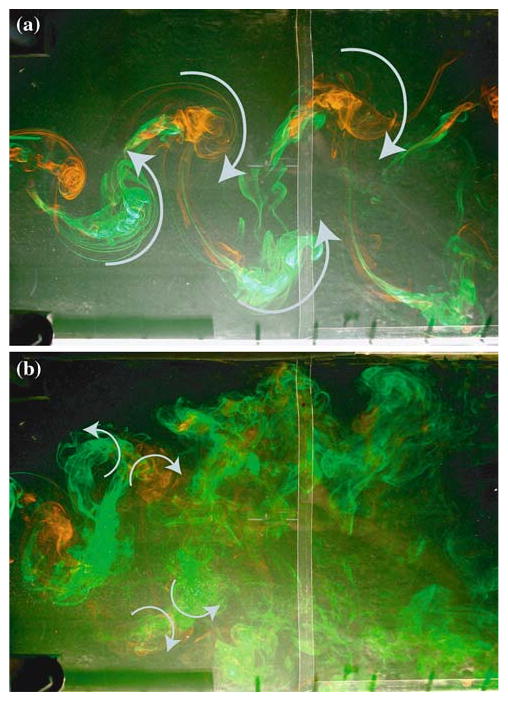
Wake of the articulated fin at a St = 0.15 and b St = 0.30. ReC = 680, φ = 90° (also appears in Clark and Smits 2006; used with permission of the authors and Cambridge University Press). At this Reynolds number, the signs of the vorticies at St = 0.15 are indicative of drag
5 Conclusions
An instrument was designed and tested for the measurement of unsteady streamwise forces produced by unsteady hydrodynamic propulsors. The system employs an air-bearing sled to support the propulsion mechanism and a lever with an adjustable fulcrum, which allows tuning of measurement sensitivity and mechanical stiffness. Propulsive efficiency is determined by measuring the power consumed by the propulsion system, taking into account the efficiency of the DC motor and power loss in the driving mechanism. The instrument has proven to be a versatile measurement platform as it has been successfully used to characterize the performance of two unsteady low-aspect-ratio propulsors which produce forces that differ by more than an order of magnitude. Visualization of the wakes produced by the pitching panels and articulated fin at optimal Strouhal numbers reveal a quasi-two-dimensional wake structure representing a reverse Kármán vortex street. With increasing Strouhal number, the flow becomes more three-dimensional and spreads more rapidly in the transverse direction as the propulsive efficiency decreases.
Acknowledgments
The authors gratefully acknowledge the assistance of Mr. G. Northey, Mr. D. Radcliff, and Mr. M. Vocaturo. Dr. C. Wyckham is thanked for helpful discussions during the conceptual design of the apparatus. This work was supported in part by the National Institutes of Health CRCNS grant 1RO1NS054271.
Footnotes
For the low value of R = 0.167 used for the batoid fin, the contribution of the lever inertia in Eq. 9 is approximately 0.25M even though the mass of the lever is only ≈ 0.05M.
List of symbols
| L1 | distance from lever fulcrum to bottom of lever | |
| L2 | distance from lever fulcrum to top of lever | |
| R = L1/L2 | lever ratio | |
| x | linear displacement of sled | |
| x′ | linear displacement of load cell | |
| θ | angular displacement of lever | |
| k | stiffness of load cell | |
| keff | stiffness of lever-augmented load cell | |
| M | mass of sled | |
| IF | moment of inertia of lever about fulcrum axis | |
|
|
mechanical sensitivity of system | |
| FP | force generated by propulsor | |
| FC | contact force between lever and sled | |
| FLC | force applied to load cell | |
| F0 | amplitude of unsteady propulsor force | |
| ω | angular frequency | |
| ω0 | resonant angular frequency of system | |
| T | thrust | |
| CT | thrust coefficient | |
| η | propulsive efficiency | |
| s | planform area of propulsor | |
| C | chord length of propulsor | |
| A | peak-to-peak amplitude of trailing edge motion | |
| S | span of propulsor | |
| ρ | fluid density | |
| U | freestream speed | |
| Pinp | power imparted by propulsor to fluid | |
| ηw | motor efficiency (water) | |
| ηa | motor efficiency (air) | |
| Pw | power consumption by motor (water) | |
| Pa | power consumption by motor (air) |
References
- Anderson JM, Streitlien K, Barrett DS, Triantafyllou MS. Oscillating foils of high propulsive efficiency. J Fluid Mech. 1998;360:41–72. [Google Scholar]
- Buchholz JHJ, Smits AJ. On the evolution of the wake structure produced by a low-aspect-ratio pitching panel. J Fluid Mech. 2006;546:433–443. doi: 10.1017/S0022112005006865. [DOI] [PMC free article] [PubMed] [Google Scholar]
- Buchholz JHJ, Smits AJ. The wake structure and thrust performance of a rigid low-aspect-ratio pitching panel. J Fluid Mech. 2008 doi: 10.1017/S0022112008000906. in press. [DOI] [PMC free article] [PubMed] [Google Scholar]
- Clark RP, Smits AJ. Thrust production and wake structure of a batoid-inspired oscillating fin. J Fluid Mech. 2006;562:415–429. doi: 10.1017/S0022112006001297. [DOI] [PMC free article] [PubMed] [Google Scholar]
- Dickinson MH, Lehmann F, Sane SP. Wing rotation and the aerodynamic basis of insect flight. Science. 1999;284(5422):1954–1960. doi: 10.1126/science.284.5422.1954. [DOI] [PubMed] [Google Scholar]
- Dong H, Mittal R, Bozkurttas M, Najjar F. Wake structure and performance of finite aspect-ratio flapping foils. AIAA Paper 2005-0081 2005 [Google Scholar]
- Guglielmini L. PhD thesis. University of Genoa; 2004. Modeling of thrust generating foils. [Google Scholar]
- Koochesfahani MM. Vortical patterns in the wake of an oscillating airfoil. AIAA J. 1989;27(9):1200–1205. [Google Scholar]
- Noca F, Shiels D, Jeon D. Measuring instantaneous fluid dynamic forces on bodies, using only velocity fields and their derivatives. J Fluid Struct. 1997;11:345–350. [Google Scholar]
- Peng J, Dabiri JO, Madden PG, Lauder GV. Non-invasive measurement of instantaneous forces during aquatic locomotion: a case of the bluegill sunfish pectoral fin. J Exp Biol. 2007;210:685–698. doi: 10.1242/jeb.02692. [DOI] [PubMed] [Google Scholar]
- Perry AE, Lim TT. Coherent structures in coflowing jets and wakes. J Fluid Mech. 1978;88:451–463. [Google Scholar]
- Ringuette MJ, Milano M, Gharib M. Role of the tip vortex in the force generation of low-aspect ratio normal flat plates. J Fluid Mech. 2007;581:453–468. [Google Scholar]
- Triantafyllou MS, Triantafyllou GS, Gopalkrishnan R. Wake mechanics for thrust generation in oscillating foils. Phys Fluids A. 1991;3(12):2835–2837. [Google Scholar]
- Williamson CHK, Roshko A. Vortex formation in the wake of an oscillating cylinder. J Fluid Struct. 1988;2:355–381. [Google Scholar]


