

Abstract
In vivo thermoregulatory temperature response to RF heating at 9.4 T was studied by measuring temperatures in nine anesthetized swine. Temperatures were measured in the scalp, brain, and rectum. The RF energy was deposited using a four loop head coil tuned to 400.2 MHz. Sham RF was delivered to three swine to understand thermal effects of anesthesia (animal weight = 54.16 kg, SD = 3.08 kg). Continuous wave RF energy was delivered to the other six animals for 2.5–3.4 hours (animal weight = 74.01 ± 26.0 kg, heating duration = 3.05 ± 0.29 hours). The whole head specific absorption rate (SAR) varied between 2.71 W/kg and 3.20 W/kg (SAR = 2.93 ± 0.18 W/kg). Anesthesia caused the brain and rectal temperatures to drop linearly. Altered thermoregulatory response was detected by comparing the difference in the temperature slopes before and after the RF delivery from zero. RF heating statistically significantly altered the rate of cooling down of the animal. The temperature slope changes correlated well with the RF energy per unit head weight and heating duration, and the maximum rectal temperature change during heating in heated animals. The temperature slope changes did not correlate well to the whole head average SARs.
Keywords: RF safety, RF heating, MR safety, ultra high field MRI, MR heating, 9.4 T
Introduction
In vivo thermoregulatory temperature responses of mammalian brains to radio-frequency (RF) heating are unknown for ultra-high field magnetic resonance (UHF-MR) systems (i.e., the MR systems with the Larmor water proton resonance frequency ≥128 MHz). Studying these responses are necessary to develop appropriate RF safety guidelines for human MR imaging at the highest fields.
RF heating is a function of an RF coil, head geometry, tissue types, blood flow, and the physiological status of a biological model (i.e., un-anesthetized vs anesthetized, drugged vs un-drugged, fever or no fever, etc.). However, live humans can not be used to study the thermoregulatory temperature responses of RF heating at ultra-high fields. Therefore, animal models with thermoregulatory mechanisms similar to humans are needed to study physiological effects of a temperature change and temperature-time history. Perfused human cadavers are needed to determine RF heating. The results from the animal models and the humans cadavers are needed to be interpreted together to improve human RF safety at the highest fields.
Experimental data are scarce related to the brain RF heating and related safe temperature and RF power thresholds for MR applications. Studying the brain RF heating at ultra-high fields, Shrivastava et al. measured temperatures in anesthetized swine due to the heating from a 400.2 MHz (9.4 T) head volume coil. Spatially unique correlations were reported between the whole head average specific absorption rate (SAR, or RF power per unit head weight) and the maximum brain and rectal temperature changes during RF heating. (1) Alterations to the thermoregulatory temperature responses due to the RF heating were not studied.
Studying thermal effects of RF heating due to volume head coils at lower fields (64 MHz, 1.5 T), Barber et al. measured temperatures in anesthetized sheep. (2) Sheep were exposed to the whole head average SAR of 4 W/kg for an average of 75 minutes. Skin and eye temperatures increased to about 1.5 °C. Jugular vein and rectal temperatures rose by 0.4 °C and 0.19 °C, respectively. No alterations to the thermoregulatory temperature responses due to the RF heating were reported.
Shellock et al. measured forehead skin, corneal, and body (sublingual pocket) temperatures in unanesthetized humans before and after clinical spin echo sequences. (3,4) Average whole body SAR of 0.06 W/kg was employed for the maximum of 8.67 minutes. Statistically significant temperature changes were measured in the skin (0.2 °C) and cornea (0.5 °C). In another study on humans with similar pulse sequences, average whole body SAR, and pulse durations; Shellock et al. measured statistically significant body temperature changes (0.2 °C). (5)
Current RF safety guidelines limit the maximum in vivo temperature change to 1 °C and the maximum whole head average SAR to 3 W/kg (averaged over any 10 minutes) in a human head. (6,7) However, note that these limits were never validated in humans or animal models for the brain tissue heating conditions relevant for UHF-MR applications. Validating and modifying, if necessary, these limits are needed to design more powerful and safe RF pulse protocols. Researchers regularly find themselves limited at ultra high fields by the upper limit of the SAR in the development of new MR contrasts for brain imaging in health and disease. (8–10)
Cellular thermogenic hazards are related to in vivo temperatures and temperature-time history – not to the whole head average SAR or local SAR. However, MR systems monitor total RF power to an RF coil and body weight alone to ensure safety. Additionally, no limit exists for the maximum exposure duration of the SAR in safety guidelines. Direct measurement of temperature-over-time is unavailable for a mammalian brain before the body reacts adversely to it. ‘Long’ exposure durations of the whole head average SAR may produce local temperature-time histories that may adversely affect thermoregulatory behavior.
As a first step towards understanding thermoregulatory issues related to the brain RF heating at the highest fields direct temperature measurements were performed in the head-skin, brain, and rectum of anesthetized, swine. Our hypothesis was that ‘long’ exposure durations of the ‘guideline safe’ 3 W/kg whole head average SAR would not produce temperature-time histories that alter thermoregulatory temperature behavior.
Methods
Swine was chosen as a human relevant model to study thermoregulatory temperature responses to the brain RF heating at 400.2 MHz (The Larmor water proton frequency at 9.4 T). Presented below are reasons for choosing swine as an animal model, and details of animal instrumentation and statistical data analyses.
Swine as an animal model
Swine was selected as an animal model for their human-comparable thermal mass, surface area, cardiac output, and thermal properties, as well as ease of availability and cost.(11–13) Swine has thermoregulatory mechanisms similar to humans; i.e., swine has sweat glands and it does not pant. Safe, hot environmental temperature limit for a swine (36 °C for a newborn, 30 °C for a mature) is comparable to and slightly lower than that of a human (37 °C for a newborn, 43 °C for a mature). Swine and human have comparable water loss through skin over and below their critical temperatures (7–16 g m−2 h−1 for swine and 6–10 g m−2 h−1 for humans). Swine (52.2 Wm−2) and human (50.5 Wm−2) have similar metabolic energy per unit surface area. Swine and human have negligible energy loss as methane (< 5%).(11,14) The attributes make swine an appropriate and conservative animal model for a human to study the thermoregulatory temperature behavior due to the brain RF heating at ultra high fields.
Next, as mentioned above, RF heating is a function of an RF coil, head geometry, tissue types, blood flow, and the physiological status of the biological model. Porcine and human head geometries were different from each other. Swine skull was 2–5 times thicker than a human skull. Further, swine brain mass was ~7 times lighter than that of a human brain. Large differences in the porcine and human head geometries will result in statistically significant differences in RF exposure levels and RF heating in a swine brain compared to that in a human brain.
Experiment design
The following animal experiment protocol was approved by the Institutional Animal Care and Usage Committee (IACUC) of the University of Minnesota.
In vivo temperatures were measured as a function of time in nine anesthetized swine. Continuous, real time measurements were made using fluoroptic probes (Luxtron Corporation, model 3000 and m3300). The fluoroptic probes were placed in the head-skin and at the depths of 5 mm, 10 mm, and 15 mm in the brain from the dura. (Figure 1) Another fluoroptic probe was marked at 10 cm from the tip and inserted into the rectum such that the mark was adjacent to the rectal opening. In two sham RF heated animals, rectal temperatures were recorded manually using thermister probes.
Figure 1.

Typical fluoroptic temperature probe locations in a swine brain
Regarding the placement of the fluoroptic probes in the brain, an ~18 G hole was drilled in the swine head. The hole was drilled such that the dura was not ruptured. An 18 G catheter was used to measure the depth to the dura from the top of the skin and to puncture the dura. Temperature probes were marked using a liquid eraser ink such that they could be placed at predetermined depths after the dura. The probes were slipped through the hole and the dura into the brain at the predetermined depths. The hole was drilled at one of the two locations: 35 mm or 40 mm away from the joint of skull and neck. Both locations were 5 mm right to the line passing between the two ears of the animal and dividing the head in two equal halves. The locations were chosen such that the probes within the brain were placed away from the pre-optic and thalamus regions to avoid interference with the animal’s thermoregulatory mechanisms. Probes in the brain and rectum were placed away from the surface to measure the RF heating with little effect from ambient cooling. (Figure 1)
A continuous wave (CW) RF power was delivered to the swine head using a four loop volume head coil tuned and matched at 400.2 MHz (Larmor frequency of water proton at 9.4 T). The net RF power delivered (forward-reverse) was measured at the head coil using a power meter (Giga-tronics Incorporated, Universal Power Meter, model 8650A). The SAR was calculated by dividing the net RF power to the coil with the animal’s head weight. The animal’s head weight was obtained after the experiments. In one of the animals, the head weight was estimated from another approximately same weight animal. Estimation of head weight was feasible since similar weight animals demonstrated approximately the same head dimensions. The weight of the animal’s ears (~ 0.3 kg) was not included in the SAR calculations since the ears stayed outside the RF coil. The coupling efficiency of the RF coil to the head was ~80 %. The efficiency was determined by measuring quality factor of the loaded and unloaded coil for two pig heads and assumed to be comparable for other pig heads. The coupling efficiency was not used to calculate the whole head average SAR.
Swine was rested for 6 days after it was transported to the CMRR animal facility to avoid anxiety. It was fasted for 12 hours to avoid complications during induction of anesthesia (15). Water was provided ad libitum during the fasting. For the experiments, first the animal was immobilized and sedated using 5–10 mg/kg Telazol (Tiletamine HCL + Zolzepam HCL). Some of the animals were given 5–10 mg/kg of Pentothal (Thiopental Sodium) in addition to the Telazol to deepen the sedation and reduce pain sensation, if any. This was followed by tracheotomy or intubation. Swine was kept anesthetized during experiments (~ 9 hrs) using 1.5–2.5% Isoflurane in 50%-50% air-O2. Respiratory rate was set to 12–13 cycles/min using a ventilator (Ohmeda 7000). Minute volume was set between 6–8 l/min. Saline (0.9% NaCl) was provided through an ear vein at the rate of ~ 0.5 l/hr to keep swine hydrated during experiments. The bladder was cannulated to keep the bladder empty during the experiment.
Saline was infused at the room temperature of ~20 °C. The effect of the saline temperature on the results was not studied. However, this effect was expected to be minimal. This was so since the thermal entry length for the saline entering a circular vessel of diameter ≤ 1mm (i.e., the ear vein) kept at the uniform and constant vessel wall temperature was less than 8 cm (the length of the swine ear was ~15 cm). In other words, the temperature of the ~20 degree C infused saline was expected to become ~33 degree C in the first 15 cm of saline flow for the assumed uniform ear vein vessel wall temperature of 36 degree C. This suggested that most of the heat transfer from the pig body to saline would be localized near the pig ear. Additionally, note that the rate of saline infusion was approximately a thousand times smaller than the rate of blood flow (saline infusion rate of 0.5 l/hour compared to the blood flow rate of 5 l/min * ~100 beats per min = 500 l/hr).
An ~18 G hole was drilled into the skull at 35 mm or 40 mm away from the joint of the skull and neck. The dura was punctured using an 18 G catheter. The fluoroptic probes were slipped in to the brain at the predetermined depths. A piece of cotton gauge was put in the hole to keep the fluoroptic probes stationary and stop cerebral spinal fluid (CSF) from leaking. Another fluoroptic probe was placed at the head-skin under the cutaneous layer using an 18 G catheter. Next, the four loop volume head coil was placed around the swine head. The power meter was attached to the head coil. A fluoroptic probe was placed 10 cm deep in the rectum. At the end of the experiment, the animal was euthanized using a saturated KCL solution. The animal’s head was severed at the first cervical vertebra C1 and weighed to calculate the whole head average SAR.
Anesthesia affects homeostasis.(16–18) To understand the temperature response caused by the anesthesia (and to separate this temperature response from that of the RF) the temperatures were recorded in three sham RF heated, anesthetized swine for the typical duration of a heating experiment (~9 hours). To study the effect of the SAR, six animals were exposed to the SAR of 2.93 W/kg (SAR = 2.93 ± 0.18 W/kg, heating duration = 3.05 ± 0.29 hours). Altered thermoregulatory response was detected by comparing the thermal response before and after the RF delivery (elaborated in the Results and Discussion sections).
Regarding the heating experiment, base line linear temperature data were recorded for 1–3 hours after the instrumentation (Pre-RF period). Swine took up to 1 hour before it’s rectal and brain temperatures showed a stable, anesthesia induced linear temperature drop. No attempts were made to control the animal’s rectal and brain temperatures by external heating. This was so becuase providing external energy from skin to maintain body temperature would add an unknown, external energy input. Unknown temperature changes due to the unknown energy input and its re-distribution will interfere with the interpretation of results. Additionally, an external torso heating may introduce an extra energy burden for the swine’s thermoregulatory system. Next, the RF power was set to produce approximately the desired whole head average SAR value. The animal’s head weight was estimated from the animal’s weight and previous experience. The actual head weight was measured after the experiment to calculate the actual SAR. The animal was heated for 2.5 – 3.5 hours (RF period) and the temperatures recorded. After the RF, the temperatures were recorded for 2.5 – 5 hours (Post-RF period) to detect RF induced thermoregulatory alterations. Swine took up to 0.75 hours for the initial cooling after the RF. After the initial cooling period; stable, approximately linear temperature responses were recorded. Unstable temperature response data of the pre-RF period and the initial cooling response data of the post-RF period were excluded from the temperature slope calculations.
The minimum number of animals was chosen as N=3 in the current study. This was so since a minimum number of N=2.7 animals was required for each group to have >95% power with P<0.05 (two-sided) to detect a minimum temperature change of 0.25 °C. The two groups were: 1) unheated animals and 2) RF heated animals. The room temperature and humidity, and the animal’s heart rate, blood pressure, end tidal CO2, and the % inspired/expired anesthetic agent Isoflurane were monitored continuously to keep swine stable, and recorded manually every 30 min.
Statistical Analyses
The difference in slopes of the thermal response of the pre-RF period and the post-RF period was obtained from the temperature measurements. The pre-RF period was defined as the time period of one to three hours before the RF was delivered. The post-RF period was defined as the time period of two and a half to five hours after the RF was delivered. As mentioned before, statistical analyses excluded the unstable temperature response data of the pre-RF period (up to an hour) and the initial cooling response data of the post-RF period (up to 0.75 hour). To test that the anesthesia caused linear temperature drop, the slope differences of sham heated animals were compared to zero using the standard, nonparametric Wilcoxon signed rank test. To detect an altered thermoregulatory response, the slope differences of RF heated animals were compared to zero using the same Wilcoxon method. The nonparametric Wilcoxon signed rank test was used since formal tests for the distribution of the change in the slopes in n=6 heated pigs showed evidence of non-normality. To determine physical parameters important for altering thermoregulatory behavior, the slope difference at a location was correlated to the RF heating induced maximum temperature during heating at the same location. Additionally, the slope differences were correlated to the whole head average SAR. Next, the slope differences were regressed linearly on to, both, the RF energy per unit head weight and the heating duration. To differentiate between local and systemic thermoregulatory alterations, the slope differences for the rectal temperatures were compared to the slope differences for the brain and head-skin temperatures. Further, the maximum head-skin and brain temperatures were compared to the maximum rectal temperatures during heating.
Results
Alterations to the thermoregulatory temperature behavior were studied due to the high field RF heating of the brain using nine swine. As mentioned before, temperatures were measured as a function of time in the head-skin, at 5 mm, 10 mm, and 15 mm depths in the brain after the dura, and rectum. Figure 2 showed a typical temperature response of a sham RF heated animal. The anesthesia caused an animal specific linear temperature drop in all animals for the typical duration of an experiment (~ 9 hours). The linearity of the temperature drop was tested positive using the standard, nonparametric Wilcoxon signed rank test (p > 0.05).
Figure 2.
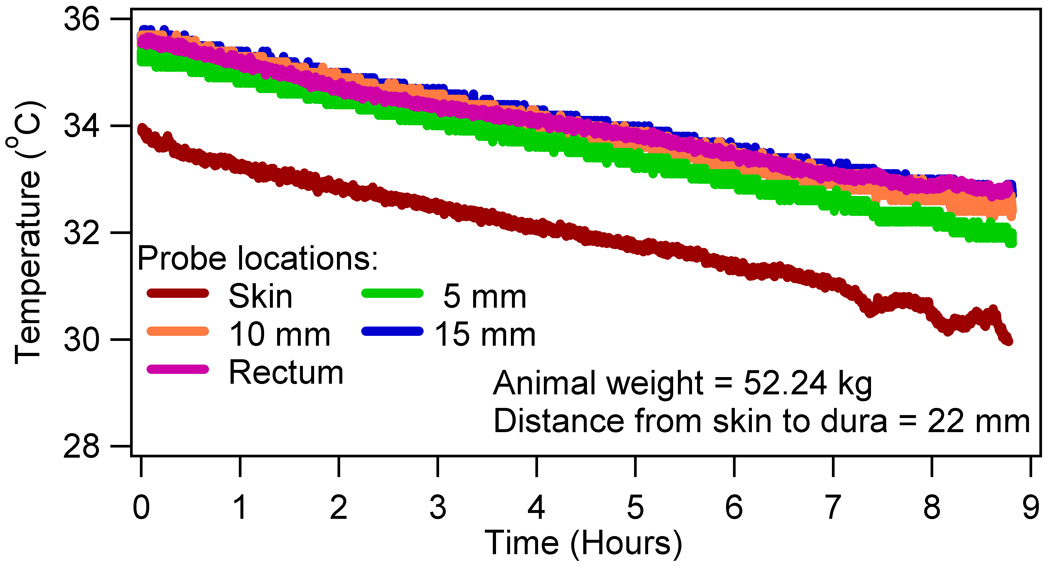
A typical temperature response in a sham RF heated swine
The RF induced altered thermoregulatory response was detected by comparing the difference in the temperature slopes before and after the RF from zero for all heated animals using the Wilcoxon signed rank test. Statistically significant differences were obtained for the brain (p = 0.047 for 5 mm, p = 0.03 for 10 mm, p = 0.03 for 15 mm) and rectum (p = 0.018). Insignificant differences were found for the skin (p = 0.337). Figure 3 presented a typical temperature response of the four RF heated animals, which showed a positive slope thermoregulatory temperature response in the post-RF period. Figure 4 presented a typical temperature response of the other two RF heated animals, which did not show the positive slope in the post-RF period.
Figure 3.

A typical temperature response in four out of six RF heated swine with positive brain and rectal temperature slopes in the post-RF period.
Figure 4.

A typical temperature response in two out of six RF heated swine with negative temperature slopes in the post-RF period.
Table 1 presented the difference in the temperature slopes before and after the RF and the RF induced maximum temperature rise during heating. The whole head average SAR, the RF heating duration, and the absolute rectal temperature at the start of the RF heating were also presented. As mentioned before, the slope changes were obtained by subtracting the temperature slopes of the last 2–3 hours of data from the temperature slopes of approximately 1–3 hours of the pre-RF data. The RF heating induced maximum temperature was obtained for each animal by subtracting the extrapolated pre-RF linear temperature drop from the absolute temperature measurements. (1) This was reasonable since anesthesia caused a linear temperature drop in sham heated animals.
Table 1.
The whole head average SAR (SAR, W/kg), the RF heating duration (HD, hr), and the absolute rectal temperature at the start of the RF heating are presented together with the corresponding temperature slope difference (ΔS, °C/hr) and the maximum temperature change during heating (ΔT, °C) for all locations in swine.
| # | Body Weight (kg) |
SAR (W/kg) |
HD (hr) |
Rectal T (°C) |
Head-skin | Brain (5 mm) |
Brain (10 mm) |
Brain (15 mm) |
Rectum | |||||
|---|---|---|---|---|---|---|---|---|---|---|---|---|---|---|
| ΔS | ΔT | ΔS | ΔT | ΔS | ΔT | ΔS | ΔT | ΔS | ΔT | |||||
| 1 | 52.53 | 0.00 | 0.00 | - | - 0.02 |
- | 0.07 | - | 0.08 | - | 0.11 | - | 0.14 | - |
| 2 | 57.72 | 0.00 | 0.00 | - | - 0.09 |
- | 0.00 | - | 0.00 | - | 0.00 | - | 0.14 | - |
| 3 | 52.24 | 0.00 | 0.00 | - | - 0.04 |
- | 0.05 | - | 0.09 | - | 0.11 | - | 0.21 | - |
| 4 | 109.30 | 2.74 | 3.08 | 38.00 | - 0.09 |
0.72 | 0.12 | 1.25 | 0.11 | 0.90 | 0.13 | 1.10 | 0.14 | 0.65 |
| 5 | 105.25 | 3.20 | 3.00 | 36.53 | 0.00 | 0.62 | - 0.02 |
0.73 | 0.02 | 0.72 | - 0.01 |
0.63 | 0.05 | 0.57 |
| 6 | 61.30 | 2.71 | 3.00 | 35.63 | - 0.03 |
0.72 | 0.01 | 0.63 | 0.00 | 0.54 | 0.01 | 0.55 | 0.01 | 0.46 |
| 7 | 53.00 | 2.99 | 2.55 | 37.49 | 0.07 | 0.98 | 0.30 | 0.85 | 0.32 | 0.83 | 0.34 | 0.84 | 0.38 | 0.83 |
| 8 | 60.60 | 3.01 | 3.28 | 36.22 | 0.35 | 0.79 | 0.70 | 1.28 | 0.67 | 1.07 | 1.07 | 1.41 | 0.88 | 1.14 |
| 9 | 54.60 | 2.90 | 3.40 | 36.46 | 0.06 | 0.52 | 0.25 | 0.84 | 0.26 | 0.67 | 0.27 | 0.63 | 0.30 | 0.59 |
To relate physical parameters to the altered thermoregulatory behavior, the Pearson correlation (p value) was obtained between the slope differences and the following: 1) RF heating induced maximum temperature rise during heating; and 2) whole head average SAR. Brain and rectal slope differences correlated well with the maximum brain and rectal temperatures, respectively. (Table 2, Figure 5) The slope differences did not correlate well with the SAR. (Table 2, Figure 6) Next, the slope differences were linearly regressed on to, both, the RF energy per unit head weight (the whole head average SAR times heating duration) and heating duration. Statistically significant relationship was obtained for all locations. (Table 3)
Table 2.
The Pearson correlation (p value) between the slope differences, and the maximum temperature change during heating (ΔT, °C) and the SAR (W/kg) (N = 6 heated pigs).
| Physical Parameter |
Location | ||||
|---|---|---|---|---|---|
| Head-skin | Brain (5 mm) | Brain (10 mm) | Brain (15 mm) | Rectum | |
| ΔT | 0.25 (0.63) | 0.66 (0.15) | 0.78 (0.07) | 0.82 (0.05) | 0.96 (0.00) |
| SAR | 0.39 (0.44) | 0.18 (0.73) | 0.25 (0.63) | 0.21 (0.69) | 0.27 (0.61) |
Figure 5.

The slope difference ΔS vs the maximum temperature change during the RF heating ΔT for RF heated swine
Figure 6.

The slope difference ΔS vs the whole head average SAR for RF heated swine
Table 3.
Linear regression of the slope differences on to, both, the RF energy per unit head weight and heating duration (N = 9). The following model was used: slope difference ΔS = A + B (RF energy per unit head weight SAR*HD) + C (heating duration HD). Corresponding p values are given next to the parameter estimates in brackets.
| Location | A | B | C |
|---|---|---|---|
| Head-skin | −0.05 (0.31) | 0.28 (0.02) | −0.75 (0.02) |
| Brain (5 mm) | 0.04 (0.52) | 0.53 (0.00) | −1.45 (0.00) |
| Brain (10 mm) | 0.05 (0.32) | 0.52 (0.00) | −1.40 (0.00) |
| Brain (15 mm) | 0.06 (0.59) | 0.75 (0.01) | −2.05 (0.01) |
| Rectum | 0.16 (0.08) | 0.64 (0.00) | −1.76 (0.00) |
To determine the local or systemic nature of the thermoregulatory alterations, Pearson correlation (p value) was obtained between the slope changes and the RF heating induced maximum rectal temperature rise during heating. The following correlation values were obtained: 0.889 (p=0.018) for the head-skin; and 0.945 (0.004) for 5 mm, 0.947 (p=0.004) for 10 mm, and 0.948 (p=0.004) for 15 mm deep in the brain. Further, the slope differences of the head-skin and brain were compared to the rectal slope difference. Let d1 denote the slope difference between a location and rectum. Formally testing H0: d1≥0 versus H1: d1<0 yielded p values of 0.012, 0.025, 0.043, and 0.583 for the head-skin; and 5 mm, 10 mm, and 15 mm in the brain; respectively. Note that the slope difference deep in the brain (at 15 mm) was statistically similar to that of the rectum. Next, the RF heating induced maximum temperatures during heating were compared between a location and rectum. Let d2 denote the difference between the maximum temperature at a location and rectum. Formally testing H0: d2≤0 versus H1: d2>0 yielded p values of 0.420, 0.020, 0.067, and 0.040 for the head-skin; and for 5 mm, 10 mm, and 15 mm in the brain; respectively. Note that the maximum brain temperatures were statistically significantly higher than the maximum rectal temperature.
Discussion
Several useful observations were made regarding the thermoregulatory temperature behavior of swine due to the brain RF heating at 9.4 T. First, the ‘guideline safe’ average 2.93 W/kg of the whole head average SAR exposure for ~3 hours caused a statistically significant change in the thermoregulatory temperature response (p <0.05 for the brain and rectum). The corresponding average maximum rectal temperature change during heating was 0.7 °C (average = 0.71 °C, SD = 0.24 °C). (Table 1) In four of the six heated animals, the brain and rectal temperature slopes in the post-RF period changed to positive values. The corresponding maximum rectal temperature change during heating was ≥ 0.6 °C (average = 0.80 °C, SD = 0.25 °C). (Figure 3, Table 1) In two of the six heated animals, the temperature slopes in the post-RF period failed to change to positive values. The corresponding maximum rectal temperature change during heating was ≤ 0.6 °C (average = 0.52 °C, SD = 0.08 °C). (Figure 4, Table 1) This was an important observation since it underscored the following: one, the RF induced rectal temperature rise of more than 0.7 degree C might cause systemic thermoregulatory changes; and two, RF exposure durations should be included for a given SAR to prevent thermoregulatory changes and ensure safety at ultra high fields. As mentioned before, the altered thermoregulatory temperature response was detected by computing the difference in the temperature drop between the pre-RF and post-RF periods. This was so since a change in the temperature drop response in the post-RF period should be caused due to the interaction of the RF and swine brain alone. Insignificant differences were obtained in the temperature slopes of the pre-RF and post-RF periods in sham heated swine. The rectal temperature rise of 0.7 °C as a possible limit to altered thermoregulation was comparable to Kauppinen’s sauna study where loss of core temperature control had been reported due to 1 degree esophageal temperature change (esophageal temperature of 38 °C) in un-anesthetized healthy humans.(19)
Second, the average 2.93 W/kg SAR exposure for the average 3.05 hours resulted in a decreased rate of temperature drop in the post-RF period compared to the rate of temperature drop in the pre-RF period. This observation suggested the following possible systemic changes in the post-RF period: 1) vasoconstriction, and 2) increased metabolic rate. Anesthesia caused vasodilation. (20–23) Therefore, the animal’s ability to cause vasoconstriction in the post-RF period seemed less probable. Note that the sham heated animals were unable to change the rate of temperature drop due to the vasoconstriction. However, ten previous studies studying the effect of magnetic field on the blood vessels and blood flow found homeostatic effect of the magnetic field. Thus, given that swine were vasodilated due to the anesthesia, the RF might have caused vasoconstriction resulting in the temperature rise after the RF. (24) Alternatively, an increased metabolic rate might have resulted due to the RF exposure to the animal. Excessive heating due to long term exposures to high ambient temperatures are known to cause heat stress resulting in increased metabolic rate.
Third, the anesthesia caused a linear drop in the head-skin, brain, and rectal temperatures. (Figure 2) (1,25) Characterizing the anesthesia induced temperature response was necessary to study RF heating induced temperature response. This was so since the measured absolute temperature response was composed of the anesthesia induced cooling and the RF power induced heating temperature responses. The anesthesia induced cooling was explained as follows. An increase or a decrease in the body temperature field is caused by a balance between the internal heat source (i.e., glucose metabolism, heating produced by external means, etc.) and skin to environment heat transfer. To lower the temperatures of a heated, un-anesthetized body; the body reduces the metabolism to base line values and increases sweating and blood flow to the skin. The increase in blood flow increases skin to the ambient heat transfer and is caused by dilating blood vessels near the skin. Isoflurane anesthesia reduces basal glucose metabolism by ~ 50%. Signs of active sweating were absent in swine during the experiments. Isoflurane caused blood vessels to dilate in porcine models. The anesthesia-induced glucose metabolism reduction and vasodilation simulated the metabolism reduction and vasodilation of a heated, un-anesthetized body; thus, lowering the body temperatures.
Fourth, the brain and rectal slope differences correlated well with the maximum brain and rectal temperature changes during heating, respectively. However, the head-skin slope difference did not correlate well with the maximum head-skin temperature change during heating. (Table 2, Figure 5) This observation corroborated the importance of temperature change during heating on the thermoregulatory alteration. The absence of good correlation between the head-skin slope differences and the maximum temperature change can be attributed to the swine’s ability to manipulate the skin blood flow. Change in the skin blood flow changed the blood vessel to tissue heat transfer and thus the maximum head-skin temperature change.(26)
Fifth, the temperature slope differences did not correlate well with the whole head average SAR. (Table 2, Figure 6) This observation together with the fourth observation suggested the importance of temperature change during heating on the thermoregulatory alteration. Local and systemic temperature changes due to a whole head average SAR depended on the animal’s ability to remove the RF energy. This ability, in turn, depended on the animal’s surface area and thermo-physiologic response to anesthesia. Alternatively, given the anatomical variations in the head and body dimensions among animals and the small brain volume, the local SAR pattern might have varied among experiments. Variation in the local SAR distribution among animals will produce varying local temperature-time history. This may result in poor correlations between the slope differences and whole head average SAR.
Sixth, the temperature slope differences were well correlated to, both, the RF energy per unit head weight (the whole head average SAR times heating duration) and the RF heating duration. (Table 3) This observation suggested that the thermoregulatory alteration was dependent on both the maximum temperature change during heating and the RF heating duration. In other words, local temperature-time histories were important factors in causing the thermoregulatory alterations. This in turn suggested that the effect of local temperature-time histories should be carefully studied to ensure safety at the highest fields.
Seventh, statistically significant correlations were obtained between the temperature slope differences of all locations and the maximum rectal temperature change during heating. Further, insignificant differences were found between the temperature slope differences in the deep brain (15 mm deep) and rectum (p-value of 0.583). These observations suggested that the thermoregulatory alteration was caused at the systemic level in anesthetized, RF heated swine. Statistically significant differences between the temperature slope differences in the head-skin, 5 mm and 10 mm brain locations, and rectum were attributed to the effect of ambient cooling. Note the effect of ambient cooling in the trend of p-values (0.012 for the head-skin, 0.025 for 5 mm deep in the brain, 0.043 for 10 mm deep in the brain). As the depth increased the significance of the slope differences between a location and rectum diminished.
Eighth, statistically significant differences were obtained between the maximum brain and rectal temperatures during heating. This observation was explained as follows. RF power was delivered to the brain which caused brain heating. This RF power was taken away from the brain and distributed all over the body by the blood. The animal was unable to get rid of all the deposited energy. This caused rectal temperatures to rise due to the RF heating, but at a slower rate. Insignificant differences between the maximum head-skin and rectal temperatures were attributed to the skin blood perfusion and ambient cooling.
The effect of the average weight difference between the sham RF heated animals and RF heated animals on the presented results was expected to be minimal. This was so since the average weight of the RF heated animals 6–9 (Table 1) was 57.38±4.19 kg, which was comparable to the average weight of the sham heated animals (54.06±3.08 kg). Three of these four RF heated animals showed statistically significant thermoregulatory alterations. Regarding the two heavier animals (animals 4 and 5, Table 1), one of them demonstrated thermoregulatory alterations and another one did not. Further, the anesthesia induced temperature drop was unique to an animal. The temperature slope differences and the RF heating induced maximum temperature change during the heating duration were obtained based on the animal specific anesthesia induced temperature drop. Poor correlations were obtained (R2 = 0.13) between the total RF energy per unit body weight and the maximum rectal temperature change.
In comparing the present study with previous studies, Barber et al. reported the mean temperature rise of 0.2–0.3 °C (hr)−1 (W/kg)−1, 0.08 °C (hr)−1 (W/kg)−1, 0.04 °C (hr)−1 (W/kg)−1 in the head-skin, jugular vein, and rectum of their sheep, respectively. (2) These values were comparable to the mean maximum head-skin and rectal temperature changes during heating of 0.08 °C (hr)−1 (W/kg)−1 in the swine. The difference in the temperature values were attributed to the head coils used, and geometry and thermoregulatory differences between a sheep and a swine. Further, Barber et al. neglected the effect of anesthesia on the temperature change.
Next, Shellock et al. reported the mean forehead skin temperature of 0.2 °C in un-anesthetized humans due to heating from a head coil. The mean whole head average SAR and the heating duration used for the above skin temperature change were not available. Assuming the SAR of 2.54 W/kg and the heating duration of 8.67 minutes, their mean head-skin temperature change was 0.55 °C (hr)−1 (W/kg)−1. (4) Again, the difference in the head-skin temperature values was attributed to the different head coils used and the species difference. The short duration of human experiments together with the standard deviation of the fluoroptic probes (0.1 °C) may add to the difference.
Regarding the limitations of the study, the results presented here can not be directly extrapolated to humans. This is so since the results were caused by a specific set of temperature–time histories in an anesthetized swine brain. Temperature-time histories depend on the RF coil, head and body geometries, thermal properties, blood flow, and the RF power distribution. The RF power distribution depends on the head geometry and electrical properties of tissue. Lack of similarities between a human and swine in these respects prohibited extrapolating our results directly to humans. Additionally, anesthesia changes thermoregulatory thresholds and blood flow distribution in mammals (11). This will affect in vivo temperature response induced by an RF power distribution. Animal models where thermo-physiologic changes due to anesthesia are minimal may serve as better models. Swine had variable brain and rectal temperatures at the start of the RF heating among experiments. The effect of the variable temperatures on the presented results is not known.
Finally, note that the observation of systemic thermoregulatory alteration was based on the correlations obtained using a head-skin measurement, three measurements in the brain, and a rectal measurement. These numbers of measurements were not enough to conclusively rule out local thermoregulatory alterations, which might have induced the systemic thermoregulatory alterations. Brain RF heating was non-uniform. The non uniform RF heating and blood flow results in non-uniform local temperature-time histories in the brain. Further, regional temperature-time thresholds for a mammalian brain are unknown. Thus, it is possible that an unknown local brain region was excessively stressed to result in the measured systemic thermoregulatory alterations.
More temperature probes, and a validated and accurate bioheat thermal model and non-invasive thermometry methods with sub-degree C resolution are needed to determine local hot spots in a porcine and human head. This will help conclusively determine if there were local thermoregulatory changes, which might have resulted in the systemic alterations. Further, regional temperature-time thresholds for a mammalian brain need to be determined and monitored to ensure safety. Regional cooling thermal time constants in a perfused mammalian brain need to be determined. This time constants will result in different local temperature-time histories due to a continuous and pulsed application of RF.
Conclusions
To understand thermoregulatory issues related to the brain RF heating at the highest fields; direct temperature measurements were performed in the head-skin, brain, and rectum of anesthetized swine. The average SAR of 2.93 W/kg for the average 3.05 hours resulted in statistically significant alteration to the post-RF temperature responses compared to the pre-RF temperature responses. The thermal alteration was caused by a specific set of temperature–time histories in an anesthetized swine brain. A rectal temperature change of more than 0.7 °C was required to cause the thermoregulatory alteration.
Acknowledgments
R01 CA94318, R01 EB0000895, R01 CA94200, C06 RR12147, C06 RR17557, BTRR - P41 RR08079, R01 EB006835, R01 EB007327, P41 RR08079, and the Keck foundation. Also, authors appreciate the help of Mr. Robert Schlentz and Dr. Gregor Adriany in some of the animal instrumentations.
Contributor Information
Devashish Shrivastava, Center for Magnetic Resonance Research, University of Minnesota, 2021, 6th St. SE, Minneapolis, MN 55455, USA.
Timothy Hanson, Division of Biostatistics, University of Minnesota, MMC 303 Mayo, 420 Delaware Minneapolis, MN 55455, USA.
Jeramy Kulesa, Center for Magnetic Resonance Research, University of Minnesota, 2021, 6th St. SE, Minneapolis, MN 55455, USA.
Lance DelaBarre, Center for Magnetic Resonance Research, University of Minnesota, 2021, 6th St. SE, Minneapolis, MN 55455, USA.
Paul Iaizzo, Department of Surgery, University of Minnesota, MMC 107 Mayo, 8107, 420 Delaware, Minneapolis, MN 55455, USA.
J. Thomas Vaughan, Center for Magnetic Resonance Research, University of Minnesota, 2021, 6th St. SE, Minneapolis, MN 55455, USA.
References
- 1.Shrivastava D, Hanson T, Schlentz R, Gallaghar W, Snyder C, Delabarre L, Prakash S, Iaizzo P, Vaughan JT. Radiofrequency heating at 9.4T: in vivo temperature measurement results in swine. Magn Reson Med. 2008;59(1):73–78. doi: 10.1002/mrm.21425. [DOI] [PMC free article] [PubMed] [Google Scholar]
- 2.Barber BJ, Schaefer DJ, Gordon CJ, Zawieja DC, Hecker J. Thermal effects of MR imaging: worst-case studies on sheep. AJR Am J Roentgenol. 1990;155(5):1105–1110. doi: 10.2214/ajr.155.5.2120944. [DOI] [PubMed] [Google Scholar]
- 3.Shellock FG, Crues JV. Corneal temperature changes induced by high-field-strength MR imaging with a head coil. Radiology. 1988;167(3):809–811. doi: 10.1148/radiology.167.3.3363146. [DOI] [PubMed] [Google Scholar]
- 4.Shellock FG, Crues JV. Temperature changes caused by MR imaging of the brain with a head coil. AJNR Am J Neuroradiol. 1988;9(2):287–291. [PMC free article] [PubMed] [Google Scholar]
- 5.Shellock FG, Gordon CJ, Schaefer DJ. Thermoregulatory responses to clinical magnetic resonance imaging of the head at 1.5 tesla. Lack of evidence for direct effects on the hypothalamus. Acta Radiol Suppl. 1986;369:512–513. [PubMed] [Google Scholar]
- 6.CDRH, FDA. Guidance for Industry and FDA Staff - Criteria for Significant Risk Investigations of Magnetic Resonance Diagnostic Devices. 2003 [Google Scholar]
- 7.ICNIRP. Medical Magnetic Resonance (MR) Procedures: Protection of Patients. 2004 doi: 10.1097/00004032-200408000-00008. [DOI] [PubMed] [Google Scholar]
- 8.Michaeli S, Sorce DJ, Springer CS, Jr, Ugurbil K, Garwood M. T1rho MRI contrast in the human brain: modulation of the longitudinal rotating frame relaxation shutter-speed during an adiabatic RF pulse. J Magn Reson. 2006;181(1):135–147. doi: 10.1016/j.jmr.2006.04.002. [DOI] [PubMed] [Google Scholar]
- 9.Michaeli S, Grohn H, Grohn O, Sorce DJ, Kauppinen R, Springer CS, Jr, Ugurbil K, Garwood M. Exchange-influenced T2rho contrast in human brain images measured with adiabatic radio frequency pulses. Magn Reson Med. 2005;53(4):823–829. doi: 10.1002/mrm.20428. [DOI] [PubMed] [Google Scholar]
- 10.Michaeli S, Oz G, Sorce DJ, Garwood M, Ugurbil K, Majestic S, Tuite P. Assessment of brain iron and neuronal integrity in patients with Parkinson's disease using novel MRI contrasts. Mov Disord. 2007;22(3):334–340. doi: 10.1002/mds.21227. [DOI] [PubMed] [Google Scholar]
- 11.Mount LE. In: Adaptation to thermal environment - Man and his productive animals. Barrington EJW, Willis AJ, Sleigh MA, editors. Baltimore: University Park Press; 1979. p. 333. [Google Scholar]
- 12.Duck F. Physical Properties of Tissue. London: Academic Press; 1990. [Google Scholar]
- 13.Holmes KR. In: Biotransport - Heat and Mass Transfer in Living Systems. Diller KR, editor. Turkey: Annals of the New York Academy of Sciences; 1998. [Google Scholar]
- 14.Dewhirst MW, Viglianti BL, Lora-Michiels M, Hanson M, Hoopes PJ. Basic principles of thermal dosimetry and thermal thresholds for tissue damage from hyperthermia. Int J Hyperthermia. 2003;19(3):267–294. doi: 10.1080/0265673031000119006. [DOI] [PubMed] [Google Scholar]
- 15.Becker BA, Niwano Y, Johnson HD. Physiologic and immune responses associated with 48-hour fast of pigs. Lab Anim Sci. 1992;42(1):51–53. [PubMed] [Google Scholar]
- 16.Sessler DI. Perioperative heat balance. Anesthesiology. 2000;92(2):578–596. doi: 10.1097/00000542-200002000-00042. [DOI] [PubMed] [Google Scholar]
- 17.Kurz A, Sessler DI, Christensen R, Dechert M. Heat balance and distribution during the core-temperature plateau in anesthetized humans. Anesthesiology. 1995;83(3):491–499. doi: 10.1097/00000542-199509000-00007. [DOI] [PubMed] [Google Scholar]
- 18.Belani K, Sessler DI, Sessler AM, Schroeder M, McGuire J, Merrifield B, Washington DE, Moayeri A. Leg heat content continues to decrease during the core temperature plateau in humans anesthetized with isoflurane. Anesthesiology. 1993;78(5):856–863. doi: 10.1097/00000542-199305000-00008. [DOI] [PubMed] [Google Scholar]
- 19.Kauppinen K. Sauna, shower, and ice water immersion. Physiological responses to brief exposures to heat, cool, and cold. Part III. Body temperatures. Arctic Med Res. 1989;48(2):75–86. [PubMed] [Google Scholar]
- 20.Holmstrom A, Akeson J. Desflurane induces more cerebral vasodilation than isoflurane at the same A-line autoregressive index level. Acta Anaesthesiol Scand. 2005;49(6):754–758. doi: 10.1111/j.1399-6576.2005.00697.x. [DOI] [PubMed] [Google Scholar]
- 21.Holmstrom A, Akeson J. Sevoflurane induces less cerebral vasodilation than isoflurane at the same A-line autoregressive index level. Acta Anaesthesiol Scand. 2005;49(1):16–22. doi: 10.1111/j.1399-6576.2004.00576.x. [DOI] [PubMed] [Google Scholar]
- 22.Crystal GJ, Salem MR. Isoflurane causes vasodilation in the coronary circulation. Anesthesiology. 2003;98(4):1030. doi: 10.1097/00000542-200304000-00049. [DOI] [PubMed] [Google Scholar]
- 23.Park KW, Dai HB, Lowenstein E, Darvish A, Sellke FW. Isoflurane and halothane attenuate endothelium-dependent vasodilation in rat coronary microvessels. Anesth Analg. 1997;84(2):278–284. doi: 10.1097/00000539-199702000-00008. [DOI] [PubMed] [Google Scholar]
- 24.McKay JC, Prato FS, Thomas AW. A literature review: the effects of magnetic field exposure on blood flow and blood vessels in the microvasculature. Bioelectromagnetics. 2007;28(2):81–98. doi: 10.1002/bem.20284. [DOI] [PubMed] [Google Scholar]
- 25.Shrivastava D, Schlentz R, Kulesa J, Snyder C, DelaBarre L, Hanson T, Iaizzo P, Vaughan JT. RF Safety at 9.4T- Porcine In vivo Results. Berlin, Germany: Proceedings of the International Society of Magnetic Resonance in Medicine; 2007. [Google Scholar]
- 26.Roemer RB, Oleson JR, Cetas TC. Oscillatory temperature response to constant power applied to canine muscle. Am J Physiol. 1985;249(2 Pt 2):R153–R158. doi: 10.1152/ajpregu.1985.249.2.R153. [DOI] [PubMed] [Google Scholar]