

Abstract
Background
Superior temporal gyrus (STG/BA22) volume is reduced in schizophrenia and to a milder degree in schizotypal personality disorder (SPD), representing a less severe disorder in the schizophrenia-spectrum. SPD and Borderline personality disorder (BPD) are severe personality disorders characterized by social and cognitive dysfunction. However, while SPD is characterized by social withdrawal/anhedonia, BPD is marked by hyper-reactivity to interpersonal stimuli and hyper-emotionality. This is the first morphometric study to directly compare SPD and BPD patients in temporal volume.
Methods
We compared three age-gender- and education-matched groups: 27 unmedicated SPD individuals with no BPD traits, 52 unmedicated BPD individuals with no SPD traits, and 45 healthy controls. We examined gray matter volume of frontal and temporal lobe Brodmann areas (BAs), and dorsal/ventral amygdala from 3T magnetic resonance imaging.
Results
In the STG, an auditory association area reported to be dysfunctional in SPD and BPD, the SPD patients had significantly smaller volume than healthy controls and BPD patients. No group differences were found between BPD patients and controls. Smaller BA22 volume was associated with greater symptom severity in SPD patients. Reduced STG volume may be an important endophenotype for schizophrenia-spectrum disorders. SPD is distinct from BPD in terms of STG volume abnormalities which may reflect different underlying pathophysiological mechanisms and could help discriminate between them.
Keywords: Schizotypal personality disorder, Borderline personality disorder, Schizophrenia, MRI, Brodmann area 22, Auditory cortex
1. Introduction
Several previous studies have shown reduced superior temporal gyrus (STG) volume in individuals with schizophrenia (reviewed by Shenton et al., 2001). Recent work has found that schizotypal personality disorder (SPD) patients also show this abnormality but to a lesser extent than in schizophrenia (Buchsbaum et al., 1997; Dickey et al., 1999; Hazlett et al., 2008; Kawasaki et al., 2004; Takahashi et al., 2006), adding further support to existing evidence that SPD is in the schizophrenia spectrum. However, previous studies of STG volume in SPD compared patients with “supernormal” individuals who did not have Axis I or II psychopathology and also had no family history for psychiatric illness, perhaps increasing the likelihood of finding group differences (Kendler, 2003). Many biological findings in personality disorders appear to be present across different personality disorders, representing perhaps vulnerabilities to personality disorders per se (Kendler et al., 2008). Like other findings, it remains unclear whether STG volume abnormalities are specific to SPD or whether they are also present in other personality disorders, such as borderline personality disorder (BPD). This study aims to evaluate the specificity of STG abnormalities in SPD and BPD participants by comparing the volume of this region as well as other temporal and frontal lobe regions.
The diagnosis of SPD, characterized by asocial tendencies, difficulties with language and paranoid, odd behavior and magical thinking, was first introduced in the DSM-III and based on the clinical profiles of patients with “borderline schizophrenia” in the landmark Danish adoption schizophrenia studies (Rosenthal et al., 1971). These studies and earlier formulations of the disorder suggested that relatives of patients with schizophrenia may display deviant psychological functioning but not all signs of schizophrenia, providing evidence for a spectrum of schizophrenia-related disorders. Many of these earlier studies of “borderline schizophrenia” included symptoms related to conceptions of BPD, but diagnostic overlap decreased when borderline criterion for paranoid ideation under stress was introduced in DSM-III-R (Spitzer et al., 1979). BPD, characterized by affective instability and impulsive behavior, was first included as a personality disorder diagnosis in DSM-III (Gunderson and Singer, 1975;Kernberg, 1977). Nonetheless, the co-morbidity of BPD and SPD is not uncommon (e.g., Zanarini et al., 1998).
Morphometric studies examining the temporal lobe in SPD report reduced gray matter volume in STG (Buchsbaum et al., 1997; Dickey et al., 1999; Hazlett et al., 2008; Kawasaki et al., 2004; Takahashi et al., 2006), middle and inferior temporal gyrus (Downhill et al., 2001), and Heschl’s gyrus (Dickey et al., 2002a). Of note, Dickey and colleagues found decreased STG volume in male (2002a) but not female SPD patients (2003). While volume reductions in medial temporal regions, including amygdala and/or hippocampal complex, are reported in schizophrenia (reviewed by Shenton et al., 2001), these findings have not been consistently observed in SPD (Dickey et al., 2002b). Only one study (Suzuki et al., 2005) reported bilateral reductions in both of these structures in SPD, while Dickey et al. (2007) recently reported reduced hippocampal volume in SPD. Volume reductions in frontal cortex regions have also been reported in studies with schizophrenia patients, but several studies suggest these areas may be relatively preserved in SPD (Hazlett et al., 2008; Kawasaki et al., 2004; Suzuki et al., 2005). Our group and others (Haznedar et al., 2004; Takahashi et al., 2004) previously reported no morphologic differences in cingulate gyrus in SPD but, using a larger sample size, we later found smaller cingulate volume compared with healthy controls, particularly in anterior cingulate cortex (ACC) gray matter (Hazlett et al., 2008).
On the other hand, BPD studies examining the frontal lobe have reported reductions in overall frontal lobe volume (Lyoo et al., 1998), left orbitofrontal cortex and right anterior cingulate volume (Tebartz van Elst et al., 2003), and anterior cingulate (BA24) gray matter volume (Hazlett et al., 2005). It should be noted that Tebartz van Elst and colleagues later found no significant differences in these regions using voxel-based morphometric MRI (Rusch et al., 2003). Some studies also report hippocampal (Irle et al., 2005; Zetzsche et al., 2007) and amygdala volume loss in BPD (Driessen et al., 2000; Schmahl et al., 2003;Tebartz van Elst et al., 2003), while others have shown no significant structural differences between BPD patients and controls in these regions (Chanen et al., 2008; New et al., 2007). Another study found smaller hippocampal volume but no differences in amygdala volume (Brambilla et al., 2004). To date, the above-mentioned studies have looked at these patient groups separately and findings suggest SPD patients have smaller STG volume, both SPD and BPD patients have abnormalities in frontal regions, particularly smaller anterior cingulate volume, and amygdala findings are less clear.
The aim of this study was to examine volume of frontal and temporal lobe regions in three age-gender- and education-matched groups: patients with BPD but no SPD traits, patients with SPD but no BPD traits, and healthy controls. This is the first study to directly compare these groups and test whether morphometric abnormalities in these brain regions are specific to one personality disorder and not the other, or whether the two patient groups differ from healthy controls in opposite directions. While both SPD and BPD patients exhibit symptoms that have been linked to temporal and frontal lobe abnormalities, these symptoms differ phenomenologically from one another. Specifically, emotion dysregulation and impulsivity are hallmark features of BPD (Skodol et al., 2002), while blunted affect and executive dysfunction are frequently associated with SPD (Kirrane and Siever, 2000). In this sense, abnormal volume in prefrontal and temporal regions may underlie affect-related symptoms in BPD (Soloff et al., 2008); in SPD, abnormal frontal and temporal lobe volume may be associated with cognitive and/or executive functioning deficits (McCloskey et al., 2005). Due to these different patterns of symptom presentation in our clinical groups, we expected to find different patterns of frontal/temporal structural abnormalities in these groups as well. Of note, since we want to be able to draw conclusions about regional specificity, we looked at a number of different frontal and temporal regions. Specifically, in the frontal lobe, our analyses focused on prefrontal and cingulate cortex Brodmann areas (BAs)— important in attention and the modulation of executive function and emotion. In the temporal lobe, we focused on regions that contribute to executive and emotion processing and have been shown to have dense interconnections: temporal gyrus regions and amygdala (Barbas, 2007; Pandya, 1995; Price, 2007). The specific temporal gyrus regions included primary auditory cortex corresponding to BA41 and BA42 and auditory association areas corresponding to BA22/STG. Also, since fMRI studies (Kim et al., 2003;Whalen et al., 2001) have begun identifying differential roles of amygdaloid subnuclei and their respective connections with the frontal lobe, we parcellated amygdala into dorsal and ventral regions.
Previous work shows that, in SPD, functional impairment such as odd speech is associated with smaller STG volume (Dickey et al., 2003). This finding is consistent with basic research (Binder et al., 2000; Joanisse and Gati, 2003) and schizophrenia work (e.g., Wible et al., 2001) suggesting the importance of temporal lobe function in language processing and production. In order to investigate individual differences in SPD, we examine correlations between symptom severity, including odd speech/thinking symptomatology, and volume of our hypothesized regions of interest.
We hypothesized that our patient groups would show different frontal-temporal volume patterns from each other and the healthy control group. More specifically, we hypothesized that SPD but not BPD patients would demonstrate reduced STG volume compared with controls. We further hypothesized that the patient groups would show reduced ACC volume compared with healthy controls. We expected group differences in STG and ACC to be more robust while amygdala, BA41, BA42 and additional frontal regions would show more subtle differences. Lastly, we investigated individual differences in symptom severity to determine whether greater symptom severity was associated with frontal-temporal abnormalities. Consistent with prior work (Dickey et al., 2003), we hypothesized that greater STG reduction in SPD would be associated with greater degree of abnormal speech and symptom severity.
2. Methods
2.1 Participants
Fifty-two patients meeting DSM-IV criteria for BPD, 27 patients meeting DSM-IV criteria for SPD and 45 healthy controls (Table-1 for demographic details) were included. The groups did not significantly differ in their distribution of age, gender, or highest educational degree earned. All patients were unmedicated at the time of their MRI which we define as off psychoactive medication for a minimum of two weeks (five weeks for fluoxetine) prior to MRI scanning. Exclusion criteria for all participants included severe medical or neurological illness, head injury, or past substance dependence or substance abuse in the prior six months. All participants had a negative urine toxicology screen, and females, a negative pregnancy test on scan day. Written informed consent approved by Mount Sinai and Bronx Veterans Affairs Medical Center Institutional Review Boards was provided by all participants.
Table 1. Demographic and Clinical Characteristics of Borderline Personality Disorder (BPD), Schizotypal Personality Disorder (SPD), and Healthy Controls.
All eligible participants (including healthy controls) received a full diagnostic structured interview which included the Structured Clinical Interview for DSM-IV Axis I disorders (SCID-I; First et al., 1996) and the Structured Interview for DSM-IV Personality Disorders (SIDP; Pfohl et al., 1997). Weekly consensus and diagnostic meetings were led by psychologists. All patient interviews were conducted by doctoral level psychologists who were specifically trained in the assessment of Axis II disorders. In our laboratory, the intraclass correlation for BPD diagnosis was .80 and for SPD it was 0.73. All patients met DSM-IV criteria for either BPD or SPD. For each patient, each of the DSM-IV criteria for each personality disorder were rated on a 4-point scale (0=absent, 0.5=somewhat present, 1.0=definitely present/prototypic, 2.0=severe, pervasive). As required for a DSM-IV diagnosis of SPD, these patients met at least five of the nine SPD criteria with a rating ≥ 1.0). SPD patients were allowed no more than three BPD criteria with two items rated as 1.0 and one item rated as 0.5 in order to control for comorbidity and/or traits. As required for a DSM-IV diagnosis of BPD, these patients met at least five of the nine DSM-IV criteria. BPD patients were allowed no more than three SPD criteria with two items rated as 1.0 and one item rated as 0.5. To quantify the level of clinical symptom severity, we added up the individual symptom ratings for each diagnostic criterion. Odd speech impairment was calculated by adding ratings for the six odd speech criteria subscales which included the following: (1) digressive, (2) vague, (3) over-elaborate, (4) circumstantial, (5) overly metaphorical, (6) not just digressive, vague, over-elaborate, but overly concrete, illogical or at an inappropriate level of abstraction. Ratings were on a 4-point scale (0=absent, 0.5=somewhat present, 1.0=definitely present/prototypic, 2.0=severe, pervasive) and then totaled for the odd speech impairment score. Healthy controls were required to have no history of mental illness nor a first degree relative with an Axis I or Axis II diagnosis.
|
Characteristic |
Healthy Controls (n=45) |
BPD patients (n=52) |
SPD patients (n=27) |
t value |
p value |
||||||
|---|---|---|---|---|---|---|---|---|---|---|---|
| Mean | SD | Range | Mean | SD | Range | Mean | SD | Range | Age | ||
| Age (years) | 32.44 | 9.28 | 21–57 | 32.06 | 9.00 | 20–51 | 35.59 | 11.11 | 20–55 | N vs. BPD: t(95)= 0.21 | 0.84 |
| N vs. SPD: t(70)=1.29 | 0.20 | ||||||||||
| Education* | 4.51 | 2.76 | 1–9 | 4.02 | 2.31 | 1–8 | 4.22 | 2.14 | 1–8 | ||
| BPD vs. SPD: t(77)=1.53 | 0.13 | ||||||||||
| Symptom Severity** | - | - | 6.58 | 1.09 | 5–9 | 7.57 | 1.59 | 5–12 | |||
| Gender | N | % | N% | % | N | % | |||||
|
Education |
|||||||||||
| Male | 19 | 42% | 24 | 46% | 16 | 59% | |||||
| N vs. BPD: t(95)=0.95 | 0.34 | ||||||||||
| Female | 26 | 58% | 28 | 54% | 11 | 41% | N vs. SPD: t(70)=0.47 | 0.64 | |||
| Psychoactive Meds | N | % | N | % | N | % | BPD vs. SPD: t(77)=0.38 | 0.71 | |||
| Never Medicated | - | - | - | 29 | 56% | 22 | 81% | ||||
| Previously Medicated | - | - | - | 23a | 44% | 5b | 19% | ||||
| Past MDD*** |
Gender |
||||||||||
| Gender | N | % | N | % | N | % | N vs. BPD: t(95)=0.79 | 0.43 | |||
| Male | - | - | 12 | 23 | 2 | 7 | N vs. SPD: t(70)=1.91 | 0.06 | |||
| Female | - | - | 14 | 27 | 3 | 11 | BPD vs. SPD:t(77)=1.25 | 0.21 | |||
Education = Highest Degree Earned: 1=no high school diploma; 2=GED; 3=high school diploma; 4=technical training; 5=some college,no degree; 6=associate degree; 7=bachelor’s degree; 8=master’s degree; 9=MD/PhD/JD/PharmD
Symptom Severity=Total of individual symptom ratings for each DSM-IV diagnostic criterion
MDD = Major Depressive Disorder; Past MDD was defined as prior episode occurring > two months from time of MRI scan
Of the 23 BPD patients who previously received psychoactive medications, 14 received antidepressants, 2 received antipsychotics,2 received benzodiazepines, 3 received stimulants, and 2 received mood stabilizers.
Of the 5 SPD patients who previously received psychoactive medications, 5 received antidepressants, 1 received an antipsychotic, and 2 received stimulants.
2.2 Imaging
MRI acquisition occurred on a 3-Tesla head-dedicated Siemens Allegra scanner. For high resolution structural images and accurate anatomical tracing of our regions of interest, all participants received T1-weighted MP-RAGE (Magnetization Prepared Rapid Gradient Echo) imaging (208 slices with slice thickness=0.82 mm, matrix size=256×256×208, FOV=21 cm, TR=2500 ms, TE=4.38 ms, TI=1100 ms and an 8° flip angle FLASH acquisition). Total imaging time was 20 minutes.
2.3 Brodmann Area and Amygdala Measurements
An analysis of the BAs of the frontal lobe was conducted on coronal MRI slices (Mitelman et al., 2005) using a digitized version of a histologically-based atlas (Perry et al, personal communication, 1991) that includes 33 coronal slice maps of BAs defined by microscopic examination of one post-mortem brain (Figure-1). Three trained researchers, without knowledge of participants’ diagnoses, outlined the amygdala on coronal MRI sections (Figure-2) using methods reported elsewhere (Haznedar et al., 2000). Our inter-tracer intraclass correlation coefficient for amygdala volume=0.82 (area measured on three slices at the 25th, 50th, and 75th percentiles of antero-posterior distance), in the mid-range of amygdala reliabilities ranging from 0.70 to 0.99 in the meta-analysis of Hajek et al. (2008). The amygdala is a difficult structure to trace, and some groups (Moriarty et al., 1997) have reported considerably lower ICC (0.47 on the right and 0.38 on the left). Low inter-rater reliabilities are associated with errors in tracing and tend to create Type II statistical error rather than creating spurious effects with Type I error.
Figure 1. Brodmann Area Regions of Interest.
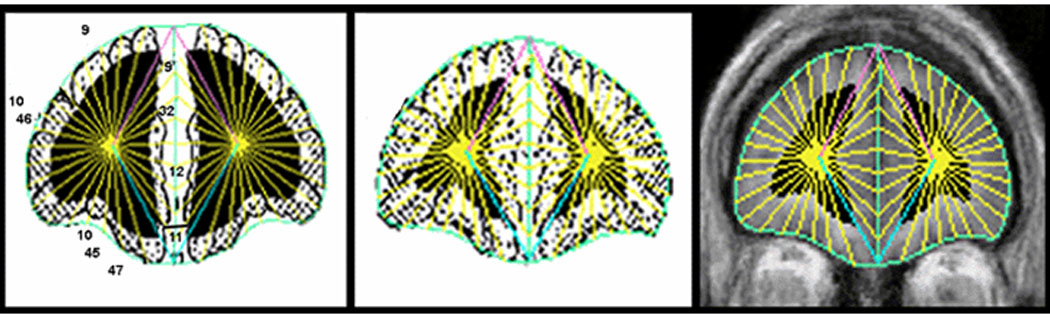
Left: Perry Atlas slice showing Brodmann Areas. Middle: BAs morphed to individual participant’s MRI at matching coronal slice level. Right: Gray and white matter and cerebrospinal fluid (CSF) within BAs delineated on individual MRI. Coronal slices perpendicular to the anterior commissure-posterior commissure line were divided into 20 radial sectors on each hemisphere surface and 10 midline sectors. BAs were then assessed for the gray and white matter pixels within all sectors identified in each BA. For quantification, the coronal images are segmented into gray matter, white matter, and CSF using cutoff values individually determined in each subject by examining the within-brain-edge histogram of axial MRI values as validated and assessed for reliability earlier (Mitelman et al., 2003,Mitelman et al., 2005). Every sector was assigned a BA according to the same radial sector division applied to Perry’s drawing of the BA margins. Volume measures were expressed in mm3 and obtained by computing relative size as the ratio of (area of ROI)/(volume of brain) × 1000. The Brodmann methods for our gray/white segmentation have been validated and the intraclass correlation coefficients for gray and white matter components for two tracers were 0.98 and 0.99. The detailed methodology and reliability description can be found in Mitelman et al. (2003,2005).
Figure 2. Amygdala Tracing Method.
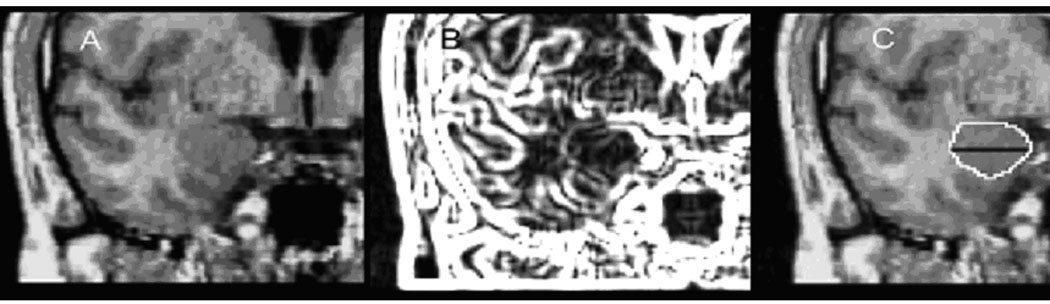
(A) Left: Coronal MRI: anterior-posterior dimension of amygdala. At this mid-section, the amygdaloid complex is roughly elliptical in shape, and anatomical margins are defined by the cornu ammonis and the white matter of gyrus ambiens in the medial aspect, the cornu inferius of the lateral ventricle in the ventral aspect, the temporal lobe white matter laterally, and the gyrus semilunaris in the dorsal aspect. (B) Middle: Using an edge contrast-enhancing technique (gradient filter) (Haznedar et al., 2000), we were able to better visualize the dentate gyrus of the hippocampus and boundaries between the hippocampus and the amygdala. Tracing procedure: the white line produced by the gradient filter is identified by mouse and the program finds the local maximum for the edge. Outlining of the amygdala began at its largest extent (approximately the center in the antero-posterior dimension) where clear boundaries between gray matter and surrounding white matter are visible and extended to anterior and anterior ends of the amygdaloid complex. The posterior portions of the amygdaloid complex were outlined by using the ventricular recess, hippocampus, and gyrus semilunaris as reference points. Anteriorly, the amygdaloid complex gray matter is more heterogeneous and hard to identify. We outlined from the midsection forward using gradient filtering and excluded the entorhinal cortex, which may include the inferior amygdala. The outlining ended at the first coronal MRI section on which there was visible white matter between the amygdala, ambiens, and white matter of the entorhinal cortex. This procedure may have omitted the very anterior end of the amygdaloid complex, but it had the advantage of excluding other extraneous structures from our analysis. (C) Right: Traced amygdala with division into dorsal and ventral regions. Employing methodology used previously by our group (New et al., 2007), we divided the amygdala into dorsal and ventral portions, based on the vertical distance on the mid-coronal slice. Volume measures for these amygdala regions were expressed in mm3 and relative to whole brain volume. Measurements were obtained by computing relative size as the ratio of (area of dorsal subregion)/(volume of brain) × 1000.
2.4 Statistical Methods
Our histological atlas program obtained data from the 15 BAs within the prefrontal cortex and cingulate gyrus identified by Perry (8–9–10–11–12, 23–24–25, 29, 31–32, 44–45–46–47). Subgroups of these variables developed on a theoretical and anatomical basis were entered into mixed-model multivariate analysis of variance (MANOVA) analyses.
To test for group differences, we conducted parallel 3-group analyses using a MANOVA with Diagnostic Group (healthy controls-vs.-SPD-vs.-BPD) as the between-group factor and all other factors were repeated measures or within-subjects. For the prefrontal cortex analysis, we used a Group × Region (anterior-orbital-dorsolateral) × BA (anterior:BA8-9-10; orbital:BA11-12-47, dorsolateral:BA44-45-46) × Hemisphere (left,right) × Matter type (gray,white) MANOVA. For the cingulate gyrus analysis, we employed a Group × BA within the cingulate arch (BA31-25-24-23-29) × Hemisphere (left, right) × Matter type (gray,white) MANOVA. For the temporal lobe analysis, we conducted a Group × Region (dorsal amygdala, ventral amygdala, BA41, BA42, BA22) × Hemisphere (left, right) MANOVA.
This approach of using multivariate statistics avoids Type I error associated with t-tests for each group contrast, area and hemisphere. We report the multivariate F (Wilks lambda) to adjust probabilities for repeated-measure effects with more than two levels. The dependent variables for these MANOVAs were expressed as relative volume of each of our regions of interest (ROI/whole brain volume). Our previous work shows that relative and absolute volume analyses produce similar findings (Mitelman et al., 2003) and relative volume measures are more conservative. However, we also examined whether there were any group differences in overall whole brain volume with a one-way ANOVA. Whole brain volume was calculated by adding gray and white matter volume for BAs within the four lobes (frontal:BA8-9-10-11-12-32-44-45-46-47; parietal:BA7-39-40; temporal:BA20-21-22-27-28-30-35-36-37-38-41-42; and occipital:BA17-18-19).
Correlational analyses were limited to frontal and temporal cortex regions where between-group differences in volume were significant. For each patient group, we used Pearson’s correlation coefficients to examine the association between STG volume and DSM-IV symptom severity with a significance level of p<0.05, two-tailed.
3. Results
3.1 Temporal Lobe
The MANOVA showed a significant Group × Temporal lobe region interaction, F(8,236)=2.27, p=0.02, Wilks (Figure-3). This interaction reflected a complex pattern indicating SPD patients had significantly smaller STG volume than healthy controls (Fisher LSD, p=0.01) and BPD patients (Fisher LSD, p=0.004) while the BPD group did not differ from controls (Figure-4). In BA42, the BPD group had significantly larger volume compared with healthy controls (Fisher LSD, p=0.03) while the SPD group was intermediate between the BPD and control groups. None of the other post-hoc tests reached significance, indicating that the groups did not differ in dorsal/ventral amgydala or BA41 volume. The main effect of group was not significant, indicating the three groups did not differ in overall temporal lobe volume (averaged over the five temporal lobe regions and hemisphere, p=0.28). None of the other interactions with group were significant, all p-values≥0.63.
Figure 3. Between-group differences in MRI volume.
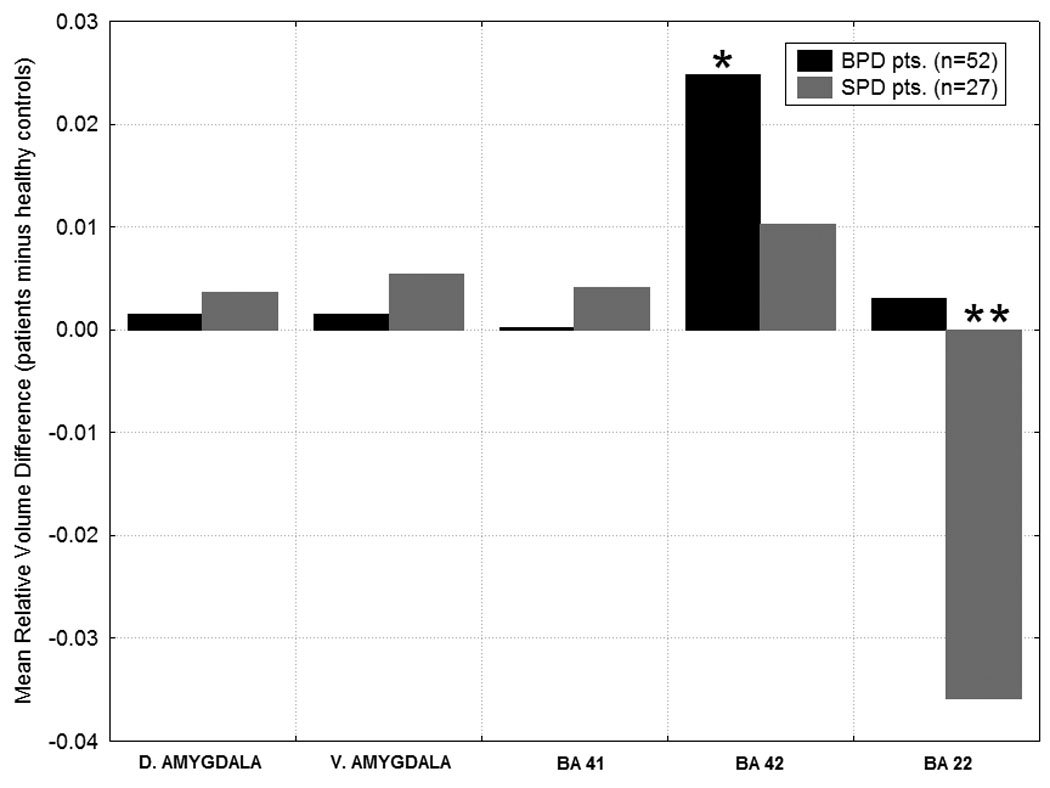
Differences from the healthy control group in temporal lobe regions are shown for the SPD and BPD groups. Group × Temporal lobe region interaction, F(8, 236)= 2.27, p=0.02, Wilks. Y-axis shows the mean volume difference scores for the patients minus the healthy controls. Volume for the temporal lobe regions is expressed as: (region-of-interest volume/total brain volume) × 1000.* In BA42, BPD>Healthy Controls, p=0.03, Fisher’s LSD test. ** In BA22, Healthy Controls>SPD, p=0.01, and BPD > SPD, p=0.004, Fisher’s LSD test.
Figure 4. Relative STG by Diagnosis.
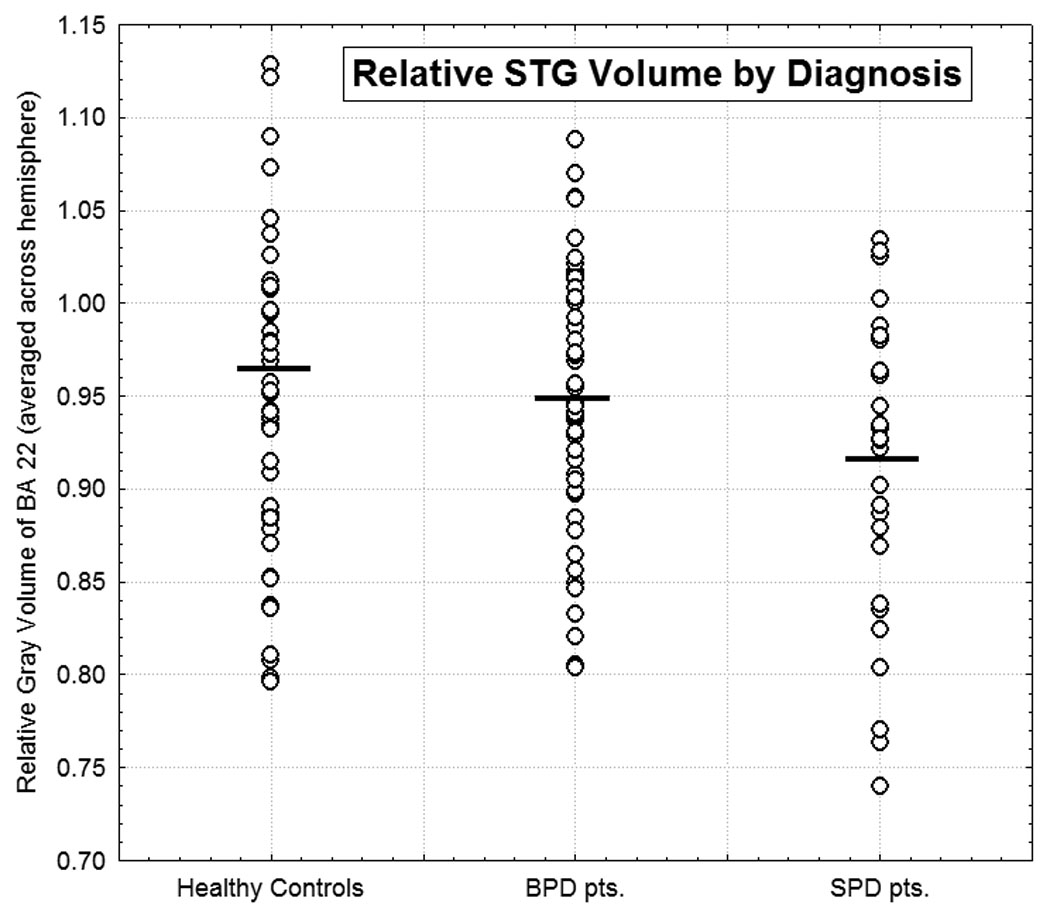
Scatterplot of individual values for relative STG volume averaged over left and right hemisphere for participants within each of the three diagnostic groups. The horizontal bars indicate the mean value for each respective group.
3.2 Two-Group Temporal Lobe Analyses
We followed-up our significant 3-group MANOVA with a series of 2-group MANOVAs which confirmed that the BPD-vs.-SPD and healthy control-vs.-SPD comparisons also showed significant Group × Temporal Lobe Region interactions (F(4,74)=3.81, p=.007 and F(4,67)=2.47, p=0.05, respectively), whereas the healthy controls-vs.-BPD comparison was not significant.
3.3 Cingulate Gyrus and Frontal Lobe
In our cingulate gyrus 3-group MANOVA, there was no main effect of group (p=0.62) and none of the interactions with group reached significance (all p-values≥0.25). However, in order to examine whether the current healthy control-vs.-SPD without BPD sample resembled our prior sample (Hazlett et al 2008), we conducted a 2-group MANOVA on the cingulate. This analysis showed a trend for a Group × BA interaction (F(4,67)=2.23, p=0.08, Wilks) and the cingulate pattern was similar to our prior finding of smaller BA24 in SPD. Along the same lines, in order to examine whether the current healthy control-vs.-BPD sample resembled our prior BPD sample (Hazlett et al 2005), we conducted a 2-group MANOVA. The Group × BA interaction did not reach significance (p=0.18).
In the prefrontal cortex MANOVA (Anterior (BA8, BA9, BA10), Orbital(BA11,BA12,BA47), Dorsolateral (BA44,BA45,BA46)), there was no main effect of group (p=0.36) and the interactions with group did not reach significance (all p-values≥0.10).
3.4 Whole-Brain Volume Analysis
The three groups did not differ in whole brain volume (Healthy controls: mean=1188±121 cm3); SPD patients: mean=1229±111 cm3; BPD patients: mean=1179±98 cm3) (main effect of group: F(2,121)=1.90, p=0.15).
3.5 Symptom Correlates
We examined symptom correlates in the SPD and BPD patient groups for all temporal cortex regions examined (BA22, BA41, BA42). Among the SPD patients, smaller gray matter volume in STG/BA22 was associated with greater overall clinical severity (r=-0.48, p=0.01) (Figure-5). Additionally, smaller STG volume was associated with greater odd speech (r=-0.49, p=0.01) among SPD patients. We did not find significant associations between BA41, BA42 and other SPD criteria, including cognitive/perceptual, paranoid and interpersonal relations symptoms.
Figure 5. Individual differences in superior temporal gyrus volume and symptom severity.
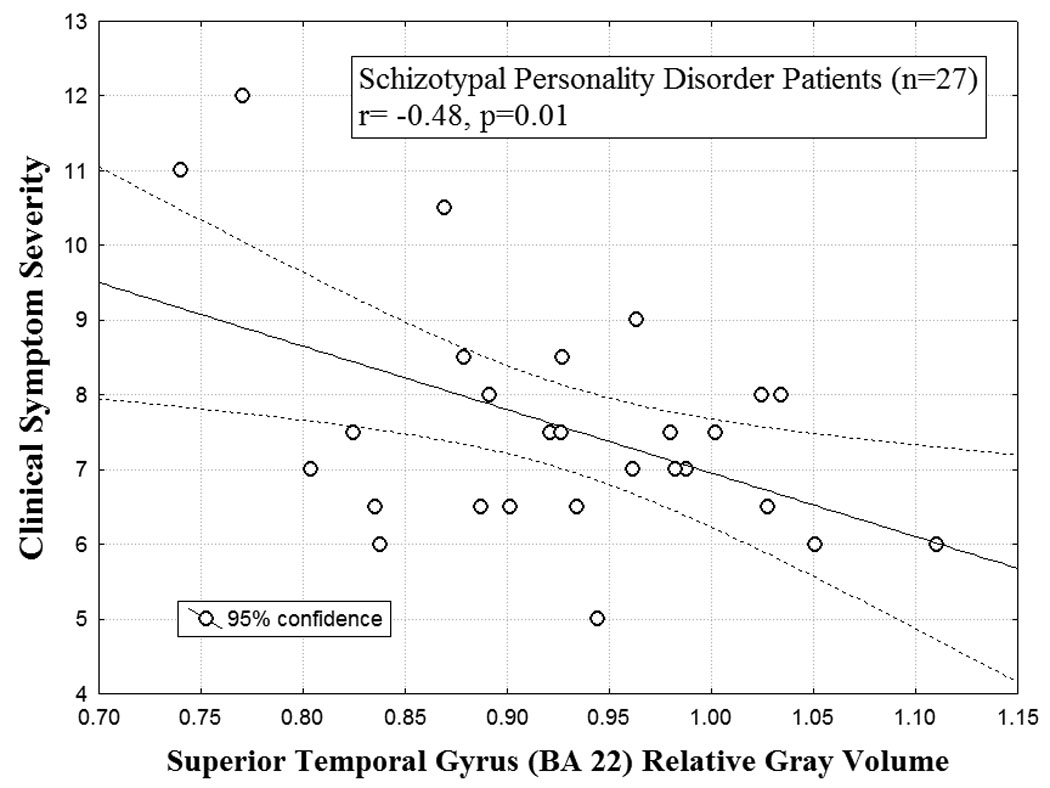
The scatterplot for the correlation between relative superior temporal gyrus volume (STG; Brodmann Area 22; averaged over left and right hemisphere) and clinical symptom severity (DSM-IV) scores for SPD patients is shown (r=-0.48, p=0.01). Among the SPD patients, smaller STG volume was associated with greater symptom severity. Each of the nine DSM-IV criteria for SPD were rated on a 4-point scale (0=absent, 0.5=somewhat present, 1.0=definitely present/prototypic, 2.0=severe, pervasive) and then totaled for the symptom severity score.
In the BPD group, the relationship between overall BPD clinical severity and BA22 volume was not significant nor was the relationship between overall clinical severity and both BA41 and BA42 volume.
3.6 Addressing Potential Confound of Prior Psychoactive Medication
The majority of patients in our study had never previously received psychoactive medication (Table-1). Those patients who were previously medicated were off all medication for a minimum of two weeks (five weeks for fluoxetine) prior to their MRI. In order to address whether prior medication use could explain our main findings in the temporal cortex, we repeated our 3-group analyses after removing the previously medicated five SPD and 23 BPD patients, and the pattern of results was the same as that observed with the entire sample. This 3-group MANOVA showed no significant main effect of Group, and the Group × Temporal lobe region interaction remained significant, F(8,180)=2.56, p=0.01. Follow-up post-hoc tests confirmed that the SPD group had significantly smaller STG volume than the healthy controls and BPD patients (Fisher’s LSD, p=0.005 and p≤0.001, respectively), while BPD patients did not differ from normal on STG volume. In BA42, the BPD group had significantly larger volume than healthy controls (Fisher LSD, p=0.04) but not SPD patients.
3.7 Addressing Potential Confound of Comorbid Past Major Depressive Disorder
To determine whether our main findings in the temporal cortex could be explained by the issue of past MDD comorbidity (occurring > two months prior to their MRI), we compared subgroups of BPD (n=26) and SPD (n=22) patients with no past MDD and all the healthy controls (n=45). Our temporal lobe findings were the same as that shown in the full sample. Specifically, the 3-group MANOVA showed no significant Group main effect and the Group × Temporal lobe region interaction remained significant, F(8,174)=2.70, p=0.008. Post-hoc tests confirmed that the SPD group had smaller STG volume compared with healthy controls (Fisher’s LSD, p=0.003) and BPD patients (Fisher’s LSD, p=0.001) while BPD patients did not differ from controls. Lastly, the BPD patients showed a trend towards significantly larger BA42 volume compared with healthy controls, (Fisher’s LSD, p=0.07) but exhibited no significant difference in BA42 volume from the SPD group.
4. Discussion
To our knowledge, this is the first morphometric study to compare volume of frontal cortex, temporal cortex and amygdala volume in SPD and BPD patients to determine which regions are important in differentiating these two disorders. This is the first study to report that (a) smaller-than-normal STG volume is specific to SPD and not found in BPD and (b) smaller STG volume in SPD is associated with greater overall symptom severity. Our finding of reduced STG volume in SPD compared with both healthy controls and BPD patients remained significant even when we controlled for history of prior psychoactive medication and comorbid MDD, suggesting it is not due to these factors. Our STG finding is consistent with previous reports of reduced STG volume in SPD compared with healthy individuals (Buchsbaum et al., 1997; Dickey et al., 1999; Hazlett et al., 2008; Kawasaki et al., 2004; Takahashi et al., 2006). Consistent with the work of Dickey et al. (2003), we also found that smaller STG volume in SPD was associated with greater odd speech. Lastly, BA42 volume was significantly larger in BPD patients compared with healthy controls, and between-group differences in the other temporal lobe regions included in our analysis (BA41 and dorsal/ventral amygdala) were not significant.
From a functional perspective, prior work indicates that STG/BA22 has wide connections to the hippocampus-amygdala complex, cortical association areas in the frontal and parietal lobe and the thalamus, and it has been proposed that this part of the temporal cortex is involved in higher-order auditory perception (Binder et al., 1994; Engelien et al., 1995; Rajarethinam et al., 2000; Pandya, 1995). This includes phonemic discrimination and processing, the fusing of multiple sound features and analysis of temporal acoustic features of speech. Additionally, lesioning of this region produces receptive aphasia and deficits in comprehension of verbal language (Demonet et al., 2005). Considered together with these anatomical findings, the posterior STG localization of our results in both patient groups fits well with work showing that both SPD and BPD individuals exhibit auditory information processing deficits that are similar to one another, as measured by P300 auditory evoked potentials (Kutcher et al., 1989).
As such, our finding demonstrates that volumetric abnormalities in BA22 are unique to SPD and may be an important tool for differential diagnosis between these two disorders. Although it is still unclear how abnormalities in this region can affect auditory processing, it would be worthwhile to investigate the relationship between alterations in BA22 volume and socially-related functions since auditory processing plays a crucial role in social function and may be one way to distinguish between the groups clinically. For example, BA22 is located on the caudal two-thirds of the STG, an area that Gallagher and Frith (2003) found to be activated during “mentalizing” tasks involving interpretation of mental states of others. Thus, our finding may help differentiate between “mentalizing” deficits experienced by both patient groups.
The finding of reduced gray matter volume in BA22 is the most widely-replicated finding in schizophrenia (reviewed by Shenton et al., 2001). Therefore, our finding of reduced STG volume in SPD provides additional evidence for the similarity between SPD and schizophrenia patients. Our prior work showed a schizophrenia spectrum pattern for reduced STG volume with schizophrenia patients exhibiting the largest reduction compared with healthy controls, and SPD patients intermediate (Hazlett et al., 2008). This observation is consistent with prior work indicating that individuals with SPD share a broad range of similarities with schizophrenia patients in terms of genetics and neurobiology (Siever and Davis, 2004).
Our other interesting finding is that, among the SPD patients, smaller relative BA22 gray matter volume was associated with greater overall clinical (DSM) symptom severity, including greater impairment due to odd thinking and speech. These results are consistent with clinical correlates previously reported by Dickey et al. (2003) and provide further evidence that STG abnormalities may underlie the pathophysiology of SPD. A better understanding of the relationship between structural and functional abnormalities in this key language processing area and psychopathology should be a top priority for future work.
We also found larger-than-normal BA42 gray matter volume in BPD patients. This area makes up part of the primary auditory cortex and lies in Heschl’s gyrus, a region shown to be involved in sensory auditory processing. As of April 2009, there were no publications reporting morphology of BA42 in BPD patients but it is possible that increased volume or alterations in this region reflect some type of compensatory mechanism for other dysfunctional regions involved in auditory-processing demands. In previous work, BA42 volume was found to be smaller in males with SPD compared with controls (Dickey et al., 2002a). Even though BA42 makes up only a portion of Heschl’s gyrus and other work has shown preserved volume of this region in SPD (Takahashi et al., 2006), it is important to note possible reasons for discrepancies between our failure to find healthy control-SPD differences in BA42 volume and findings of reduced left Heschl’s gyrus gray matter volume by Dickey et al. (2002a). Differences may be due to heterogeneity of sample characteristics and symptom severity, methodological techniques, normal variations in the distribution of auditory cortex (Dickey et al., 2008) or medication differences. Understanding both structural and functional abnormalities in this region in BPD and SPD patients should remain a goal for future work such that measures of temporal lobe integrity may ultimately help us predict which patients will respond to different treatments.
For the amygdala, a temporal lobe region shown to have dense interconnections with the STG, no significant group differences were detected. Although some studies have shown smaller amygdala volume in BPD compared with healthy controls (Driessen et al., 2000; Rusch et al., 2003; Schmahl et al., 2003; Tebartz et al., 2003), we (New et al., 2007) and others (Brambilla et al., 2004) have found no groups differences. Perhaps amygdala abnormalities in BPD may be more functional than structural. The issue of amygdala volume requires further investigation.
Our frontal lobe analyses were not statistically significant, indicating the three groups did not differ in anterior-orbital-dorsolateral or cingulate gyrus gray matter volume. These prefrontal cortex results are consistent with our previous findings and other observations showing prefrontal volumes largely preserved in SPD in contrast to widespread prefrontal reductions in schizophrenia (Buchsbaum et al., 2002; Suzuki et al., 2005). Contrary to our hypothesis, neither patient group showed significantly smaller ACC volume compared with healthy controls. We previously reported significantly reduced cingulate (BA24, 31, 23) gray matter volume in a sample of 79 patients meeting DSM criteria for SPD compared with healthy controls (Hazlett et al., 2008). However, it should be noted that in our prior study, the SPD group may have had comorbid BPD; this was not examined because the SPD group was compared with schizophrenia patients. We have also previously shown that, compared with healthy controls, individuals with a diagnosis of both SPD and BPD exhibit greater BA24 reduction than those with only BPD (Hazlett et al., 2005). In contrast, our current sample included SPD patients without BPD. Thus, patient sample characteristics such as SPD-BPD comorbidity appear to play an important role in anterior cingulate volume abnormalities and may explain discrepancies across studies.
In the prefrontal cortex, the BPD patients showed no significant gray matter volume difference which is consistent with previous work by our group and others (Hazlett et al., 2005; Rusch et al., 2003). Nonetheless, as mentioned above, the current study did not replicate our previous findings of normal-BPD differences in anterior cingulate gray volume (Hazlett et al., 2005) which has also been reported by Tebartz van Elst et al (2003). This inconsistency may be due to sample differences in clinical symptom characteristics and severity (e.g., 50% of current sample had past history of MDD versus 76% of Hazlett et al 2005 sample).
To the best of our knowledge, this is the first volumetric study to compare SPD patients with BPD patients and healthy controls. Although all patients were unmedicated at the time of their MRI, a unique feature of the study since many MRI studies to date examine medicated patients, a primary limitation is that some had previously received psychoactive medications. However, it is important to note that when we controlled for prior medication history, our finding of smaller STG volume in SPD compared with healthy controls and BPD patients remained significant. A second limitation is that, due to power considerations, we did not include participants with a comorbid diagnosis of both BPD and SPD. This is an important group to include in future studies. Additionally, given the common comorbidity between BPD and MDD, half of the BPD patients in our study met criteria for past MDD, although it was required to be in full remission for at least two months prior to their scan. It is imperative that future BPD studies recruit large enough sample sizes so that individuals with and without past MDD can be compared. As such, it is important to note that our finding of smaller-than-normal STG volume in SPD remained significant when we controlled for past MDD (only 18% of the SPD patients had past MDD). Also, although our diagnostic groups were matched on age and gender, it is possible that gender differences exist between groups in morphometry. Unfortunately, given our current sample size, we were unable to examine whether gender effects play a role in our STG findings. Future MRI studies with larger sample sizes will allow a much-needed examination of gender effects in SPD and BPD. Lastly, we do not have family history records for our patients. It would be worthwhile to know how many SPD and BPD patients have a first-degree relative in the schizophrenia spectrum and/or bipolar spectrum and whether there is overlap in family history. Nevertheless, our STG findings suggest that future work addressing the genetic link between reduced STG volume and schizophrenia-spectrum disorders may be fruitful.
Our results showed that SPD individuals exhibit abnormalities in STG volume that are not evidenced in BPD patients, supporting the hypothesis that they are two separate disorders. Of note, neither previous use of psychoactive medications nor past history of MDD explained smaller STG in SPD patients. Our findings are consistent with the concept that SPD is in the schizophrenia spectrum. STG volumetric abnormalities may serve as important biological markers or endophenotypes which may ultimately help diagnose and/or predict treatment response in schizophrenia-spectrum illnesses.
Acknowledgement
This work was supported in part by NIMH grants MH073911 to Dr. Hazlett, MH067918 to Dr. New, and VA MERIT grant 7609-28 to Dr. Siever. Other support came from Grant Number M01- Patient Care RR00071 from the National Center for Research Resources (NCRR).
Role of the funding source
The formulation of this manuscript has had full support of the study sponsors recognized in the acknowledgments. No interference has been made by them in the study design; collection, analysis, and interpretation of data; and our sponsors served no role in the writing the report; or in the decision to submit the paper for publication.
Footnotes
Publisher's Disclaimer: This is a PDF file of an unedited manuscript that has been accepted for publication. As a service to our customers we are providing this early version of the manuscript. The manuscript will undergo copyediting, typesetting, and review of the resulting proof before it is published in its final citable form. Please note that during the production process errors may be discovered which could affect the content, and all legal disclaimers that apply to the journal pertain.
There are no conflicts of interest for any of the authors.
References
- 1.Barbas H. Specialized Elements of Orbitofrontal Cortex in Primates. Vol. 1121. Annals of the New York Academy of Sciences; 2007. pp. 10–32. [DOI] [PubMed] [Google Scholar]
- 2.Binder JR, Rao SM, Hammeke TA, Yetkin FZ, Jesmanowicz A, Bandettini PA, Wong EC, Etskowski LD, Goldstein MD, Haughton VM, Hyde JS. Functional magnetic resonance imaging of human auditory cortex. Annals of Neurology. 1994;35:662–672. doi: 10.1002/ana.410350606. [DOI] [PubMed] [Google Scholar]
- 3.Binder J, Frost J, Hammeke T, Bellgowan PS, Springer JA, Kaufman JN, Possing ET. Human temporal lobe activation by speech and nonspeech sounds. Cerebral Cortex. 2000;10:512–528. doi: 10.1093/cercor/10.5.512. [DOI] [PubMed] [Google Scholar]
- 4.Brambilla P, Soloff PH, Sala M, Nicoletti MA, Keshavan MS, Soares JC. Anatomical MRI study of borderline personality disorder patients. Psychiatry Research. 2004;131:125–133. doi: 10.1016/j.pscychresns.2004.04.003. [DOI] [PubMed] [Google Scholar]
- 5.Buchsbaum MS, Nenadic I, Hazlett EA, Spiegel-Cohen J, Fleischman MB, Akhavan A, Silverman JM, Siever LJ. Differential metabolic rates in prefrontal and temporal Brodmann areas in schizophrenia and schizotypal personality disorder. Schizophrenia Research. 2002;54:141–150. doi: 10.1016/s0920-9964(01)00361-9. [DOI] [PubMed] [Google Scholar]
- 6.Buchsbaum M, Yang S, Hazlett E, Siegel B, Germans M, Haznedar M, O'Flaithbheartaigh S, Wei T, Siever L. Ventricular volume and asymmetry in schizotypal personality disorder and schizophrenia assessed with magnetic resonance imaging. Schizophrenia Research. 1997;27:45–53. doi: 10.1016/S0920-9964(97)00087-X. [DOI] [PubMed] [Google Scholar]
- 7.Chanen AM, Velakoulis D, Carison K, Gaunson K, Wood SJ, Yuen HP, Yucel M, Jackson HJ, McGorry PD, Pantelis C. Orbitofrontal, amygdala and hippocampal volumes in teenagers with first-presentation borderline personality disorder. Psychiatry Research. 2008;163:116–125. doi: 10.1016/j.pscychresns.2007.08.007. [DOI] [PubMed] [Google Scholar]
- 8.Demonet JF, Thierry G, Cardebat D. Renewal of the neurophysiology of language: functional neuroimaging. Psychological Reviews. 2005;85:49–95. doi: 10.1152/physrev.00049.2003. [DOI] [PubMed] [Google Scholar]
- 9.Dickey CC, McCarley RW, Shenton ME. The brain in schizotypal personality disorder: a review of structural MRI and CT findings. Harvard Review of Psychiatry. 2002b;10:1–15. doi: 10.1080/10673220216201. [DOI] [PMC free article] [PubMed] [Google Scholar]
- 10.Dickey CC, McCarley RW, Voglmaier MM. An MRI study of superior temporal gyrus volume in women with schizotypal personality disorder. The American Journal of Psychiatry. 2003;160:2198–2201. doi: 10.1176/appi.ajp.160.12.2198. [DOI] [PMC free article] [PubMed] [Google Scholar]
- 11.Dickey CC, McCarley RW, Voglmaier MM, Frumin M, Niznikiewicz MA, Hirayasu Y, Fraone S, Seidman LJ, Shenton ME. Smaller left Heschl's gyrus volume in patients with schizotypal personality disorder. The American Journal of Psychiatry. 2002a;159:1521–1527. doi: 10.1176/appi.ajp.159.9.1521. [DOI] [PMC free article] [PubMed] [Google Scholar]
- 12.Dickey CC, McCarley RW, Voglmaier MM, Niznikiewicz MA, Seidman LJ, Hirayasu Y, Fischer I, Teh EK, Van Rhoads R, Jakab M, Kikinis R, Jolesz FA, Shenton ME. Schizotypal personality disorder and MRI abnormalities of temporal lobe gray matter. Biological Psychiatry. 1999;45:1393–1402. doi: 10.1016/s0006-3223(99)00030-x. [DOI] [PMC free article] [PubMed] [Google Scholar]
- 13.Dickey CC, McCarley RW, Xu ML, Seidman LJ, Voglmaier MM, Niznikiewicz MA, Connor E, Shenton ME. MRI abnormalities of the hippocampus and cavum septi pellucidi in females with schizotypal personality disorder. Schizophrenia Research. 2007;89:49–58. doi: 10.1016/j.schres.2006.08.004. [DOI] [PMC free article] [PubMed] [Google Scholar]
- 14.Dickey CC, Morocz IA, Niznikiewicz MA, Voglmaier M, Toner S, Khan U, Dreusicke M, Yoo SS, Shenton M, McCarley RW. Auditory processing abnormalities in schizotypal personality disorder: An fMRI experiment using tones of deviant pitch and duration. Schizophrenia Research. 2008;103:26–39. doi: 10.1016/j.schres.2008.04.041. [DOI] [PMC free article] [PubMed] [Google Scholar]
- 15.Downhill JE, Buchsbaum MS, Hazlett EA, Barth S, Lees Roitman S, Nunn M, Lekarev O, Wei T, Shihabuddin L, Mitropoulou V, Silverman J, Siever LJ. Temporal lobe volume determined by magnetic resonance imaging in schizotypal personality disorder and schizophrenia. Schizophrenia Research. 2001;48:187–199. doi: 10.1016/s0920-9964(00)00131-6. [DOI] [PubMed] [Google Scholar]
- 16.Driessen M, Herrmann J, Stahl K, Zwaan M, Meier S, Hill A, Osterheider M, Petersen D. Magnetic resonance imaging volumes of the hippocampus and the amygdala in women with borderline personality disorder and early traumatization. Archives of General Psychiatry. 2000;57:1115–1122. doi: 10.1001/archpsyc.57.12.1115. [DOI] [PubMed] [Google Scholar]
- 17.Engelien A, Silbersweig D, Stern E, Huber W, Doring W, Frith C, Frackowiak RSJ. The functional anatomy of recovery from auditory agnosia: a PET study of sound categorization in a neurological patient and normal controls. Brain. 1995;118:1395–1409. doi: 10.1093/brain/118.6.1395. [DOI] [PubMed] [Google Scholar]
- 18.Fanous A, Gardner C, Walsh D, Kendler KS. Relationship between positive and negative symptoms of schizophrenia and schizotypal symptoms in nonpsychoatic relatives. Archives of General Psychiatry. 2001;58:669–673. doi: 10.1001/archpsyc.58.7.669. [DOI] [PubMed] [Google Scholar]
- 19.First M, Spitzer R, Gibbon M, Williams J. Structured Clinical Interview for Axis I Disorders-Patient Edition. New York: Biometrics Research, New York State Psychiatric Institute; 1996. [Google Scholar]
- 20.Gallagher HL, Frith CD. Functional imaging of “theory of mind”. Trends in Cognitive Sciences. 2003;7:77–83. doi: 10.1016/s1364-6613(02)00025-6. [DOI] [PubMed] [Google Scholar]
- 21.Gunderson JG, Singer MT. Defining borderline patients: an overview. The American Journal of Psychiatry. 1975;132:1–10. doi: 10.1176/ajp.132.1.1. [DOI] [PubMed] [Google Scholar]
- 22.Hajek T, Kopecek M, Kozeny J, Gunde E, Alda M, Höschl C. Amygdala volumes in mood disorders – Meta-analysis of magnetic resonance volumetry studies. Journal of Affective Disorders. doi: 10.1016/j.jad.2008.10.007. [In Press] [DOI] [PubMed] [Google Scholar]
- 23.Hazlett EA, Buchsbaum MS, Haznedar MM, Newmark R, Goldstein KE, Zelmanova Y, Glanton CF, Torosjan Y, New AS, Lo JN, Mitropoulou V, Siever LJ. Cortical gray and white matter volume in unmedicated schizotypal and schizophrenia patients. Schizophrenia Research. 2008;101:111–123. doi: 10.1016/j.schres.2007.12.472. [DOI] [PMC free article] [PubMed] [Google Scholar]
- 24.Hazlett EA, New AS, Newmark R, Haznedar MM, Lo JN, Speiser LJ, Chen AD, Mitropoulou V, Minzenberg M, Siever LJ, Buchsbaum MS. Reduced Anterior and Posterior Cingulate Gray Matter in Borderline Personality Disorder. Biological Psychiatry. 2005;58:614–623. doi: 10.1016/j.biopsych.2005.04.029. [DOI] [PubMed] [Google Scholar]
- 25.Haznedar MM, Buchsbaum MS, Hazlett EA, Shihabuddin L, New A, Siever LJ. Cingulate gyrus volume and metabolism in the schizophrenia spectrum. Schizophrenia Research. 2004;71:249–262. doi: 10.1016/j.schres.2004.02.025. [DOI] [PubMed] [Google Scholar]
- 26.Haznedar MM, Buchsbaum MS, Wei TC, Hof PR, Cartwright C, Bienstock CA, Hollander E. Limbic circuitry in patients with autism spectrum disorders studied with positron emission tomography and magnetic resonance imaging. The American Journal of Psychiatry. 2000;157:1994–2001. doi: 10.1176/appi.ajp.157.12.1994. [DOI] [PubMed] [Google Scholar]
- 27.Irle E, Lange C, Sachsse U. Reduced size and abnormal asymmetry of parietal cortex in women with borderline personality disorder. Biological Psychiatry. 2005;57:173–182. doi: 10.1016/j.biopsych.2004.10.004. [DOI] [PubMed] [Google Scholar]
- 28.Joanisse MF, Gati JS. Overlapping neural regions for processing rapid temporal cues in speech and nonspeech signals. Neuroimage. 2003;19:64–79. doi: 10.1016/s1053-8119(03)00046-6. [DOI] [PubMed] [Google Scholar]
- 29.Kawasaki Y, Suzuki M, Nohara S, Hagino H, Takahashi T, Matsui M, Yamashita I, Chitnis XA, McGuire PK, Seto H, Kurachi M. Structural brain differences in patients with schizophrenia and schizotypal disorder demonstrated by voxel-based morphometry. European Archives of Psychiatry and Clinical Neuroscience. 2004;254:406–414. doi: 10.1007/s00406-004-0522-1. [DOI] [PubMed] [Google Scholar]
- 30.Kendler KS. The Genetics of Schizophrenia: Chromosomal Deletions, Attentional Disturbances, and Spectrum Boundaries. The American Journal of Psychiatry. 2003;160:1549–1553. doi: 10.1176/appi.ajp.160.9.1549. [DOI] [PubMed] [Google Scholar]
- 31.Kendler KS. Schizophrenia? genetics and dysbindin: a corner turned? American Journal of Psychiatry. 2004;161:1533–1536. doi: 10.1176/appi.ajp.161.9.1533. [DOI] [PubMed] [Google Scholar]
- 32.Kendler KS, Aggen SH, Czajkowski N, Roysamb E, Tambs K, Torgersen S, Neale MC, Reichborn-Kjennerud T. The structure of genetic and environmental risk factors for DSM-IV personality disorders: a multivariate twin study. Archives of General Psychiatry. 2008;65:1438–1446. doi: 10.1001/archpsyc.65.12.1438. [DOI] [PMC free article] [PubMed] [Google Scholar]
- 33.Kernberg O. P. Hartocollis, Editor, in Borderline Personality Disorders: the Concept, the Syndrome, the Patient. New York: International Universities Press, Inc; 1977. The structural diagnosis of borderline personality organization, In; pp. 87–121. [Google Scholar]
- 34.Kim H, Somerville LH, Johnstone T, Alexander AL, Whalen PJ. Inverse amygdala and medial prefrontal cortex responses to surprised faces. Neuroreport. 2003;14:2317–2322. doi: 10.1097/00001756-200312190-00006. [DOI] [PubMed] [Google Scholar]
- 35.Kirrane RM, Siever LJ. New perspectives on schizotypal personality disorder. Current Psychiatry Reports. 2000;2:62–66. doi: 10.1007/s11920-000-0044-0. [DOI] [PubMed] [Google Scholar]
- 36.Kutcher SP, Blackwood DHR, Gaskell DF, Muir WJ, St. Clair DM. Auditory P300 does not differentiate borderline personality disorder from schiztypal personality disorder. Biological Psychiatry. 1989;26:766–774. doi: 10.1016/0006-3223(89)90117-0. [DOI] [PubMed] [Google Scholar]
- 37.Lyoo IK, Han MH, Cho DY. A brain MRI study in subjects with borderline personality disorder. Journal of Affective Disorders. 1998;50:235–243. doi: 10.1016/s0165-0327(98)00104-9. [DOI] [PubMed] [Google Scholar]
- 38.McCloskey MS, Phan KL, Coccaro EF. Neuroimaging and Personality Disorders. Current Psychiatry Reports. 2005;7:65–72. doi: 10.1007/s11920-005-0027-2. [DOI] [PubMed] [Google Scholar]
- 39.Melartin TK, Rytsälä HJ, Leskelä US, Lestelä-Mielonen PS, Sokero TP, Isometsä ET. Current comorbidity of psychiatric disorders among DSM-IV major depressive disorder patients in psychiatric care in the Vantaa Depression Study. 2002;63:126–134. [PubMed] [Google Scholar]
- 40.Mitelman SA, Buchsbaum MS, Brickman AM, Shihabuddin L. Cortical intercorrelations of frontal area volumes in schizophrenia. NeuroImage. 2005;27:753–770. doi: 10.1016/j.neuroimage.2005.05.024. [DOI] [PubMed] [Google Scholar]
- 41.Mitelman S, Shihabuddin L, Brickman A, Hazlett E, Buchsbaum MS. MRI assessment of gray and white matter distribution in Brodmann areas of the cortex in patients with schizophrenia with good and poor outcomes. The American Journal of Psychiatry. 2003;160:2154–2168. doi: 10.1176/appi.ajp.160.12.2154. [DOI] [PubMed] [Google Scholar]
- 42.Moriarty J, Varma AR, Stevens J, Fish M, Trimble MR, Robertson MM. A volumetric MRI study of Gilles de la Tourette’s syndrome. Neurology. 1997;49:410–415. doi: 10.1212/wnl.49.2.410. [DOI] [PubMed] [Google Scholar]
- 43.New AS, Hazlett EA, Buchsbaum MS, Goodman M, Mitelman SA, Newmark R, Trisdorfer R, Haznedar MM, Koenigsberg HW, Flory J, Siever LJ. Amygdala-prefrontal disconnection in borderline personality disorder. Neuropsychopharmacology. 2007;32:1629. doi: 10.1038/sj.npp.1301283. [DOI] [PubMed] [Google Scholar]
- 44.Pandya DN. Anatomy of the auditory cortex. Revue neurologique. 1995;151:486–494. [PubMed] [Google Scholar]
- 45.Pfohl B, Blum N, Zimmerman M. Structured Clinical Interview for DSM-IV Personality (SIDP-IV) Washington, D.C: American Psychiatric Press; 1997. [Google Scholar]
- 46.Price J. Definition of the orbital cortex in relation to specific connections with limbic and visceral structures, and other cortical regions. Annals of the New York Academy of Sciences. 2007;1121:54–71. doi: 10.1196/annals.1401.008. [DOI] [PubMed] [Google Scholar]
- 47.Rajarethinam RP, DeQuardo JR, Nalepa R, Tandon R. Superior temporal gyrus in schizophrenia: a volumetric magnetic resonance imaging study. Schizoprenia Research. 2000;41:303–312. doi: 10.1016/s0920-9964(99)00083-3. [DOI] [PubMed] [Google Scholar]
- 48.Rosenthal D, Wender PH, Kety SS, Welner J, Schulsinger F. The adopted-away offspring of schizophrenics. The American Journal of Psychiatry. 1971;128:307–311. doi: 10.1176/ajp.128.3.307. [DOI] [PubMed] [Google Scholar]
- 49.Rusch N, Tebartz van Elst L, Ludaescher P, Wilke M, Huppertz HJ, Thiel T, Schmahl C, Bohus M, Lieb K, Hesslinger B, Hennig J, Ebert D. A voxel-based morphometric MRI study in female patients with borderline personality disorder. Neuroimage. 2003;20:385–392. doi: 10.1016/s1053-8119(03)00297-0. [DOI] [PubMed] [Google Scholar]
- 50.Schmahl CG, Vermetten E, Elzinga BM, Douglas Bremner J. Magnetic resonance imaging of hippocampal and amygdala volume in women with childhood abuse and borderline personality disorder. Psychiatry Research. 2003;122:193–198. doi: 10.1016/s0925-4927(03)00023-4. [DOI] [PubMed] [Google Scholar]
- 51.Shenton ME, Dickey CC, Frumin M, McCarley RW. A review of MRI findings in schizophrenia. Schizophrenia Research. 2001;49:1–52. doi: 10.1016/s0920-9964(01)00163-3. [DOI] [PMC free article] [PubMed] [Google Scholar]
- 52.Siever LJ, Davis KL. The pathophysiology of schizophrenia disorders: perspectives from the spectrum. American Journal of Psychiatry. 2004;161:398–413. doi: 10.1176/appi.ajp.161.3.398. [DOI] [PubMed] [Google Scholar]
- 53.Skodol AE, Siever LJ, Livesley WJ, Gunderson JG, Pfohl B, Widiger TA. The borderline diagnosis II: biology, genetics, and clinical course. Biological Psychiatry. 2002;51:951–963. doi: 10.1016/s0006-3223(02)01325-2. [DOI] [PubMed] [Google Scholar]
- 54.Soloff P, Nutche J, Goradia D, Diwadkar V. Structural brain abnormalities in borderline personality disorder: A voxel-based morphometry study. Psychiatry Research. 2008;164:223–236. doi: 10.1016/j.pscychresns.2008.02.003. [DOI] [PMC free article] [PubMed] [Google Scholar]
- 55.Spitzer RL, Endicott J, Gibbon M. Crossing the border into borderline personality and borderline schizophrenia. Archives of General Psychiatry. 1979;36:17–24. doi: 10.1001/archpsyc.1979.01780010023001. [DOI] [PubMed] [Google Scholar]
- 56.Suzuki M, Zhou SY, Takahashi T, Hagino H, Kawasaki Y, Niu L, Matsui M, Seto H, Kurachi M. Differential contributions of prefrontal and temporolimbic pathology to mechanisms of psychosis. Brain. 2005;128:2109–2122. doi: 10.1093/brain/awh554. [DOI] [PubMed] [Google Scholar]
- 57.Takahashi T, Suzuki M, Zhou SY, Hagino H, Kawasaki Y, Yamashita I, Nohara S, Nakamura K, Seto H, Kurachi M. Lack of normal gender differences of the perigenual cingulate gyrus in schizophrenia spectrum disorders. A magnetic resonance imaging study. European Archives of Psychiatry and Clinical Neuroscience. 2004;254:273–280. doi: 10.1007/s00406-004-0491-4. [DOI] [PubMed] [Google Scholar]
- 58.Takahashi T, Suzuki M, Zhou SY, Tanino R, Hagino H, Kawasaki Y, Matsui M, Seto H, Kurachi M. Morphologic alterations of the parcellated superior temporal gyrus in schizophrenia spectrum. Schizophrenia Research. 2006;83:131–143. doi: 10.1016/j.schres.2006.01.016. [DOI] [PubMed] [Google Scholar]
- 59.Tebartz van Elst L, Hesslinger B, Thiel T, Geiger E, Haegele K, Lemieux L, Lieb K, Bohus M, Hennig J, Ebert D. Frontolimbic brain abnormalities in patients with borderline personality disorder: a volumetric magnetic resonance imaging study. Biological Psychiatry. 2003;54:163–171. doi: 10.1016/s0006-3223(02)01743-2. [DOI] [PubMed] [Google Scholar]
- 60.Whalen PJ, Shin LM, McInerney SC, Fischer H, Wright CI, Rauch SL. A functional MRI study of human amygdala responses to facial expressions of fear versus anger. Emotion. 2001;1:70–83. doi: 10.1037/1528-3542.1.1.70. [DOI] [PubMed] [Google Scholar]
- 61.White CN, Gunderson JG, Zanarini MC, Hudson JI. Family studies of borderline personality disorder: a review. Harvard Review of Psychiatry. 2003;11:8–19. doi: 10.1080/10673220303937. [DOI] [PubMed] [Google Scholar]
- 62.Wible CG, Kubicki M, Yoo SS, Kacher DF, Salisbury DF, Anderson MC, Shenton ME, Hirayasu Y, Kikinis R, Jolesz FA, McCarley RW. A functional magnetic resonance imaging study of auditory mismatch in schizophrenia. American Journal of Psychiatry. 2001;158 doi: 10.1176/appi.ajp.158.6.938. 938–943.52. [DOI] [PMC free article] [PubMed] [Google Scholar]
- 63.Zanarini MC, Frankenburg FR, Dubo ED, Sickel AE, Trikha A, Levin A, Reynolds V. Axis II comorbidity of borderline personality disorder. Comprehensive Psychiatry. 1998;39:296–302. doi: 10.1016/s0010-440x(98)90038-4. [DOI] [PubMed] [Google Scholar]
- 64.Zetzsche T, Preuss UW, Frodl T, Schmitt G, Seifert D, Munchhausen E, Tabrizi S, Leinsinger G, Born C, Reiser M, Moller H, Meisenzahl E. Hippocampal volume reduction and history of aggressive behavior in patients with borderline personality disorder. Psychiatry Research: Neuroimaging. 2007;154:157–170. doi: 10.1016/j.pscychresns.2006.05.010. [DOI] [PubMed] [Google Scholar]