

Summary
Mitochondria-associated ER membranes or MAMs define the sites of endoplasmic reticulum/mitochondria juxtaposition that control Ca2+ flux between these organelles. We found that in a mouse model of the human lysosomal storage disease GM1-gangliosidosis, GM1-ganglioside accumulates in the glycosphingolipid-enriched microdomain (GEM) fractions of MAMs, where it interacts with the phosphorylated form of IP3 receptor-1, influencing the activity of this channel. Ca2+ depleted from the ER is then taken up by the mitochondria, leading to Ca2+ overload in this organelle. The latter induces mitochondrial membrane permeabilization (MMP), opening of the permeability transition pore and activation of the mitochondrial apoptotic pathway. This study identifies the GEMs as the sites of Ca2+ diffusion between the ER and the mitochondria. We propose a new mechanism of Ca2+-mediated apoptotic signalling, whereby GM1 accumulation at the GEMs alters Ca2+ dynamics and acts as a molecular effector of both ER stress–induced and mitochondria-mediated apoptosis of neuronal cells.
Introduction
Maintenance of physiological levels of intracellular Ca2+ depends on the hierarchic interactions between plasma membrane pathways, mediating import and release of Ca2+, and the action of several intracellular organelles, which serve to store and discharge Ca2+ in response to a variety of cellular cues. The membrane systems involved in this process depend on the action of specific protein complexes as well as lipids, including glycosphingolipids (GSLs) (Garcia-Ruiz et al., 2000; Garofalo et al., 2005; Rostovtseva et al., 2006). Within this homeostatic network, mitochondria serve as physiological buffers of intracellular Ca2+, whose concentration needs to be tightly regulated for cell survival (Pozzan et al., 2000; Bernardi et al., 2001; Ishii et al., 2006).
A subset of mitochondria is found in close apposition to the endoplasmic reticulum (ER), at the opening of the inositol 1,4,5-triphosphate (IP3)-sensitive Ca2+ channel. These sites form membrane microdomains of high Ca2+ concentration, the mitochondria-associated ER membranes or MAMs (Rizzuto et al., 1993). Specific ER and mitochondrial proteins co-localize in the MAMs. These include the IP3R at the ER face of the MAMs, the molecular chaperone glucose-regulated-protein 75 (grp75), which bridges the IP3R-1 with voltage-dependent anion channel (VDAC-1) of the outer mitochondrial membrane (OMM), Sigma-1 receptor, calreticulin, mitofusin 2 (MFN2) and PACS-2 (Simmen et al., 2005; Szabadkai et al., 2006; Hayashi et al., 2007; de Brito et al., 2008). One of the functions of the MAMs is to ensure that Ca2+ waves dissipate from neighboring to distant mitochondria; disruption of this network blocks Ca2+ trafficking along these organelles (Rapizzi et al., 2002; Rizzuto et al., 2006).
Although the molecular mechanisms that link aberrant levels of mitochondrial Ca2+ with apoptosis are still not fully understood, it is becoming generally accepted that altered intracellular Ca2+ concentration results in mitochondrial collapse and apoptosis via mitochondrial membrane permeabilization (MMP) and opening of the permeability transition pore (PTP) (Bathori et al., 2006; Kroemer et al., 2007). Along with ensuing morphological and functional changes in mitochondria, the persistent opening of the PTP causes the release of apoptogenic factors (e.g. cytochrome c) and activation of the mitochondrial apoptotic cascade. Molecularly, the PTP is likely a multiprotein complex that transverses the intermembrane space, integrating mitochondrial responses to a number of cellular signals [e.g. Ca2+ and reactive oxygen species (ROS)] (Giorgio et al., 2005; Petronilli et al., 1994). Although the molecular nature of the principal components of this pore remains unknown (Leung et al., 2008), both biochemical and genetic studies have demonstrated that mitochondrial cyclophilin D (CyP-D) is a key regulator of PTP opening (Bernardi et al., 2006).
GM1-ganglioside (GM1) is one of the sialic acid-containing glycosphingolipids (GSLs), which is highly abundant in neuronal membranes and has been shown to modulate intracellular Ca2+ flux (d'Azzo et al., 2006, Wu et al., 2007). In the neurodegenerative storage disorder GM1-gangliosidosis deficiency of lysosomal β-galactosidase (β-gal) leads to impaired degradation of GM1 (Suzuki and Namba, 2001). The disease brings patients to a vegetative stage and in most cases to premature death (Suzuki and Namba, 2001). The pathogenesis of GM1-gangliosidosis is most likely caused by the massive and progressive increase of GM1 in cells (d'Azzo et al., 2006), particularly neuronal cells, albeit a full understanding of the downstream effects of GM1 accumulation is yet to be elucidated. We previously demonstrated that in β-gal−/− mice excessive buildup of GM1 at the ER membranes initiates neuronal apoptosis by depleting ER Ca2+ stores and activating an unfolded protein response (UPR) (Hahn et al., 1997; Tessitore et al., 2004).
Given the proximity of ER and mitochondria at the MAMs, we reasoned that changes in the local concentration of GM1 could occur specifically at these sites and in turn engage the mitochondria in a Ca2+-dependent apoptotic process. Here we identify the GSL-enriched microdomains (GEMs), within the MAMs, as the sites where GM1 accumulates and influences Ca2+ flux between the ER and the mitochondria. This study puts forward a new mechanism of Ca2+-mediated apoptotic signalling, where a lipid rather than a protein acts as a molecular effector of both ER stress–induced and mitochondria-mediated apoptosis.
Results
GM1 Accumulates in GSL- Enriched Fractions of the MAMs in β-gal−/− brain
We first tested for the presence of GM1 in mitochondrial preparations isolated from β-gal−/− and β-gal+/+ mouse brains using a discontinuous sucrose gradient (Figures 1A and S1A). Accumulation of GM1 in these preparations was already apparent in 5-day-old β-gal−/− mice and increased with age. These crude mitochondrial preparations were further fractionated on a Percoll gradient to obtain a heavy fraction consisting of purified mitochondria (Mito P) and a light fraction containing the MAMs (Vance et al.,1990). The MAMs were highly enriched for FACL4, a bona fide component of these microdomains while the Mito P were positive for TOMM20, an OMM marker, and devoid of FACL4 and the ER marker calreticulin (Figures 1B and 1C). The close apposition between ER and mitochondrial membranes at the MAMs explained the presence of also calreticulin in these preparations (Mannella et al., 1998) (Figure 1C). However, the densitometric ratio of ER and mitochondrial markers in β-gal−/− MAMs was significantly higher than that of the corresponding wild-type MAMs, suggesting increased ER content in the former samples (Figure 1E). These results were in line with the ultrastructural analyses of crude mitochondria isolated from β-gal−/− brains that showed more juxtaposed ER vesicles than mitochondria isolated from wild-type brains (Figures 1H and 1F). The MAMs were further extracted with Triton X-100 to obtain the GEMs. These microdomains, which contain components of lipid rafts and/or caveolae (Smida et al., 2007), were caveolin-1+ (Figure 1D). Thin layer chromatography (TLC) of total lipid extracts from MAM subfractions (MAMs, GEMs and Triton-extracted MAMs) showed that GM1 was higher in β-gal−/− MAMs than in wild-type MAMs and was particularly abundant in the GEMs (Figures 1G and S1B). The presence of small amounts of GM1 in β-gal+/+ GEMs suggests that this lipid is a normal constituent of both ER and mitochondrial membranes (Figures 1G and S1B).
Figure 1. GM1 Progressively Accumulates Mitochondria and MAMs Isolated from β-Gal−/− Brains.
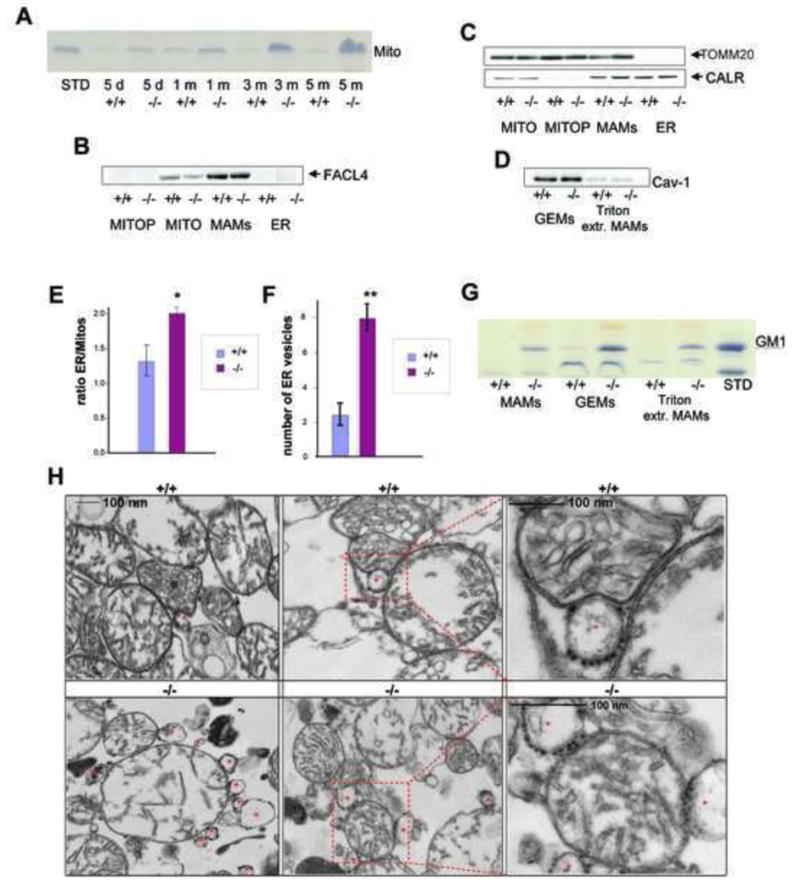
(A) TLC of lipid extracts (corresponding to 100 μg protein) from mitochondrial fractions isolated from β-gal+/+ and β-gal−/− brains (d=days and m=months). Plates were developed with resorcinol to evidence gangliosides. Purified GM1 was used as standard (STD).
(B) Immunoblots of crude mitochondria (MITO), ER, purified mitochondria (MITO P) and MAMs were probed with anti-FACL4, a marker of the MAMs.
(C) Immunoblots of the same fractions as in B probed with anti-TOMM20 and anti-calreticulin (CALR), markers of mitochondria and ER, respectively.
(D) Immunoblots of GEMs extracted from MAM preparations of β-gal+/+ and β-gal−/− brains were probed with caveolin-1 antibody (Cav-1).
(E) The ER/mitochondria markers ratio was calculated by densitometric analysis of single bands on immunoblots probed with TOMM20 (mitochondrial marker) and calreticulin (ER marker) (Quantity One 4.5, 1 D Analysis Software, BioRad). Values are expressed as mean ± standard deviation of three independent experiments. Groups were compared by the Student t-test for unpaired samples. P< 0.05 (*)
(F) The numbers of ER vesicles in close apposition to mitochondria were counted in 20 electron microscopy grids from β-gal+/+ and β-gal−/− mitochondrial brain fractions. Values are expressed as mean ± s.d. Groups were compared by the Student t-test for unpaired samples. Asterisk denotes mean (± s.d) that is significantly different from control. P<0.0001(**).
(G) TLC analysis of lipids (corresponding to 100 μg protein) from the MAMs, and the Triton extracted fractions (Triton extr. MAMs) and Triton insoluble fractions (GEMs) of the MAMs. Purified GM1 was used as standard.
(H) Representative electron micrographs of mitochondria isolated from β-gal+/+ and β-gal−/− brains. Asterisks denote ER vesicles containing ribosomes.
GM1 Accumulation in the GEMs Affects the Levels of IP3R-1, VDAC-1 and Grp75
Proteomic analyses of MAMs and GEMs revealed the presence of IP3R-1 in β-gal+/+ and β-gal−/− fractions (data not shown). We therefore compared total and phosphorylated IP3R-1 (P-IP3R-1) levels in GEMs from both preparations; P–IP3R-1, but not total-IP3R-1, was higher in β-gal−/− GEMs (Figures 2A and 2B). This difference was not apparent when total brain lysates were used (Figure 2C). These results suggest a preferential distribution of P–IP3R-1 and GM1 in the GEMs. Furthermore, GM1 and P–IP3R-1 coimmunoprecipitated from β-gal−/− cerebellum and cortex lysates (Figure 2C), indicating a functional in vivo interaction between these molecules. Together these findings suggest that accumulation of GM1 favors the formation of contact sites between the ER and the mitochondrial membranes. This configuration may promote the clustering of an active receptor in the GEMs, and in turn increase the channel pore size, giving rise to a larger Ca2+ conductance (Haug et al., 1999; Nakade et al., 1994; Rahman et al., 2009).
Figure 2. IP3R-1 Regulates Ca2+ Dynamics in GM1-Accumulating Cells.
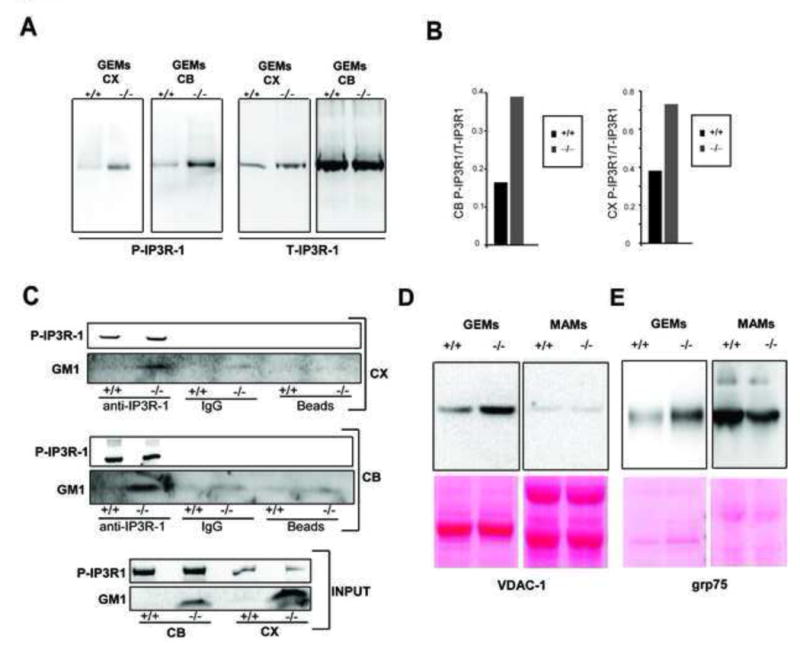
(A) The phosphorylated and total IP3R-1 were visualized on immunoblots containing GEMs, purified from MAMs of β-gal+/+ and β-gal−/− cerebellum (CB) and cortex (CX) extracts, probed first with a phospho-IP3R (Ser1756) antibody (P-IP3R-1) and then with a total IP3R-1 antibody (T-IP3R-1).
(B) Densitometric analyses of bands from immunoblots of GEM fractions isolated from MAMs of β-gal+/+ or β-gal−/− cerebellum (CB), (left panel) and cortex (CX), (right panel) extracts, probed with an antibody against P–IP3R-1 and with an antibody against total IP3R-1 (T-IP3R-1). Results are expressed as P–IP3R/T-IP3R intensities ratio.
(C) Co-immunoprecipitation of P-IP3R-1 and GM1 from β-gal+/+ and β-gal−/− cerebellum (CB) and cortex (CX) using total IP3R-1 antibody was visualized on immunoblots probed with HRP-conjugated β-subunit of Cholera toxin (GM1) or the P-IP3R antibody. IgG and protein G beads were used as negative controls. Immunoblots of IP3R-1 and GM1 in CB and CX extracts (30μg) are shown as INPUT.
(D) (E) Levels of the VDAC-1 and grp75 were assessed in GEMs and in total MAMs of β-gal+/+ and β-gal−/− brains. Ponceau staining of the membranes were used for equal protein loading.
Within the MAMs, the IP3R-1 at the ER side interacts with VDAC-1 at the mitochondrial side via the molecular chaperone grp75, thereby facilitating mitochondrial buffering of Ca2+ released from the ER (Szabadkai et al., 2006). VDAC-1 and grp75 levels increased in parallel to P–IP3R-1 in GEMs from β-gal−/− brains; however, they were not elevated in MAMs (Figures 2D and 2E). It is therefore conceivable that GEMs within MAMs, function as specific Ca2+-transfer subdomains. These features were predictive of mitochondrial Ca2+ imbalance after Ca2+ release from the ER.
GM1 Accumulation in the GEMs Alters Mitochondrial Ca2+ Homeostasis
We first observed overt changes in mitochondrial shape, a phenomenon consequential to disturbance of mitochondrial Ca2+ concentration ([Ca2+]m) (Suen et al., 2008). In GM1-accumulating MEFs and neurospheres, more than 90% of the mitochondria lost their classic elongated form and appeared more rounded, and redistributed around the nuclei (Figures S2A, S2B and S2C). Next, we measured [Ca2+]m by using live fluorescence confocal imaging of individual mitochondria in β-gal−/−, β-gal+/+, and GM1-loaded β-gal+/+ mouse embryonic fibroblasts (MEFs) probed with the mitochondrial-targeted ratiometric probe, pericam (Nagai et al., 2001). Treatment with the IP3R-inducer histamine provoked a sharp rise in [Ca2+]m, which was significantly more prominent in GM1-accumulating cells than in wild-type cells (Figure 3A).
Figure 3. MAMs/GEMs are Responsible for Mitochondrial Ca2+ Overload and Apoptosis in GM1-Accumulating Cells.

(A) Levels of mitochondrial Ca2+ in β-gal−/−, β-gal+/+ loaded with GM1 (treated or not treated with MBCD) and β-gal−/−/CyP-D−/− MEFs were measured ratiometrically using mitochondria-targeted pericam and compared to those of wild-type cells. Mitochondrial Ca2+ measurements are shown at baseline and at peak values in response to a pulse of histamine. Values are expressed as mean ± standard deviation of twenty individual mitochondria in an average of 15 cells. Groups were compared by the Student t-test for unpaired samples. (*P<0.05, **P<0.01)
(B) Inmmunoblots of MAMs and MBCD-extracted MAMs probed with HRP-conjugated β-subunit of Cholera toxin (GM1).
(C and D) β-gal−/− and β-gal+/+ MEFs were transfected with MFN2 siRNA. Untreated cells, mock transfected cells and cells transfected with a scrambled siRNA were used as controls. Cell lysates were analyzed on immunoblots probed with anti MFN2 and anti actin antibodies.
(E and F) β-gal−/− and β-gal+/+ MEFs were transfected with IP3R-1 siRNA. Untreated cells, mock transfected cells and cells transfected with a scrambled siRNA were used as controls. Cell lysates were analyzed on immunoblots probed with anti IP3R-1 and anti actin antibodies.
(G) Flow cytometry analyses of : Annexin V+ β-gal−/− and β-gal+/+ MEFs untreated or treated with increasing concentration of MBCD (50, 100, 150 μM); β-gal−/− and β-gal+/+ MEFs transfected with MFN2 or IP3R-1 siRNAs; mock transfected or scrambled siRNA transfected cells were used as controls.
To determine whether the alteration of [Ca2+]m is due to GM1 accumulation in the MAMs/GEMs, we used the circular oligosaccharide methyl β-cyclodextrin (MBCD), known to extract cholesterol and possibly other lipids from lipid rafts, to inhibit MAM/GEM formation. We predicted that this compound, by interfering with the lipid content of the MAMs/GEMs, would also disrupt their integrity, favouring the disassembly of mitochondria-ER contact points. We found that MBCD efficiently extracted GM1 from our MAM preparations (Figure 3B). Most importantly, treatment of GM1-accumulating cells with MBCD restored [Ca2+]m to levels close to normal (Figure 3A). The latter was accompanied by a gradual reduction in the total number of Annexin V+ β-gal−/− cells that was proportional to the concentration of MBCD used (Figure 3G). This compound had no effect on wild-type cells.
To further prove that the apoptotic process in the GM1-accumulating cells is linked to the presence of GM1 at the MAMs/GEMs, we specifically disengaged the ER-mitochondria attachment sites by silencing MFN2, whose function is to tether these organelles at the MAMs (de Brito et al., 2008). Using an ‘on-target’ siRNA pool against the murine MFN2 mRNA we could reduce MFN2 expression by ∼40% in both β-gal+/+ an β-gal−/− MEFs (Figures 3C, 3D, S3A and S3B). MFN2 silencing had no effect on the number of Annexin V+ β-gal+/+ cells but effectively blocked apoptosis in GM1-accumulating cells (Figure 3G). Lastly, to validate the role of IP3R-1 in the abnormal Ca2+ transfer from the ER to the mitochondria we tested the effects of down-regulated expression of this receptor in our cell system. Silencing of IP3R-1 (Figures 3E, 3F, S3C and S3D) significantly diminished the number of Annexin V+ β-gal−/− cells. Overall, these findings support the idea that GM1 accumulation in the MAMs/GEMs is the primary cause of IP3R-1-mediated mitochondrial Ca2+ overload and cell death.
GM1 Dissipates the Mitochondrial Transmembrane Potential
The uptake of Ca2+ by the mitochondria strictly requires the existence of an electrical potential across mitochondrial membranes and accumulation of Ca2+ in the matrix leads to opening of the PTP and dissipation of the mitochondrial membrane potential (ΔΨm) (Bernardi et al., 2006). We therefore tested whether depolarization occurred in cells accumulating GM1 by using the cationic dye, tetramethyl-rhodamine methyl ester (TMRM). Live confocal imaging of TMRM fluorescence was performed in individual mitochondria of β-gal−/−, β-gal+/+, and GM1-loaded β-gal+/+ MEFs. A pulse of histamine substantially decreased the ΔΨm specifically in β-gal−/− and GM1-loaded β-gal+/+ cells, suggesting a causative effect of GM1 levels on ΔΨm dissipation (Figure 4A). Treatment with carbonyl cyanide m-chlorophenyl hydrazone (CCCP) completely depolarized the mitochondria in both cell types (Figure 4A).
Figure 4. Effect of GM1 on Mitochondrial Transmembrane Potential and Opening of the PTP.
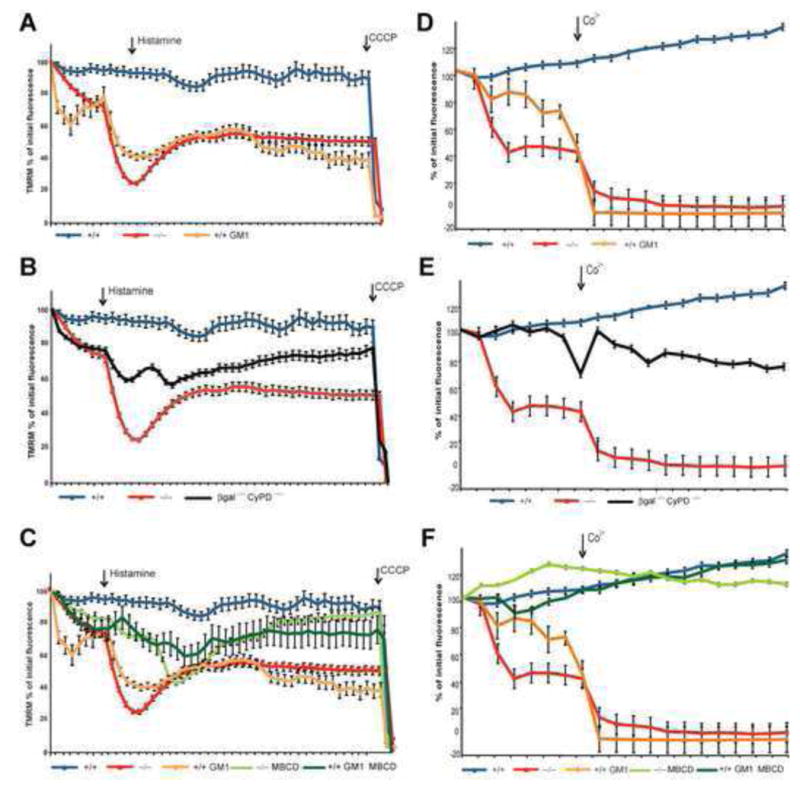
(A) Live measurements of TMRM fluorescence in individual mitochondria of β-gal+/+, β-gal+/+ loaded with GM1, and β-gal−/− MEFs pulsed with histamine and depolarized with CCCP as indicated. Values are expressed as percentage of initial TMRM fluorescence and represent the mean ± SE of 20 independent measurements.
(B) Live measurements of TMRM fluorescence in individual mitochondria of β-gal−/−/CyP-D−/− MEFs compared to TMRM fluorescence in β-gal−/− and β-gal+/+ mitochondria. Values are expressed as percentage of initial TMRM fluorescence and represent the mean ± SE of 20 independent measurements.
(C) Restoration of the ΔΨm in β-gal+/+ loaded with GM1 and β-gal−/− MEFs treated with MBCD. Values are expressed as percentage of initial TMRM fluorescence and represent the mean ± SE of 20 independent measurements.
(D) Live measurements of mitochondrial calcein release in β-gal+/+, β-gal+/+ loaded with GM1, and β-gal−/− MEFs pulsed with CoCl2. Data are expressed as percentage of initial calcein fluorescence and represent the mean ± SE of at least 20 independent measurements.
(E) Live measurements of mitochondrial calcein release in β-gal−/−/CyP-D−/− MEFs pulsed with CoCl2 and compared to the values obtained in β-gal−/− and β-gal+/+ mitochondria. Data are expressed as percentage of initial calcein fluorescence and represent the mean ± SE of at least 20 independent measurements.
(F) Prevention of PTP opening β-gal+/+ loaded with GM1 and β-gal−/− MEFs treated with MBCD. Data are expressed as percentage of initial calcein fluorescence and represent the mean ± SE of at least 20 independent measurements.
We next tested the PTP status in our cell system by using the calcein/Co2+ technique (Petronilli et al., 1999). Real time confocal imaging of calcein quenching upon Co2+ addition demonstrated Ca2+-dependent PTP opening only in GM1-accumulating cells (Figure 4D). Importantly, analysis of pericam-probed mitochondria in β-gal−/−/CyP-D−/− cells, in which PTP opening is inhibited, showed complete normalization of [Ca2+]m (Figure 3A). Consequently, ΔΨm dissipation and PTP opening were rescued in these double-knockout cells (Figures 4B and 4E).
Lastly, treatment of β-gal−/− cells and GM1-loaded β-gal+/+ cells with MBCD completely reversed mitochondrial depolarization and PTP opening (Figures 4C and 4F). Together these results implicate the GEMs and their lipid composition in both Ca2+ trafficking and MMP, and suggest a physiological role for these microdomains in these processes.
GM1-Induced MMP is Associated with Release of Apoptogenic Factors
We next tested whether GM1-induced mitochondrial Ca2+ overload provokes the release of apoptogenic factors (i.e. cytochrome c and apoptosis-inducing factor, AIF), which is a consequence of MMP. Costaining of GM1-accumulating MEFs with MitoTracker and anti-cytochrome c antibody revealed an abnormal re-distribution of cytochrome c from the mitochondria to the cytosol (Figure 5A). Moreover, using isolated brain mitochondria, we demonstrated increased cytochrome c release in the supernatant of β-gal−/− mitochondria compared to that from β-gal+/+ mitochondria (Figure 5B). Cytochrome c release was also observed upon treatment of β-gal+/+ mitochondria with exogenous Ca2+ (Figure 5B). Similar results were obtained by Western blotting of isolated cytosolic and mitochondrial fractions from β-gal−/− and GM1-loaded β-gal+/+ MEFs and neurospheres (Figures 5C and 5D). Finally, we found that the levels of the mature, cleaved form of AIF (mAIF) were substantially increased in both mitochondrial and cytosolic fractions from β-gal−/− brains compared to those from β-gal+/+ brains (Figure S4A).
Figure 5. GM1 Promotes the Release of Mitochondrial Proteins into the Cytosol.
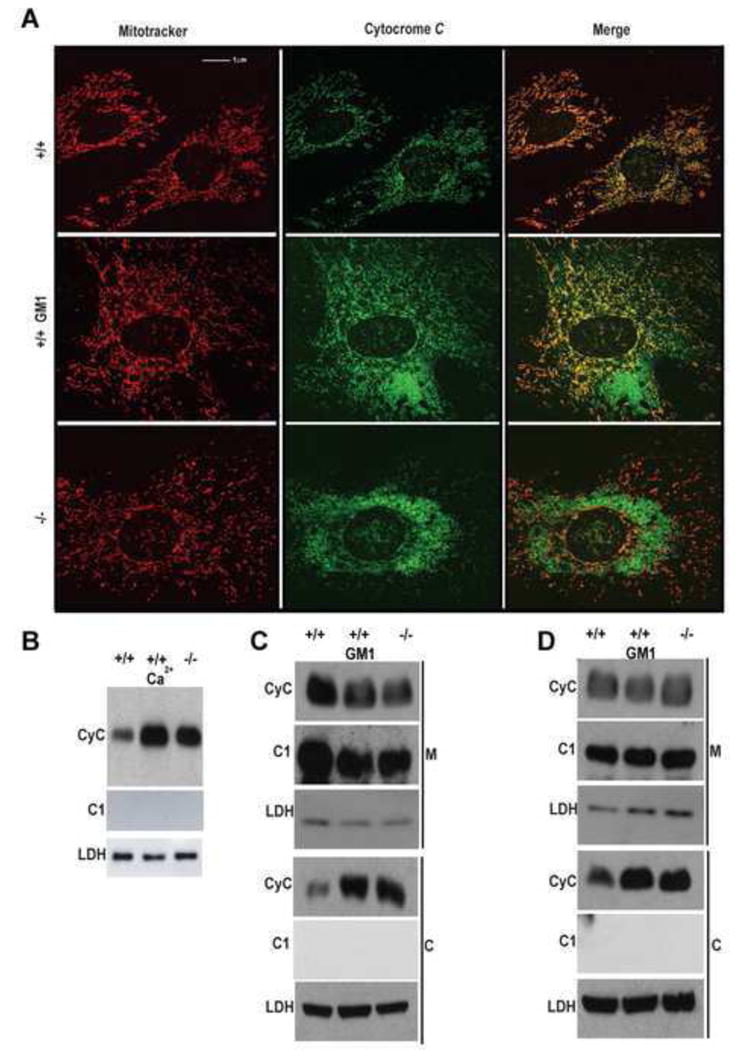
(A) MEFs were co-stained with Mitotracker (red) and an anti-cytochrome c antibody (green). The merged pictures demonstrated increased levels of cytochrome c in the cytosol of GM1-loaded β-gal+/+, and β-gal−/− cells, while in untreated β-gal+/+ cells most of the cytochrome c is localized within the mitochondria (yellow).
(B) Cytochrome c release was monitored in isolated mitochondria from β-gal+/+ and β-gal−/− brains after incubation with GM1 or Ca2+. Cytosolic fractions were analyzed on immunoblots probed with cytochrome c antibody. Complex I (CI) and LDH were used as standard controls for the cytosol.
(C) Mitochondria (M) and cytosolic fractions (C) isolated from β-gal+/+, GM1-loaded β-gal+/+ and β-gal−/− MEFs were probed on Immuno blots with an anti-cytochrome c antibody (CyC). Complex I (CI) and LDH were used as standard controls for both mitochondria and cytosol.
(D) Mitochondria (M) and cytosolic fractions (C) isolated from β-gal+/+, GM1-loaded β-gal+/+ and β-gal−/− neurospheres were probed as in (C).
Ca2+-Blockers Revert the Effects of GM1-Induced MMP and Mitochondrial Apoptosis
Increased GM1 concentration ultimately led to cell death, as demonstrated by the high percentage of Annexin V+ β-gal−/− and GM1-loaded β-gal+/+ MEFs compared to that in wild-type samples (Figure 6A). Treatment with BAPTA, a cytosolic Ca2+-chelator, and cyclosporin A (CsA), which prevents PTP opening, protected the MEFs from cell death (Figure 6A); thus mitochondrial Ca2+ overload caused this phenotype. Mitochondria-mediated apoptosis is usually preceded by the activation of the initiator caspase-9 and the effector caspase-3 (Ferrando-May et al., 2001). Treatment with the cell-permeable pan-caspase inhibitor, Z-VAD-fmk, partially reduced the number of Annexin V+ cells; thus, caspase activation occurred in GM1-accumulating cells (Figure 6A). Similar results were obtained by staining the cells with a FITC-conjugated Z-VAD-fmk inhibitor (Figure 6D). Fluorescent-positive cells were detected only in GM1-accumulating MEFs, and their number was comparable to that in staurosporine-treated cells. Activation of the caspase cascade was also accompanied by caspase-mediated DNA fragmentation (Figure S4B).
Figure 6. Ca2+ Blockers and CsA Prevent Apoptosis, Rescue ATP Levels and Abolish Abnormal ROS Production in GM1-Storing Cells.

(A) Flow cytometry analysis of Annexin V β-gal+/+, GM1-loaded β-gal+/+ and β-gal−/− MEFs. In some instances, cells were preincubated with BAPTA, CsA and Z-VAD-fmk. Values are expressed as mean ± standard deviation of three independent experiments. Groups were compared by the Student t-test for unpaired samples. P< 0.05 (*)
(B) ATP levels in β-gal+/+, GM1-loaded β-gal+/+ and β-gal−/− MEFs were measured using a luciferase-based assay. Where indicated, cells were pre-incubated with BAPTA and CsA prior to ATP analysis. Staurosporine was used as positive controls. Values are expressed as mean ± standard deviation of three independent experiments. Groups were compared by the Student t-test for unpaired samples. P< 0.05 (*)
(C) Reactive oxygen species (ROS) were measured in β-gal+/+, GM1-loaded β-gal+/+ and β-gal−/− MEFs with the fluorescent probe 2′,7′-dichlorofluorescein (H2DCFDA). The progressive increase in ROS levels was monitored by the fluorescence emitted after reaction with intracellular ROS. Addition of CsA and BAPTA normalized ROS levels in GM1-accumulating cells. Data are expressed as mean ± SD of 4 distinct experiments; groups were compared by the Student t-test for unpaired samples. Asterisks denote mean values ±s.d significantly different from control or from untreated GM1-loaded β-gal+/+ and β-gal−/− (*P<0.05, **P<0.01).
(D) Caspase activation was assessed by immunofluorescence analysis using a fluorescent pan caspace inhibitor, caspACE FITC VAD-fmk. Staurosporine was used as positive control.
We then tested the effect of intracellular GM1 buildup on the mitochondrial bioenergetic activity by measuring the total ATP concentration, which is influenced by MMP (Richter at al., 1996). ATP levels were considerably lower in β-gal−/− and GM1-loaded β-gal+/+ MEFs than in wild-type MEFs (Figure 6B). However, treatment of the cells with CsA and BAPTA, restored ATP levels close to normal (Figure 6B). Lastly, we measured ROS production, which increases with excessive [Ca2+]m (Emerit et al., 2004), by labeling MEFs with 2′,7′-dichlorofluorescein, a specific ROS indicator. GM1-accumulating MEFs contained significantly higher levels of ROS than wild-type cells (Figure 6C). ROS levels were normalized in β-gal−/− cells treated with BAPTA or CsA, further linking GM1-mediated Ca2+ transfer to mitochondrial abnormalities.
GM1-Mediated Activation of the UPR is Upstream of MMP
Finally, we questioned whether GM1-mediated activation of ER stress- and mitochondria-mediated apoptotic pathways occurred simultaneously or sequentially. We tested this in CHO cells overexpressing BiP, unable to elicit the UPR, and in CyP-D−/− MEFs, resistant to mitochondrial apoptosis triggered by PTP opening (Basso et al., 2005; Forte et al., 2007). GM1-loaded CHO cells overexpressing BiP were resistant to cell-death, whereas GM1-loaded CyP-D−/− MEFs were as susceptible as wild-type MEFs to apoptosis (Figure 7A). XBP-1, an early molecular effector of the UPR, and caspase 3, which is activated in both apoptotic pathways, accumulated concurrently in GM1-loaded CyP-D−/− MEFs (Figures 7B and 7C). Thus, in GM1-accumulating cells, UPR occurs upstream of MMP and it can bypass the mitochondrial apoptotic pathway.
Figure 7. GM1-Mediated Activation of ER-Stress is Upstream of the Mitochondrial Apoptotic Cascade.
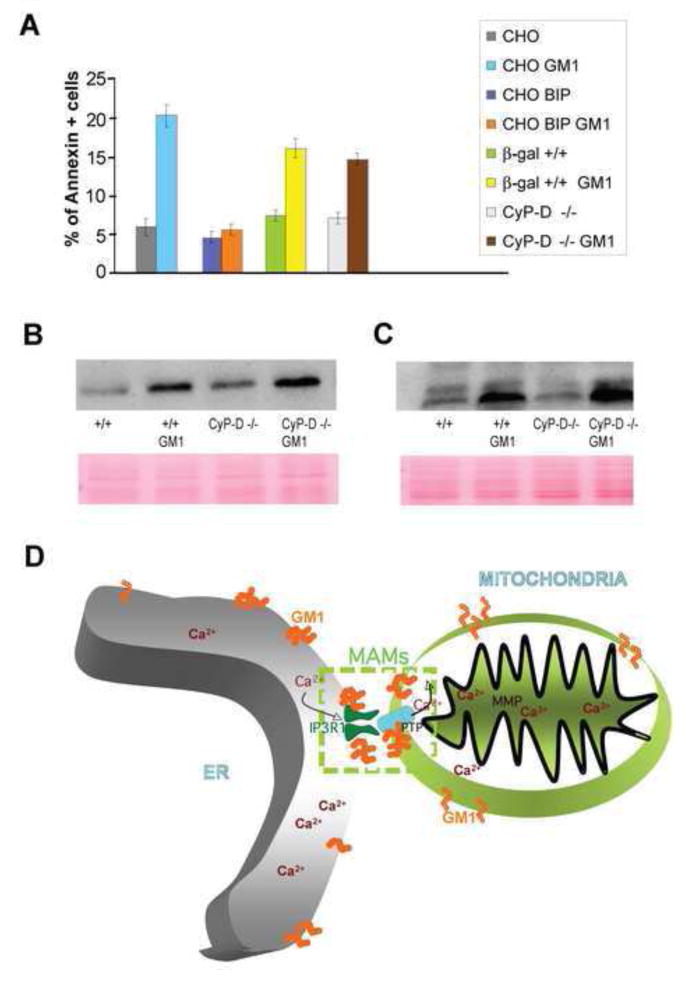
(A) Annexin V staining of CHO cells, CHO- overexpressing BiP, as well as β-gal+/+ and CypD−/− MEFs, treated or not with exogenous GM1, were evaluated by FACS analysis and expressed as percentage of Annexin V positivity.
(B), (C) Levels of XBP-1 and caspase-3 in β-gal+/+ and CypD-−/− MEFs were visualized on immunoblots probed with an anti-rat antibody against these proteins. Ponceau staining of the membranes was used to confirm equal protein loading.
(D) Proposed Model Linking ER-Mitochondria Ca2+ Signalling and Neuronal Apoptosis in GM1-gangliosidosis.
Discussion
The mechanisms connecting Ca2+ signaling to cell fate are still poorly understood. However, it is becoming increasingly clear that altering [Ca2+] in one of the intracellular Ca2+ stores can quickly transmit signals throughout the cell and impact other organelles not directly targeted by the primary insult (Ferri et al., 2001). In our earlier studies, we identified a role of the glycosphingolipid GM1 in modulating the levels of Ca2+ in the ER, thereby initiating an UPR-mediated apoptotic cascade (Tessitore et al., 2004). These findings support the notion that lipids, in particular glycosphingolipids, or their metabolites may directly or indirectly act as inducers of cell death, depending on their relative concentration in specific lipid-rich microdomains (d'Azzo et al., 2006; Morales et al., 2004).
Here we show that in GM1-gangliosidosis buildup of GM1 at the MAMs/GEMs alters the normal crosstalk between ER and mitochondria. Our findings also highlight a physiological function of GM1 in these microdomains and identify the GEMs as regulators of Ca2+ diffusion between the ER and the mitochondria. The fact that in β-gal−/− brain regions GM1 and P-IP3R-1 physically interact suggests that buildup of GM1 may favor the clustering of IP3R-1 in the GEMs by changing membrane composition or curvature, and in turn promote the formation of a Ca2+ mega pore (Rizzuto et al., 2006). This hypothesis is supported by the observation that silencing of IP3R-1 caused a robust reduction in the number of β-gal−/− apoptotic cells. On the mitochondrial side, the increased levels of grp75 and VDAC-1 that we found exclusively in the GEMs of β-gal−/− brains may allow for a more sustained diffusion of Ca2+ in the mitochondrial matrix and dissipation of the ΔΨm. These findings are in line with earlier studies demonstrating that overexpression of VDAC in HeLa or muscle cells enhances Ca2+ diffusion into the mitochondrial matrix at the ER-mitochondria contact sites, inducing apoptosis (Bathori et al., 2006; Rapizzi et al., 2002). The mitochondrial damage that ensues upon progressive GM1 accumulation in the GEMs also underscores the importance of these microdomains in maintaining a normal electrochemical gradient across mitochondrial membranes. In fact we show that treatment of β-gal−/− cells with MBCD, which inhibits the formation of these domains, rescues opening of the PTP, dissipation of ΔΨm and apoptosis. A similar outcome was obtained by silencing MFN2. Thus, our findings point to a combined role of proteins and lipids, particularly GM1, in the regulation of Ca2+ flux between ER and mitochondria at the MAMs.
The cascade of events that lead to cell death in GM1-accumulating neurons may resemble that elicited by increased levels of GD3 (Malisan et al., 2002). This ganglioside directly targets the mitochondria by opening the PTP and inducing apoptosis, while other gangliosides such as GD1a and GM3 have no effect (Scorrano et al., 1999; Garcia-Ruiz et al., 2000; d'Azzo et al., 2006). However, contrary to what we have observed for GM1, Ca2+ does not seem to play a role in GD3-mediated opening of the PTP, although elevated intracellular Ca2+ can synergistically accelerate the induction of this event (Kristal et al., 1999). Our findings that GM1-mediated PTP opening and MMP are antagonized by PTP inhibitors and Ca2+ cheletors, and rescued in β-gal−/−/CyP-D−/− cells, suggest that GM1 acts directly at the pore level in a Ca2+-dependent manner. Despite the numerous studies attempting to link PTP opening with increased levels of ROS in response to Ca2+, it is still controversial whether ROS generation is upstream or downstream of PTP opening and cytochrome c release (Giorgio et al., 2005). We found that in β-gal−/− cells increased ROS levels are a consequence of mitochondrial Ca2+ overload rather than the cause of mitochondrial dysfunction.
In conclusion, these studies indicate that GM1 can trigger both UPR- and mitochondria-mediated apoptosis. The timely contribution of these two compartments to cell death has been controversial. Some investigators have proposed that caspase-9 can be activated by the ER resident caspase-12, independently of cytochrome c release and apoptosome formation (Morishima et al., 2002; Rao et al., 2002), while others have demonstrated that the apoptosome is a key complex in UPR-mediated apoptosis (Di Sano et al., 2006; Masud et al., 2007). These variations in cell death response could be due to cell-specific differences and/or type of apoptotic stimuli. We propose a “two-hit” model to explain the neuronal apoptosis and neurodegeneration that occurs in patients with GM1-gangliosidosis. GM1 accumulation in the GEMs first triggers a Ca2+-mediated-ER stress response and consequently causes the opening of the PTP, which results in MMP and subsequent apoptosis (Figure 7D). These findings may have important implications for targeting checkpoints of the GM1-mediated apoptotic cascade in the treatment of this catastrophic disease. We predict that ER stress effectors may more efficiently block or reduce cell death before it progresses to the point of causing substantial neurological dysfunction.
Experimental Procedures
Reagents
GM1-ganglioside was kindly donated by TRB Pharma, Sao Paulo, Brazil. Cyclosporine A (CsA) was purchased from Sigma. BAPTA-AM was purchased from Invitrogen. MitoTracker and H2-DCFDA were from Molecular Probes. z-VAD-fmk was purchased from BioMol, CaspACE FITC-VAD-fmk was purchased from Promega, Vectashield with DAPI (Vector Laboratories). The following antibodies and their corresponding vendors are described below: cytochrome c, (Santa Cruz), VDAC-1 (Santa Cruz), complex I (MitoSciences), LDH (Chemicon), cleaved caspase-3 (Cell Signaling) HRP-conjugated Ctx-β-subunit (List Biological Laboratories), IP3R1 (Santa Cruz), IP3R (Cell Signaling), Phospho-IP3 Receptor (Ser1756) (Cell Signaling), grp75 (Santa Cruz), FACL4 (Abgent), caveolin-1 (Santa Cruz), AIF (Santa Cruz). XBP-1 antibody was kindly provided by Linda Hendershot (St Jude Children's Research Hospital).
Cell Culture
For the neurospheres, cerebellum and subependymal zones were dissected from brains of P3 to P5 pups and dissociated into a previously described single-cell suspension (Tessitore et al., 2004). MEFs were collected from E13.5 embryos and maintained in culture in DMEM supplemented with 10% heat-inactivated FBS. Where indicated, cells were treated with GM1 (100 μM for 24 h), CsA (1 μM over night) BAPTA-AM (10 μM for 24h) and/or MBCD (50 μM, 100 μM and 150 μM for 24 h) Untreated β-gal+/+ and β-gal-/- cells were used for controls.
Isolation and Purification of Mitochondrial Fractions
MEFs and neurospheres were resuspended in hypotonic buffer (250 mM sucrose, 20 mM Hepes pH 7.5, 10 mM KCl, 1.5 mM MgCl2, 1 mM EDTA, 1 mM EGTA, protease and phosphatase inhibitors) for 30 min on ice then disrupted by passing them through a 26G needle 30 times and then through a 30G needle 20 times. Lysed cells were centrifuged at 750 × g for 10 min at 4°C. The resulting supernatant (S1) was further centrifuged (S2) at 10,000 × g for 20 min at 4°C: the pellet (P1) contained the mitochondrial fraction. The S2 supernatant was again centrifuged at 100,000 × g for 1 h at 4°C. This third supernatant (S3) was saved as the cytosolic fraction.
Brains from 4-5 month old mice were homogenized in a sucrose-based buffer (0.32 M sucrose, 1 mM NaHCO3, 1 mM MgCl2, 0.5 mM CaCl2, protease and phosphatase inhibitors). The homogenates were diluted 10 times and spun at 1,400 × g for 10 min at 4° C. This step was repeated twice and the resulting supernatant (S1) was again spun at 13,800 × g for 10 min at 4° C to obtain a second supernatant (S2) and a pellet (P2). S2 was further centrifuged at 100,000 × g for 1 h at 4°C. This last supernatant (S3) contained the cytosolic fraction, while the pellet (P3) contained the ER fraction. P2 was resuspended in 320 mM sucrose, 1 mM NaHCO3, overlaid on a discontinuous sucrose gradient (850 mM, 1 M, 1.2 M) and centrifuged at 85,000 × g for 2 h to obtain the crude mitochondrial fraction.
Isolation of Mitochondria-Associated ER Membranes (MAMs) and Glycosphongolipid-Enriched Microdomains (GEMs)
Mitochondria-associated ER membranes (MAMs) and MitoP were isolated from crude mitochondrial fractions on Percoll gradients (Vance et al., 1990). To extract the GEMs (Garofalo et al., 2005) we resuspended the MAMs pellet in an extraction solution (25 mM HEPES, pH 7.5, 150 mM NaCl, 1% Triton X-100 and protease and phosphatase inhibitors) and left on ice for 20 min. This suspension was further centrifuged at 15,000 × g for 2 min at 4° C; the supernatant represented the Triton X-100 extracted fraction (Triton extracted MAMs) while the pellet containing the GEMs was resuspended in a solubilizing buffer (50 mM Tris-HCl, pH 8.8, 5 mM EDTA and 1% SDS).
Isolation of Gangliosides from Mitochondrial Fractions
Lipids were extracted from mitochondrial fractions (100 μg of proteins) using a solution of methanol and chloroform (1:2) followed by another extraction of the same solvents at 2:1 dilution ratio. The combined extracts were dried and separated by Thin Layer Chromatography (TLC) on 60-A silica gel plates (Whatman) as described (Tessitore et al., 2004).
Immunohistochemistry
MitoTracker probe (500 nM for 30 min) was used to stain mitochondria. After staining, live cells were washed and fixed in 4% formaldehyde at 37° C for 15 min. Cells were then permeabilized in PBS containing 0.2% Triton X-100, blocked in PBS containing 0.2% Triton and 5% of FBS and incubated overnight with anti-cytochrome c antibody at 4° C. Slides were visualized by confocal laser scanning microscopy (C1Si confocal system, Nikon).
CaspACE FITC-VAD-fmk (40 μM) was used to visualize activated caspases. Cells were grown on chamber slides and stained for 30 minutes at 37° C. After this step, cells were washed and fixed in 1% formaldehyde for 10 min and visualized by confocal laser scanning microscopy (Nikon).
Immunoblotting and Immunoprecipitation
Mitochondrial fractions were lysed with RIPA buffer (10 mM Tris-HCl, pH 7.4, 140 mM NaCl, 0.1% SDS, 1% Triton X-100 and 1% C24H39NaO4) containing protease and phosphatase inhibitors and total protein content was measured using the BCA protein assay reagent (Pierce Chemical). Proteins were separated by SDS-PAGE (4-12%) under reducing conditions and transferred to a PVDF membrane (Millipore). Membranes were incubated for 2 h in blocking buffer and subsequently probed with the specific antibody overnight. Immunoblots were developed by using Enhanced Chemiluminescence Kit (Perkin Elmer Life Sciences).
For the immunoprecipitation (IP) of the IP3R-1, the antibody was first incubated with 300 μg of cerebellum and cortex lysates; the antibody-antigen complexes were then captured on Dynabeads® Protein G (Invitrogen) that were further washed with RIPA buffer. After IP, western blots were performed using the Phospho-IP3R (Ser1756) antibody and the HRP-conjugated-β-subunit of Cholera toxin. IgG and beads were used as negative control for the IP.
Silencing of MFN2 and IP3R-1
On TARGETplus SMART pool siRNAs specific for murine MFN2 and IP3R-1 and a nonspecific scrambled control were purchased from Dharmacon. β-gal+/+ and β-gal−/− MEFs were transfected with siRNAs using the Dharmacon reagent 3 according to the manufacturer's protocol. Cells were analyzed 3 days post-transfection and subjected to Annexin V analysis and Western Blotting.
Electron Microscopy
For the ultrastructural studies, mitochondrial fractions were fixed with 4% PFA/2.5% glutaraldehyde then treated with osmium tetroxide. After standard dehydration, samples were infiltrated and embedded in Epon. Tissue sections (600-900Å) were stained in grids with Reynold's lead citrate and uranyl acetate.
Determination of Mitochondrial Ca2+ levels
For mitochondrial Ca2+ imaging, cultures were electroporated with ratiometric pericam (Nagai T. et al., 2001). Mitochondrial Ca2+ was evaluated by using ratiometric pericam construct (405 and 484 nm excitation, 515 nm emission. Mitochondria were identified as regions of interest (ROIs). The average fluorescence intensities over 20 ROIs were calculated for each frame, normalized as percentage of initial intensity and the ratio between 488 and 404 was calculated at time 0 and after the addition of histamine (100 μM).
Analysis of Mitochondrial Transmembrane Potential
Cells (105) were seeded onto 25 mm-round glass coverslips and stained at 37°C for 25 min with 10 nM tetramethylrhodamine methyl ester (TMRM) as described (Scorrano et al., 2003). Where indicated MBCD was added. Cells were excited at 561 nm and sequential images were acquired every 30 sec for 30 min. Histamine (100 μM at 4 min) and CCCP (50 μM at 28 min) were added during the confocal imaging. Clusters of mitochondria were identified as regions of interest (ROIs). The average fluorescence intensities over 20 ROIs were calculated for each frame and normalized for comparison.
Calcein Technique
Cells were plated and stained at 37°C for 10 min with calcein-AM (1 μM) as described (Petronilli et al., 1999). After incubation cells were washed to remove the dye. A recovery time of 40 min was followed. Quenching of the calcein was measured in the presence of 25 μM of CoCl2. Where indicated MBCD was added. Cells were excited at 488 nm and sequential images were acquired every 30 sec. The average fluorescence intensities over 20 ROIs were calculated for each frame and normalized for comparison.
Cytochrome c Release Assay
Mitochondrial fractions (250 μg) isolated from β-gal+/+ and β-gal−/− brains were resuspended in mitochondrial solubilizing buffer (400 mM mannitol, 50 mM Tris-HCl pH 7.5, 10 mM KH2PO4, 5 mg/ml BSA) and incubated at 30° C for 1 h. The reaction mixtures were centrifuged at 4,000 g for 5 min at 4°C. Supernatant fractions were subjected to SDS page and immunoblots were probed with anti-cytochrome c antibody. Ca2+ (300 μM) addition was used as positive control.
Annexin V Analysis
Annexin V FITC was used to label apoptotic cells and these were then quantified by FACS analysis. Z-VAD-fmk (50 μM) was used as broad spectrum caspase inhibitor and its effect under GM1 accumulation was evaluated. Staurosporine (1 μM over night) was used as positive control.
ATP Levels
ATP levels were measured using a luminescent ATP detection assay system (ATPlite, Perkin Elmer) following the manufacturer instruction. Luminescence was measured in a 96-well plate reader (Triad Series Multimode Detector spectrofluorimeter). CsA and BAPTA at concentrations described above were used in GM1 accumulating cells. Staurosporine was used as positive control.
Measurement of ROS
Intracellular ROS was detected using a cell-permeant ROS dye, H2DCFDA. β-gal+/+, β-gal+/+ GM1-loaded and β-gal−/− MEFs were resuspended in PBS containing the probe to a final concentration of 5 μM and incubated for 30 minutes at 37°C. After a short recovery time, cells were rinsed and oxidation was measured by monitoring the increase in fluorescence with a fluorescent plate reader (excitation 490 nm, emission 540 nm). CsA and BAPTA at concentrations described above were used in GM1 accumulating cells.
Statistics
Data are expressed as mean ± s.d. or mean ± s.e., and were evaluated using Student t-test for unpaired samples for comparisons with untreated β-gal+/+ and β-gal-/- samples. Mean differences were considered statistically significant when P-values were less than 0.05. In cell-based experiments, 3 to 20 independent measurements were made.
Supplementary Material
Figure S1. TLC Plates
Entire TLC plates of total lipid extracts from (A) mitochondria, (B) MAMs fractions isolated from β-gal+/+ and β-gal−/− brains (d=days and m=months). Purified GM1 was used as standard (STD).
Figure S2. Mitochondrial Ca2+ Overload Causes Alteration in Mitochondrial Morphology
(A) Mitochondria of β-gal+/+, β-gal+/+ -loaded with GM1 and β-gal−/− MEFs and neurospheres were labeled with the Mitotracker Red. Cells were incubated with Mitotracker and visualized by confocal laser microscopy.
(B and C) Quantification of the percentage of rounded versus elongated mitochondria in β-gal+/+, β-gal+/+-loaded with GM1 and β-gal−/− MEFs and neurospheres.
Figure S3. Quantification of expression levels of MFN2 and IP3R-1 after silencing
(A) β-gal−/− MEFs and (B) β-gal+/+ MEFs transfected with MFN2 siRNA. Bars indicate the ratio between the expression levels of MFN2 and actin. Untreated, mock transfected and scrambled transfected MEFs were used as controls.
(C) β-gal−/− MEFs and (D) β-gal+/+ MEFs transfected with IP3R-1 siRNA. Bars indicate the ratio between the expression levels of IP3R-1 and actin. Untreated, mock transfected and scrambled transfected MEFs were used as controls.
Figure S4. GM1 Induces Caspase-Mediated DNA Fragmentation
(A) Levels of AIF in mitochondria (M) and cytosol (C) isolated from β-gal+/+ and β-gal-/- brains were tested by western blot analysis. The antibody used recognizes both the precursor (pAIF, inactive) and the mature form of AIF (mAIF, active). Blotting is representative of three separate experiments.
(B) DNA isolated from the cerebral cortex of β-gal+/+ and β-gal-/- was run on agarose gel. DNA fragmentation was detected as a DNA-ladder. U937 cells were used as positive control.
Acknowledgments
We thank K. Sandhoff for critical reading of the manuscript, L. Hendershot for providing the CHO cells overexpressing BiP, and A. Barsoukova for help with pericam experiments. We also thank S. Connell, L. Mann, J. Williams, and S. Frase of the Cell and Tissue Imaging Shared Resource of St. JudeCRH for help with confocal and electron microscopy; A.M. Hamilton-Easton and R. Ashmun of the Flow Cytometry Laboratory of St. JudeCRH for FACS analyses; We thank C. Hill for secretarial assistance and A. McArthur for help with editing the manuscript. We gratefully appreciate the donation of GM1 from TRB Pharma, Brazil. A.d'A. holds an Endowed Chair in Genetics & Gene Therapy from the Jeweler's Charity Fund. This work was supported in part by NIH grants DK052025 and GM060905, the NIH Cancer Center Support Grant CA021765, the Lysosomal Storage Disease Consortium, the Assisi Foundation of Memphis, and the American Lebanese Syrian Associated Charities (ALSAC) of SJCRH.
References
- Basso E, Fante L, Fowlkes J, Petronilli V, Forte MA, Bernardi P. Properties of the permeability transition pore in mitochondria devoid of Cyclophilin D. J Biol Chem. 2005;280:18558–18561. doi: 10.1074/jbc.C500089200. [DOI] [PubMed] [Google Scholar]
- Bathori G, Csordas G, Garcia-Perez C, Davies E, Hajnoczky G. Ca2+-dependent control of the permeability properties of the mitochondrial outer membrane and voltage-dependent anion-selective channel (VDAC) J Biol Chem. 2006;281:17347–17358. doi: 10.1074/jbc.M600906200. [DOI] [PubMed] [Google Scholar]
- Bernardi P, Krauskopf A, Basso E, Petronilli V, Blachly-Dyson E, Di Lisa F, Forte MA. The mitochondrial permeability transition from in vitro artifact to disease target. FEBS J. 2006;273:2077–2099. doi: 10.1111/j.1742-4658.2006.05213.x. [DOI] [PubMed] [Google Scholar]
- Bernardi P, Petronilli V, Di Lisa F, Forte M. A mitochondrial perspective on cell death. Trends Biochem Sci. 2001;26:112–117. doi: 10.1016/s0968-0004(00)01745-x. [DOI] [PubMed] [Google Scholar]
- d'Azzo A, Tessitore A, Sano R. Gangliosides as apoptotic signals in ER stress response. Cell Death Differ. 2006;13:404–414. doi: 10.1038/sj.cdd.4401834. [DOI] [PubMed] [Google Scholar]
- de Brito OM, Scorrano L. Mitofusin 2 tethers endoplasmic reticulum to mitochondria. Nature. 2008;4(7222):605–610. doi: 10.1038/nature07534. 456. [DOI] [PubMed] [Google Scholar]
- Di Sano F, Tufi R, Achsel T, Piacentini M, Cecconi F. Endoplasmic reticulum stress induces apoptosis by an apoptosome-dependent but caspase 12-independent mechanism. J Biol Chem. 2006;281:2693–2700. doi: 10.1074/jbc.M509110200. [DOI] [PubMed] [Google Scholar]
- Emerit J, Edeas M, Bricaire F. Neurodegenerative diseases and oxidative stress. Biomed Pharmacother. 2004;58:39–46. doi: 10.1016/j.biopha.2003.11.004. [DOI] [PubMed] [Google Scholar]
- Ferrando-May E, Cordes V, Biller-Ckovric I, Mirkovic J, Gorlich D, Nicotera P. Caspases mediate nucleoporin cleavage, but not early redistribution of nuclear transport factors and modulation of nuclear permeability in apoptosis. Cell Death Differ. 2001;8:495–505. doi: 10.1038/sj.cdd.4400837. [DOI] [PubMed] [Google Scholar]
- Ferri KF, Kroemer G. Organelle-specific initiation of cell death pathways. Nat Cell Biol. 2001;3:255–263. doi: 10.1038/ncb1101-e255. [DOI] [PubMed] [Google Scholar]
- Forte M, Gold BG, Marracci G, Chaudhary P, Basso E, Johnsen D, Yu X, Fowlkes J, Bernardi P, Bourdette D. Cyclophilin D inactivation protects axons in experimental autoimmune encephalomyelitis, an animal model of multiple sclerosis. Proc Natl Acad Sci U S A. 2007;104:7558–7563. doi: 10.1073/pnas.0702228104. [DOI] [PMC free article] [PubMed] [Google Scholar]
- Garcia-Ruiz C, Colell A, Paris R, Fernandez-Checa JC. Direct interaction of GD3 ganglioside with mitochondria generates reactive oxygen species followed by mitochondrial permeability transition, cytochrome c release, and caspase activation. FASEB J. 2000;14:847–858. doi: 10.1096/fasebj.14.7.847. [DOI] [PubMed] [Google Scholar]
- Garofalo T, Giammarioli A, Misasi R, Tinari A, Manganelli V, Gambardella L, Pavan A, Malorni W, Sorice M. Lipid microdomains contribute to apoptosis-associated modifications of mitochondria in T cells. Cell Death Differ. 2005;12:1378–1389. doi: 10.1038/sj.cdd.4401672. [DOI] [PubMed] [Google Scholar]
- Giorgio M, Migliaccio E, Orsini F, Paolucci D, Moroni M, Contursi C, Pelliccia G, Luzi L, Minucci S, et al. Electron transfer between cytochrome c and p66Shc generates reactive oxygen species that trigger mitochondrial apoptosis. Cell. 2005;122:221–233. doi: 10.1016/j.cell.2005.05.011. [DOI] [PubMed] [Google Scholar]
- Hahn CN, del Pilar Martin M, Schröder M, Vanier MT, Hara Y, Suzuki K, Suzuki Y, d'Azzo A. Generalized CNS disease and massive GM1-ganglioside accumulation in mice defective in lysosomal acid beta-galactosidase. Hum Mol Genet. 1997;6:205–211. doi: 10.1093/hmg/6.2.205. [DOI] [PubMed] [Google Scholar]
- Haug LS, Jensen V, Hvalby O, Walaas SI, Ostvold AC. Phosphorylation of the inositol 1,4,5-trisphosphate receptor by cyclic nucleotide-dependent kinases in vitro and in rat cerebellar slices in situ. J Biol Chem. 1999;274:7467–7473. doi: 10.1074/jbc.274.11.7467. [DOI] [PubMed] [Google Scholar]
- Hayashi T, Su TP. Sigma-1 receptor chaperones at the ER-mitochondrion interface regulate Ca(2+) signaling and cell survival. Cell. 2007;131(3):596–610. doi: 10.1016/j.cell.2007.08.036. [DOI] [PubMed] [Google Scholar]
- Ishii K, Hirose K, Iino M. Ca2+ shuttling between endoplasmic reticulum and mitochondria underlying Ca2+ oscillations. EMBO Rep. 2006;7:390–396. doi: 10.1038/sj.embor.7400620. [DOI] [PMC free article] [PubMed] [Google Scholar]
- Kristal BS, Brown AM. Ganglioside GD3, the mitochondrial permeability transition, and apoptosis. Ann N Y Acad Sci. 1999;893:321–324. doi: 10.1111/j.1749-6632.1999.tb07846.x. [DOI] [PubMed] [Google Scholar]
- Kroemer G, Galluzzi L, Brenner C. Mitochondrial membrane permeabilization in cell death. Physiol Rev. 2007;87:99–163. doi: 10.1152/physrev.00013.2006. [DOI] [PubMed] [Google Scholar]
- Leung AW, Halestrap A. Recent progress in elucidating the molecular mechanism of the mitochondrial permeability transition pore. Biochim Biophys Acta. 2008;1777:946–952. doi: 10.1016/j.bbabio.2008.03.009. [DOI] [PubMed] [Google Scholar]
- Malisan F, Testi R. GD3 ganglioside and apoptosis. Biochim Biophys Acta. 2002;1585:179–187. doi: 10.1016/s1388-1981(02)00339-6. [DOI] [PubMed] [Google Scholar]
- Mannella CA, Buttle K, Rath BK, Marko M. Electron microscopic tomography of rat-liver mitochondria and their interaction with the endoplasmic reticulum. Biofactors. 1998;8(34):225–228. doi: 10.1002/biof.5520080309. [DOI] [PubMed] [Google Scholar]
- Masud A, Mohapatra A, Lakhani SA, Ferrandino A, Hakem R, Flavell RA. Endoplasmic reticulum stress-induced death of mouse embryonic fibroblasts requires the intrinsic pathway of apoptosis. J Biol Chem. 2007;282:14132–11439. doi: 10.1074/jbc.M700077200. [DOI] [PubMed] [Google Scholar]
- Morales A, Colell A, Mari M, Garcia-Ruiz C, Fernandez-Checa JC. Glycosphingolipids and mitochondria: role in apoptosis and disease. Glycoconj J. 2004;20:579–588. doi: 10.1023/B:GLYC.0000043294.62504.2c. [DOI] [PubMed] [Google Scholar]
- Morishima N, Nakanishi K, Takenouchi H, Shibata T, Yasuhiko Y. An endoplasmic reticulum stress-specific caspase cascade in apoptosis. Cytochrome c-independent activation of caspase-9 by caspase-12. J Biol Chem. 2002;277:34287–34294. doi: 10.1074/jbc.M204973200. [DOI] [PubMed] [Google Scholar]
- Nagai T, Sawano A, Park ES, Miyawaki A. Circularly permuted green fluorescent proteins engineered to sense Ca2+ Proc Natl Acad Sci U S A. 2001;13(6):3197–3202. doi: 10.1073/pnas.051636098. 98. [DOI] [PMC free article] [PubMed] [Google Scholar]
- Nakade S, Rhee S, Hamanaka H, Mikoshiba K. Cyclic AMP-dependent phosphorylation of an immunoaffinity-purified homotetrameric inositol 1,4,5-trisphosphate receptor (type I) increases Ca2+ flux in reconstituted lipid vesicles. J Biol Chem. 1994;269:6735–6742. [PubMed] [Google Scholar]
- Petronilli V, Nicolli A, Costantini P, Colonna R, Bernardi P. Regulation of the permeability transition pore, a voltage-dependent mitochondrial channel inhibited by cyclosporin A. Biochim Biophys Acta. 1994;1187:255–259. doi: 10.1016/0005-2728(94)90122-8. [DOI] [PubMed] [Google Scholar]
- Petronilli V, Miotto G, Canton M, Colonna R, Bernardi P, Di Lisa F. Transient and long-lasting openings of the mitochondrial permeability transition pore can be monitored directly in intact cells by changes in mitochondrial calcein fluorescence. Biophys J. 1999;76:725–734. doi: 10.1016/S0006-3495(99)77239-5. [DOI] [PMC free article] [PubMed] [Google Scholar]
- Pozzan T, Rizzuto R. High tide of calcium in mitochondria. Nat Cell Biol. 2000;2:25–27. doi: 10.1038/35000095. [DOI] [PubMed] [Google Scholar]
- Rahman T, Skupin A, Falcke M, Taylor CW. Clustering of InsP3 receptors by InsP3 retunes their regulation by InsP3 and Ca2+ 2009;458(7238):655–659. doi: 10.1038/nature07763. [DOI] [PMC free article] [PubMed] [Google Scholar]
- Rao RV, Castro-Obregon S, Frankowski H, Schuler M, Stoka V, del Rio G, Bredesen DE, Ellerby HM. Coupling endoplasmic reticulum stress to the cell death program. An Apaf-1-independent intrinsic pathway. J Biol Chem. 2002;277:21836–21842. doi: 10.1074/jbc.M202726200. [DOI] [PubMed] [Google Scholar]
- Rapizzi E, Pinton P, Szabadkai G, Wieckowski MR, Vandecasteele G, Baird G, Tuft RA, Fogarty KE, Rizzuto R. Recombinant expression of the voltage-dependent anion channel enhances the transfer of Ca2+ microdomains to mitochondria. J Cell Biol. 2002;159:613–624. doi: 10.1083/jcb.200205091. [DOI] [PMC free article] [PubMed] [Google Scholar]
- Richter C, Schweizer M, Cossarizza A, Franceschi C. Control of apoptosis by the cellular ATP level. FEBS Lett. 1996;8(2):107–110. doi: 10.1016/0014-5793(95)01431-4. 378. [DOI] [PubMed] [Google Scholar]
- Rizzuto R, Brini M, Murgia M, Pozzan T. Microdomains with high Ca2+ close to IP3-sensitive channels that are sensed by neighboring mitochondria. Science. 1993;262:744–747. doi: 10.1126/science.8235595. [DOI] [PubMed] [Google Scholar]
- Rizzuto R, Pozzan T. Microdomains of intracellular Ca2+: molecular determinants and functional consequences. Physiol Rev. 2006;86:369–408. doi: 10.1152/physrev.00004.2005. [DOI] [PubMed] [Google Scholar]
- Rostovtseva TK, Kazemi N, Weinrich M, Bezrukov SM. Voltage gating of VDAC is regulated by nonlamellar lipids of mitochondrial membranes. J Biol Chem. 2006;281:37496–37506. doi: 10.1074/jbc.M602548200. [DOI] [PubMed] [Google Scholar]
- Scorrano L, Petronilli V, Di Lisa F, Bernardi P. Commitment to apoptosis by GD3 ganglioside depends on opening of the mitochondrial permeability transition pore. J Biol Chem. 1999;274:22581–22585. doi: 10.1074/jbc.274.32.22581. [DOI] [PubMed] [Google Scholar]
- Scorrano L, Oakes SA, Opferman JT, Cheng EH, Sorcinelli MD, Pozzan T, Korsmeyer SJ. BAX and BAK regulation of endoplasmic reticulum Ca2+: a control point for apoptosis. Science. 2003;300(5616):135–139. doi: 10.1126/science.1081208. [DOI] [PubMed] [Google Scholar]
- Simmen T, Aslan JE, Blagoveshchenskaya AD, Thomas L, Wan L, Xiang Y, Feliciangeli SF, Hung CH, Crump CM, Thomas G. PACS-2 controls endoplasmic reticulum-mitochondria communication and Bid-mediated apoptosis. EMBO J. 2005;2323(4):717–729. doi: 10.1038/sj.emboj.7600559. 24. [DOI] [PMC free article] [PubMed] [Google Scholar]
- Smida M, Posevitz-Fejar A, Horejsi V, Schraven B, Lindquist JA. A novel negative regulatory function of the phosphoprotein associated with glycosphingolipid-enriched microdomains: blocking Ras activation. Blood. 2007;110:596–615. doi: 10.1182/blood-2006-07-038752. [DOI] [PubMed] [Google Scholar]
- Suen DF, Norris KL, Youle RJ. Mitochondrial dynamics and apoptosis. Genes Dev. 2008;22:1577–1590. doi: 10.1101/gad.1658508. [DOI] [PMC free article] [PubMed] [Google Scholar]
- Suzuki YAO, Namba E. β-Galactosidase Deficiency (β-Galactosialidosis): GM1 Gangliosidosis and Morquio B Disease. In: Scriver CR, Beaudet AL, Sly WS, Valle D, editors. The Metabolic and Molecular Basis of Inherited Disease. New York: McGraw-Hill; 2001. 2001. pp. 3775–3810. [Google Scholar]
- Szabadkai G, Bianchi K, Varnai P, De Stefani D, Wieckowski MR, Cavagna D, Nagy AI, Balla T, Rizzuto R. Chaperone-mediated coupling of endoplasmic reticulum and mitochondrial Ca2+ channels. J Cell Biol. 2006;175:901–911. doi: 10.1083/jcb.200608073. [DOI] [PMC free article] [PubMed] [Google Scholar]
- Tessitore A, del Pilar Martin M, Sano R, Ma Y, Mann L, Ingrassia A, Laywell ED, Steindler DA, Hendershot LM, d'Azzo A. A GM1-ganglioside-mediated activation of the unfolded protein response causes neuronal death in a neurodegenerative gangliosidosis. Mol Cell. 2004;15:753–766. doi: 10.1016/j.molcel.2004.08.029. [DOI] [PubMed] [Google Scholar]
- Vance JE. Phospholipid synthesis in a membrane fraction associated with mitochondria. J Biol Chem. 1990;265:7248–7256. [PubMed] [Google Scholar]
- Wu G, Lu ZH, Obukhov AG, Nowycky MC, Ledeen RW. Induction of calcium influx through TRPC5 channels by cross-linking of GM1 ganglioside associated with alpha5beta1 integrin initiates neurite outgrowth. J Neurosci. 2007;27:7447–7458. doi: 10.1523/JNEUROSCI.4266-06.2007. [DOI] [PMC free article] [PubMed] [Google Scholar]
Associated Data
This section collects any data citations, data availability statements, or supplementary materials included in this article.
Supplementary Materials
Figure S1. TLC Plates
Entire TLC plates of total lipid extracts from (A) mitochondria, (B) MAMs fractions isolated from β-gal+/+ and β-gal−/− brains (d=days and m=months). Purified GM1 was used as standard (STD).
Figure S2. Mitochondrial Ca2+ Overload Causes Alteration in Mitochondrial Morphology
(A) Mitochondria of β-gal+/+, β-gal+/+ -loaded with GM1 and β-gal−/− MEFs and neurospheres were labeled with the Mitotracker Red. Cells were incubated with Mitotracker and visualized by confocal laser microscopy.
(B and C) Quantification of the percentage of rounded versus elongated mitochondria in β-gal+/+, β-gal+/+-loaded with GM1 and β-gal−/− MEFs and neurospheres.
Figure S3. Quantification of expression levels of MFN2 and IP3R-1 after silencing
(A) β-gal−/− MEFs and (B) β-gal+/+ MEFs transfected with MFN2 siRNA. Bars indicate the ratio between the expression levels of MFN2 and actin. Untreated, mock transfected and scrambled transfected MEFs were used as controls.
(C) β-gal−/− MEFs and (D) β-gal+/+ MEFs transfected with IP3R-1 siRNA. Bars indicate the ratio between the expression levels of IP3R-1 and actin. Untreated, mock transfected and scrambled transfected MEFs were used as controls.
Figure S4. GM1 Induces Caspase-Mediated DNA Fragmentation
(A) Levels of AIF in mitochondria (M) and cytosol (C) isolated from β-gal+/+ and β-gal-/- brains were tested by western blot analysis. The antibody used recognizes both the precursor (pAIF, inactive) and the mature form of AIF (mAIF, active). Blotting is representative of three separate experiments.
(B) DNA isolated from the cerebral cortex of β-gal+/+ and β-gal-/- was run on agarose gel. DNA fragmentation was detected as a DNA-ladder. U937 cells were used as positive control.