

SUMMARY
In this systematic review, walking (a generally accessible activity for a largely sedentary population), was assessed as a preventive risk factor for development of fatal and nonfatal cardiovascular disease (CVD). PubMed, CINHAL, and reference list searches identified 21 peer reviewed publications examining walking in relation to CVD; studies assessing active transportation were excluded. Generally, there were dose-dependent reductions in CVD risk with higher walking duration, distance, energy expenditure, and pace. Associations appeared to be stronger for ischemic stroke than other CVD outcomes such as CHD or hemorrhagic stroke. Adjustment for clinical CVD risk factors, obesity, or other types of physical activity generally attenuated but did not eliminate associations. Because functional status may be an important determinant of walking behavior in adults, potential bias due to pre-existing illness is of concern in all studies reviewed, particularly in case-control studies which ascertain walking retrospectively and yielded the strongest associations. Study findings were consistent with current physical activity recommendations, but opportunities for future research include improvements in measurement of walking and other CVD risk factors, more thorough control for pre-existing illness, examination of mediating or moderating conditions such as obesity, and other analytical issues.
Keywords: walking, physical activity, cardiovascular diseases, review
INTRODUCTION
Physical activity (PA) recommendations from the American College of Sports Medicine and American Heart Association (AHA) include moderate intensity PA (MPA) for prevention of chronic conditions such as obesity (1–3) and cardiovascular disease (CVD), major contributors to mortality and morbidity in the United States (4) and globally (5). While overall PA is a well established determinant of numerous health outcomes (3, 4), the health benefits of MPA (3) remain unclear (6, 7). Walking is the most common PA among adults (8, 9) and an accessible form of MPA particularly relevant for the obese, who are less likely to perform vigorous PA (VPA) (10). Therefore, understanding the relationship between walking and CVD is especially valuable.
A recent meta-analysis found dose-dependent, negative associations of walking with CVD and all-cause mortality (11). While promising, pooled results do not address variability in findings which may result from methodological differences among studies or mechanistic differences among CVD outcomes. Study results may be sensitive to adjustment for other types of PA or clinical CVD risk factors such as body weight, blood pressure or serum lipid levels (12, 13). Additionally, the numerous coronary and stroke outcomes encompassed by CVD have shared and independent etiologies (4), so walking may affect specific CVD diseases or conditions differently.
Examination of these complexities can improve understanding of the causal relationship between walking and CVD, the mediating role of other CVD determinants, and etiological differences between CVD outcomes, as well as identify methodological improvements for future work. Existing literature reviews assessing walking effects on CVD do not address these issues or are non-systematic (14, 15). We conducted a systematic review with the following objectives: (a) to compare and synthesize existing observational evidence of the relationship between walking and CVD risk, (b) to explore discrepant findings with regard to variations in study design and analysis, and (c) to make recommendations for future study.
METHODS
Search Criteria
Because research on the health effects of walking was scant prior to 1995, when MPA was added to PA recommendations (2, 16), we conservatively included studies that examined the association between walking and CVD and were published several years prior (January 1, 1990) through July 31, 2007. Consistent with the AHA CVD definition (4, 17), our search included terms related to coronary heart disease (CHD) and stroke.
We defined walking as total or leisure walking and excluded studies that examined walking in combination with cycling (e.g., (18, 19)) or walking for transportation (e.g., (20–22)) because it was usually combined with cycling. Cycling can be performed at high intensities (23), is more strongly related to other types of PA (24), and likely contributes to combined measures (walking and cycling) differentially across gender (24) and countries (25).
Search criteria were developed and validated against a known set of relevant publications, then applied to two databases: (a) PubMed was searched for “walking” and “coronary arteriosclerosis,” “cardiovascular diseases,” “cerebrovascular accident”, or “cardiovascular surgical procedures” in Medical Subject Heading (MeSH) or text fields. Additional CVD terms were included in the text search. The PubMed search targeted observational studies by including terms such as prevention and control, epidemiology, primary prevention, or risk factors. To include observational arms of clinical trials, publication type was not used to filter clinical trials. (b) The Cumulated Index to Nursing and Allied Health Literature (CINHAL) was searched using parallel terms within main headings and abstract text. Publications with “rehabilitation” or “diagnosis” in the subject heading were excluded.
A primary reviewer screened publications using six inclusion criteria: (a) study population of healthy human adults, (b) walking as exposure, (c) fatal or nonfatal CVD as outcome, (d) observational cohort or case-control design, (e) publication in English, and (f) peer reviewed. Studies assessing walking for secondary prevention among CVD patients were excluded (e.g., (26, 27)). Intervention studies were excluded due to short term follow-up and distinct limitations and biases. Cross-sectional studies were excluded given the quantity of longitudinal studies on this topic. Case-control designs were included because they are commonly used to study acute conditions such as myocardial infarction and stroke. Non-peer reviewed studies were excluded because they could not be systematically searched and have not been appraised through peer review. One study meeting inclusion criteria was excluded because only age-adjusted rates were reported (28), reducing comparability to other studies.
Publications were screened first by title; if the title was ambiguous with regard to inclusion criteria, the abstract and/or full article was retrieved and reviewed. To supplement the literature database searches, we conducted a manual search designed to capture references missing due to subject terms employed by the database provider, author, or publisher. Reference lists of included studies and related review articles were scanned using the same protocol; potential publications were screened according to the same inclusion criteria.
Data abstraction and synthesis
A priori data elements were extracted by the primary reviewer. One of three secondary reviewers verified the extracted information. Disagreements were resolved discursively.
Some effect estimates were converted to reflect walking associations relative to the lowest walking category: the effect (risk ratio (RR), hazard ratio (HR), or odds ratio (OR)) for each category was divided by the effect for the lowest walking category. To illustrate the overall dose-response relationship, walking measures were converted into Metabolic Equivalent (MET)-hours/week assuming 3 MET intensity (2.5 mph (23)) and, for conversion of kilocalories, 150 pound body weight (approximately the average weight of U.S. females (29)). The midpoint of each MET-hours/week category was plotted against the reported or converted, fully adjusted effect estimate; when the upper limit of the largest walking category was unreported, it was assigned as twice the value of the lower limit. Converted estimates were used for interpretation and in the dose-response figure but not included in the tables presented.
We report “minimal adjustment” and “full adjustment” results when available. Generally, minimal adjustment included age and basic characteristics such as race or study center, and full adjustment included various combinations of socioeconomic measures, other health-related behaviors, or parental history of CVD. We specifically report adjustment for key variables of interest: other PA, diet, clinical CVD risk factors (e.g., blood lipids, blood pressure, body mass index (BMI)), and pre-existing conditions.
Assessment of validity and test-retest reliability of the walking assessment tools referenced in the reviewed articles were extracted. Walking was generally one component of total PA assessment, so we distinguish between measurement properties of the overall PA assessment instrument versus walking measure.
Studies were grouped by and compared within comparable walking measures (frequency, duration, distance, or pace). Results are separated by case-control versus cohort design because of distinct biases inherent to each design.
RESULTS
The PubMed search returned 507 publications; of these, 96 abstracts or papers were considered for full review and 19 met all eligibility criteria. The CINHAL search returned 487 publications; of these, 10 abstracts or papers not already reviewed were considered for full review, and none met all eligibility criteria. Reference list searches identified 2 additional papers for inclusion, for a total of 21 studies included in this systematic review.
Walking measures were self-reported and represented walking frequency, duration (Table 1), distance (Table 2), energy expenditure (Table 3), or pace (Table 4). Case-control studies are presented in Table 5. While distance and energy expenditure are determined in part by walking pace, they were generally ascertained independently of walking pace. Therefore, we interpreted walking pace as intensity, and remaining measures as “volume.” Walking exposures were often secondary to general measures of PA. Study outcomes included fatal and nonfatal CHD, total CVD, other CVD (primarily stroke), stroke (total, ischemic, or hemorrhagic), and myocardial infarction (MI).
Table 1.
Cohort studies assessing the association between walking frequency and duration and CVD
| Estimate (95% CI) | Adjustment (fullest) | |||||||||
|---|---|---|---|---|---|---|---|---|---|---|
| Study | Outcome [Follow-up duration] |
Valid | Subgroup | Exposure category | Minimal Adjustment |
Full Adjustment |
Other PA |
Diet | CVD Risk Facto rs |
Pre- existing illness |
| Atherosclerosis Risk in Communities Study (ARIC) | Ischemic stroke [average 7.2 years] | PA | Males & females | Walking often/very often during leisure (baseline) [HR] | 0.87 (0.60–1.26) | (not reported) | No | No | No | No |
| Evenson et al, 1999 (30) | ||||||||||
| 45–64 years | ||||||||||
| n=14,575 | ||||||||||
| Atherosclerosis Risk in Communities Study (ARIC) | CHD (fatal or nonfatal) [4–7 years] | PA | Males | Walking often/very often during leisure (baseline) [HR] | 0.75 (0.53–1.06) | (not reported) | No | No | No | No |
| Folsom 1997 (31) | ||||||||||
| 45–64 yrs | ||||||||||
| n=14,040 | ||||||||||
| Females | Walking often/very often during leisure (baseline) [HR] | 0.62 (0.35–1.09) | (not reported) | |||||||
| Group Health Cooperative of Puget Sound (GHC) | CVD Hospitalization (CHD or other CVD) [4–5 years] | -- | Males & Females | Walking duration/week (at baseline) [HR] | p trend <0.05 | p trend <0.05 | Yes* | No | Yes | Yes |
| LaCroix et al, 1996 (34) | <1 hr | 1 | 1 | |||||||
| 65+ years | 1–4 hr | 0.86 (0.66–1.11) | 0.90 (0.69–1.17) | |||||||
| n=1,645 | >4 hr | 0.69 (0.52–0.90) | 0.73 (0.55–0.96) | |||||||
| CHD Hospitalization [4–5 years] | -- | Males & Females | p trend <0.05 | p trend <0.05 | ||||||
| <1 hr | 1 | 1 | ||||||||
| 1–4 hr | 0.89 (0.58–1.37) | 0.93 (0.60–1.44) | ||||||||
| >4 hr | 0.64 (0.40–1.01) | 0.63 (0.38–1.03) | ||||||||
| Other CVD Hospitalization [4–5 years] | Males & Females | p trend<0.05 | p trend<0.05 | |||||||
| <1 hr | 1 | 1 | ||||||||
| 1–4 hr | 0.82 (0.61–1.10) | 0.86 (0.63–1.17) | ||||||||
| >4 hr | 0.69 (0.50–0.94) | 0.75 (0.55–1.04) | ||||||||
| Total CVD (CVD hospitalization or CVD death) [4–5 years] | Males & Females | p trend<0.05 | p trend<0.05 | |||||||
| <1 hr | 1 | 1 | ||||||||
| 1–4 hr | 0.87 (0.67–1.12) | 0.90 (0.70–1.17) | ||||||||
| >4 hr | 0.70 (0.54–0.92) | 0.74 (0.56–0.98) | ||||||||
| Women’s Health Study | CHD (fatal or nonfatal) [average 5 years] | PA | Females no VPA | Time spent walking/wk (baseline) [HR] | p trend<0.001 | p trend<0.001 | –VPA | Yes | No | No |
| Lee et al, 2001 (32) | do not walk regularly | 1 | 1 | |||||||
| 45+ years | 1–59 min | 0.68 (0.46–0.99) | 0.86 (0.57–1.29) | |||||||
| n=22,865 | 1.0–1.5 hr | 0.37 (0.22–0.62) | 0.49 (0.28–0.86) | |||||||
| ≥2 hr | 0.33 (0.21–0.52) | 0.48 (0.29–0.78) | ||||||||
| Japan Collaborative Cohort Study for Evaluation of Cancer Risk | CHD mortality [average 9.7 years] | W | Males | Walking time [HR] | Yes | Yes | Yes | Yes* | ||
| Noda et al, 2005 (33) | <0.5 hr/day | 1.45 (0.95–2.22) | 1.56 (1.01–2.41) | |||||||
| 40–79 years | 0.5 | 1 | 1 | |||||||
| n=73,265 | 0.6–0.9 | 0.89 (0.60–1.33) | 0.91 (0.61–1.36) | |||||||
| ≥1.0 | 0.80 (0.57–1.13) | 0.93 (0.66–1.32) | ||||||||
| Females | <0.5 hr/day | 1.12 (0.66–1.93) | 1.04 (0.60–1.80) | |||||||
| 0.5 | 1 | 1 | ||||||||
| 0.6–0.9 | 0.82 (0.52–1.32) | 0.82 (0.51–1.32) | ||||||||
| ≥1.0 | 0.64 (0.42–0.97) | 0.74 (0.49–1.13) | ||||||||
| Total CVD mortality | Males | <0.5 hr/day | 1.24 (1.01–1.52) | 1.21 (0.98–1.49) | ||||||
| 0.5 | 1 | 1 | ||||||||
| 0.6–0.9 | 0.79 (0.66–0.96) | 0.83 (0.68–1.00) | ||||||||
| ≥1.0 | 0.78 (0.67–0.92) | 0.85 (0.72–1.00) | ||||||||
| Females | <0.5 hr/day | 1.59 (1.28–1.99) | 1.50 (1.20–1.87) | |||||||
| 0.5 | 1 | 1 | ||||||||
| 0.6–0.9 | 0.86 (0.70–1.06) | 0.87 (0.70–1.07) | ||||||||
| ≥1.0 | 0.79 (0.66–0.94) | 0.85 (0.70–1.02) | ||||||||
| Total stroke mortality | Males | <0.5 hr/day | 1.24 (0.91–1.68) | 1.15 (0.84–1.57) | ||||||
| 0.5 | 1 | 1 | ||||||||
| 0.6–0.9 | 0.76 (0.57–1.01) | 0.79 (0.59–1.05) | ||||||||
| ≥1.0 | 0.81 (0.64–1.02) | 0.84 (0.67–1.07) | ||||||||
| Females | <0.5 hr/day | 1.69 (1.23–2.32) | 1.66 (1.20–2.30) | |||||||
| 0.5 | 1 | 1 | ||||||||
| 0.6–0.9 | 0.81 (0.59–1.10) | 0.82 (0.60–1.12) | ||||||||
| ≥1.0 | 0.87 (0.67–1.13) | 0.93 (0.72–1.21) | ||||||||
| Ischemic stroke mortality | Males | <0.5 hr/day | 1.12 (0.69–1.81) | 1.03 (0.63–1.69) | ||||||
| 0.5 | 1 | 1 | ||||||||
| 0.6–0.9 | 0.54 (0.33–0.86) | 0.56 (0.35–0.91) | ||||||||
| ≥1.0 | 0.67 (0.47–0.96) | 0.71 (0.49–1.02) | ||||||||
| Females | <0.5 hr/day | 1.53 (0.92–2.55) | 1.38 (0.82–2.33) | |||||||
| 0.5 | 1 | 1 | ||||||||
| 0.6–0.9 | 0.54 (0.32–0.94) | 0.56 (0.32–0.97) | ||||||||
| ≥1.0 | 0.67 (0.44–1.03) | 0.73 (0.48–1.13) | ||||||||
| Intraparenchymal hemorrhage mortality | Males | <0.5 hr/day | 1.12 (0.63–1.99) | 1.12 (0.62–2.02) | ||||||
| 0.5 | 1 | 1 | ||||||||
| 0.6–0.9 | 0.84 (0.50–1.43) | 0.88 (0.52–1.49) | ||||||||
| ≥1.0 | 0.64 (0.41–1.00) | 0.73 (0.46–1.16) | ||||||||
| Females | <0.5 hr/day | 1.87 (0.95–3.66) | 1.89 (0.95–3.76) | |||||||
| 0.5 | 1 | 1 | ||||||||
| 0.6–0.9 | 0.92 (0.47–1.78) | 0.95 (0.49–1.84) | ||||||||
| ≥1.0 | 0.85 (0.48–1.50) | 0.93 (0.52–1.66) | ||||||||
| Subarachnoid hemorrhage mortality | Males | <0.5 hr/day | 0.93 (0.34–2.55) | 0.97 (0.35–2.73) | ||||||
| 0.5 | 1 | 1 | ||||||||
| 0.6–0.9 | 0.67 (0.25–1.76) | 0.67 (0.25–1.77) | ||||||||
| ≥1.0 | 1.24 (0.61–2.51) | 1.26 (0.61–2.60) | ||||||||
| Females | <0.5 hr/day | 1.32 (0.61–2.87) | 1.40 (0.64–3.08) | |||||||
| 0.5 | 1 | 1 | ||||||||
| 0.6–0.9 | 1.14 (0.58–2.23) | 1.08 (0.55–2.11) | ||||||||
| ≥1.0 | 1.21 (0.68–2.15) | 1.22 (0.68–2.19) | ||||||||
n, sample size included in reported analysis
Valid: Reliability and validity of physical activity (PA) assessment tested. W, walking instrument was validated; PA, only total PA measure was validated; --, validation not noted
Subgroup: no VPA=those reporting vigorous PA (VPA) were excluded from analysis
Exposure category: Measure (reference period, data collection period) [effect measure: OR=odds ratio; RR=risk ratio; HR=hazard ratio]; bold indicates statistical significance Minimal Adjustment, usually including age, basic demographics; Full Adjustment, not limited to those specified under “Adjustment variables”
Adjustment: -VPA, excluded those with VPA to adjustment for other PA
not included in final model, but authors reported that adjustment did not alter findings
Pre-existing illness: Table 6 presents details about methods used to control for pre-existing illness
Table 2.
Cohort studies assessing the association between walking distance and CVD
| Estimate(95%CI) | Adjustment (fullest) | |||||||||
|---|---|---|---|---|---|---|---|---|---|---|
| Study | Outcome [Follow-up duration] |
Valid | Subgroup | Exposure category | Minimal Adjustment |
Full Adjustment |
Other PA |
Diet | CVD Risk Facto rs |
Pre- existing illness |
| Honolulu Heart Program | CHD or stroke mortality | -- | Males | Distance walked/day (at baseline) [HR] | p trend=0.14 | p trend=0.32 | Yes | Yes | Yes | Yes |
| Hakim et al, 1998 (36) | [12 years] | 0–0.9 vs 2.1–8.0 mi/day | 3.1 (0.8–11.9) | 2.6 (0.7–10.3) | ||||||
| 61–81 years | 0–0.9 vs 1.0–2.0 mi/day | 1.2 (0.5–2.8) | 1.1 (0.4–2.5) | |||||||
| n=707 | 1.0–2.0 vs 2.1–8.0 mi/day | 2.6 (0.8–8.9) | 2.5 (0.7–8.6) | |||||||
| Honolulu Heart Program | CHD (fatal or nonfatal) | -- | Males >0 mi/day walking | Walking distance/day (at baseline) [HR] | p trend=0.002 | p trend=0.002 | No | No | Yes | Yes |
| Hakim et al, 1999 (35) | [2–4 years] | <0.25 vs >1.5 mi/day | 2.2 (1.3–3.7) | 2.3 (1.3–4.1) | ||||||
| 71–93 years | 0.25 to 1.5 vs >1.5 mi/day | 1.8 (1.1–3.0) | 2.1 (1.2–3.6) | |||||||
| n=2,678 | <0.25 vs. 0.25–1.5 mi/day | 1.2 (0.8–1.8) | 1.1 (0.7–1.7) | |||||||
| Harvard Alumni Health Study | Stroke (fatal or nonfatal) | W | Males | Distance walked/week (at baseline) [HR] | (not reported) | p trend=0.05 | Yes | No | No | No |
| Lee et al, 1998 (38) | [13 years] | <5 km/wk | 1 | |||||||
| 43–88 years | 5 to <10 | 1.06 (0.80–1.40) | ||||||||
| n=11,130 | 10 to <20 | 1.01 (0.77–1.31) | ||||||||
| ≥20 | 0.71 (0.52096) | |||||||||
| College Alumni Health Study | CVD (fatal or nonfatal) | PA | Females | Blocks walked per day (at baseline) [HR] | p trend=0.09 | p trend=0.054 | Yes | No | Yes | No |
| Sesso etal, 1999 (40) | [median 20 years] | <4 | 1 | 1 | ||||||
| 37–69 years | 4–9 | 0.89 (0.63–1.25) | 0.84 (0.59–1.19) | |||||||
| n=1,564 | ≥10 | 0.73 (0.51–1.06) | 0.67 (0.45–1.01) | |||||||
| Harvard Alumni Health Study | CHD (fatal or nonfatal) | W | Males | Distance walked/week (at baseline, past year) [HR] | (not reported) | p trend=0.08 | Yes | No | Yes | No |
| Sesso et al, 2000 (39) | [16 years] | <5 km/wk | 1.0 | |||||||
| 39–88 years | 5 to <10 | ≈0.9 | ||||||||
| n=12,516 | 10 to <20 | ≈0.9 | ||||||||
| ≥20 | ≈0.9 | |||||||||
| Residents of Rancho Bernardo, CA | CHD mortality | -- | Males & Females w/normal glucose | Distance walked per day (at baseline) [HR] | Yes | No | Yes | Yes | ||
| Smith et al, 2007 (37) | non walker | (not reported) | 1 | |||||||
| 50–90 years | <1 mile walker | 1.14 (0.67–1.94) | ||||||||
| n=1,317w/normal glucose | ≥1 mile walker | 1.29 (0.73–2.28) | ||||||||
| Other CVD mortality | Males & Females w/normal glucose | non walker | (not reported) | 1 | ||||||
| [10 years] | <1 mile walker | 0.77 (0.48–1.21) | ||||||||
| ≥1 mile walker | 0.55 (0.32–0.96) | |||||||||
n, sample size included in reported analysis
Valid: Reliability and validity of physical activity (PA) assessment tested. W, walking instrument was validated; PA, only total PA measure was validated; --, validation not noted
Subgroup: no VPA=those reporting vigorous PA (VPA) were excluded from analysis
Exposure category: Measure (reference period, data collection period) [effect measure: OR=odds ratio; RR=risk ratio; HR=hazard ratio]; bold indicates statistical significance Minimal Adjustment, usually including age, basic demographics; Full Adjustment, not limited to those specified under “Adjustment variables”
Adjustment: -VPA, excluded those with VPA to adjustment for other PA
not included in final model, but authors reported that adjustment did not alter findings
Pre-existing illness: Table 6 presents details about methods used to control for pre-existing illness
Table 3.
Cohort studies assessing the association between energy expenditure from walking and CVD
| Estimate (95% CI) | Adjustment (fullest) | |||||||||
|---|---|---|---|---|---|---|---|---|---|---|
| Study | Outcome [Follow-up dur] |
Valid | Subgroup | Exposure category | Minimal Adjustment |
Full Adjustment |
Other PA |
Diet | CVD Risk Facto rs |
Pre- existing illness |
| Study of Osteoporotic Fractures | CVD mortality | -- | Females | Weekly walking EE (quintile) (at baseline) | (rates) | [HR] | No | No | Yes | Yes |
| [12.5 years] | ||||||||||
| Gregg et al, 2003 (44) | 1: <70 kcal/week | 13.0 | 1 | |||||||
| 65+ years | 2: 70–186 | 11.3 | 0.88 (0.73–1.06) | |||||||
| n=9,518 | 3: 187–419 | 7.6 | 0.66 (0.53–0.82) | |||||||
| 4: 420–897 | 7.7 | 0.68 (0.55–0.84) | ||||||||
| 5: ≥898 | 7.3 | 0.61 (0.49–0.78) | ||||||||
| Nurses Health Study | Total Stroke (fatal or nonfatal) | PA | Females no VPA | Walking MET-hr/wk Quintile [cumulative average] [RR] | -VPA | No | Yes | No | ||
| Hu et al, 2000 (41) | ||||||||||
| 40–65 years | [8 years] | p trend=0.10 | ||||||||
| n=72,488 | 1 (0; <=0.5) | (not reported) | 1 | |||||||
| 2 (1.7; 0.6–2.0) | 0.71 | |||||||||
| 3 (3.0; 2.1–3.8) | 0.78 | |||||||||
| 4 (7.5; 3.9–10) | 0.74 | |||||||||
| 5 (20; >=10.0) | 0.64 | |||||||||
| Total Stroke (fatal or nonfatal) | Females | p trend<0.001 | p trend=0.01 | Yes | No | Yes | No | |||
| 1 (0; <=0.5) | 1 | 1 | ||||||||
| 2 (1.7; 0.6–2.0) | 0.71 (0.52–0.96) | 0.76 (0.56–1.04) | ||||||||
| 3 (3.0; 2.1–3.8) | 0.66 (0.48–0.90) | 0.78 (0.56–1.07) | ||||||||
| 4 (7.5; 3.9–10) | 0.54 (0.40–0.72) | 0.70 (0.52–0.95) | ||||||||
| 5 (20; >=10.0) | 0.49 (0.36–0.67) | 0.66 (0.48–0.91) | ||||||||
| Ischemic stroke (fatal or nonfatal) | Females | p trend=0.02 | p trend<0.001 | Yes | No | Yes | No | |||
| 1 (0; <=0.5) | 1 | 1 | ||||||||
| 2 (1.7; 0.6–2.0) | 0.73 (0.50–1.08) | 0.77 (0.52–1.13) | ||||||||
| 3 (3.0; 2.1–3.8) | 0.65 (0.44–0.97) | 0.75 (0.50–1.12) | ||||||||
| 4 (7.5; 3.9–10) | 0.55 (0.38–0.79) | 0.69 (0.47–1.01) | ||||||||
| 5 (20; >=10.0) | 0.44 (0.30–0.66) | 0.60 (0.39–0.90) | ||||||||
| Total Hemorrhagic Stroke (fatal or nonfatal) | Females | p trend=0.98 | p trend=0.99 | Yes | No | Yes | No | |||
| 1 (0; <=0.5) | 1 | 1 | ||||||||
| 2 (1.7; 0.6–2.0) | 0.72 (0.39–1.34) | 0.79 (0.42–1.48) | ||||||||
| 3 (3.0; 2.1–3.8) | 0.74 (0.40–1.38) | 0.88 (0.47–1.65) | ||||||||
| 4 (7.5; 3.9–10) | 0.60 (0.33–1.09) | 0.72 (0.39–1.33) | ||||||||
| 5 (20; >=10.0) | 0.83 (0.46–1.47) | 1.02 (0.57–1.84) | ||||||||
| Nurses Health Study | Coronary events (fatal or nonfatal) | PA | Females No VPA | Walking MET-hr/wk Quintile (cumulative average) [RR] | p trend<0.001 | p trend=0.02 | -VPA | (supplements) | Yes | Yes* |
| Manson et al, 1999 (43) | ||||||||||
| 40–65 years | [8 years] | |||||||||
| n=72,488 | 1 (0; ≤0.5) | 1 | 1 | |||||||
| 2 (1.7; 0.6–2.0) | 0.69 (0.50–0.93) | 0.78 (0.57–1.06) | ||||||||
| 3 (3.0; 2.1–3.8) | 0.71 (0.53–0.97) | 0.88 (0.65–1.21) | ||||||||
| 4 (7.5; 3.9–9.9) | 0.52 (0.38–0.70) | 0.70 (0.51–0.95) | ||||||||
| 5 (20; ≥10.0) | 0.46 (0.33–0.63) | 0.65 (0.47–0.91) | ||||||||
| Women’s Health Initiative Observational Study | CHD (fatal or nonfatal) | PA | Females | Walking MET-hr/wk Quintile (baseline) [HR] | p trend=0.004 | (not reported) | No | No | No | Yes |
| Manson et al, 2002 (42) | [up to 5.9 years] | 1 (0) | 1 | |||||||
| 50–79 years | 2 (1.5; 0.1–2.5) | 0.71 (0.53–0.96) | ||||||||
| n=73,743 | 3 (3.8; 2.6–5.0) | 0.60 (0.44–0.83) | ||||||||
| 4 (7.5; 5.1–10.0) | 0.54 (0.39–0.76) | |||||||||
| 5 (16.7; >10.0) | 0.61 (0.44–0.84) | |||||||||
| Total CVD | Females | p trend<0.001 | p trend<0.001 | Yes* | Yes | Yes* | Yes | |||
| 1 (0) | 1 | 1 | ||||||||
| 2 (1.5; 0.1–2.5) | 0.88 (0.77–1.01) | 0.91 (0.78–1.07) | ||||||||
| 3 (3.8; 2.6–5.0) | 0.70 (0.60–0.81) | 0.82 (0.69–0.97) | ||||||||
| 4 (7.5; 5.1–10.0) | 0.66 (0.57–0.77) | 0.75 (0.63–0.89) | ||||||||
| 5 (16.7; >10.0) | 0.58 (0.49–0.68) | 0.68 (0.56–0.82) | ||||||||
| Health Professionals Follow-up Study | CHD (fatal or nonfatal) | PA | Males | Walking MET-hr/wk quintiles (cumulative average) [HR] | p trend=0.002 | p trend=0.04 | -VPA | Yes | Yes | Yes |
| Tanasescu et al, 2002 (45) | [12 years] | <1hr/wk VPA | ||||||||
| 40–75 years | 1 (0–1.19) | 1 | 1 | |||||||
| n=44,452 | 2 (1.2–3.49) | 0.97 (0.81–1.17) | 1.00 (0.83–1.21) | |||||||
| 3 (3.5–6.99) | 0.86 (0.70–1.04) | 0.90 (0.74–1.10) | ||||||||
| 4 (7.0–14.74) | 0.95 (0.78–1.15) | 1.02 (0.84–1.23) | ||||||||
| 5 (≥14.75) | 0.74 (0.61–0.90) | 0.82 (0.67–1.00) | ||||||||
n, sample size included in reported analysis
Valid: Reliability and validity of physical activity (PA) assessment tested. W, walking instrument was validated; PA, only total PA measure was validated; --, validation not noted
Subgroup: no VPA=those reporting vigorous PA (VPA) were excluded from analysis
Exposure category: Measure (reference period, data collection period) [effect measure: OR=odds ratio; RR=risk ratio; HR=hazard ratio]; bold indicates statistical significance Minimal Adjustment, usually including age, basic demographics; Full Adjustment, not limited to those specified under “Adjustment variables”
Adjustment: -VPA, excluded those with VPA to adjustment for other PA
not included in final model, but authors reported that adjustment did not alter findings
Pre-existing illness: Table 6 presents details about methods used to control for pre-existing illness
Table 4.
Cohort studies assessing the association between walking pace and CVD
| Estimate (95% CI) | |||||
|---|---|---|---|---|---|
| Study | Outcome [Follow–up dur] | Population/ Subgroup | Exposure | Minimal Adjustment | Full Adjustment |
| Whitehall Study (UK) | CHD mortality | Males w/out disease at entry | Walking pace compared to men of same age [HR] | (not reported for subjects w/out disease at entry) | p trend<0.01 |
| Davey Smith et al, 2000 (46) | [25 years] | Slower | 1.45 (0.9–2.2) | ||
| The same | 1.30 (1.1–1.6) | ||||
| Faster | 1.0 | ||||
| Other CVD mortality | Males w/out disease at entry | (not reported for subjects w/out disease at entry) | p trend<0.01 | ||
| Slower | 1.67 (0.9–3.0) | ||||
| The same | 1.28(1.0–1.6) | ||||
| Faster | 1.0 | ||||
| Nurses Health Study | Total Stroke (fatal or nonfatal) | Females | Usual walking pace [RR] | p trend<0.001 | p trend<0.001 |
| Hu et al, 2000 (41) | <2 mph | 1 | 1 | ||
| [8 years] | 2–2.9 mph | 0.66 (0.52–0.83) | 0.81 (0.63–1.03) | ||
| ≥3 mph | 0.36 (0.27–0.48) | 0.49 (0.36–0.68) | |||
| Ischemic Stroke (fatal or nonfatal) | Females | p trend<0.001 | p trend<0.001 | ||
| <2 mph | 1 | 1 | |||
| 2–2.9 mph | 0.56 (0.42–0.75) | 0.71 (0.53–0.96) | |||
| ≥3 mph | 0.31 (0.22–0.45) | 0.47 (0.31–0.68) | |||
| Total Hemorrhagic Stroke (fatal or nonfatal) | Females | p trend<0.001 | p trend<0.001 | ||
| <2 mph | 1 | 1 | |||
| 2–2.9 mph | 0.73 (0.45–1.19) | 0.82 (0.50–1.35) | |||
| ≥3 mph | 0.50 (0.29–0.88) | 0.57 (0.31–1.03) | |||
| Women’s Health Study | CHD (fatal or nonfatal) | Females No VPA | Usual walking pace (km/hr) [HR] do not walk regularly | p trend<0.001 | p trend=0.02 |
| Lee et al, 2001 (32) | [average 5 years] | 1 | 1 | ||
| <3.2 | 0.57 (0.35–0.93) | 0.56 (0.32–0.97) | |||
| 3.2–4.7 | 0.50 (0.35–0.72) | 0.71 (0.47–1.05) | |||
| ≥4.8 | 0.33 (0.20–0.54) | 0.52 (0.30–0.90) | |||
| Nurses Health Study | Coronary events (fatal or nonfatal) | Females No VPA | Walking pace [RR] | ||
| Manson et al, 1999 (43) | [8 years] | <2 mph | 1 | 1 | |
| 2–2.9 mph | 0.58 | 0.75 (0.59–0.96) | |||
| ≥3 mph | 0.41 | 0.64 (0.47–0.88) | |||
| Women’s Health Initiative Observational Study | Total CVD | Females | Walking pace [HR] | p trend<0.001 | p trend=0.002 |
| Manson et al, 2002 (42) | [up to 5.9 years] | rarely/never walk | 1 | 1 | |
| <2 mph | 1.07 | 1.06 | |||
| 2–3 mph | 0.73 | 0.86 | |||
| 3–4 mph | 0.57 | 0.76 | |||
| >4 mph | 0.40 | 0.58 | |||
| Health Professionals Follow–up Study | CHD (fatal or nonfatal) | Males | Walking pace (mph) [HR] | p trend<0.001 | p trend<0.001 |
| Tanasescu et al, 2002 (45) | [12 years] | did not perform ≥1 hr/wk | <2 | 1 | 1 |
| VPA | 2–3 | 0.66 (0.53–0.81) | 0.74 (0.60–0.91) | ||
| 3–4 | 0.52 (0.41–0.65) | 0.60 (0.45–0.79) | |||
| >=4 | 0.45 (0.29–0.68) | 0.50 (0.30–0.83) | |||
n, sample size included in reported analysis
Subgroup: no VPA= those reporting vigorous PA (VPA) were excluded from analysis
Table 5.
Case control studies assessing the association between walking and CVD
| Estimate (95% CI) | Adjustment (fullest) | ||||||||||
|---|---|---|---|---|---|---|---|---|---|---|---|
| Study | Outcome | Valid | Subgroup | Exposure category | Minimal Adjustment |
Full Adjustment |
Other PA |
Diet | CVD RFs |
Pre-ex illness |
|
| GISSI-2 (Italy) | Myocardial Infarction (nonfatal) | -- | Males & Females | Walking frequency (index date) [OR] | p trend<0.01 | p trend<0.05 | No | No | Yes | Yes | |
| D’Avanzo et al, 1993 (50) | |||||||||||
| 23–79 years | 1 (highest, appx daily) | 1 | 1 | ||||||||
| n=916 cases, 1,106 controls | 2 | 1.1 (0.9–1.4) | 1.1 (0.9–1.5) | ||||||||
| 3 | 1.4 (1.1–1.8) | 1.2 (0.9–1.6) | |||||||||
| 4 (lowest, appx never) | 1.9 (1.4–2.5) | 1.3 (1.0–1.8) | |||||||||
| Group Health Cooperative of Puget | Myocardial Infarction (nonfatal) | PA | Females | Walking EE (month before index date) [OR] | -Stren. PA | No | Yes | Yes | |||
| * no | |||||||||||
| strenuous PA | 1 (0 kcal/wk) | 1 | 1 | ||||||||
| Lemaitre et al, 1995 (48) | 2 (avg 112 kcal/wk) | 0.37 (0.23–0.58) | 0.38 (0.22–0.65) | ||||||||
| 30–79 years | 3 (avg 379 kcal/wk) | 0.29 (0.18–0.48) | 0.31 (0.18–0.55) | ||||||||
| n=231 cases, 683 controls | 4 (avg 1111 kcal/wk) | 0.36 (0.23–0.58) | 0.34 (0.20–0.59) | ||||||||
| (Lemaitre, cont’d) | Females | 1 (0 kcal/wk) | 1 | -Other | No | Yes | Yes | ||||
| n=95 cases, 215 controls | *no PA | 2 (avg 112 kcal/wk) | 0.59 (0.22–1.57) | PA | |||||||
| other than | 3 (avg 379 kcal/wk) | 0.25 (0.09–0.71) | |||||||||
| walking | 4 (avg 1111 kcal/wk) | 0.11 (0.03–0.34) | |||||||||
| King County, WA Residents | Primary cardiac arrest (fatal or nonfatal) | PA | Males & Females | Walking for exercise | Yes* | Yes* | Yes | Yes | |||
| 1 year prior, at baseline) | |||||||||||
| Lemaitre et al, 1999 (49) | no activity | 1 | 1 | ||||||||
| 25–74 years (cases; | *inactive | walk for ex (≤60 min/wk) | 0.46 (0.21–1.02) | 0.45 (0.17–1.19) | |||||||
| controls age-matched w/in 7 yrs) | or walking, | walk for ex (>60 min/wk) | 0.22 (0.10–0.46) | 0.27 (0.11–0.67) | |||||||
| n=333 cases, 503 controls | no VPA | ||||||||||
| General practices in West Birmingham, UK | Stroke (nonfatal) | -- | Males & females | 1+ miles walking | Yes | No | No | Yes | |||
| Shinton et al, 1993 (47) | outdoors (past month, atoutdoors (past month, at baseline) | 0.3 (0.1–0.7) | 0.32 (0.1–0.7) | ||||||||
| 35–74 years | [HR] | ||||||||||
| n=65 cases, 169 controls in walking analysis | |||||||||||
n, sample size included in reported analysis
Valid: Reliability and validity of physical activity (PA) assessment tested. W, walking instrument was validated; PA, only total PA measure was validated; --, validation not noted
Subgroup: no VPA=those reporting vigorous PA (VPA) were excluded from analysis
Exposure category: Measure (reference period, data collection period) [effect measure: OR=odds ratio; RR=risk ratio; HR=hazard ratio]; bold indicates statistical significance Minimal Adjustment, usually including age, basic demographics; Full Adjustment, not limited to those specified under “Adjustment variables”
Adjustment: -VPA, excluded those with VPA to adjustment for other PA
not included in final model, but authors reported that adjustment did not alter findings
Pre-existing illness: Table 6 presents details about methods used to control for pre-existing illness
Overall Findings
Reviewed studies suggest that walking is associated with lower CVD risk in apparently healthy adults (Table 1–Table 5). Fully adjusted HR’s, RR’s, or OR’s for walking volume ranged from 0.4 to 1.3 for CHD, 0.4 to 0.9 for total CVD, 0.4 to 1.0 for ischemic stroke, and 0.5 to 1.3 for hemorrhagic stroke.
Four issues emerged: 1) dose-response of CVD risk with walking volume and pace; the strength of association varying by 2) study design (case-control or cohort) and 3) study outcome; and 4) analytical issues such as inclusion of clinical CVD risk factors or other PA.
Dose-response
Frequency
Two studies examined frequency, showing non-significant, negative associations with ischemic stroke and CHD (Table 1) (30, 31). Frequency was dichotomized as walking often versus not often, so dose-response was not evaluated.
Duration
In general, there were significant, negative dose-response relationships between weekly walking duration and CVD and CHD (Table 1). In Women’s Health Study participants with no VPA, CHD risk was reduced by 14%, 51%, and 52% in those reporting 1–59 minutes, 1–1.5 hours, and >2 hours/week of walking, respectively, compared to no regular walking (32). Similar patterns were reported in other studies (33, 34).
Distance
Similarly, longer walking distance per week or day was generally associated with incremental reductions in CVD risk (Table 2). In the 2–4 year follow-up of men in the Honolulu Heart Program, statistically significant 9% and 57% reductions (converted from RR=1.1 and 2.3) in fatal or nonfatal CHD were observed for those walking 0.25–1.5 and >1.5 miles/day, respectively, versus >0–<0.25 miles/day (35). Reductions in CHD or stroke mortality among a smaller group of men from the same study population followed over 12 years were similar but not significant (36). Smith et al. reported a non-significant increase in CHD mortality with increasing walking, but a dose-dependent reduction in other CVD mortality for men with longer distance walked (37). Among men in the Harvard Alumni Study, reduction in stroke risk was observed for the highest walking level (38) while reductions in CHD risk (39) plateaued with greater distance walked. For women in the College Alumni Health Study, reductions in CVD risk with greater walking distance were not statistically significant (40).
Energy expenditure from walking
Several studies reported dose-dependent reductions in CVD risk with higher energy expenditure from walking (Table 3) (41–43). For example, among women in the Nurses Health Study who reported no VPA, fully adjusted RR’s for fatal and non-fatal coronary events were 0.78, 0.88, 0.70, and 0.65 for increasing walking MET-hour quintiles (43). However, while women in the Study of Osteoporotic Fractures reporting 187–419 versus <70 kcal/week from walking experienced significant, 34% reductions in CVD mortality, reductions were similar for higher levels of walking (44). Men in the Health Professionals Follow-Up Study with <1 hour/week VPA exhibited an inconsistent dose-response relationship between CHD risk and MET-hours of walking, reaching a small but significant 18% reduction for 14.75 MET-hours of walking/week (approximately 30 minutes/day) compared to those with <1.2 MET-hours/week (45).
An illustration of the dose-response relationship between walking measures (converted into MET-hours/week) and total CVD, CHD, and stroke across studies (Figure 1) shows a generally consistent decrease in CVD risk, with some evidence of a saturation effect with the highest levels of walking.
Figure 1. Dose-response relationships between walking MET-hours/week and risk of specific CVD outcomes.
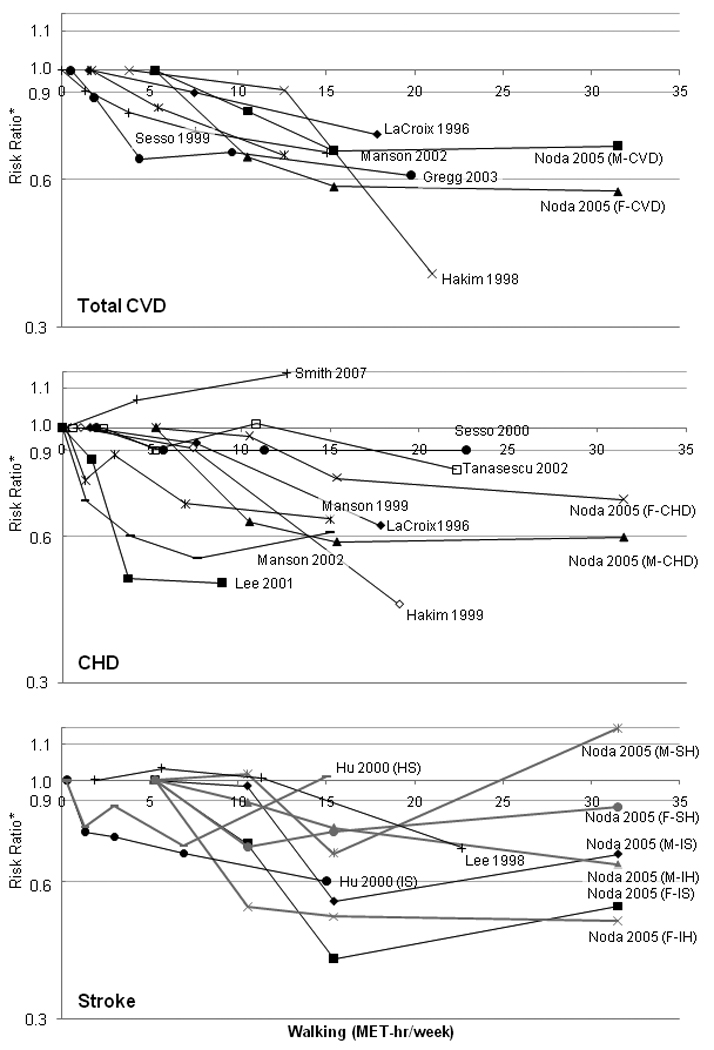
M, Male; F, Female; IS, ischemic stroke; HS, hemorrhagic stroke; IH, intraparenchymal hemorrhage; SH, subarachnoid hemorrhage
Walking measures were converted to MET-hours/week assuming 3-MET intensity on a firm surface, for a 150 pound person. Frequency measures binary and were not included in the graph. Plotted points are equal to the midpoint of each category. In most studies, an upper bound was not reported for the highest walking category; in these cases, the upper bound was assigned twice the value of the lower bound. Associations for outcomes other then the three presented (e.g., “other CVD”) and for total stroke (if stroke subtypes were reported) were excluded from these graphs. Case-control studies were excluded due to non-comparability of estimates to cohort studies.
Pace
Dose-dependent associations between walking pace and CVD were particularly strong (Table 4). In the Health Professionals Follow-Up Study, men reporting walking paces of 2–3, 3–4, and >4 mph experienced significant 26%, 40%, and 50% fully adjusted reductions in risk of fatal and non-fatal CHD compared to <2 mph (45), with little change after adjusting for energy expenditure from walking. Men in the Whitehall Study exhibited similar associations for CHD mortality and stronger associations for other CVD deaths (46). Women’s Health Initiative Observational Study participants reporting walking paces of 2–3, 3–4, and >4 mph experienced a significant negative trend (14%, 24%, and 42% fully adjusted reductions, respectively) in CVD incidence compared to those who rarely or never walk (42). Women in the Nurses Health Study had similar reductions in risk for coronary events (43) and stronger reductions in total stroke (19% and 51% for 2–2.9 mph and ≥3 mph versus <2 mph, respectively) (41). Women’s Health Study participants reporting walking paces of <3.2, 3.2–4.7, and ≥4.8 km/hour (<2, 2–2.9, ≥3 mph) had reductions of 44%, 29%, and 48% in CHD risk, respectively, compared to irregular walkers (32).
Study Design
The majority of studies were prospective, but case-control designs (Table 5) were common for MI and stroke outcomes and yielded the strongest associations. For example, in a case-control study in the United Kingdom, men and women reporting ≥1 mile (versus <1 mile) walking/day had a 68% reduction in non-fatal stroke odds (47). In contrast, in a cohort study of over 14,000 men and women, those walking very often or often (versus not often) had a non-significant, 13% reduction in ischemic stroke despite generally stronger associations for ischemic versus total stroke in other studies (Table 1) (30).
Study Outcome
The patterning of associations by study design makes it difficult to distinguish influences of study design versus outcome on estimated effects. In a case-control study of nonfatal MI, fully adjusted OR’s ranged from 0.31 to 0.38 for walking an average of 112 to 1,111, compared to 0 kilocalories/week from among those reporting no strenuous PA (Table 5) (48). Strong associations between primary cardiac arrest and weekly walking duration (adjusted OR=0.27) were reported in a similar case-control study (Table 5) (49). In contrast, in the Women’s Health Initiative Observational Study, a large, prospective cohort study, fully adjusted RR’s for total CVD ranged from 0.68 to 0.91 for comparable energy expenditure categories (Table 3) (42); estimates were consistent with the majority of cohort studies reviewed. On the other hand, another case-control study reported a moderate, 23% reduction in nonfatal MI odds with daily walking (converted from OR=1.3; Table 5) (50).
Among cohort studies, walking-CVD associations are more consistent for total CVD and ischemic stroke than CHD or hemorrhagic stroke (Figure 1). Studies examining multiple outcomes generally suggested stronger associations with ischemic stroke than CHD or total CVD. Noda et al. found incremental reductions in fully adjusted hazard estimates with increased walking duration in a large cohort of Japanese men and women, reaching 0.56 for ischemic stroke and 0.74 for CHD, but only results for ischemic stroke were statistically significant (Table 1) (33). Men in the Harvard Alumni Study reporting ≥20 km/week (≥1.8 mi/day) versus <5 km/week (<0.45 mi/day) experienced risk reductions of 29% for total stroke (38) and approximately 10% for CHD (39) (Table 2). In contrast, in the Atherosclerosis Risk in Communities Study, frequent walking was associated with 25% and 38% reductions in fatal and nonfatal CHD risk in men and women, respectively (31), and a 13% reduction in ischemic stroke (30), although these associations were not statistically significant (Table 1).
Hu et al. reported stronger associations for ischemic versus hemorrhagic stroke in the Nurses Health Study: fully adjusted HR’s comparing ≥10 versus ≤0.5 MET-hours per week of walking were 0.60 and 1.02 for ischemic and hemorrhagic stroke, respectively. However, statistical power was limited by the small number of hemorrhagic stroke events, and related estimates were generally negative but not statistically significant and did not exhibit a dose-response (Table 3) (41). Similarly, Noda et al. found non-significant, inconsistent associations for two hemorrhagic stroke subtypes (Table 1) (33).
Analytical Issues
Several analytical issues emerged in the reviewed studies: (1) whether results were adjusted for clinical CVD risk factors such as BMI, blood pressure, or lipid profiles, (2) the method used to control for other PA, and (3) strategies to control for pre-existing illness.
Adjustment variables
Studies generally adjusted for a series of clinical CVD risk factors and other PA simultaneously or for neither set of variables, precluding distinction of the impacts of adjustment for specific risk factors (e.g., BMI or blood pressure) or other PA on study results. Adjustment for clinical CVD risk factors and other PA generally attenuated but did not eliminate the association between walking and CVD. For example, in the Nurses Health Study, a 54% reduction in fatal and non-fatal CHD events associated with accumulation of ≥10 versus <5 MET-hours/week of walking was attenuated to 35% but remained significant after adjusting for clinical CVD risk factors (Table 3) (43). In other studies, adjustment for clinical CVD risk factors and/or other PA resulted in negligible changes in estimated associations. For example, reduction in CHD risk for men in the Honolulu Heart Program reporting >1.5 versus <0.25 miles was 55% and 57% before and after adjusting for clinical CVD risk factors, respectively, after converting to preventive effects of walking (Table 2) (35).
Strategies to control for other PA
Other PA was generally defined as VPA or other measures such as sports participation (33) or exercise frequency (37). Studies excluding subjects with no VPA (32, 43, 45, 48) yielded similar associations to covariate adjustment for other PA. Hu et al. found similar walking-total stroke associations after controlling (versus excluding) for VPA (HR=0.66 and 0.64, respectively, for the highest versus lowest walking levels) (Table 3) (41). In contrast, Lemaitre et al. found similar associations (OR= 0.34) between nonfatal MI and energy expenditure from walking after excluding subjects with no strenuous PA and an exceptionally strong association after excluding subjects with no PA other than walking (OR=0.11) (Table 5) (48).
Control for pre-existing illness
Studies that addressed pre-existing conditions used various strategies: (a) control for self-reported health status in multivariate analysis, (b) exclusion of individuals who were physically incapable, had poor health or did not engage in any PA, and (c) exclusion of events that occurred early in follow-up (Table 6). No pattern in the magnitude or direction of walking-CVD associations emerged with respect to the method used to control for pre-existing illness.
Table 6.
Methods used to control for pre-existing illness in assessment of the association between walking and CVD
| Study | Method |
|---|---|
| GISSI-2 (Italy) (D’Avanzo et al, 1993 (50)) | Exclude subjects with history of Ischemic Heart Disease |
| Whitehall Study (Davey Smith, 2000 (46)) | Excluded men with disease at entry |
| No change to results after excluding deaths in the first 5 and 10 years of follow-up | |
| Atherosclerosis in Communities Study (ARIC) (Evenson et al, 1999 (30)) | -NA- |
| Atherosclerosis in Communities Study (ARIC) (Folsom 1997 (31)) | -NA- |
| Study of Osteoporotic Fractures (Gregg et al, 2003 (44)) | Exclude subjects unable to walk without assistance |
| Adjust for self rated health | |
| No change to results after excluding first 2 years of follow-up | |
| Honolulu Heart Program (Hakim et al, 1998 (36)) | Exclude subjects who are physically incapable |
| No change to results after excluding deaths within first year of follow-up | |
| Honolulu Heart Program (Hakim et al, 1999 (35)) | Exclude subjects incapable of ≥1 hour activity |
| Adjust for physical function score | |
| No change to results after excluding those who reported no walking | |
| Nurses Health Study (Hu et al, 2000 (41)) | -NA- |
| Group Health Cooperative of Puget Sound (LaCroix et al, 1996 (34)) | -Exclude subjects with self-reported heart trouble at baseline, CVD-related |
| prescription drugs or hospitalization in past 12 months | |
| -Adjust for self-reported functional status, health status, chronic disease score | |
| -Secondary analysis found effect in those with and without functional limitations | |
| Women's Health Study (Lee et al, 2001 (32)) | -NA- |
| Harvard Alumni Health Study (Lee et al, 1998 (38)) | -NA- |
| Group Health Cooperative of Puget Sound (GHC) (Lemaitre et al, 1995 (48)) | Adjust for symptoms in month priorto index date |
| King County, WA Residents (Lemurtre et al, 1999 (49)) | Adjust for self-reported health status |
| Exclude subjects with history of heart disease, or reported poor health in the prior year | |
| Nurses Health Study (Manson et al, 1999 (43)) | No change in results after excluding subjects unable to walk |
| Women's Health Initiative Observational Study (Manson et al, 2002 (42)) | WHI Study excluded those who were non-ambulatory |
| Total CVD Outcome: No change in results after excluding events occurring in first year of follow-up, or adjusting for functional status, mental and emotional health | |
| Japan Collaborative Cohort Study for Evaluation of Cancer Risk (Noda et al, 2005 (33)) | Used second-lowest walking category as referent group |
| No change to results after excluding deaths within first 2 years of follow-up | |
| Harvard Alumni Study (Sesso et al, 2000 (39)) | -NA- |
| College Alumni Health Study (Sesso et al, 1999 (40)) | -NA- |
| West Birmingham, UK (Shinton et al, 1993 (47)) | Exclude subjects reporting poor health, or with history of myocardial ischemia or peripheral vascular disease |
| Residents of Rancho Bemardo, CA (Smith et al, 2007 (37)) | Adjust for history of CHD |
| Health Professionals Follow-up Study (Tanasescu et al, 2002 (45)) | Exclude subjects reporting difficulty walking or climbing stairs |
DISCUSSION
Observational studies suggest incremental reductions in CVD risk with higher levels of walking, particularly with faster pace. Incomplete attenuation of associations after adjusting for clinical CVD risk factors or other PA suggests that walking may reduce CVD incidence through improvements in CVD risk factors such as BMI but may also have independent effects. This point is particularly important relative to recommendations to increase MPA (3), with walking as a prime candidate given its popularity, relative ease, and accessibility.
Dose-response: volume and intensity
Volume
In general, CVD risk decreased incrementally with higher walking duration, distance, and energy expenditure, providing support for causal effects of walking on CVD. In some studies, reductions in CVD remained constant after additional increases in walking. This pattern could reflect a threshold effect (which contradicts research for total PA (51)), chance findings, or bias due to physical functioning, discussed in greater detail in subsequent sections. The dose-response curves in Figure 1 clearly show the general nature of the relationship, although they should be used only to aid interpretation because their shape may have been influenced by assumptions regarding the upper limit of the highest walking level, or in differences in walking levels across populations.
MPA recommendations of 30 minutes per day, five days per week (3) translate into 2.5 hours and 7.5 MET-hr of walking per week (assuming a 3 MET walking pace). Overall, walking levels significantly associated with reduced CVD risk are consistent with these recommendations.
Intensity
Incremental decreases in CVD risk were observed for walking pace increasing from <2 to >4 mph, even after accounting for distance or duration walked. These associations may reflect reductions in CVD risk expected with increasing intensity. Alternatively, walking pace may reflect lower functional status (52) or may be a weak indicator of cardiovascular fitness (53).
Stronger associations between CVD and walking pace than duration or distance could result from more accurate reporting of walking pace (32). Self-reported walking measures have only fair reliability (54), presumably because walking bouts are not always planned or tracked, an issue less relevant to pace.
Study design, outcomes, and biases
Overall findings should be interpreted in the context of several methodological issues:
Study design
In general, walking-CVD associations were stronger in case-control than cohort studies, which could reflect differences in causal mechanisms or different sources of bias. Acute conditions (e.g., stroke, MI) examined in case-control studies could be particularly related to walking, perhaps because, as theorized by Noda at al., MPA such as walking may reduce insulin resistance, which is more related to ischemic stroke than CHD (33). Potential causal mechanisms are supported by stronger associations for ischemic stroke than CHD or total CVD in cohort studies.
Recall bias is a concern in any case-control study, but especially for proxy responses, which are necessary for study outcomes with high fatality (49). Additionally, self-selection due to subclinical disease or pre-existing conditions that prohibit or limit walking but increase CVD risk for reasons other than walking is problematic in any observational study but particularly for case-control studies. First, exposure, outcome, and measures of self-reported health are measured simultaneously, although bias can arise in prospective studies if these conditions were present at baseline. Second, exclusion of events early in follow-up, perhaps the most objective method to control for pre-existing conditions, is not possible.
The reviewed cohort and case-control studies provide evidence for bias due to pre-existing conditions. While exclusion of early cases did not affect estimates in many studies, Gregg et al. found substantial attenuation of associations between total PA and CVD mortality after exclusion of early cases (44). Researchers often performed such secondary analyses for total PA but not walking, but the bias could be greater for walking because functional status may more strongly influence walking than total PA. Indeed, Lemaitre et al. found substantially stronger effects of walking on MI after excluding those with no PA other than walking versus no strenuous PA (48). Reporting no strenuous PA could reflect differences in lifestyle choices, while reporting no PA other than walking may reflect functional limitation.
Additionally, walking as little as 9 minutes or 0.4 miles/day, or expending any amount of energy from walking (>0 MET-hr) were found to significantly reduce CVD risk. These walking levels translate into much less PA than current recommendations and possibly reflect bias rather than causal effects. However, studies generally showed a negative dose-response with increasing walking level, suggesting that these associations can be attributed to more than functional ability to walk.
Adjustment variables
Adjustment for clinical CVD risk factors and other types of PA generally attenuated the observed association. PA improves blood pressure (55) and lipid profiles (56), and reduces obesity (57) and diabetes (58), so walking may prevent CVD through one or more of these pathways. Additionally, other types of PA may be important confounders of the walking-CVD association because those who walk may also engage in other forms of PA (59) that influence CVD risk (7).
Longitudinal associations not fully mediated by clinical CVD risk factors or confounded by other PA could be explained by residual confounding or bias. Alternatively, walking may provide unique benefits not conferred by other types of PA, such as walking enjoyment which may reduce stress or elevate positive psychological factors (60).
Given the accessibility of walking and high prevalence of inactivity (61) and obesity (62) in the U.S. adult population, less active and obese individuals are promising target populations. For example, studies that restrict analysis to those not reporting VPA (32, 42, 43, 45) are particularly relevant to public health recommendations. Obesity is an independent CVD risk factor, and recent studies suggest that PA (63) and walking (64) improves CVD risk in overweight and obese individuals. While the reviewed studies do not investigate the walking-CVD association in obese subgroups, there is a clear need for more research on the differential effects of walking on CVD by obesity status.
Demographic Subgroups
We observed no evidence that walking-CVD association varied by gender or age. Gender-stratified results were inconsistent: Noda et al. reported stronger effects in men for CHD but stronger effects in women for total CVD and stroke (33), and Folsom reported stronger effects in women than men for CHD (31). Study populations typically captured middle to older age groups, but some focused on adults over 60 years (34–36, 44).
Complexities of estimating health effects of walking in observational studies: Limitations and future research
While observational studies enable ascertainment of CVD end points in large samples rather than clinical CVD risk factors in relatively small samples typically examined in experimental studies, they have important limitations. Those most relevant to estimating the causal effects of walking on CVD risk and corresponding opportunities for future research include:
Residual confounding
Many studies adjusted for other PA and pre-existing conditions, but future studies should consider collecting additional data needed to better address these key sources of potential residual confounding. Diet is another major CVD determinant (65), but few studies adjusted for diet and none assessed the joint effect of diet and walking on CVD risk, which would strengthen evidence regarding walking and CVD and inform comprehensive prevention strategies.
Analytical considerations
Negative walking-CVD associations may result from improvement in intermediate risk factors or through confounding or interaction with other PA. Therefore, adjustment of specific clinical CVD risk factors and other PA in separate models may clarify the contribution of each. However, these factors did not explain the relationship entirely, so future studies could investigate alternative mechanisms such as stress reduction by which walking may reduce CVD risk.
Importantly, estimation of walking-CVD associations in obese or otherwise sedentary populations would inform public health recommendations and targeting of these high risk groups. However, such subgroup analysis should be performed with caution: BMI or other PA may influence current walking, but may also be influenced by past walking through weight loss or reduced barriers to other PA. Conditioning on BMI or other PA can induce selection bias (66), warranting consideration of potential bias and appropriate analytical methods in future studies.
While standardization of walking categories obtained from existing assessment instruments may be difficult, it would help to further evaluate PA recommendations. Estimates of the effects of walking (versus not walking) could also facilitate comparison across studies and is consistent with the conception of walking as prevention.
Measurement
All studies used self-reported PA, typically at one time point, with minimal validation against objective measures. While many of the reviewed studies began before objective PA measures were available for epidemiologic research, studies initiated more recently could complement self-reported walking behavior with pedometer or accelerometer data to obtain potentially more precise estimates of walking duration and intensity. This could enhance comparability across age or physical abilities by reducing heterogeneity of self-reported walking due to, for example, slower pace and shorter duration among those of older age, poor fitness, or diminished physical abilities (34). Self-reported walking remains important because it can capture habitual PA patterns, and, with the exception of emergent measurement methods (e.g., (67)), objective measures do not distinguish between types of PA.
Additionally, walking volume measures and pace are related: for example, faster pace implies longer distance walked and higher energy expenditure per given duration. Collection of walking intensity (pace), frequency, and duration may help to disentangle their independent effects and reduce heterogeneity in walking measures. Assessing dose-response of walking frequency (not addressed in studies reviewed), in combination with intensity and duration could also help to refine walking recommendations. Finally, ascertainment of PA and walking behavior at multiple time points would help to capture short-term changes and examine the benefits of walking throughout the life cycle.
Walking as secondary measure
With some exceptions (33–37, 42, 43), walking was examined as a secondary measure in studies primarily designed to examine overall PA, which may have exacerbated study biases. First, reliability and validity was often assessed for the total PA measure but not its components (e.g., walking); this aspect of the review was not comprehensive, however, so walking measures may have been assessed but not reported, or studied after publication of the reviewed studies. Second, total PA analyses were often more thorough than walking analyses. For example, several studies controlled for pre-existing conditions by excluding cases that occurred early in follow-up (39–41, 43, 44) or application of propensity score methods (44, 45) for total PA but not walking. Finally, findings for secondary exposures may be particularly susceptible to publication bias. Studies that assess walking as a primary exposure may be more likely to ensure that walking measures are reliable and valid, perform more thorough analyses, and report null findings.
Strengths and Limitations of the Systematic Review
While our search may have excluded relevant studies, several factors minimize this possibility. Our start date of 1990 is conservative because it preceded major research interest in walking initiated by PA recommendations published in 1995 (2, 15), and major studies that examined walking prior to 1990 have been updated (e.g., (39)). Further, a recently published meta-analysis confirms this time frame (11). We also conducted parallel searches in two extensive health and medical research databases, which was supplemented by a manual search protocol.
By including only peer reviewed articles, our review is vulnerable to publication bias. However, this bias is balanced by quality assurance provided by the peer review system, a priority in this review which focused on methodological differences and limitations. Overall, our literature search criteria and procedures were carefully developed and well-defined, resulting in a systematic review that is transparent and replicable.
Summary and Implications
Existing literature suggests that walking reduces CVD risk in men and women across a broad age spectrum, and that walking for longer duration or distance confers additional protection against CVD. There is consistent evidence that CVD risk declines with increasing walking pace, and, based on research assessing overall PA (7), probably continues to decline into vigorous intensities. The favorable relationship observed among adults who do not report VPA suggest that walking is a promising CVD prevention strategy in a largely sedentary population. Given its accessibility, walking may help to reduce perceived barriers to PA such as access to exercise facilities (68) and promote higher levels of MPA or addition of VPA.
This review assessed walking and CVD, but by acting on intermediate risk factors such as obesity and insulin sensitivity, walking is also an important risk factor for numerous other health outcomes. Conclusions about general health benefits of walking require assessment of the relationship between walking and other conditions such as obesity and diabetes mellitus type II.
CVD and other chronic diseases are major contributors to global morbidity and mortality. It is essential to improve our understanding of activities such as walking that reduce CVD and chronic disease risk and are relevant given the demographic shift toward an older, obese, and sedentary population.
ACKNOWLEDGEMENTS
PGL/JBH supported by NCI (R01-CA12115, R01 CA109831) and NICHD (K01-HD044263). The authors would like to thank Lori Delaney and Katrina Vernon at the Carolina Population Center Library for their help with refining the literature search, as well as the two anonymous reviewers. There were no potential or real conflicts of financial or personal interest with the financial sponsors of the scientific project.
References
- 1.Physical Activity Guidelines Advisory Committee. Physical Activity Guidelines Advisory Committee Report, 2008. Washington, DC: Department of Health and Human Services; 2008. [Google Scholar]
- 2.U.S. Department of Health and Human Services. Surgeon General's report on physical activity and health. From the Centers for Disease Control and Prevention. JAMA. 1996;276:522. [Google Scholar]
- 3.Haskell WL, Lee IM, Pate RR, Powell KE, Blair SN, Franklin BA, Macera CA, Heath GW, Thompson PD, Bauman A. Physical activity and public health: updated recommendation for adults from the American College of Sports Medicine and the American Heart Association. Med Sci Sports Exerc. 2007;39:1423–1434. doi: 10.1249/mss.0b013e3180616b27. [DOI] [PubMed] [Google Scholar]
- 4.Rosamond W, Flegal K, Furie K, Go A, Greenlund K, Haase N, Hailpern SM, Ho M, Howard V, Kissela B, Kittner S, Lloyd-Jones D, McDermott M, Meigs J, Moy C, Nichol G, O'Donnell C, Roger V, Sorlie P, Steinberger J, Thom T, Wilson M, Hong Y. Heart disease and stroke statistics--2008 update: a report from the American Heart Association Statistics Committee and Stroke Statistics Subcommittee. Circulation. 2008;117:e25–146. doi: 10.1161/CIRCULATIONAHA.107.187998. [DOI] [PubMed] [Google Scholar]
- 5.Reddy KS. Cardiovascular diseases in the developing countries: dimensions, determinants, dynamics and directions for public health action. Public Health Nutr. 2002;5:231–237. doi: 10.1079/phn2001298. [DOI] [PubMed] [Google Scholar]
- 6.Barinaga M. How much pain for cardiac gain? Science. 1997;276:1324–1327. doi: 10.1126/science.276.5317.1324. [DOI] [PubMed] [Google Scholar]
- 7.Swain DP, Franklin BA. Comparison of cardioprotective benefits of vigorous versus moderate intensity aerobic exercise. Am J Cardiol. 2006;97:141–147. doi: 10.1016/j.amjcard.2005.07.130. [DOI] [PubMed] [Google Scholar]
- 8.Siegel PZ, Brackbill RM, Heath GW. The epidemiology of walking for exercise: implications for promoting activity among sedentary groups. Am J Public Health. 1995;85:706–710. doi: 10.2105/ajph.85.5.706. [DOI] [PMC free article] [PubMed] [Google Scholar]
- 9.Eyler AA, Brownson RC, Bacak SJ, Housemann RA. The epidemiology of walking for physical activity in the United States. Med Sci Sports Exerc. 2003;35:1529–1536. doi: 10.1249/01.MSS.0000084622.39122.0C. [DOI] [PubMed] [Google Scholar]
- 10.Erlichman J, Kerbey AL, James WP. Physical activity and its impact on health outcomes. Paper 2: Prevention of unhealthy weight gain and obesity by physical activity: an analysis of the evidence. Obes Rev. 2002;3:273–287. doi: 10.1046/j.1467-789x.2002.00078.x. [DOI] [PubMed] [Google Scholar]
- 11.Hamer M, Chida Y. Walking and primary prevention: a meta-analysis of prospective cohort studies. Br J Sports Med. 2008;42:238–243. doi: 10.1136/bjsm.2007.039974. [DOI] [PubMed] [Google Scholar]
- 12.Mieres JH. Review of the American Heart Association's guidelines for cardiovascular disease prevention in women. Heart. 2006;92(Suppl 3):iii10–iii13. doi: 10.1136/hrt.2005.070326. [DOI] [PMC free article] [PubMed] [Google Scholar]
- 13.Wilson PW, D'Agostino RB, Levy D, Belanger AM, Silbershatz H, Kannel WB. Prediction of coronary heart disease using risk factor categories. Circulation. 1998;97:1837–1847. doi: 10.1161/01.cir.97.18.1837. [DOI] [PubMed] [Google Scholar]
- 14.Albright C, Thompson DL. The effectiveness of walking in preventing cardiovascular disease in women: a review of the current literature. J Womens Health (Larchmt) 2006;15:271–280. doi: 10.1089/jwh.2006.15.271. [DOI] [PubMed] [Google Scholar]
- 15.Lee IM, Buchner DM. The importance of walking to public health. Med Sci Sports Exerc. 2008;40:S512–S518. doi: 10.1249/MSS.0b013e31817c65d0. [DOI] [PubMed] [Google Scholar]
- 16.Pate RR, Pratt M, Blair SN, Haskell WL, Macera CA, Bouchard C, Buchner D, Ettinger W, Heath GW, King AC, et al. Physical activity and public health. A recommendation from the Centers for Disease Control and Prevention and the American College of Sports Medicine. JAMA. 1995;273:402–407. doi: 10.1001/jama.273.5.402. [DOI] [PubMed] [Google Scholar]
- 17.Thom T, Haase N, Rosamond W, Howard VJ, Rumsfeld J, Manolio T, Zheng ZJ, Flegal K, O'Donnell C, Kittner S, Lloyd-Jones D, Goff DC, Jr, Hong Y, Adams R, Friday G, Furie K, Gorelick P, Kissela B, Marler J, Meigs J, Roger V, Sidney S, Sorlie P, Steinberger J, Wasserthiel-Smoller S, Wilson M, Wolf P. Heart disease and stroke statistics--2006 update: a report from the American Heart Association Statistics Committee and Stroke Statistics Subcommittee. Circulation. 2006;113:e85–e151. doi: 10.1161/CIRCULATIONAHA.105.171600. [DOI] [PubMed] [Google Scholar]
- 18.Wagner A, Simon C, Evans A, Ferrieres J, Montaye M, Ducimetiere P, Arveiler D. Physical activity and coronary event incidence in Northern Ireland and France: the Prospective Epidemiological Study of Myocardial Infarction (PRIME) Circulation. 2002;105:2247–2252. doi: 10.1161/01.cir.0000016345.58696.4f. [DOI] [PubMed] [Google Scholar]
- 19.Hu G, Jousilahti P, Borodulin K, Barengo NC, Lakka TA, Nissinen A, Tuomilehto J. Occupational, commuting and leisure-time physical activity in relation to coronary heart disease among middle-aged Finnish men and women. Atherosclerosis. 2007;194:490–497. doi: 10.1016/j.atherosclerosis.2006.08.051. [DOI] [PubMed] [Google Scholar]
- 20.Matthews CE, Jurj AL, Shu XO, Li HL, Yang G, Li Q, Gao YT, Zheng W. Influence of exercise, walking, cycling, and overall nonexercise physical activity on mortality in Chinese women. Am J Epidemiol. 2007;165:1343–1350. doi: 10.1093/aje/kwm088. [DOI] [PubMed] [Google Scholar]
- 21.Wannamethee SG, Shaper AG, Walker M. Changes in physical activity, mortality, and incidence of coronary heart disease in older men. Lancet. 1998;351:1603–1608. doi: 10.1016/S0140-6736(97)12355-8. [DOI] [PubMed] [Google Scholar]
- 22.Shaper AG, Wannamethee G, Weatherall R. Physical activity and ischaemic heart disease in middle-aged British men. Br Heart J. 1991;66:384–394. doi: 10.1136/hrt.66.5.384. [DOI] [PMC free article] [PubMed] [Google Scholar]
- 23.Ainsworth BE, Haskell WL, Whitt MC, Irwin ML, Swartz AM, Strath SJ, O'Brien WL, Bassett DR, Jr, Schmitz KH, Emplaincourt PO, Jacobs DR, Jr, Leon AS. Compendium of physical activities: an update of activity codes and MET intensities. Med Sci Sports Exerc. 2000;32:S498–S504. doi: 10.1097/00005768-200009001-00009. [DOI] [PubMed] [Google Scholar]
- 24.Butler GP, Orpana HM, Wiens AJ. By your own two feet: factors associated with active transportation in Canada. Can J Public Health. 2007;98:259–264. doi: 10.1007/BF03405399. [DOI] [PMC free article] [PubMed] [Google Scholar]
- 25.Mondial V. [cited 2008 August 11, 2008];National Cycling Policy Benchmarking Program NATCYP: Stage I Final report. 2001 Available from: http://www.velomondial.net/PDFfiles/NATCYP%20stage%20I/Rapport.pdf.
- 26.Serrano-Martinez M, Sanjulian-Aranguren B, Ezpeleta-Iturralde I, Madoz-Zubillaga E, Urbina Goni MJ, de Irala-Estevez J. Primary care nursing of coronary patients and reduction of re-infarction risk: a nested case-control study. Public Health. 2005;119:112–117. doi: 10.1016/j.puhe.2004.03.010. [DOI] [PubMed] [Google Scholar]
- 27.Walsh JT, Charlesworth A, Andrews R, Hawkins M, Cowley AJ. Relation of daily activity levels in patients with chronic heart failure to long-term prognosis. Am J Cardiol. 1997;79:1364–1369. doi: 10.1016/s0002-9149(97)00141-0. [DOI] [PubMed] [Google Scholar]
- 28.Morris JN, Clayton DG, Everitt MG, Semmence AM, Burgess EH. Exercise in leisure time: coronary attack and death rates. Br Heart J. 1990;63:325–334. doi: 10.1136/hrt.63.6.325. [DOI] [PMC free article] [PubMed] [Google Scholar]
- 29.U.S. Department of Health and Human Services. [cited 2008 August 8, 2008];Table 3. Weight in pounds for females 20 years and over-number of examined persons, mean, standard error of the mean, and selected percentiles, by race-ethnicity and age : United States, 1988–1994. Available from: http://www.cdc.gov/nchs/data/nhanes/t3.pdf.
- 30.Evenson KR, Rosamond WD, Cai J, Toole JF, Hutchinson RG, Shahar E, Folsom AR. Physical activity and ischemic stroke risk. The atherosclerosis risk in communities study. Stroke. 1999;30:1333–1339. doi: 10.1161/01.str.30.7.1333. [DOI] [PubMed] [Google Scholar]
- 31.Folsom AR, Arnett DK, Hutchinson RG, Liao F, Clegg LX, Cooper LS. Physical activity and incidence of coronary heart disease in middle-aged women and men. Med Sci Sports Exerc. 1997;29:901–909. doi: 10.1097/00005768-199707000-00009. [DOI] [PubMed] [Google Scholar]
- 32.Lee IM, Rexrode KM, Cook NR, Manson JE, Buring JE. Physical activity and coronary heart disease in women: is "no pain, no gain" passe? JAMA. 2001;285:1447–1457. doi: 10.1001/jama.285.11.1447. [DOI] [PubMed] [Google Scholar]
- 33.Noda H, Iso H, Toyoshima H, Date C, Yamamoto A, Kikuchi S, Koizumi A, Kondo T, Watanabe Y, Wada Y, Inaba Y, Tamakoshi A. Walking and sports participation and mortality from coronary heart disease and stroke. J Am Coll Cardiol. 2005;46:1761–1767. doi: 10.1016/j.jacc.2005.07.038. [DOI] [PubMed] [Google Scholar]
- 34.LaCroix AZ, Leveille SG, Hecht JA, Grothaus LC, Wagner EH. Does walking decrease the risk of cardiovascular disease hospitalizations and death in older adults? J Am Geriatr Soc. 1996;44:113–120. doi: 10.1111/j.1532-5415.1996.tb02425.x. [DOI] [PubMed] [Google Scholar]
- 35.Hakim AA, Curb JD, Petrovitch H, Rodriguez BL, Yano K, Ross GW, White LR, Abbott RD. Effects of walking on coronary heart disease in elderly men: the Honolulu Heart Program. Circulation. 1999;100:9–13. doi: 10.1161/01.cir.100.1.9. [DOI] [PubMed] [Google Scholar]
- 36.Hakim AA, Petrovitch H, Burchfiel CM, Ross GW, Rodriguez BL, White LR, Yano K, Curb JD, Abbott RD. Effects of walking on mortality among nonsmoking retired men. N Engl J Med. 1998;338:94–99. doi: 10.1056/NEJM199801083380204. [DOI] [PubMed] [Google Scholar]
- 37.Smith TC, Wingard DL, Smith B, Kritz-Silverstein D, Barrett-Connor E. Walking decreased risk of cardiovascular disease mortality in older adults with diabetes. J Clin Epidemiol. 2007;60:309–317. doi: 10.1016/j.jclinepi.2006.06.013. [DOI] [PMC free article] [PubMed] [Google Scholar]
- 38.Lee IM, Paffenbarger RS., Jr Physical activity and stroke incidence: the Harvard Alumni Health Study. Stroke. 1998;29:2049–2054. doi: 10.1161/01.str.29.10.2049. [DOI] [PubMed] [Google Scholar]
- 39.Sesso HD, Paffenbarger RS, Jr, Lee IM. Physical activity and coronary heart disease in men: The Harvard Alumni Health Study. Circulation. 2000;102:975–980. doi: 10.1161/01.cir.102.9.975. [DOI] [PubMed] [Google Scholar]
- 40.Sesso HD, Paffenbarger RS, Ha T, Lee IM. Physical activity and cardiovascular disease risk in middle-aged and older women. Am J Epidemiol. 1999;150:408–416. doi: 10.1093/oxfordjournals.aje.a010020. [DOI] [PubMed] [Google Scholar]
- 41.Hu FB, Stampfer MJ, Colditz GA, Ascherio A, Rexrode KM, Willett WC, Manson JE. Physical activity and risk of stroke in women. JAMA. 2000;283:2961–2967. doi: 10.1001/jama.283.22.2961. [DOI] [PubMed] [Google Scholar]
- 42.Manson JE, Greenland P, LaCroix AZ, Stefanick ML, Mouton CP, Oberman A, Perri MG, Sheps DS, Pettinger MB, Siscovick DS. Walking compared with vigorous exercise for the prevention of cardiovascular events in women. N Engl J Med. 2002;347:716–725. doi: 10.1056/NEJMoa021067. [DOI] [PubMed] [Google Scholar]
- 43.Manson JE, Hu FB, Rich-Edwards JW, Colditz GA, Stampfer MJ, Willett WC, Speizer FE, Hennekens CH. A prospective study of walking as compared with vigorous exercise in the prevention of coronary heart disease in women. N Engl J Med. 1999;341:650–658. doi: 10.1056/NEJM199908263410904. [DOI] [PubMed] [Google Scholar]
- 44.Gregg EW, Cauley JA, Stone K, Thompson TJ, Bauer DC, Cummings SR, Ensrud KE. Relationship of changes in physical activity and mortality among older women. JAMA. 2003;289:2379–2386. doi: 10.1001/jama.289.18.2379. [DOI] [PubMed] [Google Scholar]
- 45.Tanasescu M, Leitzmann MF, Rimm EB, Willett WC, Stampfer MJ, Hu FB. Exercise type and intensity in relation to coronary heart disease in men. JAMA. 2002;288:1994–2000. doi: 10.1001/jama.288.16.1994. [DOI] [PubMed] [Google Scholar]
- 46.Davey Smith G, Shipley MJ, Batty GD, Morris JN, Marmot M. Physical activity and cause-specific mortality in the Whitehall study. Public Health. 2000;114:308–315. doi: 10.1038/sj.ph.1900675. [DOI] [PubMed] [Google Scholar]
- 47.Shinton R, Sagar G. Lifelong exercise and stroke. BMJ. 1993;307:231–234. doi: 10.1136/bmj.307.6898.231. [DOI] [PMC free article] [PubMed] [Google Scholar]
- 48.Lemaitre RN, Heckbert SR, Psaty BM, Siscovick DS. Leisure-time physical activity and the risk of nonfatal myocardial infarction in postmenopausal women. Arch Intern Med. 1995;155:2302–2308. [PubMed] [Google Scholar]
- 49.Lemaitre RN, Siscovick DS, Raghunathan TE, Weinmann S, Arbogast P, Lin DY. Leisure-time physical activity and the risk of primary cardiac arrest. Arch Intern Med. 1999;159:686–690. doi: 10.1001/archinte.159.7.686. [DOI] [PubMed] [Google Scholar]
- 50.D'Avanzo B, Santoro L, La Vecchia C, Maggioni A, Nobili A, Iacuitti G, Franceschi S. Physical activity and the risk of acute myocardial infarction. GISSI-EFRIM Investigators. Gruppo Italiano per lo Studio della Sopravvivenza nell'Infarto-Epidemiologia dei Fattori di Rischio dell'Infarto Miocardico. Ann Epidemiol. 1993;3:645–651. [PubMed] [Google Scholar]
- 51.Kohl HW., 3rd Physical activity and cardiovascular disease: evidence for a dose response. Med Sci Sports Exerc. 2001;33:S472–S474. doi: 10.1097/00005768-200106001-00017. discussion S493-4. [DOI] [PubMed] [Google Scholar]
- 52.Morales FJ, Martinez A, Mendez M, Agarrado A, Ortega F, Fernandez-Guerra J, Montemayor T, Burgos J. A shuttle walk test for assessment of functional capacity in chronic heart failure. Am Heart J. 1999;138:291–298. doi: 10.1016/s0002-8703(99)70114-6. [DOI] [PubMed] [Google Scholar]
- 53.Pintar JA, Robertson RJ, Kriska AM, Nagle E, Goss FL. The influence of fitness and body weight on preferred exercise intensity. Med Sci Sports Exerc. 2006;38:981–988. doi: 10.1249/01.mss.0000218128.66077.97. [DOI] [PubMed] [Google Scholar]
- 54.Evenson KR, McGinn AP. Test-retest reliability of adult surveillance measures for physical activity and inactivity. Am J Prev Med. 2005;28:470–478. doi: 10.1016/j.amepre.2005.02.005. [DOI] [PubMed] [Google Scholar]
- 55.Pescatello LS, Franklin BA, Fagard R, Farquhar WB, Kelley GA, Ray CA. American College of Sports Medicine position stand. Exercise and hypertension. Med Sci Sports Exerc. 2004;36:533–553. doi: 10.1249/01.mss.0000115224.88514.3a. [DOI] [PubMed] [Google Scholar]
- 56.Szapary PO, Bloedon LT, Foster GD. Physical activity and its effects on lipids. Curr Cardiol Rep. 2003;5:488–492. doi: 10.1007/s11886-003-0112-2. [DOI] [PubMed] [Google Scholar]
- 57.Shaw K, Gennat H, O'Rourke P, Del Mar C. Exercise for overweight or obesity. Cochrane Database Syst Rev. 2006 doi: 10.1002/14651858.CD003817.pub3. CD003817. [DOI] [PMC free article] [PubMed] [Google Scholar]
- 58.Hussain A, Claussen B, Ramachandran A, Williams R. Prevention of type 2 diabetes: a review. Diabetes Res Clin Pract. 2007;76:317–326. doi: 10.1016/j.diabres.2006.09.020. [DOI] [PubMed] [Google Scholar]
- 59.Rafferty AP, Reeves MJ, McGee HB, Pivarnik JM. Physical activity patterns among walkers and compliance with public health recommendations. Med Sci Sports Exerc. 2002;34:1255–1261. doi: 10.1097/00005768-200208000-00005. [DOI] [PubMed] [Google Scholar]
- 60.Ball K, Timperio A, Salmon J, Giles-Corti B, Roberts R, Crawford D. Personal, social and environmental determinants of educational inequalities in walking: a multilevel study. J Epidemiol Community Health. 2007;61:108–114. doi: 10.1136/jech.2006.048520. [DOI] [PMC free article] [PubMed] [Google Scholar]
- 61.Centers for Disease Control and Prevention. Trends in leisure-time physical inactivity by age, sex, and race/ethnicity--United States, 1994–2004. MMWR Morb Mortal Wkly Rep. 2005;54:991–994. [PubMed] [Google Scholar]
- 62.Ogden CL, Carroll MD, Curtin LR, McDowell MA, Tabak CJ, Flegal KM. Prevalence of overweight and obesity in the United States, 1999–2004. JAMA. 2006;295:1549–1555. doi: 10.1001/jama.295.13.1549. [DOI] [PubMed] [Google Scholar]
- 63.Wildman RP, Muntner P, Reynolds K, McGinn AP, Rajpathak S, Wylie-Rosett J, Sowers MR. The obese without cardiometabolic risk factor clustering and the normal weight with cardiometabolic risk factor clustering: prevalence and correlates of 2 phenotypes among the US population (NHANES 1999–2004) Arch Intern Med. 2008;168:1617–1624. doi: 10.1001/archinte.168.15.1617. [DOI] [PubMed] [Google Scholar]
- 64.Weinstein AR, Sesso HD, Lee IM, Rexrode KM, Cook NR, Manson JE, Buring JE, Gaziano JM. The joint effects of physical activity and body mass index on coronary heart disease risk in women. Arch Intern Med. 2008;168:884–890. doi: 10.1001/archinte.168.8.884. [DOI] [PubMed] [Google Scholar]
- 65.Hu FB, Willett WC. Optimal diets for prevention of coronary heart disease. JAMA. 2002;288:2569–2578. doi: 10.1001/jama.288.20.2569. [DOI] [PubMed] [Google Scholar]
- 66.Hernan MA, Hernandez-Diaz S, Robins JM. A structural approach to selection bias. Epidemiology. 2004;15:615–625. doi: 10.1097/01.ede.0000135174.63482.43. [DOI] [PubMed] [Google Scholar]
- 67.Zhang K, Werner P, Sun M, Pi-Sunyer FX, Boozer CN. Measurement of human daily physical activity. Obes Res. 2003;11:33–40. doi: 10.1038/oby.2003.7. [DOI] [PubMed] [Google Scholar]
- 68.Kruger J, Carlson SA, Kohl HW., 3rd Fitness facilities for adults: differences in perceived access and usage. Am J Prev Med. 2007;32:500–505. doi: 10.1016/j.amepre.2007.02.003. [DOI] [PubMed] [Google Scholar]