

Abstract
We report the characterization and optimization of drug-like small molecule inhibitors of tissue-nonspecific alkaline phosphatase (TNAP), an enzyme critical for the regulation of extracellular matrix calcification during bone formation and growth. High-throughput screening (HTS) of a small molecule library led to the identification of arylsulfonamides as potent and selective inhibitors of TNAP. Critical structural requirements for activity were determined, and the compounds were subsequently profiled for in vitro activity and bioavailability parameters including metabolic stability and permeability. The plasma levels following subcutaneous administration of a member of the lead series in rat was determined, demonstrating the potential of these TNAP inhibitors as systemically active therapeutic agents to target various diseases involving soft tissue calcification. A representative member of the series was also characterized in mechanistic and kinetic studies.
Introduction
Among the human alkaline phosphatases, tissue-nonspecific alkaline phosphatase (TNAP) is essential for bone matrix mineralization.1 The biological function of TNAP is to hydrolyze extracellular inorganic pyrophosphate (ePPi), an inhibitor of calcification, to maintain the correct ratio of Pi/ePPi in skeletal tissues to enable normal skeletal calcification.2-4 Elsewhere in the body, high ePPi levels prevent ectopic calcification.5 In turn, low levels of ePPi have been associated with the development of soft-tissue calcification.6 This deficiency of ePPi can be attributed to deficits in either the production or transport of pyrophosphate, as seen in Enpp1 and Ank deficiencies.2, 3 This physiological state can result in rather severe clinical indications including idiopathic infantile arterial calcification (IIAC), ectopic ossification in spinal ligaments, ankylosis and osteoarthritis.2-6 Arterial calcification, particularly medial calcification a.k.a Mönckeberg’s sclerosis, is a serious complication of chronic kidney disease, obesity, diabetes and aging.7 We have recently observed an upregulation of TNAP in Enpp1-/- and ank/ank vascular smooth muscle cells (VSMC) and also in uremic aortas, suggesting that it is an important cause of ePPi deficiency and medial calcification, and a potential therapeutic target.8, 9 Thus, an effort to find selective and potent small molecule inhibitors of TNAP as potential therapeutics is warranted. Herein we describe the discovery of potent small molecule TNAP inhibitors that, on systemic administration, are likely to cause a reduction in TNAP activity resulting in an increase in the local amount of ePPi to prevent or ameliorate vascular calcification.
TNAP, as with all mammalian APs, has been shown to be inhibited by a limited number of small molecule compounds including L-homoarginine, levamisole, and theophylline (Figure 1).1, 10 However, these known inhibitors of TNAP are very weak binders and do not show specificity for the TNAP isozyme. In addition, they are not particularly effective at inhibiting the pyrophosphatase activity of TNAP. We previously reported the results of an initial high-throughput screening (HTS) campaign that led to the identification of several low micromolar inhibitors of TNAP.8 We also reported the results of a second HTS campaign, performed within the Molecular Library Screening Center Network (MLSCN), which led to the discovery of several small molecule TNAP inhibitors with different mechanisms of action (MOA).11 Subsequent work on the optimization of one of the series discovered in this recent HTS campaign culminated in the development of selective competitive TNAP inhibitors with low nanomolar potency.12 We now report the structure-activity relationship (SAR) studies and validation of a novel class of sulfonamides that are uncompetitive TNAP inhibitors showing excellent phosphatase selectivity and acceptable plasma levels in rat following subcutaneous administration. These compounds have the potential to be developed into therapeutic agents to treat vascular calcification.
Figure 1.
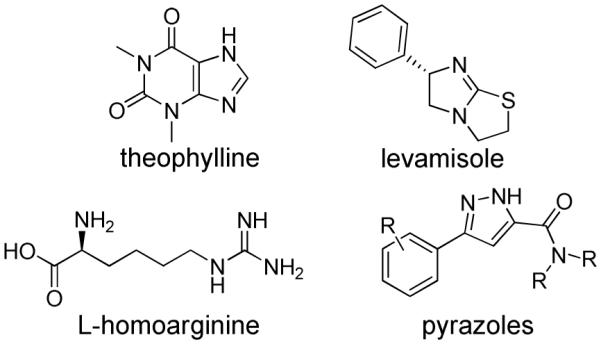
Structures of reported TNAP inhibitors.
Results and Discussion
High-throughput screening (HTS) of 66,000 compounds from the NIH Molecular Libraries Small Molecule Repository (MLSMR) compound collection (http://www.mli.nih.gov/mlsmr) using a luminescence-based HTS assay was performed as a part of the MLSCN initiative. These screening efforts led to the identification of several classes of sub-micromolar inhibitors of TNAP11 (for assay details see Experimental Section and PubChem link to AID 1056 http://pubchem.ncbi.nlm.nih.gov/assay/assay.cgi?aid = 1056). Initial HTS was performed at a concentration of 20 μM and was followed with dose-response assays performed in duplicate using a 10-point 2-fold serial dilution of the hit compounds in DMSO. Hit confirmation was performed using luminescent and colorimetric assays to verify inhibitory activity against TNAP in dose-response mode. Selectivity was assessed against the isozymes placental and intestinal alkaline phosphatase (PLAP and IAP) in luminescence-based assays. Compounds that were active in dose-response mode against TNAP, soluble in the range relevant to their potency, and inactive against PLAP and IAP were prioritized for synthetic chemistry follow-up.
HTS hits and purchased commercial analogues provided an initial set of arylsulfonamides having TNAP IC50 values in the nanomolar to low micromolar range (Table 1). Interestingly, several compounds sharing similar structural features were also found that had greatly reduced activities compared to the initial lead structures, affording relevant information about the key required structural elements (Figure 2). Analysis of the nascent structure activity relationship (SAR) present in those analogues showing confirmed activity revealed key features attributable to their inhibitory activity. Most notable was the presence of either 3-pyridyl or 3-quinoline moieties on the amine portion of the molecules and ortho-alkoxy substitution of the arylsulfonyl portion which seemed to be required for activity. Additional substitution of methyl or halogen on this portion was equally tolerated in the active inhibitors. Finally, quinoline derivatives appeared to be more active than the corresponding pyridine analogues, as can be seen in the comparison of compounds 1 and 2 (Table 1).
Table 1.
SAR of TNAP inhibitors from HTS and purchased analogues
| CMPD | TNAP IC50 μM luminescenta |
|
|---|---|---|
| 1 | 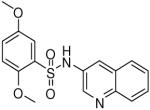 |
0.19 (0.03, 0.41, 43) |
| 2 | 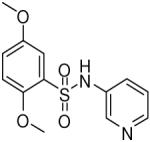 |
1.06 (0.76, 1.48, 6) |
| 3 | 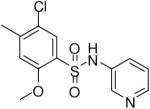 |
0.51 (0.28, 0.66, 3) |
| 4 | 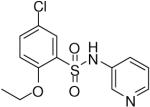 |
0.54 (0.35, 0.65, 4) |
| 5 | 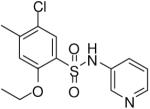 |
0.69 (0.24, 1.01, 6) |
| 6 | 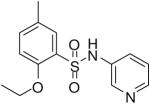 |
1.13 (0.53, 1.93, 4) |
| 7 | 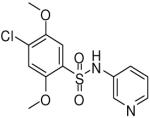 |
1.13 (0.49, 1.46, 4) |
| 8 | 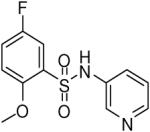 |
1.29 (0.73, 1.56, 4) |
| 9 | 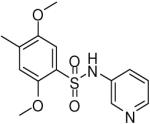 |
1.49 (0.64, 2.35, 3) |
| 10 | 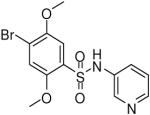 |
1.55 (1.27, 1.83, 2) |
| 11 | 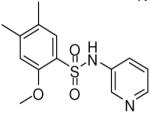 |
1.68 (1.07, 2.13, 3) |
TNAP IC50 data are presented as the geometric mean followed in parentheses by the lower and upper limits of the mean and the number of replicates.
Figure 2.
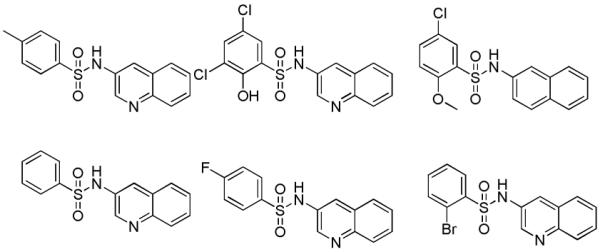
Examples of inactive arylsulfonamides which gave insight into required structural elements. TNAP IC50 > 10 μM for all examples.
Based on the superior activity of compound 1, a directed set of compounds was prepared to specifically address the key SAR requirements of this scaffold (Figure 3). It is noteworthy that when the two previously described SAR requirements were altered, the activity of the resulting derivatives was greatly diminished. Removal (12) or movement (13) of the quinoline nitrogen resulted in loss of activity. Replacement (14) or movement of the 5-methoxy substituent of 1 also gave a similar reduction of activity. Next, removal of the ortho methoxy (15) also resulted in a dramatic loss of activity. Finally, reversing the sulfonamide moiety (16) or replacement with an amide or methylene (17) also abolished the inhibitory activity. These analogues confirmed the key attributes of our lead series, specifically a 3-substituted quinoline or pyridine ring and an ortho alkoxy substituent on the arylsulfonyl ring.
Figure 3.
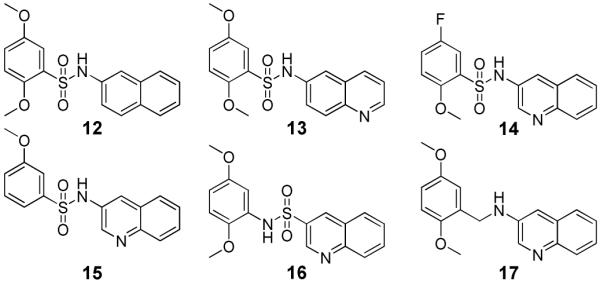
Elucidation of key requirements of lead TNAP inhibitor 1. TNAP IC50 > 10 μM for compounds 12-17.
After establishing the key features required for activity, additional analogues were prepared to further optimize the activity of this series and allow for in vitro profiling of absorption, distribution, metabolism and excretion (ADME) properties. A variety of representative compounds showed activity in the high nanomolar to single-digit micromolar range. Notably, one analogue (18) possessed comparable activity to lead compound 1 (Table 2).
Table 2.
SAR and ADME profiles of follow-up compounds of lead TNAP inhibitor 1
| CMPD | TNAP IC50 μM luminescenta |
Microsomal/ Plasma Stabilityb |
PAMPA (% FLUX)c |
Solubility (μg/mL)d |
|
|---|---|---|---|---|---|
| 1 | 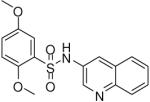 |
0.19 (0.03, 0.41, 43) | 78 / 97 | 58 | 138.2 |
| 18 | 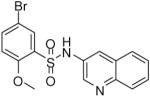 |
0.12 (0.04, 0.25, 16) | 49 / 66 | 54 | 37.9 |
| 19 | 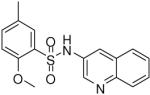 |
0.65 (0.50, 0.94, 4) | 48 / 91 | 7 | 71.6 |
| 20 | 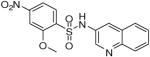 |
0.74 (0.74, 0.74, 1) | 56 / 96 | 11 | 178 |
| 21 | 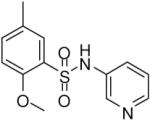 |
1.85 (0.69, 3.36, 23) | 39 / 98 | 83 | 28.5 |
| 22 | 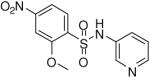 |
3.16 (2.27, 3.64, 4) | 68 / 99 | 51 | 1.1 |
TNAP IC50 data are presented as the geometric mean followed in parentheses by the lower and upper limits of the mean and the number of replicates.
Percent remaining after incubation for 30 min. at 37 °C.
PAMPA flux values assessed according to previously published methods.15
Solubility measurements performed in an aqueous buffer solution at pH 7.4, in duplicate.
In addition, the compounds in Table 2 were profiled in in vitro ADME assays to assess their drug-likeness and potential for systemic activity in animal models of vascular calcification. Many of the sulfonamide compounds were shown to have suitable properties for oral administration including acceptable metabolic and plasma stability, good permeability across artificial lipid membranes, and good solubility. The results of the specific ADME profiling assays are shown in Table 2. Although the profiles of all of the synthesized analogues had acceptable and drug-like ADME profiles, it was clear that in addition to showing acceptable aqueous solubility at physiological pH, the overall properties of 1 were superior. The selectivity of 1 against other phosphatases and across other biological targets was remarkable (Table 3). TNAP inhibitor 1 showed no inhibition in over 250 assays reported in the PubChem database (http://pubchem.ncbi.nlm.nih.gov/) as well as assays performed in-house for two other alkaline phosphatase isozymes, intestinal alkaline phosphatase (IAP) and placental alkaline phosphatase (PLAP). Compound 1 showed activity in only one other assay, Cytochrome P450 2C19 (CYP2C19). Compound 1 was also tested for its ability to inhibit the function of NPP1, a phosphodiesterase that also has phosphatase activity and regulates ePPi production in skeletal tissue,2,3 and PHOSPHO1, a phosphatase with specificity for phosphethanolamine and phosphocholine, also involved in skeletal mineralization.13 At their optimal alkaline pHs, inhibition was less than 9.5 % for NPP1 and 7.4 % for PHOSPHO1. Thus, TNAP inhibitor 1 was established as a drug-like and selective probe molecule, prompting further evaluation of its therapeutic potential as a systemically active TNAP inhibitor.
Table 3.
Selectivity profile of TNAP inhibitor 1
| Selectivity (IC50, μM) | PubChem (# of Assays) | ||||
|---|---|---|---|---|---|
| TNAP | PLAP | IAP | Active | Inactive | |
 |
0.19 | >100 | >100 |
2 (TNAP, CYP2C19) |
258 |
The in vitro profile of 1 suggested that this compound had the potential for further development since it had properties indicative of systemic availability. In order to evaluate the potential for systemic activity, the plasma levels of compound 1 were assessed following subcutaneous administration. Rats were dosed subcutaneously with compound 1 at 4.13 mg/kg. At the 1 h timepoint compound 1 showed plasma levels consistent with achieving therapeutic concentrations (Cmax = 1.5 μg/mL), indicating the potential for in vivo efficacy. In summary, these data indicate that compound 1 may find utility as an in vivo tool for elucidating the role of TNAP in vascular calcification in animal models.
Mechanistic Studies
The mechanism of a general alkaline phosphatase reaction is outlined in Figure 4. Briefly, the initial alkaline phosphatase (E) catalyzed reaction consists of a substrate (DO-Pi) binding step, phosphate-moiety transfer to Ser-93 (in the TNAP sequence of its active site) and product alcohol (DOH) release. In the second step of the reaction, phosphate is released through hydrolysis of the covalent intermediate (E-Pi) and the non-covalent complex (E·Pi) of the inorganic phosphate in the active site. Phosphate release is the rate-limiting step of the overall reaction resulting in accumulation of the phosphorylated enzyme. In the presence of nitrogen-containing alcohol molecules (AOH), such as the buffer diethanolamine (DEA), phosphate is also released via a faster transphosphorylation reaction without affecting the rate-limiting step. The physiological relevance and identity of the phosphate-acceptor molecules in vivo are not yet known.
Figure 4.

The catalytic mechanism of the alkaline phosphatase reaction. See text for details.
To test the reversibility of binding of 1 to TNAP and to qualitatively estimate the rate at which equilibrium was achieved, the compound was serially diluted and pre-incubated with TNAP at a concentration 12.5-fold higher than in the final assay. Incubation at higher concentrations of a mixture of enzyme and inhibitor is a standard method to accelerate the binding process compared to the assay at normal concentrations. The rate of binding is proportional to the concentration of reactants, an important consideration if the enzyme is inactivated through a collision-based mechanism by the compound itself or a product of its degradation. In addition, higher concentrations of inhibitor shifts the equilibrium of binding towards higher saturation within the enzyme-inhibitor complex promoting any slow conversion of the enzyme-inhibitor complex.
The data for mechanistic experiments performed with TNAP inhibitor 1 are summarized in Figure 5. The binding of the compound appears to obey fast-equilibrium kinetics and lacks any time-dependent component. Compound potency in the assay was unchanged either right after mixing with the enzyme (EI 0:0) or after a pre-incubation for 1h in the presence of elevated concentrations of compound 1 with (EI 1:1) or without (EI 1:0) an additional 1h incubation post-dilution to the final compound concentrations.
Figure 5.
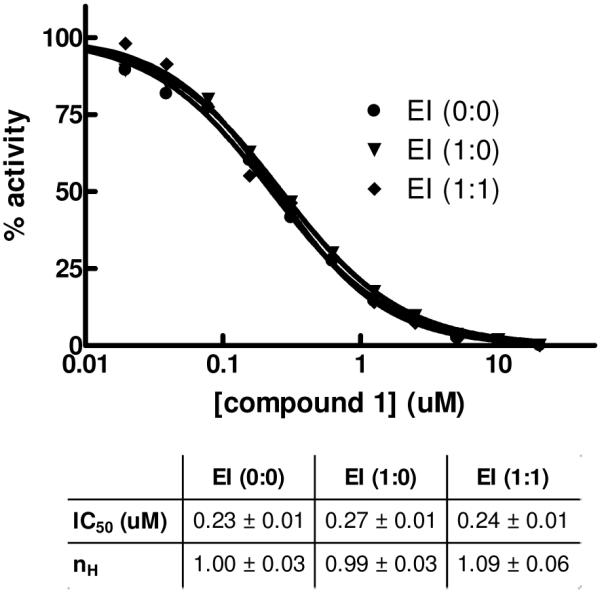
Time-dependent mechanistic studies of TNAP inhibition with 1. The enzyme was added with compound 1 serially diluted immediately prior to activity measurement (circle, EI (0:0)) or pre-incubated with the compound for 1h at 12.5-fold the concentrations and then diluted to final concentrations with (diamond, EI (1:1)) or without (inverted triangle, EI (1:0)) an additional 1h incubation after the dilution and prior to activity measurement. The dose-response curves were analyzed using Hill equation; best-fit parameters (IC50 and Hill coefficient nH) and their standard errors of fit are shown in the Table.
In addition, we completed detailed mechanism of action (MOA) studies with 1 at different concentrations of phosphate-donor substrate, 1,2-dioxetane reagent disodium 2-chloro-5-(5′-chloro-4-methoxyspiro[1,2-dioxetane-3,2′-tricyclo[3.3.1.13,7]decan]-4-yl)-phenol-1-(dihydrogen phosphate) (CDP-star), or phosphate-acceptor substrate, diethanolamine (DEA). Defining the binding mode and site of action is important for building a predictive pharmacophore model to facilitate future medicinal chemistry efforts. The artificial substrate CDP-star is expected to provide an adequate system for studying the effects of compound 1 on TNAP, since the rate-limiting step for the reaction is downstream of active site phosphorylation, as noted previously. As shown in Figure 6A, [CDP-star]-dependent curves obtained in the presence of different concentrations of 1 and plotted using Lineweaver-Burk coordinates yields parallel lines. This confirms the uncompetitive nature of the compound binding versus the CDP-star substrate arising from the compound’s binding to enzyme-substrate complex, most likely after the active site phosphorylation and targeting either E-Pi or E·Pi. This mode of inhibition was also observed for levamisole, theophylline and L-homoarginine and some inhibitors identified in the earlier rounds of screening.8,10 Interestingly, all other series identified in the current HTS campaign demonstrated competitive inhibition with respect to the phosphate-donor substrate.11, 12 A similar study was performed to characterize the mode of TNAP inhibition by compound 1 with respect to the phosphate-acceptor substrate DEA. Compound 1 demonstrated non-competitive inhibition against DEA (Figure 6B) and this is consistent with the activity profile of the sulfonamide series in the in vitro luminescent assay performed at different concentrations of DEA. This MOA indicates that the inhibitor could bind either before or after DEA binding (E-Pi or E-Pi·AOH), suggesting that compound 1 occupies a distinct binding site. In contrast, the pyrazole series demonstrated competitive inhibition with respect to DEA, potentially occupying the site of DEA binding.12
Figure 6.

Lineweaver-Burk plots for compound 1 MOA experiments. Inhibition of TNAP was measured in the presence of the following concentrations of 1: 0 μM (open circle), 0.195 μM (closed circle), 0.39 μM (open square), 0.78 μM (closed square), 1.56 μM (open diamond). The concentrations of DEA and CDP-star were equal to 100 mM (A) and 50 μM (B), respectively. The Ki values for compound 1 are 0.34 μM (Fig. 6A) and 0.59 μM (Fig. 6B).
Conclusion
High-throughput screening utilizing luminescent and colorimetric assays led to the identification of several potent and selective, small molecule inhibitors of the TNAP enzyme. Hit validation and directed synthesis led to the establishment of 1 (2,5-dimethoxy-N-(quinolin-3-yl)benzenesulfonamide) as a potent TNAP inhibitor with excellent selectivity over other alkaline phosphatases, favorable ADME profiles, acceptable aqueous solubility, and good plasma levels after subcutaneous dosing. In addition, an equally potent inhibitor (119 nM) from this series, 18 (5-bromo-2-methoxy-N-(quinolin-3-yl)benzenesulfonamide) was also found through lead validation studies. These molecules may find utility to determine the potential of TNAP inhibitors as therapeutics for vascular calcification in target validation studies. Future work will describe the continued in vitro characterization and in vivo efficacy studies of this promising series of TNAP inhibitors.
Experimental Section
Compound screening library
The compound library was supplied by the NIH Molecular Libraries Small Molecule Repository (MLSMR, http://www.mli.nih.gov/mlsmr). The MLSMR, funded by the NIH, is responsible for the selection of small molecules for HTS screening, their purchase and QC analysis, library maintenance and distribution within the NIH Molecular Libraries Screening Center Network (MLSCN, http://www.mli.nih.gov/mlscn). Both MLSMR and MLSCN are components of the Molecular Libraries Initiatives (MLI, http://nihroadmap.nih.gov/molecularlibraries) within the NIH Roadmap Initiative (www.nihroadmap.nih.gov). MLSMR compounds are acquired from commercial, and in part from academic and government sources and are selected based on the following criteria: samples are available for re-supply in 10 mg quantity, are at least 90% pure, have acceptable physicochemical properties and contain no functional groups or moieties which are known to generate artifacts in HTS (http://mlsmr.glpg.com/). Compounds are selected to represent diversified chemical space with clusters of closely related analogues to aid in the HTS-based SAR analysis.
Expression and preparation of test enzymes
Expression plasmids containing a secreted epitope-tagged TNAP were transfected into COS-1 cells for transient expression.10 The medium was replaced with Opti-MEM 24 h later, and the serum-free media containing secreted proteins were collected 60 h after electroporation. The conditioned medium was dialyzed against TBS containing 1 mM MgCl2 and 20 mM ZnCl2 (to remove phosphate) and filtered through a 0.22 μm cellulose acetate filter.
HTS assays
Assays were developed and performed as described in detail elsewhere.11 Briefly, the TNAP luminescent assay was performed in 384-well white plates (784075, Greiner) at 50 μM CDP-star substrate in assay buffer containing 100 mM DEA-HCl, pH 9.8, 1 mM MgCl2 and 20 μM ZnCl2. The luminescence signal was measured after a 30 min. incubation at room temperature on an EnVision plate reader (Perkin Elmer, Inc.). Analogous luminescent assays were optimized and utilized for PLAP and IAP with the CDP-star concentration adjusted to their respective Km values, 85 μM and 177 uM respectively.
The colorimetric TNAP assay was performed as previously described8 with slight modifications. TNAP in assay buffer containing 1 M DEA-HCl, pH 9.8, 1 mM MgCl2 and 20 uM ZnCl2 was added with 0.5-mM pNPP substrate and after a 1h incubation, the reaction was terminated by adding 2,3-dimercapto-1-propanesulfonate (a compound that binds Zn2+ with high affinity thus inactivating the enzyme) to a concentration of 100 μM. TNAP activity was measured using absorbance at 405 nm.
General Synthetic Procedures
All solvents and chemicals used were purchased from Sigma-Aldrich, Acros, or Chembridge and were used as received without further purification. Purity and characterization of compounds were established by a combination of liquid chromatography-mass spectroscopy (LC-MS), and NMR analytical techniques and was >95% for all tested compounds. Silica gel column chromatography was carried out using prepacked silica cartridges from RediSep (ISCO Ltd.) and eluted using an Isco Companion system. 1H NMR spectra were acquired on a Varian Inova 300 MHz. Chemical shifts are reported in ppm from residual solvent peaks (δ 7.27 for CDCl3 1H NMR). High-resolution ESI-TOF mass spectra were acquired at the Center for Mass Spectrometry at The Scripps Research Institute (La Jolla, CA). HPLC-MS analyses were performed on a Shimadzu 2010EV LCMS using the following conditions: Kromisil C18 column (reverse phase, 4.6 mm × 50 mm); a linear gradient from 10% acetonitrile and 90% water to 95% acetonitrile and 5% water over 4.5 min; flow rate of 1 mL/min; UV photo-diode array detection from 200 to 300 nm.
General method for the synthesis of sulfonamide TNAP inhibitors
To a stirred solution of the sulfonyl chloride (0.5 mmol in DMF), the appropriate aryl amine (0.5 mmol) was added followed by N,N-diisopropylethylamine (0.75 mmol) and stirred at room temperature for 18 h. Solvents were removed by rotary evaporation and the products were isolated by flash chromatography and reverse phase HPLC and lyophilized to provide the final compounds which were determined to be >95% pure by HPLC-UV, HPLC-MS, and 1H NMR.
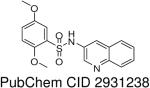
2,5-Dimethoxy-N-(quinolin-3-yl)benzenesulfonamide (1)
Prepared according to the general procedure to yield a yellow solid (67%). 1H NMR (300 MHz, CDCl3): δ 8.698 (s, 1H), 8.30 (d, J = 8.1 Hz, 1H), 8.10 (s, 1H), 8.01 (d, J = 7.8 Hz, 1H), 7.90 (t, J = 7.5 Hz, 1H), 7.79 (s, 1H), 7.42 (d, J = 2.7 Hz, 1H), 7.00 (m, 2H), 3.95 (s, 3H), 3.77 (s, 3H). ESI-MS m/z 345 [M + H]+. HRMS m/z calcd for C17H17N2O4S [M + H]+: 345.0903. Found: 345.0903.
2,5-Dimethoxy-N-(pyridin-3-yl)benzenesulfonamide (2)
Prepared according to the general procedure to yield a white solid (72%). 1H NMR (300 MHz, CDCl3): δ 9.01 (d, J = 2.4 Hz, 1H), 8.19 (m, 1H), 7.6 (m, 4H), 6.85 (m, 3H), 3.86 (s, 3H), 3.73 (s, 3H). ESI-MS m/z 295 [M + H]+. HRMS m/z calcd for C13H15N2O4S [M + H]+: 295.0747. Found: 295.1435.
2,5-Dimethoxy-N-(naphthalen-2-yl)benzenesulfonamide (12)
Prepared according to the general procedure to yield a white powder (6%). 1H NMR (300 MHz, CDCl3): δ 7.73 (m, 3H), 7.57 (d, J = 2.1 Hz, 1H), 7.42 (m, 4H), 7.29 (m, 1H), 6.98 (m, 2H), 4.05 (s, 3H), 3.72 (s, 3H). ESI-MS m/z 344 [M + H]+. HRMS m/z calcd for C18H18NO4S [M + H]+: 344.0951. Found: 344.0949.
2,5-Dimethoxy-N-(quinolin-6-yl)benzenesulfonamide (13)
Prepared according to the general procedure to yield a yellow solid (35%). 1H NMR (300 MHz, CDCl3): δ 9.09 (s, 2H), 8.43 (d, J = 7.8 Hz, 1H), 8.30 (d, J = 8.1 Hz, 1H), 7.82 (d, J = 15.6 Hz, 3H), 7.44 (s, 1H), 7.0 (m, 2H), 3.93 (s, 3H), 3.75 (s, 3H). ESI-MS m/z 345 [M + H]+. HRMS m/z calcd for C17H17N2O4S [M + H]+: 345.0903. Found: 345.0903.
5-Chloro-2-methoxy-N-(quinolin-3-yl)benzenesulfonamide (14)
Prepared according to the general procedure to yield a yellow solid (17%). 1H NMR (300 MHz, DMSO-d6): δ 10.72 (s, 1H), 8.68 (s, 1H), 7.95 (m, 2H), 7.77 (m,1H), 7.65 (m, 2H), 7.21 (d, J = 9.3 Hz, 1H), 3.85 (s, 3H). ESI-MS m/z 349 [M + H]+. HRMS m/z calcd for C16H14ClN2O3S [M + H]+: 349.0408. Found: 349.0403.
3-Methoxy-N-(quinolin-3-yl)benzenesulfonamide (15)
Prepared according to the general procedure to yield a yellow solid (15%).1H NMR (300 MHz, DMSO-d6): δ 10.83 (s, 1H), 8.64 (d, J = 2.4 Hz, 1H), 8.03 (m, 1H), 7.94 (m, 2H), 7.65 (m, 2H), 7.45 (m, 1H), 7.35 (m, 1H), 7.17 (m, 1H), 3.75 (s, 3H). ESI-MS m/z 315 [M + H]+. HRMS m/z calcd for C16H15N2O3S [M + H]+: 315.0798. Found: 315.0792.
N-(2,5-Dimethoxyphenyl)quinoline-3-sulfonamide (16)
To a stirred solution of the quinoline 3-sulfonyl chloride (0.5mmol, 115mg) in DMF the 2,5 dimethoxy aniline (0.5mmol, 76mg) was added followed by N,N-diisopropylethylamine (0.75mmol). This mixture was stirred at room temperature overnight. Reverse phase HPLC afforded a white solid (7%). 1H NMR (300 MHz, CDCl3): δ 9.16 (d, J = 2.4 Hz, 1H), 8.60 (d, J = 2.4 Hz, 1H), 8.15 (m, 1H), 7.89 (m, 1H), 7.65 (m, 1H), 7.26 (d, J = 2.4 Hz, 2H), 7.19 (s, 1H), 6.60 (m, 2H), 3.79 (s, 3H), 3.52 (s, 3H). ESI-MS m/z 345 [M + H]+. HRMS m/z calcd for C17H17N2O4S [M + H]+: 345.0903. Found: 345.0902.
5-Bromo-2-methoxy-N-(quinolin-3-yl)benzenesulfonamide (18)
Prepared according to the general procedure to yield a white powder (36%). 1H NMR (300 MHz, DMSO-d6): δ 10.71 (s, 1H), 8.69 (d, J = 3.0 Hz, 1H), 7.94 (m, 3H), 7.75 (m, 1H), 7.65 (m, 1H), 7.52 (m, 1H), 7.15 (d, J = 8.7 Hz, 1H), 3.85 (s, 3H). ESI-MS m/z 394.8 [M + H]+. HRMS m/z calcd for C16H14BrN2O3S [M + H]+: 392.9903. Found: 392.9906.
2-Methoxy-5-methyl-N-(quinolin-3-yl)benzenesulfonamide (19)
Prepared according to the general procedure to yield a yellow solid (3%). 1H NMR (300 MHz, CDCl3): δ 8.70 (s, 1H), 8.30 (d, J = 8.1 Hz, 1H), 8.01 (d, J = 7.8 Hz, 1H), 7.89 (m, 1H), 7.77 (m, 1H), 7.70 (s, 1H), 7.32 (m, 2H), 3.97 (s, 3H), 2.89 (s, 3H). ESI-MS m/z 329 [M+H]+. HRMS m/z calcd for C17H17N2O3S [M + H]+: 329.0954. Found: 329.0960.
2-Methoxy-4-nitro-N-(quinolin-3-yl)benzenesulfonamide (20)
Prepared according to the general procedure to yield a yellow powder (9%).1H NMR (300 MHz, DMSO-d6): δ 8.68 (d, J = 2.4 Hz, 1H), 8.10 (d, J = 8.4 Hz, 1H), 7.99 (d, J = 2.4 Hz, 1H), 7.92 (m, 3H), 7.84 (m, 1H), 7.65 (m, 1H), 7.55 (m, 1H), 3.99 (s, 3H). ESI-MS m/z 360 [M + H]+. HRMS m/z calcd for C16H14N3O5S [M + H]+: 360.0649. Found: 360.0644.
2-Methoxy-5-methyl-N-(pyridin-3-yl)benzenesulfonamide (21)
Prepared according to the general procedure to yield a yellow powder (43%). 1H NMR (300 MHz, CDCl3): δ 8.35 (m, 2H), 7.70 (m, 1H), 7.62 (s, 1H), 7.30 (m, 2H), 6.93 (m, 1H), 4.02 (s, 3H), 2.29 (s, 3H). ESI-MS m/z 279 [M + H]+. HRMS m/z calcd for C13H15N2O3S [M + H]+: 279.0798. Found: 279.0801.
2-Methoxy-4-nitro-N-(pyridin-3-yl)benzenesulfonamide (22)
Prepared according to the general procedure to yield a yellow solid (53%). 1H NMR (300 MHz, CDCl3): δ 8.73 (d, J = 4.8 Hz, 1H), 8.66 (s, 1H), 8.23 (m, 1H), 7.99 (m, 1H), 7.89 (s, 1H), 7.83 (m, 1H), 7.54 (m, 1H), 3.85 (s, 3H). ESI-MS m/z 310 [M + H]+. HRMS m/z calcd for C12H10N3O5S [M - H]- : 308.0347. Found: 308.0347.
Enzymatic counterscreening assays
Phosphoethanolamine (PEA) activity for PHOSPHO1 was assayed discontinuously, at 37 °C, by measuring the amount of inorganic phosphate released, according to the previously described procedure,14 adjusting the assay medium to a final volume of 0.15 mL. Standard conditions were 20 mM Tris buffer, pH 7.2, containing 25% glycerol (w/v), 25 μg/mL BSA, 2 mM MgCl2 and 2.5 mM PEA. The reaction was initiated by the addition of the enzyme and stopped with 0.075 mL of cold 30 % TCA at appropriate time intervals. The reaction mixture was centrifuged at 4,000 x g, and phosphate was quantified in the supernatant after pH neutralization with 0.1 M NaOH. p-Nitrophenylthymidine 5′-monophosphate (pNP-TMP) activity for NPP1 was assayed discontinuously, at 37 °C, by following the liberation of p-nitrophenolate ion (ε 1 M, pH 13 = 17,600 M-1 cm-1), at 410 nm. Standard conditions were 50 mM Tris buffer, pH 7.4 or 100 mM Tris buffer, pH 8.9, containing 2 mM MgCl2 and 5 mM pNP-TMP, in a final volume of 0.15 mL. The reaction was initiated by the addition of the enzyme and stopped with 0.15 mL of 1 M NaOH at appropriate time intervals. All determinations were carried out in triplicate and the initial velocities were constant for at least 90 min, provided that less than 5% of substrate was hydrolyzed. Controls without added enzyme were included in each experiment to allow for the non-enzymatic hydrolysis of substrate. We used the inhibitor compound 1 at a final concentration of 10 μM to assess its effect on PHOSPHO1 and NPP1 activities.
Assessment of plasma and microsomal stability and permeability
To assess plasma stability, the test compounds were incubated in fresh rat plasma at 37 °C. To determine metabolic stability, the compounds in triplicate were incubated with pooled rat liver microsomes (BD Scientific) in the presence of NADPH (Sigma) at 37 °C. Liquid chromatography/mass spectrometry (LC/MS) was applied in quantitative analysis of compounds in the biological matrix. Mass spectrometry (Shimadzu 2010EV) was used to conduct mass analysis in multiple-reaction-monitoring (MRM) mode. The compound stabilities are expressed as the percentage of the remaining compound to the initial concentration was calculated using Shimadzu LabSolutions software and Excel. The permeability was determined using the PAMPA method described previously.15
Solubility
Solubility analysis was performed using a direct UV kinetic solubility method in a 96-well plate format. All liquid dispense and transfer steps were performed with the Freedom Evo automated liquid handler (Tecan US). Solubility measurements were performed in an aqueous buffer solution (System Solution, pION Inc) at pH 7.4, in duplicate. Samples were incubated at room temperature for a minimum of 18 h to achieve equilibrium, then filtered (filter plate, pION Inc) to remove any precipitate formed. The concentration of the compounds was measured by UV absorbance (250-498 nm) using the Infinite M200 (Tecan US) and compared to the spectra of the precipitation-free reference solutions. Spectroscopically pure 1-propanol (Sigma) was used as a cosolvent to suppress precipitation in the reference solutions. The solubility of each compound was determined using μSOL Evolution Plus software v3.2 (pION Inc) and is expressed as the concentration (μg/mL) of a solute in a saturated solution.
Plasma concentration analysis
For evaluation of in vivo compound concentration, 400 microliters of a 10 micromolar solution of 1 (4.13 mg/kg; 50% DMSO in normal saline), were subcutaneously injected in each rat. Blood samples were drawn and frozen immediately. Plasma was harvested and kept at -20 °C until assayed. Concentrations of 1 in plasma were determined using a validated analytical procedure based on high-performance liquid chromatography. LC-MS/MS analyses were carried out using a SCIEX API3000 triple quadrupole mass spectrometer (PE Sciex Instruments, Boston, MA) operating in electrospray ionization mode. Chromatography was carried out using gradient elution (water-acetonitrile) on a Kromisil C18 reverse-phase column at a flow rate of 1 mL/min. Plasma compound concentrations were determined using a 7 point calibration curve derived from peak areas obtained from serially-diluted solutions of 1.
Acknowledgment
This work was supported in part by NIH Grants U54HG003916 and DE12889.
Abbreviations
- AP
alkaline phosphatase
- IAP
intestinal alkaline phosphatase
- PLAP
placental alkaline phosphatase
- TNAP
tissue-nonspecific alkaline phosphatase
- IIAC
idiopathic infantile arterial calcification
- VSMC
vascular smooth muscle cells
- HTS
high-throughput screening
- ADME
absorption, distribution, metabolism, excretion
- CYP2C19
Cytochrome P450 2C19
- MLSCN
Molecular Libraries Screening Center Network
- MLSMR
Molecular Libraries Small Molecule Repository
- SAR
structure-activity relationship
- MOA
mechanism of action
- CDP-star
disodium 2-chloro-5-(5′-chloro-4-methoxyspiro[1,2-dioxetane-3,2′-tricyclo[3.3.1.13,7]decan]-4-yl)-phenol-1-(dihydrogen phosphate)
- PAMPA
parallel artificial membrane permeability assay
References
- (1).Millán JL. Mammalian alkaline phosphatases. From biology to applications in medicine and biotechnology. Wiley-VCH Verlag GmbH & Co; Weinheim, Germany: 2006. pp. 1–322. [Google Scholar]
- (2).Hessle L, Johnson KA, Anderson HC, Narisawa S, Sali A, Goding JW, Terkeltaub R, Millán JL. Tissue-nonspecific alkaline phosphatase and plasma cell membrane glycoprotein-1 are central antagonistic regulators of bone mineralization. Proc. Natl. Acad. Sci. 2002;99:9445–9449. doi: 10.1073/pnas.142063399. [DOI] [PMC free article] [PubMed] [Google Scholar]
- (3).Harmey D, Hessle L, Narisawa S, Johnson KA, Terkeltaub R, Millán JL. Concerted regulation of inorganic pyrophosphate and osteopontin by Akp2, Enpp1 and Ank: An integrated model of the pathogenesis of mineralization disorders. Am. J. Pathol. 2004;164:1199–1209. doi: 10.1016/S0002-9440(10)63208-7. [DOI] [PMC free article] [PubMed] [Google Scholar]
- (4).Addison WN, Azari F, Sørensen ES, Kaartinen MT, McKee MD. Pyrophosphate inhibits mineralization of osteoblast cultures by binding to mineral, up-regulating osteopontin, and inhibiting alkaline phosphatase activity. J. Biol. Chem. 2007;282:15872–15873. doi: 10.1074/jbc.M701116200. [DOI] [PubMed] [Google Scholar]
- (5).Murshed M, Harmey D, Millán JL, McKee MD, Karsenty G. Unique coexpression in osteoblasts of broadly expressed genes accounts for the spatial restriction of ECM mineralization to bone. Genes Dev. 2005;19:1093–1104. doi: 10.1101/gad.1276205. [DOI] [PMC free article] [PubMed] [Google Scholar]
- (6).Terkeltaub RA. Inorganic pyrophosphate generation and disposition in pathophysiology. Am. J. Physiol. Cell Physiol. 2001;281:C1–C11. doi: 10.1152/ajpcell.2001.281.1.C1. [DOI] [PubMed] [Google Scholar]
- (7).Jono S, Shioi A, Ikari Y, Nishizawa Y. Vascular calcification in chronic kidney disease. J. Bone Miner. Metab. 2006;24:176–181. doi: 10.1007/s00774-005-0668-6. [DOI] [PubMed] [Google Scholar]
- (8).Narisawa S, Harmey D, Yadav MC, O’Neill WC, Hoylaerts MF, Millán JL. Novel inhibitors of alkaline phosphatase suppress vascular smooth muscle cell calcification. J. Bone Miner. Res. 2007;22:1700–1710. doi: 10.1359/jbmr.070714. [DOI] [PubMed] [Google Scholar]
- (9).Lomashvili KA, Garg P, Narisawa S, Millán JL, O’Neill WC. Upregulation of alkaline phosphatase and pyrophosphate hydrolysis: Potential mechanism for uremic vascular calcification. Kidney Inter. 2008;73:1024–1030. doi: 10.1038/ki.2008.26. [DOI] [PMC free article] [PubMed] [Google Scholar]
- (10).Kozlenkov A, Hoylaerts MF, Ny T, Le Du M, Millán JL. Residues determining the binding specificity of uncompetitive inhibitors to tissue-nonspecific alkaline phosphatase. J. Bone Miner. Res. 2004;19:1862–1872. doi: 10.1359/JBMR.040608. [DOI] [PubMed] [Google Scholar]
- (11).Sergienko E, Su Y, Chan X, Brown B, Hurder A, Narisawa S, Millán JL. Identification and Characterization of Novel Tissue-Nonspecific Alkaline Phosphatase Inhibitors with Diverse Modes of Action. J. Biomol. Screen. 2009;14:824–837. doi: 10.1177/1087057109338517. [DOI] [PMC free article] [PubMed] [Google Scholar]
- (12).Sidique S, Ardecky R, Su Y, Narisawa S, Brown B, Millán JL, Sergienko E, Cosford ND. Design and synthesis of pyrazole derivatives as potent and selective inhibitors of tissue-nonspecific alkaline phosphatase (TNAP) Bioorg. Med. Chem. Lett. 2009;19:222–225. doi: 10.1016/j.bmcl.2008.10.107. [DOI] [PMC free article] [PubMed] [Google Scholar]
- (13).Roberts S, Narisawa S, Harmey D, Millán JL, Farquharson C. Functional involvement of PHOSPHO1 in matrix vesicle-mediated skeletal mineralization. J Bone Miner. Res. 2007;22:617–627. doi: 10.1359/jbmr.070108. [DOI] [PubMed] [Google Scholar]
- (14).Pizauro JM, Ciancaglini P, Leone FA. Characterization of the phosphatidylinositol-specific phospholipase C-released form of rat osseous plate alkaline phosphatase and its possible significance on endochondral ossification. Mol. Cell. Biochem. 1995;152:121–129. doi: 10.1007/BF01076074. [DOI] [PubMed] [Google Scholar]
- (15).Kansy M, Senner F, Gubernator K. Physicochemical High Throughput Screening: Parallel Artificial Membrane Permeation Assay in the Description of Passive Absorption Processes. J. Med. Chem. 1998;41:1007–1010. doi: 10.1021/jm970530e. [DOI] [PubMed] [Google Scholar]