

Abstract
CDK9 associates with T-type cyclins and positively regulates transcriptional elongation by phosphorylating RNA polymerase II (RNAPII) and Negative Elongation Factors. However, it is unclear whether CDK9 is required for transcription of most genes by RNAPII or alternatively plays a role regulating the expression of restricted subsets of genes. We have investigated the direct effects of inhibiting cellular CDK9 activity in global gene expression in human cells by using a dominant negative form of CDK9 (dnCDK9). We have also compared direct inhibition of cellular CDK9 activity to pharmacological inhibition with flavopiridol (FVP), a CDK inhibitor that potently inhibits CDK9 and cellular transcription. Because of its presumed selectivity for CDK9, FVP has been previously used as a tool to infer the role of CDK9 on global gene expression. DNA microarray analyses described here show that inhibition of gene expression by FVP is consistent with global inhibition of transcription. However, specific inhibition of CDK9 activity with dnCDK9 leads to a distinctive pattern of changes in gene expression, with more genes being specifically upregulated (122) than downregulated (84). Indeed, the expression of many short-lived transcripts downregulated by FVP is not modulated by dnCDK9. Nevertheless, consistently with FVP inhibiting CDK9 activity, a significant number of the genes downregulated/upregulated by dnCDK9 are modulated with a similar trend by FVP. Our data suggests that the potent effects of FVP on transcription are likely to involve inhibition of CTD kinases in addition to CDK9. Our data also suggest complex and gene–specific modulation of gene expression by CDK9.
Keywords: Transcription, CDK9, RNA polymerase II, CDKs, control of gene expression
Introduction
CDK9, a member of the cyclin dependent kinase family (Graña et al., 1994), associates with T-type cyclins to form Positive Transcription Elongation Factors (P-TEFb) (Peng et al., 1998a; Peng et al., 1998b; Wei et al., 1998). CDK9 in complex with T-type cyclins is recruited to promoters where it stimulates transcriptional elongation by phosphorylating the C-terminal domain (CTD) of RNA polymerase II (RNAPII) and negative elongation factors (reviewed in Garriga and Graña, 2004; Marshall and Graña, 2006; Peterlin and Price, 2006). CDK9 has been shown to be essential for the expression of many genes during early development in C. elegans (Shim et al., 2002). While, initial studies appeared to indicate that CDK9 activity is required for RNA processing rather than elongation of D. melanogaster heat shock genes despite its colocalization with RNAPII during elongation at these genes (Ni et al., 2004), subsequent studies have demonstrated that P-TEFb is critical for the maturation of RNAPII associated with the Hsp70 gene in Drosophila cells (Boehm et al., 2003). In yeast, the functions of P-TEFb appear to be split in two separate cyclin/CDKs: the essential Bur1/Bur2 and the non-essential Ctk1/Ctk2/Ctk3 complexes in S. cerevisiae and the essential Cdk9/Pch1 and the non-essential Lsk1/Lsc1 complexes in S. pombe (Viladevall et al., 2009). Interestingly, inhibition of the Ctk1 kinase, which phosphorylates RNAPII during elongation, is required for 3’-end RNA processing, but dispensable for transcriptional elongation (Ahn et al., 2004; Cho et al., 2001). In contrast, Bur1 is required for transcriptional elongation but apparently dispensable for most RNAPII CTD phosphorylation (Keogh et al., 2003; Murray et al., 2001), suggesting that this kinase may target other substrates in S. cerevisiae. On the other hand, S. Pombe Cdk9/Pch1 phosphorylates the CTD of both RNAPII and Spt5, a subunit of the negative elongation factor DSIF (Pei and Shuman, 2003).
In mammalian cells, a small chemical compound designated flavopiridol (FVP) has been used to determine the effects of inhibiting CDK9 on RNAPII dependent transcription (Chao and Price, 2001). FVP potently inhibits CDK9 activity with significant selectivity as compared to other CDKs that target RNAPII (i.e., CDK7) (Sedlacek, 2001). FVP inhibited transcription by RNAPII by 70% in HeLa cells in run-on assays, which was interpreted as CDK9 being required for transcription of most genes by RNAPII in mammalian cells (Chao and Price, 2001). An independent study compared the effects of FVP to treatments with Actinomycin D and 5, 6-dichloro-1-beta-D-ribofuranosylbenzimidazole (DRB), two well-known inhibitors of transcription, on global transcript expression using OCI-Ly3 B cells (Lam et al., 2001). It was found that the patterns of changes in gene expression induced by the three pharmacologic compounds were very similar, strongly suggesting that FVP effects on gene expression result from global transcriptional inhibition. These results also led to infer that CDK9 was required for the expression of most RNAPII genes in mammalian cells (Lam et al., 2001).
Using an immobilized HIV-1 DNA template and nuclear extracts, it has been previously suggested that CDK7 phosphorylates Ser-5 on the seven-amino acid signature repeats that form the CTD of RNAPII, and that CDK9 phosphorylates these repeats on Ser-2 (Zhou et al., 2000). In the presence of the HIV-1 Tat transactivator, which binds cyclin T1/CDK9 complexes, CDK9 changes substrate specificity and also phosphorylates Ser-5 and these phosphorylations are sensitive to DRB, an inhibitor of transcription elongation by RNAPII and FVP. In contrast, Ser-5 phosphorylation by CDK7 is comparatively much more resistant to FVP (Zhou et al., 2004). RNA interference experiments in C. elegans have shown that CDK9 is essential for phosphorylation of Ser 2, but not Ser 5, on the RNAPII CTD, supporting a model where P-TEFb phosphorylates Ser-2 during elongation (Shim et al., 2002). Drosophila P-TEFb is recruited to the hsp70 promoter upon heat shock and tracks throughout coding regions with RNAPII coinciding with its phosphorylation on Ser-2 (Boehm et al., 2003). Importantly, FVP treatment inhibits Ser-2, but not Ser-5 phosphorylation on the CTD of RNAPII at actively transcribed loci on Drosophila polytene chromosomes under both normal and heat shocked conditions (Ni et al., 2004). Chromatin immunoprecipitation studies in mammalian cells have shown that recruitment of CDK9 to inducible promoters coincides with phosphorylation of RNAPII on Ser-2 or Ser-2 and Ser-5 (Barboric et al., 2001; Giraud et al., 2004; Gomes et al., 2006; Hou et al., 2007; Medlin et al., 2005; Tian et al., 2003). In some of these studies, treatment with FVP/DRB has been shown to block inducible RNAPII phosphorylation at specific promoters. However, this is not always coupled to transcriptional inhibition (Gomes et al., 2006; Medlin et al., 2005).
On the other hand, in studies aimed at inhibiting HIV-1 transcription/replication in a variety of cell types including primary cells, we and others have reported that inhibition of CDK9 activity is compatible with cell proliferation and/or viability, but in all these studies CDK9 expression/activity was downregulated, but not fully eliminated (Chiu et al., 2004; Flores et al., 1999; Salerno et al., 2007). Therefore, whether CDK9 activity is essential for global gene expression in mammalian cells was not addressed in these studies.
We have previously shown that lentiviral-mediated expression of a dominant negative CDK9 mutant (dnCDK9) in HeLa cells results in preferential inhibition of Ser-2 over Ser-5 phosphorylation (Salerno et al., 2007). Under these conditions HIV-1 transcription was inhibited, but global cellular RNA synthesis was not (Salerno et al., 2007). In the present study, we have used an adenoviral transduction system to ensure high levels of dnCDK9 expression to efficiently inhibit CDK9 cellular activity to levels that affect gene expression in human cells. Under these conditions, phosphorylation of the CTD of RNAPII is inhibited at both Ser-2 and Ser-5. Microarray profiling identified changes in gene expression upon specific inhibition of CDK9 that include downregulated/upregulated transcripts with limited overlap with the effects induced by treating cells with FVP. Our data suggest that CDK9 roles in the regulation of transcription/RNA processing are gene specific and that FVP has targets in addition to CDK9 that modulate gene expression. Understanding the effect of downmodulating CDK9 activity on global gene expression is important, as CDK9 is emerging as a potential therapeutic target in AIDS, cancer, inflammation and cardiac hypertrophy (reviewed in Garriga and Graña, 2004; Klebl and Choidas, 2006; Marshall and Graña, 2006; Sano and Schneider, 2003; Wang and Fischer, 2008).
Materials and Methods
Cell culture, adenoviral transduction and FVP treatment
Human embryonic kidney 293 cells and glioblastoma T98G cells were maintained in DMEM containing 10% fetal bovine serum at 37°C in an atmosphere of 5% CO2. T98G cells were plated at a density of 1.5×10⁶ cells/10cm plate twelve hours prior to transduction with recombinant adenoviruses or treatment with Flavopiridol (FVP). Cells were transduced with CsCl purified recombinant adenoviruses at Multiplicity of Infection (MOI) of 100 plaque-forming units/cell.
Adenovirus Generation
Recombinant adenoviruses expressing a kinase-dead dominant-negative form of CDK9 (Ad-T-dnCDK9) under the control of an inducible Tet-responsive promoter were generated using the Adeno-X™ Tet-Off™ Expression Systems (Clontech, BD Biosciences). The Ad-T-dnCDK9 construct was transfected into 293 cells, which provide in trans the E1 proteins required for Adenovirus replication. Once the viruses were produced, viral stocks were generated by propagating them in 293 cells. The Adeno-X Tet-Off virus, which constitutively expresses the tetracycline-controlled transactivator (tTA) (Clontech, BD Biosciences), was also propagated in 293 cells. Amplified adenoviruses were purified by density gradient CsCl ultracentrifugation. Viral titer was determined using the Adeno-X™ rapid Titer Kit (Clontech, BD Biosciences).
Antibodies
Anti-CDK9 (sc-484) rabbit polyclonal antibody was obtained from Santa Cruz, anti-Phospho RNAPII (Ser2) (BL2894), anti-Phospho RNAPII (Ser5) (BL2896), and anti-RNAPII rabbit polyclonal antibodies were from Bethyl. Anti-PARP (51-6639GR) mouse monoclonal was obtained from BD Pharmingen.
Protein Assays
Whole protein extracts were prepared by lysing the cells in 50mM Tris-HCl (pH 7.4), 5mM EDTA, 250 mM NaCl, 50 mM NaF, 0.1% Triton X-100, 0.1 mM Na3VO4, 2mM PMSF, 10µg/ml leupeptin, 4µg/ml aprotinin and 4µg/ml pepstatin (lysis buffer). Western Blots were performed as previously described (Garriga et al., 2003; Garriga et al., 1996a; Garriga et al., 1998).
RNA sample preparation and northern blot analysis
Total RNA was isolated from T98G cells using QIAshredder and Rneasy Mini Kit from Qiagen. Northern Blots were performed as previously described (Marshall et al., 2005). Briefly, 5 µg of total RNA were resolved in formaldehyde-denaturing 0.8% agarose electrophoresis and transferred onto a nylon membrane (Hybond-N; Amersham Bioscience). Membranes were prehybridazed at 42°C in UltraHyb solution (Ambion) and incubated over-night with random-primed labeled probes in the same solution. Bands were visualized by autoradiography using intensifying BioMax Screens (Kodak).
Affymetrix microarray hybridization and quantitation
Global analysis of gene expression was performed using Affymetrix human genome U133A 2.0 DNA arrays representing about 18,953 unique (non-redundant) transcripts. A set of probes was generated with total RNA purified from T98G cells transduced with HA-dnCDK9 or control adenoviruses for 48 hrs. A second set was generated with total RNA purified from T98G cells treated with 300 nM FVP for 4, 8 and 24 hrs or left untreated.
RNA probes were labeled and hybridized to microarrays at the University of Pennsylvania Microarray Facility (U. Penn MF) following directions described in the Affymetrix GeneChip Expression Analysis Technical Manual. A confocal scanner was used to collect fluorescence signal at 3 µm resolution after excitation at 570 nm. Probe set expression estimates were generated using the Affymetrix MAS5 Statistical Algorithm followed by quantile normalization (Bolstad et al., 2003). For each microarray, the transcript intensity readings were ranked; then each transcript intensity reading was replaced by the average value of intensity readings with same rank crossing all arrays. Data quality was controlled by eliminating all problematic intensity readings whose detection levels were either ‘absent’ or ‘marginal’ from original Affymetrix intensity files. For each gene, a log2 ratio was computed between its treatment and corresponding control intensities when they are both valid. The average of log2 ratios was calculated to represent average gene expression levels among replicate arrays. When one or more readings corresponding to replicates were called absent, the average was calculated with the remaining values.
Hierarchical cluster analysis, visualization and enrichment for Gene ontology biological processes
Hierarchical cluster analysis was performed using Cluster version 3.0 (Eisen et al., 1998). Expression ratios were clustered using uncentered correlation similarity metric and average linkage clustering and visualized with Java TreeView, version 1.0.13 (Eisen et al., 1998). The web-based application Expression Analysis Systematic Explorer (EASE) (Hosack et al., 2003), part of the Database for Annotation, Visualization and Integrated Discovery (DAVID)(Dennis et al., 2003), was used to identify overrepresented gene ontology terms within a given list of genes (http://david.abcc.ncifcrf.gov/home.jsp). In particular, we imported lists of gene IDs corresponding to transcripts upregulated (log2 ratio>1) or downregulated (log2 ratio<−1) by dnCDK9, as well as lists of gene IDs corresponding to clusters of co-regulated transcripts identified using hierarchical cluster analysis.
Results
Inhibition of CDK9 activity in human cells results in upregulation and downregulation of a distinct set of genes, rather than general down-modulation of genes with short-lived transcripts
To determine whether CDK9 is required for global gene expression we have utilized adenoviral vectors to induce rapid expression of high levels of a dominant negative form of CDK9 (dnCDK9) in human T98G cells. We have previously shown that this point-mutant form of CDK9 forms inactive complexes with proteins (Garriga et al., 1996a), subsequently identified as cyclins (Peng et al., 1998a; Peng et al., 1998b; Wei et al., 1997). When dnCDK9 is expressed in cells, it competes with endogenous CDK9 for binding to its cyclin partners forming inactive complexes (Garriga et al., 1996a). In addition, at high levels of dnCDK9 expression the bulk of CDK9 (endogenous CDK9 and dnCDK9) that exceeds the amount of cyclin partners is unstable leading to its rapid degradation. This results in a net downregulation of endogenous CDK9, presumably enhancing the dominant-negative effects resulting from sequestration of the cyclin regulatory subunits (Garriga et al., 1996a; O'Keeffe et al., 2000; Garriga et al., 2003 and data not shown). We rationalized that a dnCDK9 would be more effective in blocking CDK9 activity than siRNA, as previous work by others using siRNA has shown that dramatic downregulation of both CDK9 and cyclin T1 has little effect on cellular CDK9 activity presumably due to a relative decrease in the proportion of complexes bound to the CDK9 inhibitor Hexim1 (Chiu et al., 2004). Thus, T98G cells were infected with either control (Ad-Cont) or HA-dnCDK9 (Ad-dnCDK9) adenoviruses at the indicated MOIs and the effects of HA-dnCDK9 on RNAPII phosphorylation were determined using antibodies that specifically detect phosphorylated Ser-2 or Ser-5 in the tandem heptad repeats of the CTD of RNAPII. Previous work has suggested that CDK9 phosphorylates Ser-2 during elongation, while Ser-5 is phosphorylated at initiation by CDK7 (Zhou et al., 2004; Zhou et al., 2000). At lower levels of dnCDK9 expression we have observed preferential inhibition of Ser-2 phosphorylation (Salerno et al., 2007). However, at the MOIs used here we observed inhibition of phosphorylation at both Ser-2 and Ser-5. This occurred with little change in the expression of RNAPII, as detected by using antibodies that preferentially detect hypophosphorylated RNAPII (Fig. 1). Under these experimental conditions, HA-dnCDK9 is expressed at levels several fold higher than endogenous CDK9, which as expected resulted in downregulation of endogenous CDK9 (Fig. 1, lower panel). Of note, inhibition of RNAPII phosphorylation via specific inhibition of cellular CDK9 activity with HA-dnCDK9 led to induction of PARP cleavage, a hallmark of apoptosis, but this was only clearly detectable at an MOI of 100. In parallel, we also treated T98G cells with 300 nM FVP for 4, 8 and 24 hrs. This concentration of FVP has been previously used to inhibit RNAPII transcription in both HeLa and 293 cells, wherein a 1 h treatment inhibited transcription by a 60–70% as determined via run on assays (Chao and Price, 2001; Salerno et al., 2007). Fig. 1 shows that FVP treatment resulted in inhibition of both Ser-2 and Ser-5 phosphorylation, with apparently faster kinetics of Ser-5 dephosphorylation. FVP induced PARP cleavage by 4 hours, which is consistent with a rapid block in RNAPII transcription. Thus, when CDK9 activity is specifically inhibited with dnCDK9, phosphorylation of RNAPII diminishes in both Ser-2 and Ser-5 residues, an effect that is also caused by treatment with FVP.
Fig. 1. CDK9 inhibition reduces phosphorylation of RNAPII on Ser-2 and Ser 5 in T98G glioblastoma cells.
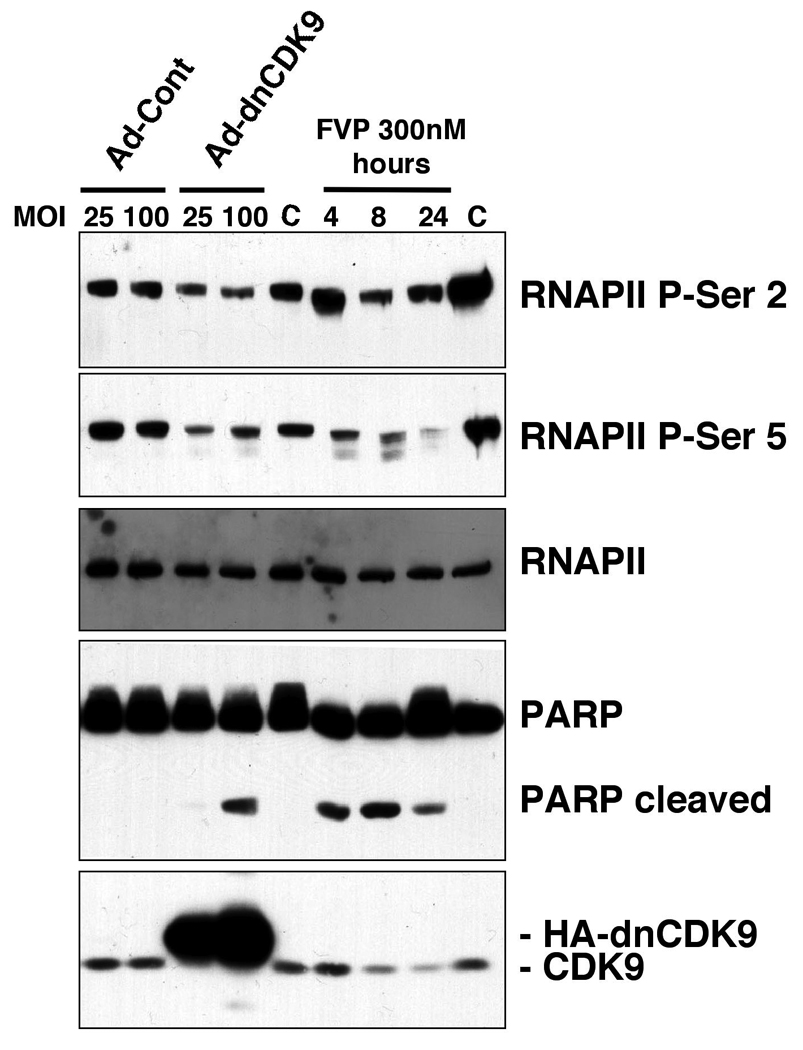
Exponentially growing T98G cells were transduced with recombinant adenoviruses expressing HA-dnCDK9 (Ad-dnCDK9) or a control adenovirus (Ad-Cont) at the indicated MOIs for 48 h or were treated with 300 nM FVP for the indicated periods of time. Expression and phosphorylation of indicated proteins were determined by western blot analysis with specific antibodies. C indicates untreated cells.
Having set treatments in T98G that result in inhibition of RNAPII phosphorylation, we undertook a global analysis of gene expression using Affymetrix human genome U133A 2.0 DNA arrays representing about 18,953 unique (non-redundant) transcripts. A set of probes was generated with total RNA purified from T98G cells transduced with HA-dnCDK9 or control adenoviruses for 48 hrs (MOI of 100). A second set was generated with total RNA purified from T98G cells treated with 300 nM FVP for 4, 8 and 24 hrs or left untreated. RNA probes were labeled and hybridized to microarrays as described in the Materials and Methods section. Transductions with recombinant HA-dnCDK9 and control adenoviruses and the corresponding total RNA preparation and labeling were independently performed three times (biological replicates: dnCDK9-1, dnCDK9-2 and dnCDK9-3). Thus, the dnCDK9 data set is the average of the log2 ratios of three separate HA-dnCDK9 vs. control adenovirus transduction experiments. For the FVP treatments duplicate biological replicates for untreated control cells and the 8 hr time point were independently generated.
Hybridized microarrays were scanned and the raw transcript intensity data were normalized as described in the Materials and Methods section. A number of restrictions were applied to the dnCDK9 data set to select the genes whose expression is modulated upon inhibition of CDK9 activity. First, only probe sets that are called present (p value <0.05) in both Ad-dnCDK9 and Ad-Cont microarrays were selected for further analysis. Second, as adenoviral transduction is known to affect gene expression (Scibetta et al., 2005), we only considered probe sets for which the log2 ratio between Ad-Cont and untransduced control cells was between −0.4 and 0.4. These arbitrary restrictions eliminate genes whose expression may depend on CDK9 activity, but this limitation ensures that false positives due to viral effects are excluded from the restricted data set. Using these restrictions the data contained 5314 probes (corresponding 4171 genes). Of this data set, 225 probe sets (corresponding to 206 unique genes) exhibited normalized Ad-dnCDK9/Ad-Cont log2 ratios <−1 or >1. The lowest log2 ratio was −2.2 and the highest was 4.7. Of note, 84 genes (97 probe sets) were downregulated and 122 genes (128 probe sets) were upregulated (see Table 1). We also found that the correlation coefficient of normalized log2 probe intensity values was 0.91 for the HA-dnCDK9 replicates, and 0.92 for the corresponding adenoviral control replicates. Whereas the correlation coefficients for probe intensity values for the 8 hr FVP and mock treatment control biological duplicates mentioned above were 0.92 and 0.95 respectively.
Table 1.
Number of probe sets modulated by treatment
| # of genes | dnCDK9 | FVP 4 h | FVP 8 h | FVP 24 h |
|---|---|---|---|---|
| Downregulated | 97 | 330 | 592 | 836 |
| Upregulated | 128 | 84 | 207 | 803 |
| Absent | - | 236 | 340 | 1167 |
Using the same 5314 probe set for the FVP treatments, we found that 2076 probe sets changed more than +/−1 log2 ratio in at least one FVP treatment vs. control. Table 1 shows that the number of downregulated genes is about 2–4 times the number of upregulated genes following 4 and 8 h of FVP treatment. The number of upregulated genes increased considerably by 24 h, while the number of downregulated genes increased to a lower extent. However, it is important to note that the amount of genes called absent increased dramatically as a function of time with the FVP treatment (Table 1). Many of the probe sets called absent are likely to correspond to potently downregulated transcripts, which are no longer detectable by the RNA probes. (When the match/mismatch signals within a probe set are close, p values are high, and probe sets are called absent). With this consideration, probe sets called absent in the FVP treatments were not eliminated, if present in the other treatments. The potent downregulating effects of FVP are also seen in Fig. 2 where the frequency of log2 ratios (treatment vs. control) within a given range (bins) is plotted as histograms. Transcripts downregulated more than 32 times (log2 < −5) are already observed by 4 h of treatment with FVP, whereas maximum upregulation is only ~3 times (log2 < 1.6). The maximum upregulation reaches 3.7 times (log2 = 1.9) by 8 h and then increases up to 18.4 times (log2 = 4.2) by 24 h. Thus, the FVP histograms do not follow a normal distribution. In contrast, the histogram representing the effects of dnCDK9 exhibit a more symmetrical distribution, which is consistent with CDK9 having a more selective effect on gene expression that includes gene upregulation and downregulation. While it is conceivable that some potently downregulated transcripts may have been called absent in cells expressing dnCDK9, this is not very likely, as the downregulation log2 values observed with dnCDK9 (up to −2.2) are significantly less dramatic than those observed with FVP (−5.7).
Fig. 2. Distribution of transcript upregulation/downregulation (log2 ratios) for each experiment vs. control for the 5314 probe sets selected for analysis as described in the text.
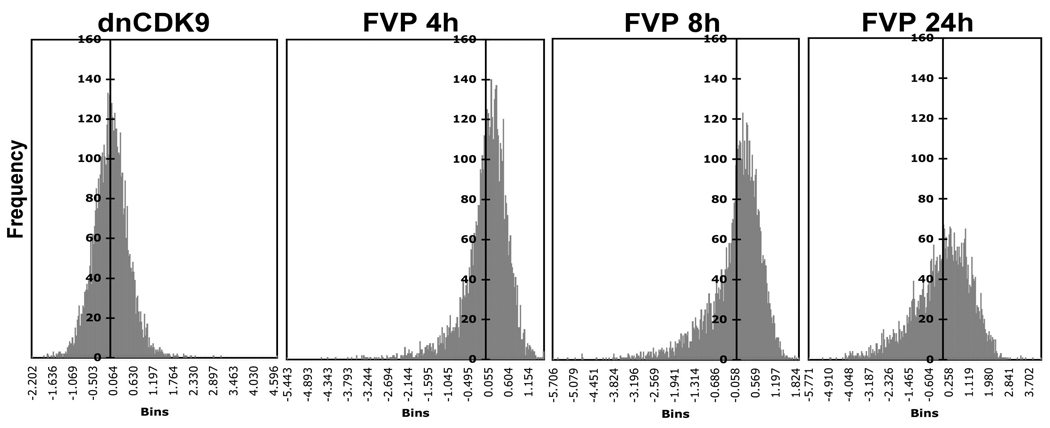
The histograms represent the frequency of transcripts whose expression changes within a given range (bins) under each condition. Histogram 1 represents Ad-dnCDK9 vs. Ad-Cont. Histogram 2–4 represent FVP treatment at 4, 8 and 24 h vs. untreated control.
Northern blot analysis was carried out for various genes to assess microarray data reliability. Fig. 3A shows that the changes in mRNA expression for Cyclin A, Hexim1, Gadd45a and Gadd45b are qualitatively similar to the changes detected by microarray analysis. Since it has been previously shown that adenoviral infection affects the expression of some cellular genes (Scibetta et al., 2005), we also wanted to confirm the effects of dnCDK9 in the expression of cellular genes using the Tet-off system. Thus, T98G cells were infected with Ad-T-dnCDK9, which directs the expression of HA-dnCDK9 under a tetracycline-repressible promoter and, subsequently incubated with tetracycline or ethanol as detailed in the Materials and Methods section. mRNA was prepared from duplicate samples and analyzed by northern blot analysis using probes directed to BAMBI, IL-8, HIST1H2AC, Dusp1, Gadd45a and Gadd45b. Fig. 3B confirms and extends the results obtained via microarray and northern blot analysis shown in Fig. 3A. In particular, it shows that specific inhibition of CDK9 activity results in downregulation of BAMBI and upregulation of IL8, Dusp1, HIST1H2AC, Gadd45a and Gadd45b. The expression of these genes in cells treated with FVP is also consistent with the microarray data (Fig. 3A and B). Another measure of the microarray reliability is the close correlation among log2 expression ratios in those cases where more than one distinct probe set corresponds to a unique gene. For instance, 16 of the 206 transcripts modulated by dnCDK9 are represented by two/three distinct probe sets. The average of the probe set log2 ratios corresponding to each transcript is shown in Fig. 3C.
Fig. 3. Assessment of microarray data reliability.

(A) 5 µg of total RNA from T98G glioblastoma cells treated as indicated were analyzed via northern blot to verify changes in expression for a selected group of genes (left panels). Microarray data are visualized as heat maps showing changes in expression (log2 ratios) obtained from the microarray hybridizations according to the color scale included below. (B) T98G cells were transduced with Ad-tTA and Ad-T-dnCDK9 for 6 h. Identical sets of transduced cells were incubated with tetracycline or vehicle for 42 additional h. Cells were harvested for western and northern blot analyses as described in Fig. 1 and Fig. 2A, respectively. Northern blot analysis and corresponding microarray data are shown as in A (C) Bar graph representing the average expression change (log2 ratio) in expression for transcripts modulated by CDK9 inhibition, which are detected by more than one probe set in the microarray. Standard deviation error bars are shown.
We next performed hierarchical cluster analysis using Cluster version 3.0 (Eisen et al., 1998). The mean log2 ratios for the 225 probe sets modulated by dnCDK9 (+/−1 log2) obtained from three independent experimental replicas was compared to the corresponding values for the FVP probe sets via hierarchical cluster analysis. Expression ratios were clustered using uncentered correlation similarity metric and average linkage clustering and visualized with Java TreeView, version 1.0.13 (Eisen et al., 1998). Fig. 4A shows a heat map of this analysis. The top dendogram shows that the closer correlation distance is between the arrays of log2 value ratios corresponding to cells treated with 300 nM FVP for 4 and 8 hrs vs. corresponding controls. The correlation distance increases when these arrays are compared to the 24 FVP vs. control array, and this distance is further increased when compared to the dnCDK9/Ad-Cont array (Fig. 4A, top dendogram). It is also clear from the heat map that the overall changes in gene expression induced by inhibiting CDK9 activity with dnCDK9 are noticeably distinct from those induced by treating cells with 300 nM FVP at any of the tested treatment times. However, there are clusters of genes in which the changes in gene expression induced by dnCDK9 correlate with treatment with FVP at one or more time points. For instance, cluster 1 (Fig. 4A, left) includes genes downregulated by dnCDK9 that are rapidly downregulated by FVP treatment. Interestingly, using Expression Analysis Systematic Explorer (EASE) software we found that cluster 1a is enriched with genes that encode transcription factors or proteins involved in transcriptional regulation (5 genes from 8 Database for Annotation, Visualization and Integrated Discovery (DAVID) Ids, p value=5.4E-4) including Pitx2, Hoxd11, Id1, Hexim1, Klf9, as well as a DNA binding protein product (ZNF322B). If the entirety of cluster 1 is considered, genes involved in transcription are also enriched (10 genes from 22 DAVID Ids, p value= 1.1E-4). This cluster also contains the gene encoding BMP and activin membrane-bound inhibitor homolog protein (BAMBI), which is downregulated by dnCDK9 and by FVP treatment (Fig. 3B). Clusters 2 and 3 include genes downregulated by dnCDK9 that are in general not regulated or are upregulated by FVP (with the exception of cluster 2b). Cluster 2 maximally enriched biological process gene ontology term (GOTERM) includes nuclear transport (5 genes of 41 DAVID Ids, p value= 5.7E-5) and mRNA metabolism (5 genes of 41 DAVID Ids, p value= 1.1E-3). Interestingly several heterogeneous nuclear ribonucleoprotein encoding genes are part of this cluster. Clusters 3 and 4 exhibit opposite changes in gene expression induced by dnCDK9 and FVP treatments. Cell organization and biogenesis is the biological process GOTERM maximally enriched in cluster 3 with 7 genes from 15 DAVID Ids (p value= 6.4E-4). Cluster 5 includes genes that are upregulated by both dnCDK9 and the 24 h treatment with FVP. Of note, this cluster is enriched in stimuli/stress response genes including Gadd45a, Gadd45b, Dusp1, Xrcc2, IL-12a and three other stimuli-induced genes (8 genes from 18 DAVID Ids; p value=6.7E-3)(Fig. 3A and 3B). Finally, clusters 6 and 7 include genes that are upregulated by dnCDK9, and either not modulated or upregulated by FVP. Cluster 6 includes IL-8, which is potently induced by inhibition of CDK9 with dnCDK9, downregulated by FVP at 8 h, and then, upregulated by FVP at 24 h (Fig. 3B left panels). Similar results were obtained by northern blot (Fig 3B).
Fig. 4. Hierarchical cluster analysis of the genes whose expression is modulated upon CDK9 inhibition with dnCDK9 or treatment with 300 nM FVP for the indicated periods of time.
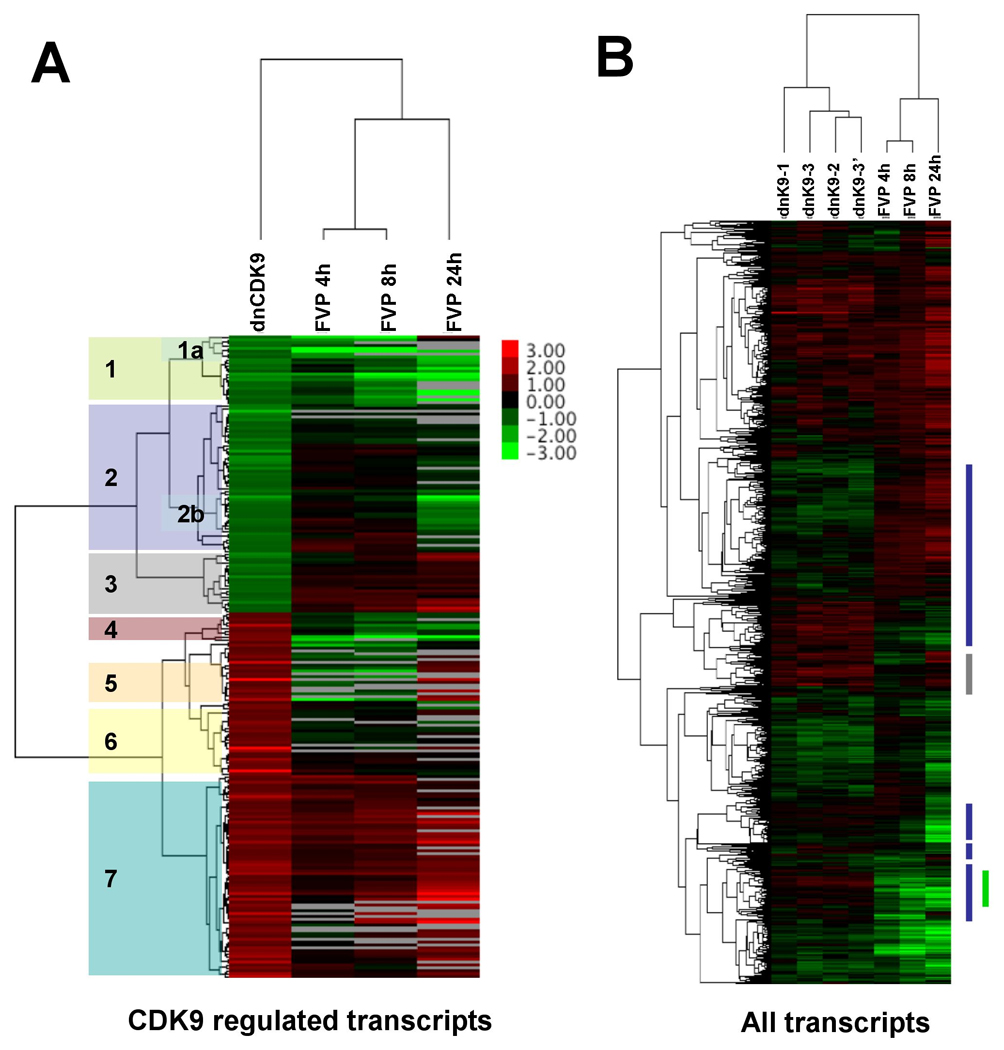
Top dendograms show correlation distance between overall expression changes for the indicated treatments (A) Hierarchical clustering (correlation uncentered and average linkage) was performed for the 225 probe sets whose expression changes more than 1 log (|log2|>1) in T98G glioblastoma cells overexpressing HA-dnCDK9 and the corresponding values obtained with each of the FVP treatments. Data was visualized with Java TreeView. Values for the dnCDK9 array are the average of the three independent biological replicates. 7 distinct clusters of genes are marked on the left. (B) Heat map comparing the changes in gene expression for each of the 5314 probes considered in the analysis (see text) for each of the data sets obtained from each independent experiment. On the right, blue bars depict clusters of genes whose changes in expression are modulated in opposite manner in dnCDK9 versus FVP, whereas grey bars mark a cluster in which the changes observed with dnCDK9 are similar to treatment with FVP for 24 h. A green bar marks transcripts that are rapidly downregulated by FVP but are not modulated by dnCDK9 or are upregulated. Legend indicates values that correspond to the color scale. Grey color indicates absent.
Next, we compared the 5314 probe data set defined above for each of the conditions indicated in Fig. 4B. As expected, the gene arrays corresponding to the three biological replicates (dnCDK9-1, dnCDK9-2, dnCDK9-3) clustered together with the experimental replicate dnCDK9-3’ (microarray replica generated using the same set of RNAs used for dnCDK9). The gene arrays for FVP treated cells also clustered together (Fig. 4B, top dendogram), but again there was little correlation between the effects of dnCDK9 and the FVP treatment. In this heat map it is also observable that the effects of FVP are time-dependent; with more genes and higher changes in expression occurring with the 24 h FVP treatment, a notion also observed in Fig. 2.
Considering the whole list of genes modulated by dnCDK9, we next utilized EASE software to determine whether inhibition of CDK9 resulted in modulation of genes implicated in specific biological processes. First, we determined enrichments of biological process GOTERMs in both dnCDK9 upregulated and downregulated genes. Table 2 shows significant enrichments for transcriptional activity and nucleic acid binding activity within the downregulated transcripts, while the molecular functions being upregulated include GTPase and kinase related activities. However, the upregulated molecular functions exhibit higher p values. It is apparent from this analysis that inhibition of CDK9 activity affects expression of multiple proteins involved in transcription and RNA processing suggesting that CDK9 contributes to the control of gene expression by both direct and indirect mechanisms. The presence of some of these transcription factors in cluster 1 of Fig. 4A indicates that the expression of these genes is co-downregulated by dnCDK9 and FVP suggesting that FVP downregulates these genes by inhibiting CDK9 activity. One of these genes is Hexim1, a CDK9 inhibitor that maintains a large pool of inactive CDK9 in unstressed cells.
Table 2.
EASE analysis of dnCDK9 modulated genes.
| Downregulated genes | ||
|---|---|---|
| GO Biological Process | EASE score |
# genes |
| Transcription | 2.0E-4 | 22 |
| Regulation of transcription | 3.2E-4 | 21 |
| Cell organization and biogenesis | 6.1E-4 | 16 |
| Nuclear transport | 8.6E-4 | 5 |
| mRNA metabolism | 2.3E-3 | 6 |
| mRNA export from nucleus | 8.6E-3 | 3 |
| mRNA processing | 8.9E-3 | 5 |
| Regulation of progression through cell cycle | 9.7E-3 | 7 |
|
Upregulated genes | ||
| GO Biological Process |
EASE score |
# genes |
| Regulation of protein kinase activity | 1.4E-4 | 7 |
| Regulation of transfer activity | 1.5E-4 | 7 |
| Cell organization and biogenesis | 3.0E-3 | 19 |
| Cell cycle | 3.1E-3 | 12 |
| Biopolymer metabolism | 3.3E-3 | 29 |
| Response to chemical stimulus | 8.2E-3 | 8 |
Biological Process are listed for genes with a p value<0.01
Discussion
In this report we have investigated the effects on global gene expression induced by specific inhibition of cellular CDK9 activity using a kinase-dead CDK9 dominant-negative mutant, which displaces endogenous CDK9 from endogenous cyclin partners. We have also compared the effects of this mutant to the effects of FVP, a pharmacological CDK inhibitor that potently inhibits CDK9 in vitro, with significant selectivity as compared to other CDKs. Our results show that specific inhibition of CDK9 with dnCDK9 in T98G cells results in upregulation of 128 transcripts and downregulation of 97 transcripts from a total of 4171 unique transcripts. In contrast, when T98G cells are treated with FVP for 4–8 hours the number of downregulated genes is 3–4 times the number of upregulated genes. Longer treatments with FVP lead to comparable number of upregulated and downregulated genes, but also to a dramatic increase in the number of transcripts called absent, which likely include a significant proportion of downregulated transcripts that are no longer detectable. In addition, it should also be taken into account that because a 24 h treatment with FVP, or other potent transcriptional inhibitors, results in differential downregulation of transcripts in a manner that reflects their stability (Lam et al., 2001), more stable transcripts accumulate relatively to the total amount of cellular RNA without necessarily being actively upregulated through transcriptional or RNA stabilization mechanisms. Therefore, it is possible that several transcripts that appear slightly upregulated in FVP-treated cells upon normalization correspond to weakly downregulated genes. Moreover, the delay in the timing of accumulation of upregulated vs. downregulated transcripts in FVP treated cells may indicate that the accumulation of these transcripts is linked to downregulation of their negative regulators.
Our results using FVP are consistent with the results of a previous study demonstrating that FVP inhibits global transcription in a manner similar to Actinomycin D and DRB. Lam et al. have shown that treatment of OCI-Ly3 B cells with FVP results in rapid downregulation of inducible genes that express labile transcripts (Lam et al., 2001). The transcripts most rapidly downregulated by FVP in our study are clustered at the bottom of Fig. 4B. It is clear that there is a very significant number of transcripts that are rapidly downregulated by FVP that are not modulated by dnCDK9 or that are upregulated (marked by a green bar on the right). This indicates that FVP is restraining transcription by other mechanisms in addition to CDK9 inhibition. Since FVP is known to inhibit other CDKs (albeit with lower potency), it is possible that inhibition of CDK9 combined with a reduction of other compensating CDK activities is responsible for the potent inhibition of inducible/labile transcripts. It should also be noted that the inhibitory potency of FVP has not been tested for some CDK family members and related kinases. Moreover, a recent screen for binding of 20 kinase inhibitors to a panel of 119 kinases has revealed that FVP binds Calcium/Calmodulin kinase 1 (CAMKK1) with higher affinity than to the CDKs and CDK-related kinases tested (Fabian et al., 2005). Unfortunately, this study did not test CDK9. Nevertheless, as CAMKKs have been implicated in the regulation of transcription factors, their inhibition by FVP in cells could also contribute to the effects of FVP in gene expression.
The results described here are in agreement with our previous observation that the effects of FVP are far more severe that specific inhibition of CDK9 activity using a dominant negative approach in primary T lymphocytes (Salerno et al., 2007). We observed that dnCDK9 could effectively inhibit HIV-1 transcription/replication without affecting T cell activation. In contrast, concentrations of FVP required to inhibit HIV-1 transcription similarly, had major effects on the expression of T cell activation markers (Salerno et al., 2007). Obviously, the severity of FVP treatment could be due to more effective inhibition of CDK9 activity than that accomplished with dnCDK9. This is shown in Fig. 1, where FVP inhibited phosphorylation of Ser-2 and Ser-5 on the CTD of RNAPII more potently than dnCDK9. However, the marked differences in modulation of gene expression by FVP and dnCDK9 are unlikely to be explained by differences in the potency of CDK9 inhibition. If this was the case, dnCDK9 effects would be expected to resemble the effects of FVP at early time points, and/or would follow attenuated, but similar trends of transcript upregulation/downregulation.
It is also noteworthy, that both FVP and dnCDK9 inhibit phosphorylation of the CTD of RNAPII on Ser-5. In the case of FVP, even at the shortest time points (4 h), Ser-5 phosphorylation appears clearly inhibited. We have previously shown that dnCDK9 preferentially inhibited Ser-2 phosphorylation in HeLa cells (Salerno et al., 2007), but the levels of dnCDK9 expressed were much lower, as expression was driven by a lentiviral/CMV, rather than a adenoviral/CMV system. Inhibition of Ser-5 phosphorylation by dnCDK9 is not due to cell type specific regulation, as we have found that dnCDK9 expressed from an adenoviral system also reduces the phosphorylation of both Ser-2 and Ser-5 in HeLa cells and normal human fibroblasts (hTERT-immortalized BJ fibroblasts)(data not shown). Since both dnCDK9 and FVP trigger dephosphorylation of Ser-5, it appears that Ser-5 phosphorylation is directly or indirectly dependent on CDK9 activity in mammalian cells. Previous studies using HIV-1 immobilized DNA templates have shown that CDK9 phosphorylates the CTD of RNAPII on Ser-2 and that Tat changes CDK9 substrate specificity to also phosphorylate Ser-5 (Zhou et al., 2004; Zhou et al., 2000). Thus, it is conceivable that cellular transactivators modulate CDK9 substrate specificity similarly, ensuring that CDK9 phosphorylates and/or maintains phosphorylation of Ser-5 during elongation. Alternatively other CTD kinases may phosphorylate Ser-5 in a manner dependent upon CDK9-mediated phosphorylation of Ser-2.
The most unexpected observation resulting from this study is the differential effects of dnCDK9 and FVP on gene expression. CDK9/T-type cyclin complexes interact with various transcription factors and are recruited to target promoters upon signals that induce these transcription factors. CDK9 recruitment to the IL-8 (Barboric et al., 2001), gamma-fibrinogen (Hou et al., 2007), cytochrome P450 1A1 (Tian et al., 2003), and p21 (Gomes et al., 2006) promoters coincides with phosphorylation of the CTD of RNAPII. Myc-dependent and early G1 induced genes have also been shown to recruit CDK9 (Bouchard et al., 2004; Yang et al., 2008). In some of these instances, FVP or DRB were found to block RNAPII phosphorylation. Surprisingly, DRB did not block expression of certain p53 dependent genes even though it blocked RNAPII phosphorylation during elongation (Gomes et al., 2006). Also, it has been recently shown that CDK9 is not required for transcription of U2 snRNA genes or transcription and RNA processing of the replication activated histone H2b gene (Medlin et al., 2005). Altogether these results indicate that the role of CDK9 in transcription and/or RNA processing is gene specific. While this is consistent with the restricted effects on gene expression induced by dnCDK9 in the current profiling studies, we did not observe concomitant downregulation of many genes within the classes detailed above. It is likely that our profiling analysis has identified those genes whose expression is more sensitive to CDK9 inhibition under our experimental conditions and that even more potent inhibition of CDK9 activity is required to observe changes in the expression of genes regulated by the transcription factors mentioned above.
A recent study has shown that HMBA, a drug that induces differentiation of a variety of cells, upregulates Hexim1 expression in a cyclin T1/CDK9/BRD4 dependent manner (He et al., 2006). Our microarray and northern blot data for Hexim1 is in agreement with this finding, and, thus, confirms the existence of a cellular feed back loop in cells to ensure precise regulation of CDK9 activity. As CDK9 activity becomes limiting, less Hexim1 is expressed, which would facilitate release of free active CDK9.
Another unexpected finding was the upregulation of several genes, including Dusp1, Gadd45a, Gadd45b and IL-8, by specifically inhibiting CDK9 activity. Many of these transcripts are found in clusters 5 and 6. They are all upregulated by dnCDK9 and long (24 h), but not short (4–8 h) FVP treatments. Gadd45a is a p53 response gene, however, in this case p53 cannot be mediating Gadd45a upregulation, as p53 is mutant in T98G cells and it does not accumulate in response to dnCDK9 or FVP treatment (data not shown). Future studies will be necessary to determine whether the expression of these genes is negatively regulated by CDK9 or are upregulated by a mechanism that senses inhibition of CDK9 or downregulation of its target genes. More surprising was the dramatic upregulation of IL-8 following dnCDK9 expression or 300 nM FVP treatment for 24 h, as CDK9 has been shown to be recruited by NF-κB to the IL-8 promoter coinciding with its upregulation (Barboric et al., 2001). Since this promoter is negatively regulated by the glucocorticoid receptor (Luecke and Yamamoto, 2005), it is conceivable that CDK9 expression has titrated out negative regulators. Thus, the dramatic upregulation of IL-8 upon CDK9 inhibition suggests that the role of CDK9 in the regulation of this cytokine is complex.
Recent studies published when this manuscript was in preparation have shown that cyclin T2 is essential for mouse embryogenesis, as no double mutant embryos were recovered from the mating of heterozygous mutant mice (Kohoutek et al., 2009). Interestingly, siRNA-mediated knockdown of either cyclin T1 or T2 in ES cells resulted only in a 1.5-fold reduction in the amounts of 59 or 76 genes, respectively. It has been suggested that the limited effects on gene expression reflect redundancy among T-type cylins on the control of gene expression (Kohoutek et al., 2009). However, it cannot be ruled out that CDK9 activity is dispensable for the expression of an unknown fraction of the unaffected genes, perhaps due to redundancy by other RNAPII CDKs. In this regard, selective inhibition of S. pombe Cdk9 blocks cell division, alters RNAPII CTD phosphorylation and represses specific subsets of transcripts, some overlapping with those repressed upon inhibition of Mcs6, the ortholog of CDK7 (Viladevall et al., 2009). Thus, our results are in agreement with the findings just reported in the fission yeast in the selective requirement of CDK9 for gene expression.
While this paper was under review it was reported that P-TEFb (cyclin T1 and CDK9) are recruited to primary response genes (PRGs) in a signal dependent manner (Hargreaves et al., 2009). Recruitment of P-TEFb results in phosphorylation of RNAPII on Ser-2 and generation of spliced mature transcripts. P-TEFb was recruited to the promoters of NF-κB-dependent genes by BRD4 in a manner that depends on NF-κB recruitment to these genes and histone H4 acetylation at various positions (Hargreaves et al., 2009). However, whether P-TEFb is recruited to constitutively expressed genes and/or secondary response genes via a different mechanism was not addressed. We are currently determining if inhibition of CDK9 activity differentially affects the expression of primary and secondary response and housekeeping genes.
In closing, our data suggest that CDK9 roles in the regulation of transcription/RNA processing are gene specific, such that expression of certain genes is highly sensitive to CDK9 inhibition, while the expression of the remaining RNAPII-dependent genes may be partially or totally independent of CDK9 activity. This gene specificity may result from more potent inhibition of elongation of certain gene transcripts by negative elongation factors requiring dedicated recruitment of P-TEFb by inducible transcription factors and BRD4. Our data also suggest that FVP has targets in addition to CDK9 that modulate gene expression. Moreover, our results reveal that CDK9 activity is important for phosphorylation of RNAPII at both Ser-2 and Ser-5. Finally, the upregulation of transcripts upon specifically inhibiting CDK9 activity suggest that CDK9 also negatively modulates gene expression, possibly indirectly, in addition to its role as positive transcription elongation factor. Alternatively, CDK9 inhibition may trigger a stress response leading to upregulation of a subset of genes including critical stress-response genes (Gadd45a, Gadd45b, Dusp1, Xrcc2, IL-12β). Considering the potential therapeutic benefits of down-modulating CDK9 activity in AIDS, cancer, cardiac hypertrophy and inflammation, these studies provide a framework for detailed future studies on the regulation of specific genes that are more susceptible to CDK9 modulation, which could have an impact on therapy. With this regard, given that CDK9 activity appears critically important for the expression of several cellular genes, it will be important to establish if the expression of these genes is less sensitive to CDK9 inhibition than the expression of the CDK9-sensitive genes associated with the disease states mentioned above.
Acknowledgements
We thank Slobodan Vucetic, Rita Vassena, Alison Kurimchak (Temple University) and Drs. Don Baldwin and John Tobias from the University of Pennsylvania Microarray facility for helpful discussions of these analyses.
This work was supported in part by grants to X.G. from the National Institute of Allergy and Infectious Diseases (R01 AI45450 and K02 AI01823), the National Institute of Mental Health (R21 MH083585) and projects of a PP1 from the National Cancer Institute (CA095569) to XG and JG. Gene expression analysis was funded in part under a grant with the Pennsylvania Department of Health. The Department specifically disclaims responsibility for any analyses, interpretations or conclusions.
References
- Ahn SH, Kim M, Buratowski S. Phosphorylation of serine 2 within the RNA polymerase II C-terminal domain couples transcription and 3' end processing. Mol Cell. 2004;13(1):67–76. doi: 10.1016/s1097-2765(03)00492-1. [DOI] [PubMed] [Google Scholar]
- Barboric M, Nissen RM, Kanazawa S, Jabrane-Ferrat N, Peterlin BM. NF-kappaB binds P-TEFb to stimulate transcriptional elongation by RNA polymerase II. Mol Cell. 2001;8(2):327–337. doi: 10.1016/s1097-2765(01)00314-8. [DOI] [PubMed] [Google Scholar]
- Boehm AK, Saunders A, Werner J, Lis JT. Transcription factor and polymerase recruitment, modification, and movement on dhsp70 in vivo in the minutes following heat shock. Mol Cell Biol. 2003;23(21):7628–7637. doi: 10.1128/MCB.23.21.7628-7637.2003. [DOI] [PMC free article] [PubMed] [Google Scholar]
- Bolstad BM, Irizarry RA, Astrand M, Speed TP. A comparison of normalization methods for high density oligonucleotide array data based on variance and bias. Bioinformatics. 2003;19(2):185–193. doi: 10.1093/bioinformatics/19.2.185. [DOI] [PubMed] [Google Scholar]
- Bouchard C, Marquardt J, Bras A, Medema RH, Eilers M. Myc-induced proliferation and transformation require Akt-mediated phosphorylation of FoxO proteins. Embo J. 2004;23(14):2830–2840. doi: 10.1038/sj.emboj.7600279. [DOI] [PMC free article] [PubMed] [Google Scholar]
- Chao SH, Price DH. Flavopiridol inactivates P-TEFb and blocks most RNA polymerase II transcription in vivo. J Biol Chem. 2001;276(34):31793–31799. doi: 10.1074/jbc.M102306200. [DOI] [PubMed] [Google Scholar]
- Chiu YL, Cao H, Jacque JM, Stevenson M, Rana TM. Inhibition of human immunodeficiency virus type 1 replication by RNA interference directed against human transcription elongation factor P-TEFb (CDK9/CyclinT1) J Virol. 2004;78(5):2517–2529. doi: 10.1128/JVI.78.5.2517-2529.2004. [DOI] [PMC free article] [PubMed] [Google Scholar]
- Cho EJ, Kobor MS, Kim M, Greenblatt J, Buratowski S. Opposing effects of Ctk1 kinase and Fcp1 phosphatase at Ser 2 of the RNA polymerase II C-terminal domain. Genes Dev. 2001;15(24):3319–3329. doi: 10.1101/gad.935901. [DOI] [PMC free article] [PubMed] [Google Scholar]
- Dennis G, Jr, Sherman BT, Hosack DA, Yang J, Gao W, Lane HC, Lempicki RA. DAVID: Database for Annotation, Visualization, and Integrated Discovery. Genome Biol. 2003;4(5):P3. [PubMed] [Google Scholar]
- Eisen MB, Spellman PT, Brown PO, Botstein D. Cluster analysis and display of genome-wide expression patterns. Proc Natl Acad Sci U S A. 1998;95(25):14863–14868. doi: 10.1073/pnas.95.25.14863. [DOI] [PMC free article] [PubMed] [Google Scholar]
- Fabian MA, Biggs WH, 3rd, Treiber DK, Atteridge CE, Azimioara MD, Benedetti MG, Carter TA, Ciceri P, Edeen PT, Floyd M, Ford JM, Galvin M, Gerlach JL, Grotzfeld RM, Herrgard S, Insko DE, Insko MA, Lai AG, Lelias JM, Mehta SA, Milanov ZV, Velasco AM, Wodicka LM, Patel HK, Zarrinkar PP, Lockhart DJ. A small molecule-kinase interaction map for clinical kinase inhibitors. Nat Biotechnol. 2005;23(3):329–336. doi: 10.1038/nbt1068. [DOI] [PubMed] [Google Scholar]
- Flores O, Lee G, Kessler J, Miller M, Schlief W, Tomassini J, Hazuda D. Host-cell positive transcription elongation factor b kinase activity is essential and limiting for HIV type 1 replication. Proc Natl Acad Sci U S A. 1999;96(13):7208–7213. doi: 10.1073/pnas.96.13.7208. [DOI] [PMC free article] [PubMed] [Google Scholar]
- Garriga J, Bhattacharya S, Calbo J, Marshall RM, Truongcao M, Haines DS, Grana X. CDK9 is constitutively expressed throughout the cell cycle, and its steady-state expression is independent of SKP2. Mol Cell Biol. 2003;23(15):5165–5173. doi: 10.1128/MCB.23.15.5165-5173.2003. [DOI] [PMC free article] [PubMed] [Google Scholar]
- Garriga J, Graña X. Cellular control of gene expression by T-type cyclin/CDK9 complexes. Gene. 2004;337:15–23. doi: 10.1016/j.gene.2004.05.007. [DOI] [PubMed] [Google Scholar]
- Garriga J, Mayol X, Graña X. The CDC2-related kinase PITALRE is the catalytic subunit of active multimeric protein complexes. Biochem J. 1996a;319(Part 1):293–298. doi: 10.1042/bj3190293. [DOI] [PMC free article] [PubMed] [Google Scholar]
- Garriga J, Peng J, Parreno M, Price DH, Henderson EE, Graña X. Upregulation of cyclin T1/CDK9 complexes during T cell activation. Oncogene. 1998;17(24):3093–3102. doi: 10.1038/sj.onc.1202548. [DOI] [PubMed] [Google Scholar]
- Giraud S, Hurlstone A, Avril S, Coqueret O. Implication of BRG1 and cdk9 in the STAT3-mediated activation of the p21waf1 gene. Oncogene. 2004;23(44):7391–7398. doi: 10.1038/sj.onc.1207972. [DOI] [PubMed] [Google Scholar]
- Gomes NP, Bjerke G, Llorente B, Szostek SA, Emerson BM, Espinosa JM. Gene-specific requirement for P-TEFb activity and RNA polymerase II phosphorylation within the p53 transcriptional program. Genes Dev. 2006;20(5):601–612. doi: 10.1101/gad.1398206. [DOI] [PMC free article] [PubMed] [Google Scholar]
- Graña X, De Luca A, Sang N, Fu Y, Claudio PP, Rosenblatt J, Morgan DO, Giordano A. PITALRE, a nuclear CDC2-related protein kinase that phosphorylates the retinoblastoma protein in vitro. Proc Natl Acad Sci USA. 1994;91(9):3834–3838. doi: 10.1073/pnas.91.9.3834. [DOI] [PMC free article] [PubMed] [Google Scholar]
- Hargreaves DC, Horng T, Medzhitov R. Control of inducible gene expression by signal-dependent transcriptional elongation. Cell. 2009;138(1):129–145. doi: 10.1016/j.cell.2009.05.047. [DOI] [PMC free article] [PubMed] [Google Scholar]
- He N, Pezda AC, Zhou Q. Modulation of a P-TEFb functional equilibrium for the global control of cell growth and differentiation. Mol Cell Biol. 2006;26(19):7068–7076. doi: 10.1128/MCB.00778-06. [DOI] [PMC free article] [PubMed] [Google Scholar]
- Hosack DA, Dennis G, Jr, Sherman BT, Lane HC, Lempicki RA. Identifying biological themes within lists of genes with EASE. Genome Biol. 2003;4(10):R70. doi: 10.1186/gb-2003-4-10-r70. [DOI] [PMC free article] [PubMed] [Google Scholar]
- Hou T, Ray S, Brasier AR. The functional role of an interleukin 6-inducible CDK9.STAT3 complex in human gamma-fibrinogen gene expression. J Biol Chem. 2007;282(51):37091–37102. doi: 10.1074/jbc.M706458200. [DOI] [PubMed] [Google Scholar]
- Keogh MC, Podolny V, Buratowski S. Bur1 kinase is required for efficient transcription elongation by RNA polymerase II. Mol Cell Biol. 2003;23(19):7005–7018. doi: 10.1128/MCB.23.19.7005-7018.2003. [DOI] [PMC free article] [PubMed] [Google Scholar]
- Klebl B, Choidas A. CDK9/cyclin T1: a host cell target for antiretroviral therapy. Future Virology. 2006;1(3):317–330. [Google Scholar]
- Kohoutek J, Li Q, Blazek D, Luo Z, Jiang H, Peterlin BM. Cyclin T2 is essential for mouse embryogenesis. Mol Cell Biol. 2009;29(12):3280–3285. doi: 10.1128/MCB.00172-09. [DOI] [PMC free article] [PubMed] [Google Scholar]
- Lam LT, Pickeral OK, Peng AC, Rosenwald A, Hurt EM, Giltnane JM, Averett LM, Zhao H, Davis RE, Sathyamoorthy M, Wahl LM, Harris ED, Mikovits JA, Monks AP, Hollingshead MG, Sausville EA, Staudt LM. Genomic-scale measurement of mRNA turnover and the mechanisms of action of the anti-cancer drug flavopiridol. Genome Biol. 2001;2(10) doi: 10.1186/gb-2001-2-10-research0041. RESEARCH0041. [DOI] [PMC free article] [PubMed] [Google Scholar]
- Luecke HF, Yamamoto KR. The glucocorticoid receptor blocks P-TEFb recruitment by NFkappaB to effect promoter-specific transcriptional repression. Genes Dev. 2005;19(9):1116–1127. doi: 10.1101/gad.1297105. [DOI] [PMC free article] [PubMed] [Google Scholar]
- Marshall RM, Graña X. Mechanisms controlling CDK9 activity. Front Biosci. 2006;11:2598–2613. doi: 10.2741/1994. [DOI] [PubMed] [Google Scholar]
- Marshall RM, Salerno D, Garriga J, Graña X. Cyclin T1 expression is regulated by multiple signaling pathways and mechanisms during activation of human peripheral blood lymphocytes. J Immunol. 2005;175(10):6402–6411. doi: 10.4049/jimmunol.175.10.6402. [DOI] [PubMed] [Google Scholar]
- Medlin J, Scurry A, Taylor A, Zhang F, Peterlin BM, Murphy S. P-TEFb is not an essential elongation factor for the intronless human U2 snRNA and histone H2b genes. Embo J. 2005;24(23):4154–4165. doi: 10.1038/sj.emboj.7600876. [DOI] [PMC free article] [PubMed] [Google Scholar]
- Murray S, Udupa R, Yao S, Hartzog G, Prelich G. Phosphorylation of the RNA polymerase II carboxy-terminal domain by the Bur1 cyclin-dependent kinase. Mol Cell Biol. 2001;21(13):4089–4096. doi: 10.1128/MCB.21.13.4089-4096.2001. [DOI] [PMC free article] [PubMed] [Google Scholar]
- Ni Z, Schwartz BE, Werner J, Suarez JR, Lis JT. Coordination of transcription, RNA processing, and surveillance by P-TEFb kinase on heat shock genes. Mol Cell. 2004;13(1):55–65. doi: 10.1016/s1097-2765(03)00526-4. [DOI] [PubMed] [Google Scholar]
- O'Keeffe B, Fong Y, Chen D, Zhou S, Zhou Q. Requirement for a kinase-specific chaperone pathway in the production of a Cdk9/cyclin T1 heterodimer responsible for P-TEFb-mediated tat stimulation of HIV-1 transcription. J Biol Chem. 2000;275(1):279–287. doi: 10.1074/jbc.275.1.279. [DOI] [PubMed] [Google Scholar]
- Pei Y, Shuman S. Characterization of the Schizosaccharomyces pombe Cdk9/Pch1 protein kinase: Spt5 phosphorylation, autophosphorylation, and mutational analysis. J Biol Chem. 2003;278(44):43346–43356. doi: 10.1074/jbc.M307319200. [DOI] [PubMed] [Google Scholar]
- Peng J, Marshall NF, Price DH. Identification of a cyclin subunit required for the function of Drosophila P-TEFb. J Biol Chem. 1998a;273(22):13855–13860. doi: 10.1074/jbc.273.22.13855. [DOI] [PubMed] [Google Scholar]
- Peng J, Zhu Y, Milton JT, Price DH. Identification of multiple cyclin subunits of human P-TEFb. Genes Dev. 1998b;12(5):755–762. doi: 10.1101/gad.12.5.755. [DOI] [PMC free article] [PubMed] [Google Scholar]
- Peterlin BM, Price DH. Controlling the elongation phase of transcription with P-TEFb. Mol Cell. 2006;23(3):297–305. doi: 10.1016/j.molcel.2006.06.014. [DOI] [PubMed] [Google Scholar]
- Salerno D, Hasham MG, Marshall R, Garriga J, Tsygankov AY, Grana X. Direct inhibition of CDK9 blocks HIV-1 replication without preventing T-cell activation in primary human peripheral blood lymphocytes. Gene. 2007;405(1–2):65–78. doi: 10.1016/j.gene.2007.09.010. [DOI] [PMC free article] [PubMed] [Google Scholar]
- Sano M, Schneider MD. Cyclins that don't cycle--cyclin T/cyclin-dependent kinase-9 determines cardiac muscle cell size. Cell Cycle. 2003;2(2):99–104. [PubMed] [Google Scholar]
- Scibetta AG, Copier J, Barrett A, Chaplin T, Taylor-Papadimitriou J. Gene expression changes induced by a recombinant E1-/E3- adenovirus type 5 vector in human mammary epithelial cells. Intervirology. 2005;48(6):350–361. doi: 10.1159/000086062. [DOI] [PubMed] [Google Scholar]
- Sedlacek HH. Mechanisms of action of flavopiridol. Crit Rev Oncol Hematol. 2001;38(2):139–170. doi: 10.1016/s1040-8428(00)00124-4. [DOI] [PubMed] [Google Scholar]
- Shim EY, Walker AK, Shi Y, Blackwell TK. CDK-9/cyclin T (P-TEFb) is required in two postinitiation pathways for transcription in the C. elegans embryo. Genes Dev. 2002;16(16):2135–2146. doi: 10.1101/gad.999002. [DOI] [PMC free article] [PubMed] [Google Scholar]
- Tian Y, Ke S, Chen M, Sheng T. Interactions between the aryl hydrocarbon receptor and P-TEFb. Sequential recruitment of transcription factors and differential phosphorylation of C-terminal domain of RNA polymerase II at cyp1a1 promoter. J Biol Chem. 2003;278(45):44041–44048. doi: 10.1074/jbc.M306443200. [DOI] [PubMed] [Google Scholar]
- Viladevall L, St Amour CV, Rosebrock A, Schneider S, Zhang C, Allen JJ, Shokat KM, Schwer B, Leatherwood JK, Fisher RP. TFIIH and P-TEFb coordinate transcription with capping enzyme recruitment at specific genes in fission yeast. Mol Cell. 2009;33(6):738–751. doi: 10.1016/j.molcel.2009.01.029. [DOI] [PMC free article] [PubMed] [Google Scholar]
- Wang S, Fischer PM. Cyclin-dependent kinase 9: a key transcriptional regulator and potential drug target in oncology, virology and cardiology. Trends Pharmacol Sci. 2008;29(6):302–313. doi: 10.1016/j.tips.2008.03.003. [DOI] [PubMed] [Google Scholar]
- Wei GL, Krasinski K, Kearney M, Isner JM, Walsh K, Andres V. Temporally and spatially coordinated expression of cell cycle regulatory factors after angioplasty. Cir Res. 1997;80:418–426. [PubMed] [Google Scholar]
- Wei P, Garber ME, Fang SM, Fischer WH, Jones KA. A novel CDK9-associated C-type cyclin interacts directly with HIV-1 Tat and mediates its high-affinity, loop-specific binding to TAR RNA. Cell. 1998;92(4):451–462. doi: 10.1016/s0092-8674(00)80939-3. [DOI] [PubMed] [Google Scholar]
- Yang Z, He N, Zhou Q. Brd4 recruits P-TEFb to chromosomes at late mitosis to promote G1 gene expression and cell cycle progression. Mol Cell Biol. 2008;28(3):967–976. doi: 10.1128/MCB.01020-07. [DOI] [PMC free article] [PubMed] [Google Scholar]
- Zhou M, Deng L, Lacoste V, Park HU, Pumfery A, Kashanchi F, Brady JN, Kumar A. Coordination of transcription factor phosphorylation and histone methylation by the P-TEFb kinase during human immunodeficiency virus type 1 transcription. J Virol. 2004;78(24):13522–13533. doi: 10.1128/JVI.78.24.13522-13533.2004. [DOI] [PMC free article] [PubMed] [Google Scholar]
- Zhou M, Halanski MA, Radonovich MF, Kashanchi F, Peng J, Price DH, Brady JN. Tat modifies the activity of CDK9 to phosphorylate serine 5 of the RNA polymerase II carboxyl-terminal domain during human immunodeficiency virus type 1 transcription. Mol Cell Biol. 2000;20(14):5077–5086. doi: 10.1128/mcb.20.14.5077-5086.2000. [DOI] [PMC free article] [PubMed] [Google Scholar]