

Abstract
Eukaryotic genomes are highly organized within the cell nucleus. Genome organization not only implies the preferential positioning of genetic elements in the interphase nucleus, but also the topographic distribution of biological processes. We have investigated the relationship between spatial organization and genome function in single cells. Myc, c-Met, Igf2r, Asb4 and Zac1 genes have the same radial distribution, but they are not positioned in close proximity with respect to each other. Three-dimensional mapping of their transcription sites uncovered a gene-specific pattern of relative positioning with respect to the nucleolus. We found that the Zac1 gene transcription preferentially occurs juxtaposed to the nucleolus, and that its mRNA accumulates at this site of transcription. Nucleoli isolation followed by qRT-PCR provided evidence for a physical interaction between Zac1 mRNA and the nucleolus. Actinomycin-D treatment induced disassembly of the nucleolus, loss of the RNA-FISH signal and dramatic increase of the ZAC protein level. However, inhibition of RNA polymerase II had no effect over the Zac1 FISH-signal and the protein expression. Induction of cell cycle arrest, which involves participation of the ZAC protein, provoked mRNA release from its retention site and protein synthesis. Our data demonstrate that Zac1 mRNA preferentially accumulates in close proximity to nucleoli within the cell nucleus. In addition, our results suggest a functional link between such spatial distribution and protein expression.
Background
Eukaryotic genomes are highly organized within the cell nucleus. Chromosomes exhibit patterns of spatial distribution determined by their size or gene density (Misteli 2007; Parada, et al. 2004b). In mouse, the patterns of radial and relative chromosome positioning are tissue type specific indicating that genome reorganization occurs during cell differentiation (Parada, et al. 2004a). This conclusion is further supported by the observations that the stem cell specific genes Nanog and Oct4 acquire differential positioning as their expression levels change during differentiation of human embryonic stem cells (Wiblin, et al. 2005). Cellular organization of the genome not only implies non-random distribution of genes and chromosomes in the nuclear space, but also higher order of chromatin organization and spatial organization within the interphase nucleus of biological processes, including DNA replication, repair and transcription (Misteli 2007). Gene transcription by RNA polymerase II involves many molecular players and occurs throughout the whole nucleus; however, the process occurs highly organized in “factories” that contain more than one polymerase molecule (Cook 1999). Furthermore, transcription of genes that are functionally related yet distant from one another at the genomic level can occur by sharing RNA polymerase II transcription sites, providing support for the notion of spatial organization of biological processes (Dostie, et al. 2007; Osborne, et al. 2007).
The nucleolus is a clear example of the nuclear functional organization paradigm. In this nuclear domain, ribosomal RNA genes are transcribed by RNA polymerase I in multiple and large transcription centers (Dundr, et al. 2000). rRNA genes (18S, 5,8S and 28S) are arranged in clusters of repeated units associated with nucleolar organizing regions (NORs). In humans, rRNA genes map to the short arm of chromosomes 13, 14, 15, 21 and 22. However in mouse, the chromosomal localization of NORs varies by strain, for example NORs map to chromosomes 12, 15, 18 and 19 in C57BL/6J mice and to chromosomes 12, 15 and 16 in the BALB/cJ mice (Henderson, et al. 1974; Romanova, et al. 2006). Taking into consideration the proposed models for the cellular organization of genome function (Misteli 2007), an obvious prediction would be that chromosomes carrying NORs have to be spatially arranged in the cell nucleus. In support of this model, mouse chromosomes 12, and 15, which contain NORs, are positioned in close proximity to each other as well as to chromosome 14, forming a cluster (Parada, et al. 2002). Furthermore, the tendency of NOR-bearing chromosomes to associate with nucleoli correlates with the number of transcriptionally competent NORs in the chromosome (Kalmarova, et al. 2007).
Spatial genome organization has been usually assessed by determining the preferential position of chromosomes/genes relative to the nuclear center (radial distribution) or with respect to other genetic elements (relative positioning). In addition, evidence has emerged pointing towards the importance of the third dimension on gene expression (Dekker 2008). Transient gene repositioning in the interphase nucleus has been postulated to optimize coordinated expression of similarly regulated genes (Kumaran, et al. 2008). Here, we test the link between proximal positioning with respect to the nucleolus and function of murine Asb4, c-Met, Zac1, Myc and Igf2r. These genes were selected due to their similar radial distribution in the cell nucleus. By simultaneously mapping the transcription sites of these genes with respect to the nucleolus and measuring the expression level of this series of loci, we uncovered a gene-specific pattern of relative positioning. Furthermore, our results support the notion that this specialized nuclear compartment may play a role in ZAC protein expression by interacting with the Zac1 mRNA.
Materials and methods
Cell culture and drug treatments
The mouse embryonic fibroblast (MEF) cell line G7 was cultured in DMEM/F-12 media containing 10% FBS, 1% penicillin/streptomycin and 1% glutamine (Gibco) under 5% CO2 atmosphere at 37°C. When appropriate, 18-24 hr after cell plating the old medium was replaced for fresh medium containing 0.05 μg/ml of Actinomycin D (Sigma-Aldrich) for 1 hr or 50 μg/ml α-Amanitin (Sigma-Aldrich) for 6 hr, for selective RNA Pol I or II inhibition, respectively (Loreni, et al. 2000). Control experiments were done by adding equal amounts of water/ DMSO. For induction of double strand breaks, Etoposide (Sigma) was added at a final concentration of 5 μM during 1 hr.
RNA & DNA FISH
Cells were plated on Petri dishes containing glass coverslips 18-24 hr prior to the procedure. The cells were rinsed briefly in PBS and in PBS containing paraformaldehyde (2%) and TritonX-100 (0.3%). The cells were then fixed in paraformaldehyde 2% for 10 min, permeabilized with TritonX-100 (0.5%) in PBS for 10 min, rinsed twice with PBS and stabilized in 2x SSC for 10 min. Immediately after this treatment, coverslips were placed over the probe mixture, sealed with rubber cement and incubated in a humidified chamber at 37°C overnight. The probes were generated by nick translation of plasmid or BAC clones. In addition, RNA-FISH was performed with directly labeled PCR fragments specific to coding exons VIII, IX and X and intron X-XI of the Zac1 gene, or to the coding region and a fragment of the 3’ UTR of the Sf3b5 gene. Apart from the specific DNA (0.1-0.2 μg), the hybridization mixture contained salmon sperm DNA (1.5 μg/μl) and yeast tRNA (1 μg/μl) dissolved in 2xSSC, 50% formamide and 10% dextran sulfate.
For chromosome painting and locus specific DNA-FISH, the yeast tRNA was substituted by cot1DNA (0.4 μg/μl) in the probe preparation and the target DNA was denatured by heating at 73°C in 70% formamide for 5 min. Post-hybridization washes included 15 min in 2x SSC and 10 min in 1x SSC. The detection was performed according to standard procedures with FITC conjugated avidin (Pierce) or anti-digoxigenin antibodies (Roche) (Parada, et al. 2004a). Spectral karyotyping was performed according to the protocol provided by the probe-manufacturer (Applied Spectral Imaging Ltd). Nucleolus immunostaining was done during the FISH detection step with a mouse monoclonal antibody against the C-terminus of Nucleophosmin (NPM) (B23) and using goat anti mouse IgG conjugated with Texas red or FITC (Southern Biotech).
Biotin or digoxigenin labeled probes were generated by nick translation using the following clones: A95504 and RP23-157D7 (Zac1), RP24-465F5 (Myc), RP23-208N9 (c-Met), RP23-81B3 (Igf2R) and RP24-169I21 (Asb4). For Zac1 and Sf3b5 specific probes, we performed PCR on G7 genomic DNA using a mix of dNTP and Biotin-16-dUTP or Digoxigenin-12-dUTP (Roche) and primers designed with Primer3 software (http://primer3.sourceforge.net/) for different regions of Zac1 and Sf3b5 sequences (See primer sequences in Table1 of Supplementary File 1). Whole chromosome painting probes were prepared by DOP-PCR from flow sorted mouse chromosomes (Parada, et al. 2004a). For detecting NORs we used a mix of pA and pB rDNAprobes, prepared from a pA and pB plasmid constructs (Erickson, et al. 1981), kindly donated by Miroslav Dundr (Rosalind Franklin University of Medicine and Science, North Chicago, USA).
Imaging and image analysis
Stacks of images scanning the whole nucleus were acquired with an axial separation of 300 nm using a Leica DM IRE2 laser-scanning microscope (Leica Microsystems Heidelberg GmbH). To determine the 3D radial position of any given signal, the shortest distance from the center of the nucleus to the periphery that included the center of the fluorescent signal, was directly measured on the z-stack using Volocity.4.3® software (Improvision, Image, Processing and Vision Company Limited), using the same threshold value for object segmentation in all images. The absolute distances from the center of the nucleus to the transcription sites were normalized as a fraction of the nuclear radius to account for natural variations in nuclear size, which may influence positioning. Cell nuclei were subdivided in five concentric shells each corresponding to 20% of the nucleus radius and the radial positioning data was binned into these five sub-domains. For quantitative measurements more than 100 nuclei from multiple experiments were analyzed.
To study relative positioning respect to the nucleolus, we determined the frequency at which the nucleolus and the transcription site fluorescent signals were overlapping in at least two focal planes of the 3D z-stack images using the Leica Software. Since we observed that there were many cells with signals very close, but not juxtaposed, we defined an alternative criterion. The absolute spatial separations of the transcription sites were directly measured from center of the transcription sites to the nearest voxel of the nucleolus on the 3D image, and signals were classified as “close” if the nucleolus-transcript maximum separation was less than or equal to the diameter of the RNA FISH signal. However, to better characterize trends in relative positioning, we used the first and more stringent criterion for statistical analysis.
Quantitative RT-PCR
RNA was isolated from the same cell plate used for FISH analysis using the RNAeasy Mini kit (Qiagen) and treated with RNAase-free DNAase set (Qiagen). The cDNA was synthesized from 1 μg of RNA using the Reverse Transcriptase kit (Promega) following the manufacturer recommendations. qRT-PCR was performed using the SYBR Green PCR Master Mix (ABgene) in an iCycler thermocycler (Bio-Rad Laboratories Inc) following the instructions of the manufacturer. Primers for Zac1, Sf3b5, rRNA, β-Actin and Gapdh were designed with Primer 3 Software (Primer sequences and annealing temperatures are shown in Table 1 of Supplementary File 1). The efficiency of each set of primers was determined by serial dilution of the template cDNA. The theoretical value obtained with the iCycler software was 100 ± 2 % (Efficiency (%) = 100× [10(-1/slope) − 1]; Bio-Rad Laboratories Inc) Gene expression levels were estimated as the differences in the Threshold Cycle values (CT) of treated and untreated cells.
Nucleoli from MEF cells were isolated according to the protocols publicly available at http://www.lamondlab.com/f7nucleolarprotocol.htm. The nucleolar preparations were screened by phase contrast optical microscopy. The total RNA was extracted and 1μg of this RNA was used to synthesize the cDNA. Thereafter, the presence of Zac1 transcripts in the nucleolar preparations was assessed by qRT-PCR with a set of primers for exon VIII of the Zac1 gene (Table 2 of Supplementary File 1). As positive and negative controls we used primers for pre-rRNA and β-actin, respectively.
Western blot analysis
Proteins were extracted from the same cell plate used for FISH analysis with cell lysis buffer (Cell Signaling Technology) and quantified with the BCA protein assay kit (Pierce). Aliquots of 30 μg of the total protein lysate were separated on 10% SDS-PAGE gels, transferred to PVDF membranes and probed with primary antibodies against ZAC (M-300) (Santa Cruz Biotechnology Inc). β-Actin C-11 antibody (Santa Cruz Biotechnology Inc) was used as a loading control. Detection was performed with a bovine anti-goat or anti-rabbit secondary antibody conjugated to horseradish peroxidase (Santa Cruz Biotechnology Inc).
Statistics
The Pearson’s chi-squared test and the T-Test were performed using R software http://www.r-project.org/.
Results
Spatial position of gene transcription
To study the relationship between spatial distribution and genome function we determined the 3D distribution of transcription sites of Asb4, c-Met, Zac1, Myc and Igf2r mapping to chromosomes 6A1, 6A2, 10A1, 15D3 and 17A2, respectively. The position of each gene was assayed independently and also combined in triplets in a cytogenetically normal MEF cell line by RNA-FISH using probes generated with bacterial artificial chromosomes (BAC) clones. This type of material was deliberately chosen to obtain robust RNA signals as a first approach; although has the caveat that the fluorescent signals might include other transcripts in addition to those of interest. Transcripts for all clones were easily detected in roughly 90% of the cells, but with clear differences in their expression pattern. While single signals for Asb4 and Igf2R were detected in the vast majority of cells, Zac1, Myc and c-Met expression was mostly biallelic (Fig. 1a,b,c). Asb4 and Igf2R are imprinted genes; therefore, monoallelic expression is in agreement with their form of regulation in a parent-of-origin manner. Zac1 is also an imprinted gene and Methyl Specific PCR (MSP) assay showed that both methylated and unmethylated CpGs are present in its promoter region (Supplementary File 1, Supplementary Fig. 1a,b), suggesting that Zac1 expression should be monoallelic in this cell type. However, we found two signals per nucleus in the vast majority of cells. Therefore, we favor the idea that the biallelic expression of Zac1 must be due to the presence of a second promoter in these cells, as has been demonstrated for human ZAC (Piras, et al. 2000; Valleley, et al. 2007).
Fig. 1. Nuclear positioning of gene expression.
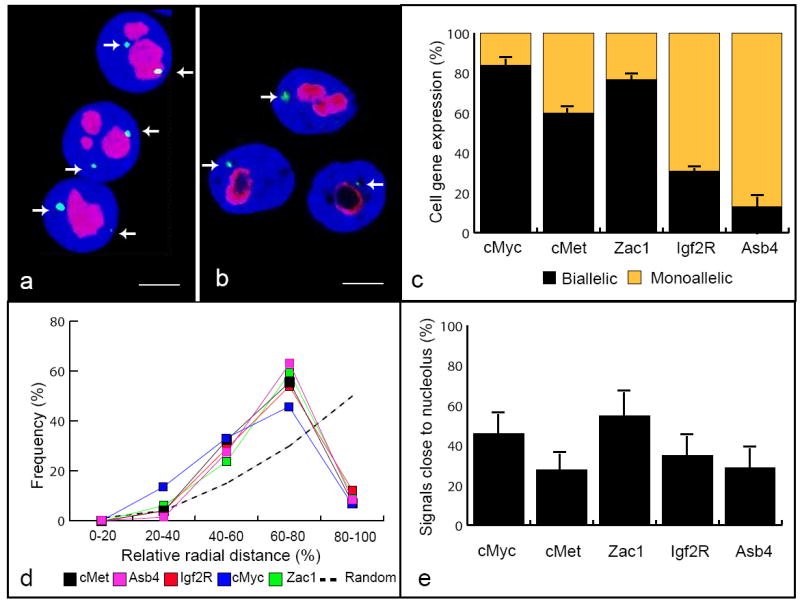
Zac1 and Asb4 genes transcription sites detected by RNA-FISH with a BAC clone (green, arrows) and nucleolus immunostaining with NPM (red). Counterstaining with DAPI (blue), scale bar = 4 μm. Projected stacks of nuclei are shown (a) (b). Gene expression patterns of monoallelic Asb4, Igf2R and biallelic Myc, c-Met and Zac1 in MEF cells (c). The transcription sites have similar radial distribution in the interphase nucleus. 3D actual measurements were normalized as a fraction of nuclear radius (d). Relative position of the genes with respect to the nucleolus. Zac1 gene transcription occurs frequently juxtaposed to the nucleolus (e). Error bars represent SD from three independent experiments.
To assess the spatial position of gene transcription, we first determined the 3D radial positions of all genes by direct measurement of the distances from the signals to the center of the nucleus and binning the data into five concentric shells, each corresponding to 20% of the nucleus radius. Primary transcripts corresponding to these genomic regions exhibited a homogeneous distribution localizing preferentially to an intermediate zone between the periphery and the nuclear center. The average radial position was between 60% and 65% of the relative radius (Fig.1d). Despite their similar radial distribution, we did not find a clear pattern of proximal positioning among these genes, except for Asb4 and Met which map to the same genomic region and are located close to each other in the interphase nucleus (data not shown).
Positioning of gene loci relative to the nucleolus
The nucleolus is not only involved in ribosome biogenesis, but is also a key player in cell cycle progression and proliferation (Pederson 1998). To study the role of the nucleolus in the spatial organization of non-ribosomal genes expression, we performed RNA-FISH combined with immunofluorescence for NPM, a nucleolus specific marker protein involved in ribosome assembly and transport. We first determined the 3D physical distance between each gene and the nearest nucleolus. The positions of the transcription sites with respect to the nucleolus were different for most of the genes, with variations from 0 to 3 microns away from the nucleolus. To quantitate these observations we determined the frequency with which the fluorescent signals from the nucleolus and the transcription site were juxtaposed in at least two focal planes of the 3D z-stack. While only 25-28% of the Asb4 and Met transcriptionally active genes were juxtaposed to the nucleolus, Zac1 gene transcription occurred twice as frequently in juxtaposition to nucleoli.
Interestingly, only 46% of the fluorescent signals from the Myc gene were found in close proximity to the nucleolus, despite the fact that it maps to chromosome 15 (NOR positive), and is therefore expected to localize close to nucleoli at the highest frequency. This frequency is much lower than the 57% at which the transcription of the Zac1 gene occurs juxtaposed to the nucleolus (Fig. 1e). Since we found many cells with signals very close to the nucleolus, but not juxtaposed, we also quantitated our observations using an alternative criterion based on distance measurements. Signals were considered “close” when the distance between them and the nucleolus was equal to or less than the diameter of the signal. Based on this criterion, we found that the frequency of signals close to the nucleolar compartment increased to 70% for Zac1 and 60% for c-Myc, suggesting that the nucleolus plays a role in Zac1 gene spatial/functional organization. Additional support for this idea comes from the observation that more than 35% of the cells with biallelic expression of Zac1 had both signals juxtaposed to the nucleolus. Furthermore, by comparing radial spatial positioning with relative positioning with respect to the nucleolus, we found that despite their similar radial distribution, proximal positioning with respect to the nucleolus is distinct among these genes (Fig. 1e).
Chromosome territories positioning close to nucleoli
Chromosomes are not randomly distributed in the cell nucleus and the position of many genetic elements is related to their function. In humans, rRNA genes are found on all acrocentric chromosomes and this accounts for the preferential positioning of these chromosomes close to the nucleolus (Kalmarova, et al. 2007). Having determined that transcription of the Zac1 gene occurs in close proximity to the nucleolus, we next sought to determine the relative position of this gene and chromosome 10, where Zac1 maps, with respect to the nucleolus. Three-dimensional dual color DNA-FISH with probes for chromosome 10 and the Zac1 gene, combined with immunofluorescence for NPM, revealed that 59% of chromosome 10 and their Zac1 allele signals were juxtaposed to the nucleolus (N= 190) (Fig. 2a). Since the chromosomal distribution of ribosomal RNA coding genes varies among different mouse strains, we asked whether chromosome 10 harbor ribosomal RNA coding genes whose function may be responsible for this location. To this end, we performed DNA-FISH with specific probes addressed to rDNA encoding the three major classes of rRNA (5.8 S, 18S and 28S) followed by SKY on methanol/acetic acid fixed metaphases. In addition, we performed dual DNA-FISH analysis with rDNA probes combined with whole painting probes for selected chromosomes to confirm the SKY results. Interestingly, we did not find NORs mapping to chromosome 10, but only to chromosomes 12, 15 and 18 in this cell type (Fig. 2b,c; Supplementary Fig. 2). Furthermore, we assessed the spatial positioning of chromosomes 12 and 15 respect to the nucleolus by chromosome painting combined with immunofluorescence for NPM. We determined that these chromosomes are closely positioned one to another and juxtaposed to the same nucleolus in 47% of the analyzed cells (N= 200) (data not shown). Taken together, these results demonstrate that the positioning of Zac1 transcription close to the nucleolus correlates with the localization of the gene. More importantly, we show that such nuclear distribution is not due the presence of NORs on chromosome 10.
Fig. 2. Chromosome 10 and Zac1 gene proximal positioning to the nucleolar compartment and NORs mapping in the G7 cell line.
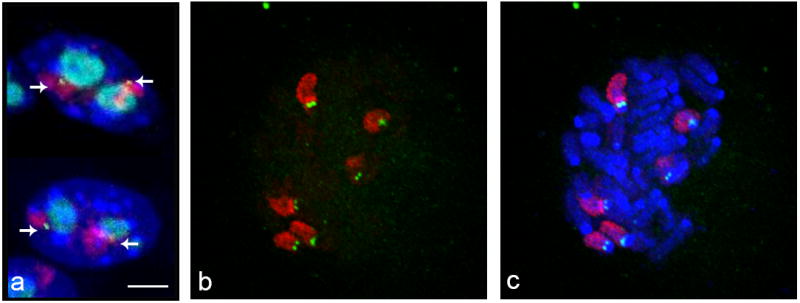
Simultaneous chromosome painting and locus specific DNA-FISH on PFA fixed cells showing the Zac1 gene (yellow, arrows), chromosome 10 (red) and nucleoli (cyan) clustering. Average image of two consecutive focal planes of the 3D z-stack used for data collection are shown (a). Dual FISH analysis with pA and pB rDNA (green) and whole painting probes for chromosomes 12, 15 and 18 (red) on metaphase chromosomes. Counterstaining with DAPI (blue), scale bar = 2 μm (b, c).
Spatial organization of the Zac1 gene transcription
Our initial analysis of the topological distribution of Zac1 gene transcription was performed using a BAC probe which also covers two additional genes: Stx11 and Sf3b5. In order to confirm our observations, we repeated the RNA-FISH experiments using probes addressed specifically to coding exons VIII, IX and X and intron X-XI generated by PCR. Except for the probe addressed to exon IX, the others detected their target, however with heterogeneous results in terms of signal intensity. The hybridizations with these fragments, in particular the hybridization with the intron-probe, indicate that we detect both the primary transcript and mature RNA from this gene (Supplementary Figs. 1a and 3a). Control RNA-FISH on RNase treated cells did not give any signal. Furthermore, combined RNA-DNA-FISH experiments with the Zac1-5 fragment, which reproducibly detects transcripts from exon X of Zac1 and the BAC RP23-82B19 showed co-localization of both signals (Supplementary Fig. 3b). We then performed the RNA-FISH analysis with the Zac1-5 probe combined with immunostaining for NPM and found that 54% of all signals were juxtaposed to the nucleolus (Fig. 3a). In summary, the frequencies of signals proximally positioned (juxtaposed) to nucleoli were similar across the three different types of probes used, i.e., 57% for RNA-FISH with the BAC clone, 54% for RNA-FISH with the probe for exon X and 59% for DNA-FISH with the BAC clone.
Fig. 3. Spatial organization of Zac1 gene transcription.
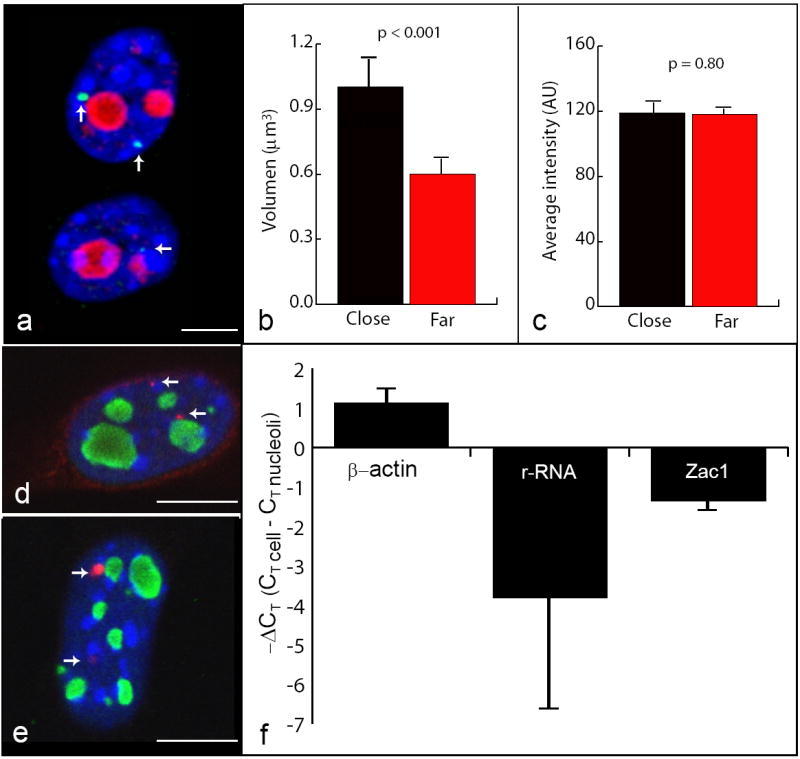
RNA-FISH with the Zac1-5 fragment (green, arrows), nucleoli immunostaining with NPM (red) and DAPI counterstaining (blue) showed differences in the size of the signals localized close to and far from the nucleolus. Average image of two consecutive focal planes of the 3D z stack used for data collection is shown. Scale bar = 4 μm (a). Graphs represent the mean volume and the mean of the average-intensity of close and far localized signals. Error bars represent SE (N=100). Differences between these two groups were statistically probed by T-test (p < 0.001 for volume and p= 0.80 for average intensity) (b-c). RNA-FISH with a plasmid-probe (red, arrows) for Zac1 on G7 cells (d) and on a breast cancer cell line (e), nucleoli immunostaining with NPM (green) and DAPI counterstaining (blue) showing the difference in the size of the signals localized close to and far from the nucleolus (d-e). qRT-PCR was performed on cDNA synthesized from 1 μg of total RNA from whole-cell extracts and isolated nucleoli. Zac1 and β-Actin genes mRNA and pre-rRNA levels in these two RNA sources were estimated from the information regarding the number of cycles necessary for reaching the lineal-amplification-threshold (CT). The graph expresses the differences in the CT value between the two RNA sources (ΔCT). Note that the positive value for β-actin means that less number of cycles are necessary to reach lineal amplification in the whole cell extract compared to the nucleoli fraction, and vice versa for Zac1 and rRNA. Four independent experiments were performed with similar results. Error bars represent SD (f).
In addition to confirming that the preferential positioning of Zac1 gene transcription occurred close to the nucleolus, these experiments showed that the size and the fluorescent intensity of the signals located juxtaposed and far from the nucleolus were clearly different (Fig. 3a). Therefore, we determined the 3D volume and the average intensity level of the FISH signals on the images acquired with the Zac1-5 probe. Statistical analysis of the measurements showed that there is no significant difference in the average intensity between both alleles (p= 0.80). However, the analysis proved that the signals juxtaposed to nucleoli are bigger than those further away (p< 0.001) (Fig. 3b,c). Similar comparative analyses performed for the Splicing Factor 3B Subunit 5 gene (Sf3b5) mRNA, the nearest gene to Zac1, showed that there are not statistical differences in the volume and average intensity between both transcription sites (see below). Furthermore, RNA-FISH experiments with a probe generated by nick translation of a cDNA clone (A95504) for Zac1 on G7 cells and on a breast cancer cell line, confirmed that signals located close to nucleoli are larger than those located far from this nuclear compartment (Fig. 3d,e). There may be differences in the transcription level between Zac1 alleles; however it can not be inferred from these experiments. Indeed, qRT-PCR analysis showed that the transcription level of Sf3b5 is higher than that of Zac1 gene and yet its signals are smaller and weaker (see below). Our RNA-FISH results suggest, instead, that a retention mechanism may cause an accumulation of mRNA at the transcription site near the nucleolus.
Zac1 gene transcripts associate with nucleoli
To determine whether Zac1 mRNA is bound to nucleoli, we isolated this nuclear compartment from MEF cells, screened the preparations using phase contrast optical microscopy and isolated their total RNA for cDNA synthesis. Thereafter, the presence of Zac1 transcripts in the nucleolus preparations was assessed by qRT-PCR with a set of primers for exon VIII of the Zac1 gene. As positive and negative controls we used primers for M musculus 45S pre rRNA (AN: X82564.1) and β-actin, respectively (Supplementary Fig. 1a; Table 1 in Supplementary File 1). We effectively detected an enrichment of Zac1 mRNA in the nucleolar fraction in comparison to the whole-cell extract. Similar results were obtained for pre-rRNA, although with marked differences in the CT, reflecting the differences in the amounts of both transcript types in the nucleolus. Conversely, β-Actin transcripts were more abundant in the cell extract than in the isolated nucleoli (Fig. 3f). Additional qualitative evidence for the existence of such nucleolar retention comes from the observation that MEF cells with high levels of Zac1 mRNA had multiple FISH signals decorating the nucleoli (Supplementary Fig. 5/movie).
Nucleolus disassembly induces Zac1 gene expression
To gain insights into the relationship between Zac1 function and ribosomal gene transcription, we investigated Zac1 transcription in the context of RNA polymerase inhibition. Treatment of MEFs with Actinomycin D, a known repressor of ribosomal RNA transcription that causes nucleolar components to segregate, resulted in disappearance of Zac1 mRNA fluorescent signal concomitantly with nucleolar disassembly. In contrast, the Zac1 mRNA signal remained unchanged after cell treatment with α-Amanitin (Fig. 4a,b).
Fig. 4. Zac1 gene transcription after RNA polymerase I and II inhibition.
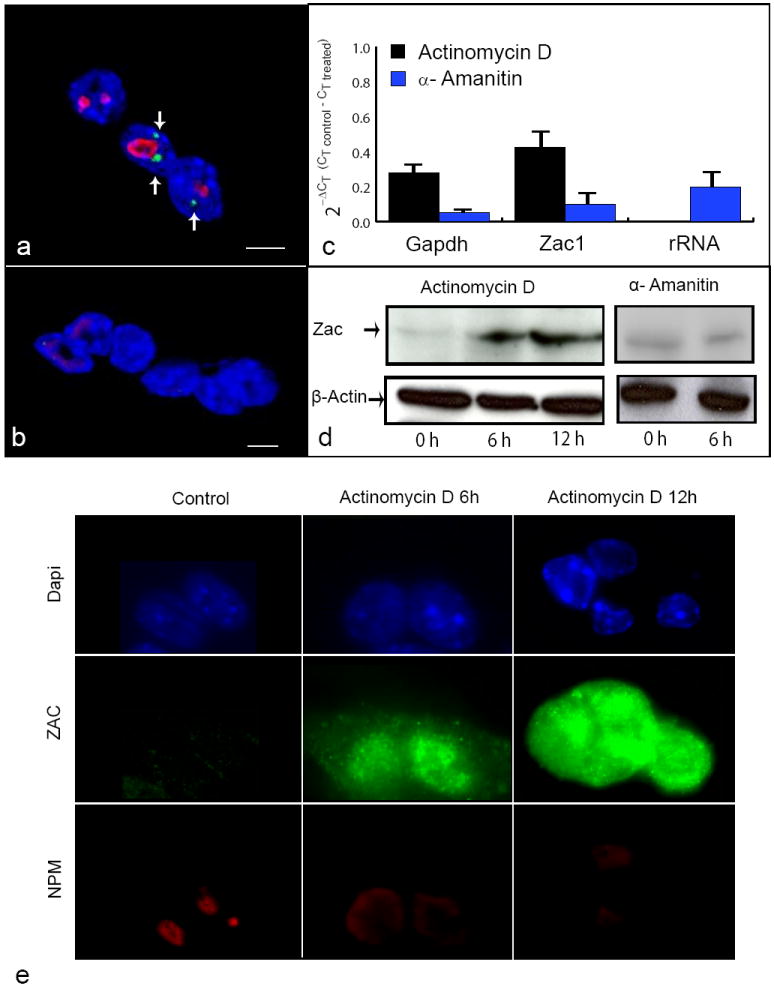
Zac1 gene RNA FISH (green, arrows) with a probe for exon X (Zac1-5 fragment) combined with nucleolus immunostaining with an antibody against NPM (red) after treatment with α-Amanitin (a) and Actinomycin D (b), respectively. Counterstaining with DAPI (blue), scale bar = 4 μm (a-b). qRT-PCR for Zac1, rRNA and Gapdh genes using as templates the cDNA synthesized from RNA extracted from the same MEF cells subjected to RNA Pol I and II inhibition treatment and FISH analyses. mRNA levels were quantified and are expressed as fold changes respect to the control untreated cells (2-ΔCT (CT control - CT treated)). Error bars represent SD of three independent experiments (c). Western blot analyses of MEF cells at different time points after treatment with Actinomycin D and α-Amanitin (d). Immunofluorescence analysis of MEF cells at different time points after treatment with Actinomycin D. The ZAC protein level increased concomitantly with the disappearance of Zac1 and nucleolus fluorescent signals after treatment with Actinomycin D, whereas the level of ZAC protein remained unchanged after treatment with α-Amanitin. These experiments were performed four times (e).
Interestingly, nucleoli reassembling occurred after Actinomycin D removal in a dose-dependent manner. Six hours after the drug withdrawal the Zac1 gene mRNA signal was again found positioned close to nucleoli at a frequency similar to that observed before treatment (Suppl. Fig. 4). To further explore this behavior, we measured the transcription level of Zac1, 45S pre rRNA and Glyceraldehyde-3-phosphate dehydrogenase (Gapdh) genes by qRT-PCR and ZAC protein expression by immunofluorescence and Western blot analyses after both treatments. Zac1 and Gapdh transcription is RNA Pol II dependent and in agreement with this, their mRNA level diminished after inhibition with α-Amanitin. Cell treatment with Actinomycin D blocked rRNA transcription, but also slightly reduced the cellular Zac1 and Gapdh RNA levels (Fig. 4c). Western blot and immunofluorescence analyses showed that the level of ZAC protein changed dramatically, from being practically undetectable at the beginning of the experiment to a several fold increase at six hours, reaching a maximum at 12 hours after treatment with Actinomycin D (Fig. 4d,e). On the contrary, we did not detect changes up to six hours after treatment with α-Amanitin (Fig. 4d). These results demonstrate that Zac1 RNA synthesis occurs, as expected, by RNA Pol II. More importantly, the loss of the Zac1 FISH signal upon treatment with Actinomycin D indicates that the functional integrity of the nucleolus plays a role in retaining Zac1 mRNA. Whereas the associated increase in the protein level, suggests that ZAC protein synthesis may occur from RNA released from its transcription site, rather than from increased transcription of the Zac1 gene.
We next asked whether the structural and functional integrity of the nucleolus plays similar role in regulating the behavior of other genes that map to the same genomic region. To this end, we investigated the relative positioning of the Sf3b5 gene transcripts with respect to the nucleolus and the effect of nucleoli disassembly on the spatial distribution of Sf3b5 transcripts. Sf3b5 is the nearest gene to Zac1, mapping approximately 105 bp (centromeric) on chromosome band 10A, and encodes the Splicing Factor 3B Subunit 5. We determined the transcription level of this gene by qRT-PCR. Additionally, we performed RNA-FISH analysis with a probe addressed to the single coding region of Sf3b5 and a fragment of the 3’ UTR combined with immunostaining for NPM. The qRT-PCR analysis revealed that the expression of Sf3b5 is higher than the transcription level of Zac1 (CTSf3b5= 23.4 ± 0.1; CTZac1= 26.0 ± 0.4). Whereas the RNA-FISH experiments showed that the primary transcripts from this gene localize juxtaposed to the nucleolus at a frequency similar to that of Zac1 (53%). Statistical comparison of the volume and mean intensity of these signals with those that did not localize juxtaposed to nucleoli showed that both signals are similar (p= 0.74 for volume and p= 0.51 for average intensity) (Fig. 5a,b). Most importantly, we found that the RNA message remains in situ after RNA Pol I ribosomal RNA transcription blockade with Actinomycin D. The observation that the signal obtained with specific probes does not disappear demonstrates that disassembly of the nucleolus did not affect Sf3b5 gene spatial organization (Fig. 5c-h). This experiment also provides evidence for the specificity of the link between spatial positioning of Zac1 transcripts close to the nucleolus and protein expression.
Fig. 5. Spatial organization of Sf3b5 transcripts in the context of RNA polymerase I inhibition.
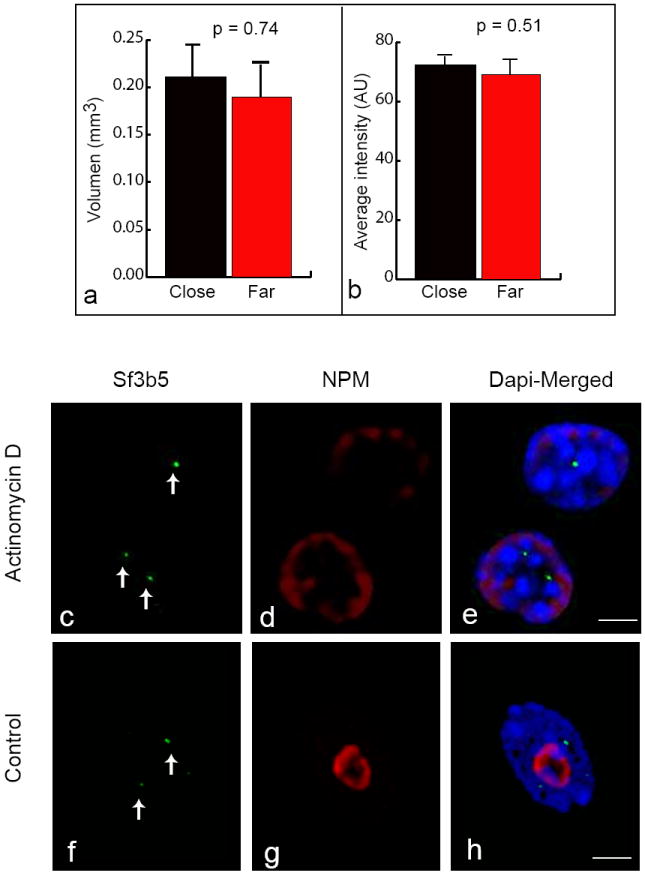
Graphs show that the mean volume and the mean of the average-intensity of close and far localized signals are not significantly different by T-test (p= 0.74 for volume and p= 0.51 for average intensity). Error bars represent SE (N=110) (a-b). FISH analysis for the Sf3b5 gene mRNA (green, arrows) with a probe for the single coding region combined with nucleolus immunostaining with an antibody against NPM (red). Counterstaining with DAPI (blue), scale bar = 3μm. Average image of two consecutive focal planes of the 3D z-stack used for data collection is shown (c-e: treated cells; f-h: untreated control cells).
Zac1 mRNA quick release in response to DNA damage
The ZAC protein is a key transcription factor and coactivator for nuclear receptors that induces cell cycle arrest and apoptosis. We hypothesized that inducting DNA damage will trigger the Zac1 mRNA release and translation. To test this hypothesis, we treated cycling MEF cells in culture with Etoposide to induce cell cycle arrest due to DNA double-strand breaks. We then performed RNA-FISH combined with nucleolus staining and Western blot analyses at different time points. We observed that the Zac1 fluorescent signal was undetectable after one hour treatment, probably due to the release of the accumulated mRNA, while nucleoli appeared to remain organized (Fig. 6a,b). Interestingly, ZAC protein levels increased dramatically reaching the highest level after six hours (Fig. 6c). In contrast, in the control experiments (untreated cells) the FISH signals were clearly detected juxtaposed to well-organized nucleoli and the ZAC protein levels were lower than in treated cells. The disappearance of the Zac1 mRNA signals after DNA damage and consequent protein synthesis indicate that the spatial accumulation of Zac1 gene transcripts close to nucleoli is not stationary. The findings suggest that such association with nucleoli may serve as a mechanism that makes Zac1 mRNA readily available when rapid expression of the ZAC protein is needed for cell cycle arrest.
Fig. 6. Cell cycle arrest induces Zac1 mRNA release and translation.
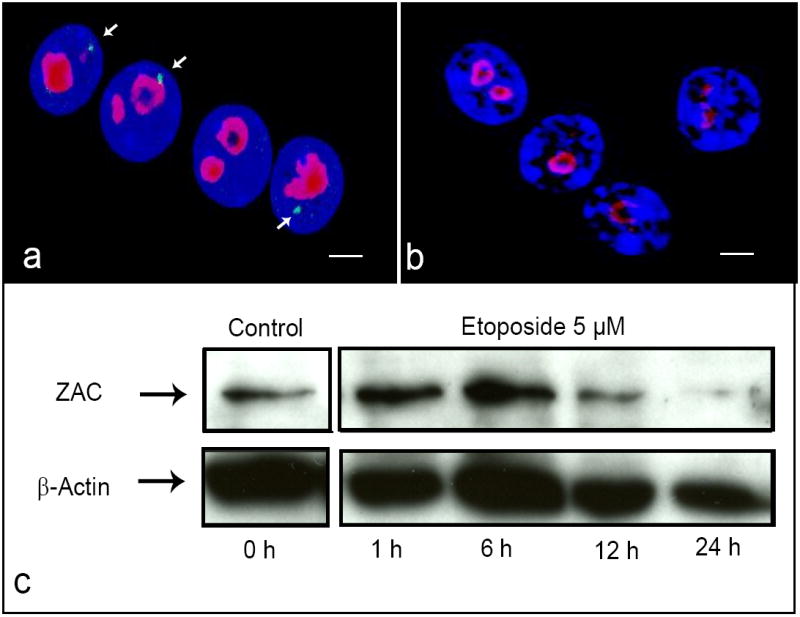
RNA FISH analysis with a probe for the Zac1-5 fragment on MEF cells untreated (a) and after 1 hr treatment with 5 μM of Etoposide (b). FISH signals in green (arrows), nucleoli were immunoassayed with an anti-NPM antibody (red) and nuclei counterstained with DAPI (blue), scale bar = 3 μm (a-b). Western blot analysis to asses the ZAC protein level 1, 6, 12 and 24 hr after treatment with Etoposide (5 μM) (c).
Discussion
The results presented here support the notion that there is a link between the preferential accumulation of Zac1 mRNA juxtaposed to the nucleolus and ZAC protein expression. We performed RNA-FISH for a series of loci including Asb4, c-Met, Zac1, Myc and Igf2R, combined with NPM immunostaining to map the position of their transcription sites with respect to the nuclear center (radial distribution) and to each other (relative positioning). We found that the vast majority of active genes were confined to a nuclear sub-domain intermediate between the center and the periphery (60-80% of the nucleus radius). In contrast, no clear pattern of relative positioning respect to each other was detected. The relative positioning of the fluorescent signals with respect to the nucleolar compartment was different for all these genes.
The signals corresponding to Zac1 mRNA were those that most often localized close to the nucleolus. The gene maps to chromosome 10A1 and 3D DNA-FISH revealed that this chromosome is preferentially positioned close to the nucleolus in the interphase nucleus of MEF cells. Ribosomal DNA transcriptional activity accounts for the positioning of transcripts from genes mapping to NOR-bearing chromosomes close to the nucleolus (Kalmarova, et al. 2007). This can explain the positioning of Myc mRNA, but not the localization of Zac1 transcripts juxtaposed to the nucleolus, because chromosome 10 does not harbour ribosomal RNA genes. Nucleolar association of NOR-negative chromosomes has been described by Manuelidis and Borden for the human chromosomes 1 and 9 in cells of the central nervous system (Manuelidis, et al. 1988), and more recently Bridger et al. reported the nucleolar association of chromosome 19 in proliferating and quiescent human dermal fibroblasts (Bridger, et al. 2000). Of these, only chromosome 19 has homology with mouse chromosome 10, but the syntenic region does not include 10A1 where Zac1 maps. This indicates that mechanisms other than efficient rDNA transcription determine the localization of this NOR negative chromosome in close proximity to the nucleolus.
Increasing evidence support the hypothesis that the nucleolus plays a role in nuclear processes other than its primary function in ribosome biogenesis, including mitosis, cell cycle progression and proliferation and non rRNAs processing (Boisvert, et al. 2007). Here, we show evidence for a link between the nucleolus and Zac1 gene expression. Murine Zac1 gene regulation, like its human homolog, is complex and not fully understood. Promoter methylation results in imprinted expression of the paternal allele; however, an additional promoter has been found to control the biallelic expression in human and mouse liver, kidney and skeletal muscle tissue of adult individuals (Piras, et al. 2000; Smith, et al. 2002; Valleley, et al. 2007). In agreement with these results, biallelic expression of Zac1 occurred in the vast majority of MEFs and 57% of all transcription sites detected with specific probes were juxtaposed to nucleoli. Moreover, we found that the size of the RNA-FISH fluorescent signal correlated positively with the proximity to this compartment. We conclude that such spatial distribution is related to this gene function because disrupting the functional integrity of the nucleolus with Actinomycin D ceased the nuclear retention of the Zac1 mRNA. Intriguingly, signals localizing far from the nucleolus also disappear upon treatment with Actinomycin D. This suggests that the mechanism responsible of such accumulation must be complex, perhaps it involves main nucleolar components that can be found in small amounts outside the nucleolus, such as NPM (Okuwaki 2008). This notwithstanding, our nucleolus fractionation experiments followed by specific RT-PCR demonstrate that the preferential accumulation of Zac1 transcripts juxtaposed to nucleoli is due to a physical interaction between this compartment and Zac1 mRNA. Moreover, we found that the transcripts from the Sf3b5 gene, which maps only 105 bp distant from Zac1, also localizes juxtaposed to the nucleolus and that this spatial distribution is not altered by nucleolus disassembly. Thus, it appears that this spatial link with the nucleolus may be specific for Zac1 transcripts.
Proteomic analysis demonstrated that more than 700 proteins are present in the nucleolus, but only 30% of them participate in ribosome biogenesis and the rest are involved in other molecular processes (Andersen, et al. 2005; Boisvert, et al. 2007). Interestingly, the nucleolus has a key role in regulating the availability of partner proteins (p19arf and mdm2) involved in p53 stabilization during stress response (Wsierska-Gadek, et al. 2003). Also nucleostemin, a protein which interacts with p53, accumulates in the granular area of the nucleolus (Politz, et al. 2006). ZAC is a transcriptional coactivator that interacts with p53 and promotes cell cycle arrest and apoptosis by enhancing p53-responsive promoter activity (Huang, et al. 2001; Pederson 1998; Rozenfeld-Granot, et al. 2002; Visintin, et al. 2000). In contrast to other stress response proteins, ZAC is excluded from the human Nucleolar Proteome Database v 2.0 (http://www.lamondlab.com/NOPdb/). Furthermore, Huang et al., using transient transfection assays with a EGFP-tagged fusion ZAC protein, have shown that the full-length protein localize in the nucleus, but not in the nucleolus (Huang, et al. 2001). We found, however, that Zac1 mRNA very often accumulates juxtaposed to nucleoli, suggesting that nuclear retention modulates its expression. Nuclear retention of CTN-RNA (CAT2 transcribed nuclear RNA), an alternatively spliced primary transcript of the mouse cationic aminoacid transporter 2 gene (mCAT2), has been proposed as a mechanism for regulating the level of this gene mRNA, and consequently CAT2 protein expression (Prasanth, et al. 2005). Shimizu et al. have recently reported Myc mRNA accumulation within the nucleolus, and postulated that such localization may regulate Myc gene expression (Shimizu, et al. 2007).
We found that the Myc transcripts were excluded from nucleoli. This difference in the nuclear positioning is likely to be the result of intrinsic differences between the normal embryonic fibroblasts used as a model system in our study and the cancer cells, with over-expression of the Myc gene, used by Shimizu et al. More importantly, Zac1 mRNA signals were not found inside the nucleolus, but positioned very close to this nuclear compartment. This finding poses the question of whether Zac1 mRNA positioning close to nucleoli is stochastic and if such spatial accumulation has functional relevance. Our data showing that 70% of mRNA signals localize close to nucleoli support the conclusion that Zac1 mRNA preferentially accumulates in close proximity to nucleoli within the cell nucleus and that such accumulation is relevant for ZAC protein expression. Moreover, the observation of few highly expressing cells in which the primary transcripts were decorating the nucleolus, suggests that this particular mRNA positioning may be involved in a post-transcriptional regulation of this gene expression. Alternatively, the nucleolus may contribute to make critical mRNA readily available during the tight cell cycle control or stress response in normal mouse embryonic cells.
Supplementary Material
Location of exons/introns in the Zac1 gene and position of the primers used in the different PCR reactions are depicted according to the nucleotide sequences deposited in Ensembl Mouse Exon View for ENSMUST00000068371; http://www.ensembl.org (a). Methyl Specific PCR (MSP) assay was performed to detect differentially methylated CpGs of the Zac1 gene promoter in the MEF cell line (G7) and neurons (Neu) from mouse embryos. The digital image is automatically generated by the 2100-Bioanalyzer (Agilent Technologies). MSP assay showed that the CpGs of the promoter region exist in both methylated (M) and unmethylated (U) forms (b). Methyl Specific PCR (MSP) assay performed to test the completion of the bisulphate-mediated C>T conversion. The results from two experiments show that the MSP primers only amplified unmethylated DNA (c).
Sequential FISH analysis with of pA and pB rDNA probes (arrows) followed by multicolor spectral karyotyping showing the localization of ribosomal genes only on chromosomes 12, 15 and 18, but not on chromosome 10.
RNA-FISH with probes for exon X (Fragment Zac1-5; red, arrows) and intron X-XI (Fragment Zac1-4, green, arrows) on G7 cells counterstained with DAPI. Arrows indicate RNA signals (a). Sequential RNA/DNA-FISH analysis with the Zac1-5 fragment (red) and the BAC probe (green). Scale bars = 4 μm (b).
Zac1 gene RNA FISH (green, arrows) with a probe for exon X (Zac1-5 fragment) combined with nucleolus immunostaining with an antibody against NPM (red) after Actinomycin D removal from the culture dish. Counterstaining with DAPI (blue), scale bar = 2 μm.
RNA FISH was performed with the Zac1-5 fragment labeled with digoxigenin-12-dUTP and revealed with anti-digoxigenin conjugated to FITC (green). The nucleus was counterstained with DAPI (blue).
Acknowledgments
We would like to thank Dr. Tom Misteli and Dr. Paul Edwards for critical reading of the manuscript. This work was supported by funding from Fondo de Investigación Sanitaria (ISCiii), Grant # 05/1117 to LAP; Department of Industry and Department of Health of the Basque Government and CIBERHED. FR is a CIBERHED postdoctoral fellow associated to CIC bioGUNE. This research was supported in part by the Intramural Research Program of the NIH, Center of Information Technology.
References
- Andersen JS, Lam YW, Leung AK, Ong SE, Lyon CE, Lamond AI, Mann M. Nucleolar proteome dynamics. Nature. 2005;433:77–83. doi: 10.1038/nature03207. [DOI] [PubMed] [Google Scholar]
- Boisvert FM, van Koningsbruggen S, Navascues J, Lamond AI. The multifunctional nucleolus. Nat Rev Mol Cell Biol. 2007;8:574–585. doi: 10.1038/nrm2184. [DOI] [PubMed] [Google Scholar]
- Bridger JM, Boyle S, Kill IR, Bickmore WA. Re-modelling of nuclear architecture in quiescent and senescent human fibroblasts. Curr Biol. 2000;10:149–152. doi: 10.1016/s0960-9822(00)00312-2. [DOI] [PubMed] [Google Scholar]
- Cook PR. The organization of replication and transcription. Science. 1999;284:1790–1795. doi: 10.1126/science.284.5421.1790. [DOI] [PubMed] [Google Scholar]
- Dekker J. Gene regulation in the third dimension. Science. 2008;319:1793–1794. doi: 10.1126/science.1152850. [DOI] [PMC free article] [PubMed] [Google Scholar]
- Dostie J, Zhan Y, Dekker J. Chromosome conformation capture carbon copy technology. Curr Protoc Mol Biol. 2007;Chapter 21(Unit 21):14. doi: 10.1002/0471142727.mb2114s80. [DOI] [PubMed] [Google Scholar]
- Dundr M, Misteli T, Olson MO. The dynamics of postmitotic reassembly of the nucleolus. J Cell Biol. 2000;150:433–446. doi: 10.1083/jcb.150.3.433. [DOI] [PMC free article] [PubMed] [Google Scholar]
- Erickson JM, Rushford CL, Dorney DJ, Wilson GN, Schmickel RD. Structure and variation of human ribosomal DNA: molecular analysis of cloned fragments. Gene. 1981;16:1–9. doi: 10.1016/0378-1119(81)90055-x. [DOI] [PubMed] [Google Scholar]
- Henderson AS, Eicher EM, Yu MT, Atwood KC. The chromosomal location of ribosomal DNA in the mouse. Chromosoma. 1974;49:155–160. doi: 10.1007/BF00348887. [DOI] [PubMed] [Google Scholar]
- Huang SM, Schonthal AH, Stallcup MR. Enhancement of p53-dependent gene activation by the transcriptional coactivator Zac1. Oncogene. 2001;20:2134–2143. doi: 10.1038/sj.onc.1204298. [DOI] [PubMed] [Google Scholar]
- Kalmarova M, Smirnov E, Masata M, Koberna K, Ligasova A, Popov A, Raska I. Positioning of NORs and NOR-bearing chromosomes in relation to nucleoli. J Struct Biol. 2007;160:49–56. doi: 10.1016/j.jsb.2007.06.012. [DOI] [PMC free article] [PubMed] [Google Scholar]
- Kumaran RI, Thakar R, Spector DL. Chromatin dynamics and gene positioning. Cell. 2008;132:929–934. doi: 10.1016/j.cell.2008.03.004. [DOI] [PMC free article] [PubMed] [Google Scholar]
- Loreni F, Thomas G, Amaldi F. Transcription inhibitors stimulate translation of 5’ TOP mRNAs through activation of S6 kinase and the mTOR/FRAP signalling pathway. Eur J Biochem. 2000;267:6594–6601. doi: 10.1046/j.1432-1327.2000.01753.x. [DOI] [PubMed] [Google Scholar]
- Manuelidis L, Borden J. Reproducible compartmentalization of individual chromosome domains in human CNS cells revealed by in situ hybridization and three-dimensional reconstruction. Chromosoma. 1988;96:397–410. doi: 10.1007/BF00303033. [DOI] [PubMed] [Google Scholar]
- Misteli T. Beyond the sequence: cellular organization of genome function. Cell. 2007;128:787–800. doi: 10.1016/j.cell.2007.01.028. [DOI] [PubMed] [Google Scholar]
- Okuwaki M. The structure and functions of NPM1/Nucleophsmin/B23, a multifunctional nucleolar acidic protein. J Biochem. 2008;143:441–448. doi: 10.1093/jb/mvm222. [DOI] [PubMed] [Google Scholar]
- Osborne CS, Chakalova L, Mitchell JA, Horton A, Wood AL, Bolland DJ, Corcoran AE, Fraser P. Myc dynamically and preferentially relocates to a transcription factory occupied by Igh. PLoS Biol. 2007;5:e192. doi: 10.1371/journal.pbio.0050192. [DOI] [PMC free article] [PubMed] [Google Scholar]
- Parada LA, McQueen PG, Misteli T. Tissue-specific spatial organization of genomes. Genome Biol. 2004a;5:R44. doi: 10.1186/gb-2004-5-7-r44. [DOI] [PMC free article] [PubMed] [Google Scholar]
- Parada LA, McQueen PG, Munson PJ, Misteli T. Conservation of relative chromosome positioning in normal and cancer cells. Curr Biol. 2002;12:1692–1697. doi: 10.1016/s0960-9822(02)01166-1. [DOI] [PubMed] [Google Scholar]
- Parada LA, Sotiriou S, Misteli T. Spatial genome organization. Exp Cell Res. 2004b;296:64–70. doi: 10.1016/j.yexcr.2004.03.013. [DOI] [PubMed] [Google Scholar]
- Pederson T. The plurifunctional nucleolus. Nucleic Acids Res. 1998;26:3871–3876. doi: 10.1093/nar/26.17.3871. [DOI] [PMC free article] [PubMed] [Google Scholar]
- Piras G, El Kharroubi A, Kozlov S, Escalante-Alcalde D, Hernandez L, Copeland NG, Gilbert DJ, Jenkins NA, Stewart CL. Zac1 (Lot1), a potential tumor suppressor gene, and the gene for epsilon-sarcoglycan are maternally imprinted genes: identification by a subtractive screen of novel uniparental fibroblast lines. Mol Cell Biol. 2000;20:3308–3315. doi: 10.1128/mcb.20.9.3308-3315.2000. [DOI] [PMC free article] [PubMed] [Google Scholar]
- Politz JC, Tuft RA, Prasanth KV, Baudendistel N, Fogarty KE, Lifshitz LM, Langowski J, Spector DL, Pederson T. Rapid, diffusional shuttling of poly(A) RNA between nuclear speckles and the nucleoplasm. Mol Biol Cell. 2006;17:1239–1249. doi: 10.1091/mbc.E05-10-0952. [DOI] [PMC free article] [PubMed] [Google Scholar]
- Prasanth KV, Prasanth SG, Xuan Z, Hearn S, Freier SM, Bennett CF, Zhang MQ, Spector DL. Regulating gene expression through RNA nuclear retention. Cell. 2005;123:249–263. doi: 10.1016/j.cell.2005.08.033. [DOI] [PubMed] [Google Scholar]
- Romanova L, Korobova F, Noniashvilli E, Dyban A, Zatsepina O. High resolution mapping of ribosomal DNA in early mouse embryos by fluorescence in situ hybridization. Biol Reprod. 2006;74:807–815. doi: 10.1095/biolreprod.105.047340. [DOI] [PubMed] [Google Scholar]
- Rozenfeld-Granot G, Krishnamurthy J, Kannan K, Toren A, Amariglio N, Givol D, Rechavi G. A positive feedback mechanism in the transcriptional activation of Apaf-1 by p53 and the coactivator Zac-1. Oncogene. 2002;21:1469–1476. doi: 10.1038/sj.onc.1205218. [DOI] [PubMed] [Google Scholar]
- Shimizu N, Kawamoto JK, Utani K. Regulation of c-myc through intranuclear localization of its RNA subspecies. Biochem Biophys Res Commun. 2007;359:806–810. doi: 10.1016/j.bbrc.2007.05.201. [DOI] [PubMed] [Google Scholar]
- Smith RJ, Arnaud P, Konfortova G, Dean WL, Beechey CV, Kelsey G. The mouse Zac1 locus: basis for imprinting and comparison with human ZAC. Gene. 2002;292:101–112. doi: 10.1016/s0378-1119(02)00666-2. [DOI] [PubMed] [Google Scholar]
- Valleley EM, Cordery SF, Bonthron DT. Tissue-specific imprinting of the ZAC/PLAGL1 tumour suppressor gene results from variable utilization of monoallelic and biallelic promoters. Hum Mol Genet. 2007 doi: 10.1093/hmg/ddm041. [DOI] [PubMed] [Google Scholar]
- Visintin R, Amon A. The nucleolus: the magician’s hat for cell cycle tricks. Curr Opin Cell Biol. 2000;12:752. doi: 10.1016/s0955-0674(00)00165-4. [DOI] [PubMed] [Google Scholar]
- Wiblin AE, Cui W, Clark AJ, Bickmore WA. Distinctive nuclear organisation of centromeres and regions involved in pluripotency in human embryonic stem cells. J Cell Sci. 2005;118:3861–3868. doi: 10.1242/jcs.02500. [DOI] [PubMed] [Google Scholar]
- Wsierska-Gadek J, Horky M. How the nucleolar sequestration of p53 protein or its interplayers contributes to its (re)-activation. Ann N Y Acad Sci. 2003;1010:266–272. doi: 10.1196/annals.1299.046. [DOI] [PubMed] [Google Scholar]
Associated Data
This section collects any data citations, data availability statements, or supplementary materials included in this article.
Supplementary Materials
Location of exons/introns in the Zac1 gene and position of the primers used in the different PCR reactions are depicted according to the nucleotide sequences deposited in Ensembl Mouse Exon View for ENSMUST00000068371; http://www.ensembl.org (a). Methyl Specific PCR (MSP) assay was performed to detect differentially methylated CpGs of the Zac1 gene promoter in the MEF cell line (G7) and neurons (Neu) from mouse embryos. The digital image is automatically generated by the 2100-Bioanalyzer (Agilent Technologies). MSP assay showed that the CpGs of the promoter region exist in both methylated (M) and unmethylated (U) forms (b). Methyl Specific PCR (MSP) assay performed to test the completion of the bisulphate-mediated C>T conversion. The results from two experiments show that the MSP primers only amplified unmethylated DNA (c).
Sequential FISH analysis with of pA and pB rDNA probes (arrows) followed by multicolor spectral karyotyping showing the localization of ribosomal genes only on chromosomes 12, 15 and 18, but not on chromosome 10.
RNA-FISH with probes for exon X (Fragment Zac1-5; red, arrows) and intron X-XI (Fragment Zac1-4, green, arrows) on G7 cells counterstained with DAPI. Arrows indicate RNA signals (a). Sequential RNA/DNA-FISH analysis with the Zac1-5 fragment (red) and the BAC probe (green). Scale bars = 4 μm (b).
Zac1 gene RNA FISH (green, arrows) with a probe for exon X (Zac1-5 fragment) combined with nucleolus immunostaining with an antibody against NPM (red) after Actinomycin D removal from the culture dish. Counterstaining with DAPI (blue), scale bar = 2 μm.
RNA FISH was performed with the Zac1-5 fragment labeled with digoxigenin-12-dUTP and revealed with anti-digoxigenin conjugated to FITC (green). The nucleus was counterstained with DAPI (blue).