

Abstract
Purpose
To determine the degree of correlation between spatial characteristics of the retinal nerve fiber layer (RNFL) birefringence (ΔnRNFL) surrounding the optic nerve head (ONH) with the corresponding anatomy of retinal ganglion cell (RGC) axons and their respective organelles.
Methods
RNFL phase retardation per unit depth (PR/UD, proportional to ΔnRNFL) was measured in two cynomolgus monkeys using enhanced polarization-sensitive optical coherence tomography (EPS-OCT). The monkeys were perfused with glutaraldehyde and eyes were enucleated and prepared for transmission electron microscopy (TEM) histological analysis. Morphological measurements from TEM images were used to estimate values of neurotubule density (ρRNFL), axoplasmic area (Ax) mode, axon area (Aa) mode, slope (u) of neurotubule number versus axoplasmic area [neurotubule packing density], fractional area of axoplasm in the nerve fiber bundle (f), mitochondrial fractional area in the nerve fiber bundle (xm), mitochondriated axon profile fraction (mp), and length of axonal membrane profiles per unit nerve fiber bundle area (Lam/Ab). Registered PR/UD and morphological parameters from corresponding angular sections were then correlated using Pearson’s correlation and multi-level models.
Results
In one eye, there was a statistically significant correlation between PR/UD and ρRNFL (r = 0.67, P =0.005) and between PR/UD and neurotubule packing density (r = 0.70, P = 0.002). Correlation coefficients of r = 0.81 (P=0.01) and r = 0.50 (P = 0.05) were observed between PR/UD and (Ax) mode for each respective subject.
Conclusion
Neurotubules are the primary source of birefringence in the RNFL of the primate retina.
Glaucoma is a progressive optic nerve disease characterized by a loss of retinal ganglion cell (RGC) axons and thinning of the retinal nerve fiber layer (RNFL). Axon loss can be as much as 50% before the disease is clinically detectable.1 Imaging devices have been developed to quantitatively measure RNFL thinning and birefringence loss. For example, optical coherence tomography (OCT) produces cross-sectional images of the retina allowing measurement of RNFL thickness.2 Polarization-sensitive OCT (PS-OCT)3 and scanning laser polarimetry (GDx)4 measure phase retardation in the RNFL which arises from anisotropic structures in the RNFL.5 Changes in RNFL birefringence may precede RGC death.
Birefringence (Δn) is a dimensionless measure of the anisotropy of the refractive index (n) of a material and is given by the difference of the extraordinary index (ne) and ordinary index (no) where no and ne are the refractive indices for polarization perpendicular and parallel to the axis of anisotropy respectively (Δn = ne - no). Phase retardation is proportional to birefringence according to the expression Δn = λ0PR/360°ΔZ where λ0 is the free-space wavelength, PR is the phase retardation, and ΔZ is the thickness of the material.6 In general, Δn of the RNFL is weakly wavelength dependent across visible and near infrared wavelengths.7 The RNFL demonstrates form birefringence that originates from anisotropic cylindrically shaped cellular structures in the RGC axons.8,9 The major cylindrical structures of the RGC axonal cytoskeleton are neurotubules (NT), neurofilaments, and neurotubule-associated proteins.10 Huang et al.5 identify neurotubules as the source of birefringence from the RNFL. Theoretical analysis has attributed RNFL reflectance to the cylindrically shaped mitochondria and axonal membranes.9
It is postulated that either changes in neurotubule density of RNFL bundles or neurotubule packing density within axons themselves are responsible for the differences in birefringence surrounding the ONH.11 Neurotubule density (ρRNFL) is defined here as a scalar estimate of the number of neurotubules per unit area of RNFL tissue (NT/μm2). There is strong evidence that the regional characteristic ρRNFL surrounding the optic nerve head (ONH) is a source of birefringence,5,12,13 but it has not been clear if ρRNFL is the only source of birefringence.9 RNFL birefringence has been investigated as a possible diagnostic to detect early sub-cellular changes in glaucoma before there is any measurable change in RNFL thickness.5,12,13 Fortune et al.13 injected colchicine into the vitreous of non-human primate eyes and observed neurotubule disruption with a reduction of RNFL birefringence without any accompanying change in RNFL thickness. These results show that decreases in neurotubule number occur prior to thinning of the retinal nerve fiber layer and in situ measurement of ρRNFL can be used as a diagnostic for cytoskeletal changes in RGC axons.13 This study compares the measured birefringence signal in the peripapillary retina with the corresponding measured anatomical features to explore the origin of the RNFL birefringence.
Methods
Measurement of RNFL Birefringence
The retinas of two healthy six year old female, 5.9 and 7.7 kg, cynomolgus monkeys were imaged using EPS-OCT (subjects #1853 and #57204). Intraocular pressures and subjective visual function were normal. Imaging took place over a period of 62 days. All experimental procedures were approved by The University of Texas at Austin Institutional Animal Care and Use Committee (IACUC, Protocol # 05021401) and conform to all United States Department of Agriculture (USDA), National Institutes of Health (NIH), and the Association for Research in Vision and Ophthalmology (ARVO) guidelines for animal welfare. A combination of ketamine (10 mg/kg) and xylazine (0.25 mg/kg) given IM were used to anesthetize the monkeys, and anesthesia levels were monitored by a certified veterinary technologist. A retrobulbar injection of 0.5% xylocaine and 0.375% marcaine was given to immobilize the eye that was imaged. Pupils were dilated using 1 drop of 1% cyclopentolate and 1 drop of 1% tropicamide. One drop of 10% methylcellulose, to prevent dehydration, was placed in the eye to be imaged and a contact lens was placed on that eye. A contact lens that rendered the monkey slightly myopic was used to ensure light was focused on the internal limiting membrane (ILM).
The peripapillary retinal nerve fiber layer (RNFL) thickness (ZRNFL) and single-pass phase retardation maps of the two cynomolgus monkeys were measured using an Enhanced Polarization-Sensitive Optical Coherence Tomography (EPS-OCT) system described previously.11,14 EPS-OCT consists of a PS-OCT instrument combined with a nonlinear fitting algorithm to determine PR and Δn with high sensitivity in weakly birefringent tissues. The system utilizes a mode-locked Ti:Al2O3 laser source (λ0=830 nm, Δλ=55 nm) linearly polarized at 45°. The ZRNFL and PR maps are used to construct phase retardation per unit depth (PR/UD) area maps given in units of degrees retardation per 100 microns of RNFL thickness [°/100 μm]) by dividing local PR by ZRNFL.
The PR map was measured in an area and ring scan configuration. Each area map consists of 24 evenly spaced (15°) radial scans containing 2, 6, or 8 clusters distributed uniformly between 1.4 and 1.9 mm from the center of the optic nerve head. A cluster is comprised of 36 or 64 A-scans individually acquired over a respective 0.9 or 1.6 mm2 square area. Ring scans are derived from sector scans spread 5° apart. The right eye of each subject was imaged twice on separate days to assess reproducibility of retinal birefringence measurements.
A single peripapillary map was acquired in approximately 45 minutes. Laser power incident on the cornea was 2.8 mW during lateral scanning and 1.7 mW while stationary for both scan configurations. Approximate laser spot size at the retinal surface was 30 μm. Axial resolution was 5 μm (determined by the coherence length of the laser source in air).
RGC Axon Organelle Sampling
The PR/UD sinusoid pattern11,15,16 surrounding the ONH was used to determine the angular interval around the ONH that RGC axon organelles must be sampled. Using the Nyquist criterion, RGC axon organelles were measured in 8 angular sections (octants) of the peripapillary retina in the first eye sampled (1853 OS). Based on the correlation result between birefringence and ρRNFL of the first eye, it was determined that 16 angular interval sections should be sampled around the ONH of the second eye (decreasing bundle variance within a region) to increase the power to 80% and detect a significant correlation between ρRNFL and birefringence (Figure 1). Each bundle within an angular section was chosen at random to eliminate bias. Nerve bundles were sampled from a 0.15 mm2 rectangular area from each angular section which contained approximately 15-20 nerve fiber bundles; therefore, three nerve fiber bundles approximate 15 to 20% and 7.5% to 10% of the sampled area of subject 57204 and 1853, respectively. The exact number of bundles within each angular section is not known.
Figure 1.

The peripapillary RNFL was divided into 8 and 16 angular sections. Each angular section is labeled by the symbols superimposed on the area surrounding the ONH (white circle) for subjects (A)1853 OS and (B)57204 OD, The uncertainty in RNFL bundle positions are ± 22.5° and ± 11.25° for subjects 1853 and 57204, respectively. Modified with permission from Histology of the Human Eye, Hogan MJ, Alvarado JA, Weddell JE, Copyright Elsevier 1971. 17
Preparation of Ocular Tissue
Two days after EPS-OCT imaging was completed, both monkeys were anesthetized and transcardially perfused with a fixative solution (pH 7.4) consisting of 2.5% glutaraldehyde and 2% paraformaldehyde in 0.1 M sodium phosphate buffer. Each animal was first brought down to a surgical level of anesthesia with a combination of ketamine (10 mg/kg) and xylazine (0.5 mg/kg) given IM. A dose of sodium pentobarbital was given first for surgical anesthesia effect (10 mg/kg) and then in an overdose IV.
After each perfusion was complete, all four eyes were enucleated and immersed in 180 mL of the primary fixative solution from 1 to 3 hours prior to dissection from the peri-orbital tissue and removal of the posterior hemisphere of the eye. A 360° incision was made at the ora serata, and the anterior eye structures including the cilary body, iris, lens, and cornea were removed from the posterior eye cup. A notch and suture placed in the nasal sclera prior to enucleation remained visible throughout the specimen preparation process to maintain proper orientation. All posterior eye cups were then simultaneously immersed in 180 mL of the primary fixative solution for approximately 1.5 hours.
Eye cups were washed in three 30-minute changes of 0.1 M sodium phosphate buffer (180 mL each, pH 7.4) and post-fixed in 90 mL of 2% osmium tetroxide (aqueous) solution for 1 hour. They were washed again two times for 30 minutes per wash in 0.1 M sodium phosphate buffer (180 mL each, pH 7.4) and then one more time in 180 mL of distilled water for 30 minutes. The eye cups were then dehydrated through a series of increasing ethanol concentration solutions (50% for 14 hours, 75% for 1 hr, 100% for 1 hr, 100% for 1 hr, all 180 mL) followed by two immersions in acetone (50 mL100% acetone for 1 hr each). The posterior eye cups were then infiltrated with 1/3 EMBed-812 (Electron Microscopy Sciences, Hatfield, PA) in acetone for 1 hr, after which they were covered and left in 2/3 EMBed-812 for 19 hours overnight. The following day, the eye cups were placed into fresh solutions of 100% EMBed-812 and left in uncovered containers for approximately 5 hours. They were then placed anterior-side down into cubical embedding molds. The molds were put into a 60 °C oven for 21 hours overnight, during which the EMBed-812 solution polymerized, and the eyes were removed the following day.
Superficial lines intersecting at the center of the ONH profile were used to divide the cube mold of the embedded eye into wedge shaped angular sections. Each sample wedge was carefully carved from the cube to prevent excess tissue removal surrounding the ONH. Glass knives were used to create a flat rectangular block face (500 × 300 μm).
Transmission Electron Microscopy
Ultra-thin and semi-thin sections were sampled 1.6 to 1.9 mm from the ONH in regions using an Ultracut UCT Ultramicrotome (Leica Microsystems GmbH, Ernst-Leitz-Strasse, Germany). Semi-thin sections (0.5 μm) were cut and stained with toluidine blue prior to ultra-thin sections (60 nm) to ensure block orientation on the microtome allowed transverse cuts. Several ultra-thin sections were placed on copper, alpha-numeric indexed grids (Electon Microscopy Sciences, Hatfield, PA) and stained with 2% uranium acetate and 0.3 % lead citrate before TEM analysis.
Gray-scale digital images were captured on a EM208 TEM (Phillips, Netherlands) equipped with an Advantage HR 1 MB Digital Camera system (AMT, Danvers, MA). Each bundle was photographed at a low (2200X to 2800X), medium (11000X to 14000X), and high (28000X to 44000X) magnification.
Identification of RGC Axons and Organelles
All morphological measurements were made using Image J (version 1.36, National Institutes of Health, Bethesda, MD) on a tablet PC (Hewlett Packard Compaq, USA). Low magnification TEM images were used to measure nerve fiber bundle area (Ab) (Figure 2).
Figure 2.

Low magnification image (2200X) of a retinal nerve fiber layer bundle from subject 57204 in angular section NSI. Scale bar, 2 μm.
A montage of each nerve fiber bundle was created from a series of medium magnification images using Photoshop® (Adobe, v. 8.0) (Figure 3). RGC axons were captured in high magnification images to measure respective axonal cross sectional area (Aa), neurotubule number (k), mitochondrial area (Am), non-cytoskeletal organelle areas (Ao), and unidentifiable features of the RNFL bundle. Neurotubules in each of the selected RGC axons were manually counted using the Cell Counter plugin in Image J. A single person identified and counted the RGC organelles in subject 1853 and two different people identified and counted organelles for subject 57204.
Figure 3.

(A) A montage of a nerve fiber bundle from subject 57204 in angular section ITL. Montages were transferred to a tablet PC, where cellular structures were traced, counted, and measured. The montage was used to keep track of photographed high magnification images of RGC axons using the Image J’s Region of Interest (ROI) Manager to ensure that there were not any repeat or missed images of any RGC axons within the nerve fiber bundle. Scale bar, 2 μm (B) Medium magnification (11000X to 14000X) TEM image used to create montage in (A). Scale bar, 1 μm.
The RNFL anterior and posterior boundaries were defined as the ILM-vitreous interface and the anterior most RGC bodies18, respectively. If RGC bodies were not present directly posterior to the nerve fiber bundle, then the posterior boundary was defined at the points were RGC axons were absent. A line that bisected Muller cell processes and their footplates at the ILM defined boundaries between adjacent nerve fiber bundles. Axons that appeared pale and had substantially fewer neurotubules were identified as ‘sparse’ axons and were recorded apart from the ‘non- sparse’ axons (Figure 4). Amacrine cells or glial cells were not included in RGC axons counts using criteria described previously.19
Figure 4.

High magnification images (28000X to 44000X) were used to measure RGC axon neurotubules and organelles. Sparse axons were rare in nerve fiber bundles except in the temporal macular region of the eye in both subjects. Axons that had a neurotubule density that was less than 25% percent of the average neurotubule density of the axon population were classified as sparse axons. (A) Sparse axons (S) appear pale and have fewer nerurotubules. Scale bar, 0.5 μm. (B) A RGC axon from nasal region of subject 57204. Scale bar, 0.5 μm.
Neurotubule Density Estimation
Non-sparse Axons
RGC axoplasmic area (Ax) measurements measured from TEM images were used in a statistical algorithm to estimate ρRNFL. (Ax) was calculated as the difference between (Aa) and the total organelle area (Am and Ao) for each RGC axon and was then plotted against its respective neurotubule number (k) in an Excel (Microsoft, Redmond, WA) scatter plot to determine k(Ax). Axoplasmic area probability distribution functions (p(Ax)) were then computed for each bundle using a kernel estimation method based on an Epanechnikov kernel function. A Freedman-Diaconis bin width rule was used to determine the bandwidth of the kernel smoothing window and was adjusted using Scott’s skewness factor. The axoplasmic fractional area in the bundle (fx) is determined by summing all Ax measurements in the bundle and then dividing the result by the area of the bundle (Ab):
| (1) |
Calculations of k(Ax), p(Ax), and fx are used to estimate RNFL neurotubule density in the non-sparse axons of the nerve fiber bundle according to the expression:
| (2) |
where ρRNFL is given in units of neurotubule number per unit RNFL area.
The right side of Equation 2 is essentially a twice-weighted sum of RGC axoplasmic neurotubule densities:
| (3) |
which are estimated by the k(Ax) linear regression model. Individual neurotubule number estimates for each axon (ρx) are weighted by the probability of a given Ax in the nerve fiber bundle (p(Ax)dAx) and by the fraction of axoplasmic areas in the bundle (fx) which accounts for null ρRNFL values in non-RGC areas of the RNFL bundle and effectively normalizes ρx into ρRNFL.
Sparse Axons
A different statistical method is used to estimate ρRNFL in the temporal maculopapillary fibers (angular sections TI,TSI,TIS) for both subjects. The Ax range for the non-sparse axons in this region was a narrow range and resulted in low R2 values in linear fits of k versus Ax.
100 non-sparse axons were selected from the angular regions. The morphological characteristics of the selected axons resembled non-sparse axons in other regions of the eye. The sample set was used to generate an average non-sparse axoplasmic neurotubule density (ρnsx) from which a 25% neurotubule density threshold was set to classify sparse axons in the respective region. Once sparse axons were identified, a sparse axons neurotubule density (ρsx) was determined. The (ρnsx) and (ρsx) were individually weighted by their respective (fx) and summed together to get an estimate for ρRNFL in the respective section according to:
| (4) |
Experimental Correlation Between Birefringence and RGC Organelles
Radial area and ring scan PR/UD measurements falling within an angular section were average together resulting in an equal number of PR/UD values for every mean ρRNFL value. The averaged PR/UD measurements for subjects 1853 and 57204 resulted in ± 22.5° and ±11.25 of angular error, respectively. Average PR/UD measurement positions were optimally registered with angular RGC axon organelle mean measurements to compute the correlation between them (Figure 5). The shift was used to avoid PR/UD and ρRNFL measurement positions taken at angular boundaries between sections in both subjects.
Figure 5.

(A) Original positions of the mean ρRNFL values and PR/UD radial area and ring scan measurements used for correlation with ρRNFL for subject 57204. The yellow and blue bar highlight the original position of angular section TIS and the lowest PR/UD measurements within an angular section, respectively. (B) Radial area and ring scans of PR/UD falling within an angular section were averaged together resulting in an equal number of PR/UD measurements for every ρRNFL value.The green bar marks the optimally registered ρRNFL value for angular section TIS and PR/UD measurement. N, nasal; T, temporal; S, superior; I, inferior
Two approaches were used to find a correlation between PR/UD and RGC organelles. The first approach uses a Pearson product moment correlation. SAS®9 statistical software package (SAS, Cary, NC) was used to compute correlation coefficients and significance values.
A multilevel modeling technique was used for the second approach since it allows PR/UD and RGC organelles to be correlated on two levels so that finer angular resolution of PR/UD measurements could be preserved. Multilevel modeling was implemented through the procedure PROC MIXED within the SAS®9 software. The model accounts for the random effect of angular position of PR/UD measurements.
Results
Primate RNFL Birefringence
Spatially resolved RNFL peripapillary PR/UD maps were obtained from four eyes of two subjects using EPS-OCT. Results from both subjects are presented throughout the results section to demonstrate the similarities and differences in birefringence and morphological measurements.
Radial area and ring scan measurements of PR/UD were relatively higher in the superior and inferior areas for both subjects (Figure 6). Clusters of PR/UD radial area and ring scans within respective ρRNFL angular section boundaries were averaged together resulting in an equal number of PR/UD measurements for every ρRNFL value.
Figure 6.

Phase retardation per unit depth (PR/UD, proportional to birefringence) measurements along a 360° circular sweep around the ONH. PR/UD measurements (ring or radial) in each eye are plotted with a unique symbol. The black squares in both figures represent the average PR/UD of combined ring and radial scans for each angular section region that was used to determine neurotubule density. (A)Two different radial area and single ring scan for subject 52704. (B) Area scan and ring scan of 1853 OS. N, nasal; T, temporal; S, superior; I, inferior
The PR/UD radial area and ring measurements are grouped into regional quadrants and averaged to give the mean PR/UD values listed in Table 1. One-way ANOVA was used to compare quadrant means. The temporal and inferior pair was the only quadrant pair that was not significantly different (P<0.05) for subject 1853. All quadrant pairs excluding the inferior and nasal pair were significantly different (P<0.05) for subject 57204.
Table 1.
Phase retardation per unit depth (PR/UD, proportional to birefringence) quadrant means of radial area scan and ring scan measurements in one eye from each subject. The right eye of subject 57204 was imaged twice to assess reproducibility
| 57204 OD | 1853 OS | |||||||||
|---|---|---|---|---|---|---|---|---|---|---|
| Scan Pattern | Radial Area Scan 1 | Radial Area Scan 2 | Ring Scan | Radial Area Scan | Ring Scan | |||||
| μ | ± s | μ | ± s | μ | ± s | μ | ± s | μ | ± s | |
| Superior | 19.1 | 2 | 18.3 | 2.6 | 17.1 | 4.2 | 14.1 | 4.3 | 17.6 | 3.2 |
| Inferior | 14.1 | 3.1 | 14.9 | 2.6 | 14.8 | 3.9 | 12.3 | 5.1 | 9.4 | 4.7 |
| Temporal | 9.4 | 3.3 | 9.0 | 3.3 | 9.6 | 4.3 | 8.5 | 3.6 | 9.3 | 3.3 |
| Nasal | 12.5 | 4.5 | 15.5 | 12.4 | 11.5 | 5.7 | 13.3 | 6.1 | 14.3 | 5.6 |
Data are mean (μ) and standard deviation (s) of PR/UD
PR/UD measurement reproducibility was determined for both radial area scans and the ring scan of subject 57204 by calculating the standard error (SE)15 for each of the PR/UD measurements that were averaged together within ρRNFL angular section boundaries. To calculate the SE for each PR/UD measurement, the standard deviation of the cluster PR/UD measurements within angular section boundaries were divided by the square root of the number of clusters. The highest SE of all PR/UD measurements was ± 7.1 °/100 μm in the nasal region. The average SE of all three scans was ± 1.9 °/100 μm (Δn = 0.4 × 10⁻⁴) and was calculated by dividing the average standard deviation of cluster PR/UD measurements from all three scans by the square root of the number of scans.
Primate RNFL Neurotubule Density
Estimates of ρRNFL for all bundles in both eyes are given in Table 2 and 3 and results shown graphically in Figure 7A. Neurotubule densities were highest in the superior and inferior quadrants and lowest in the temporal and nasal regions of both subjects. Pearson product moment correlation was used to find the similarity between the octant mean ρRNFL values between the two subjects (Figure 7B). The result was a correlation coefficient of 0.97 (P<0.001).
Table 2.
Neurotubule densities were estimated in 3 nerve fiber bundles of each RNFL octant. ρRNFL bundle estimates as well as octant means and standard deviations are given for subject 1853. NT, neurotubules
| Subject 1853 OS ρRNFL (NT/μm2) | |||||
|---|---|---|---|---|---|
| Section | Bundle 1 | Bundle 2 | Bundle 3 | μ | s |
| NS | 66.0 | 72.2 | 76.3 | 71.5 | 5.2 |
| SN | 110.1 | 69.8 | 64.6 | 81.5 | 24.9 |
| ST | 126.5 | 79.4 | 85.4 | 97.1 | 25.7 |
| TS | 69.9 | 64.7 | 69.6 | 68.1 | 2.9 |
| TI | 32.5 | 28.8 | 37.6 | 33.0 | 4.4 |
| IT | 80.5 | 96.3 | 69.9 | 82.2 | 13.3 |
| IN | 98.4 | 77.0 | 68.3 | 81.2 | 15.5 |
| NI | 49.6 | 74.6 | 90.1 | 71.4 | 20.4 |
Data are mean (μ) and standard deviation (s) of ρRNFL
Table 3.
Neurotubule densities were estimated in 3 nerve fiber bundles of each RNFL section. ρRNFL bundle estimates as well as angular section means and standard deviations are given for subject 57204. NT, neurotubules
| Subject 57204 OD ρRNFL (NT/μm2) | |||||
|---|---|---|---|---|---|
| Section | Bundle 1 | Bundle 2 | Bundle 3 | μ | s |
| NSI | 53.7 | 42.6 | 37.1 | 44.5 | 8.5 |
| NSS | 66.9 | 54.2 | 36.1 | 52.4 | 15.5 |
| SNL | 77.0 | 45.1 | 68.4 | 63.5 | 16.5 |
| SNM | 87.7 | 66.9 | 68.3 | 74.3 | 11.6 |
| STM | 45.1 | 59.8 | 45.8 | 50.2 | 8.3 |
| STL | 63.0 | 18.1 | 60.8 | 47.3 | 25.3 |
| TSS | 33.0 | 26.2 | 33.5 | 30.9 | 4.1 |
| TSI | 4.5 | 9.3 | 33.1 | 15.6 | 15.3 |
| TIS | 11.3 | 5.6 | 3.7 | 6.9 | 3.9 |
| TII | 46.5 | 35.0 | 42.3 | 41.3 | 5.8 |
| ITL | 72.6 | 24.5 | 83.5 | 60.2 | 31.4 |
| ITM | 50.6 | 65.6 | 47.2 | 54.5 | 9.8 |
| INM | 42.1 | 73.7 | 41.4 | 52.4 | 18.5 |
| INL | 73.7 | 22.3 | 25.6 | 40.5 | 28.8 |
| NII | 18.4 | 73.0 | 76.7 | 56.0 | 32.6 |
| NIS | 17.7 | 42.0 | 38.8 | 32.9 | 13.2 |
Data are mean (μ) and standard deviation (s) of ρRNFL
Figure 7.

(A) Mean retinal nerve fiber layer neurotubule density (ρRNFL) estimates averaged over 3 nerve fiber bundles are presented for both subjects. (B) ρRNFL estimates for subject 57204 within angular section octants analogous to subject 1853 were further averaged to produce eight ρRNFL values for comparison with subject 1853. N, nasal; T, temporal; S, superior; I, inferior
The linear relationship between k and Ax used in the ρRNFL estimate was similar across all angular sections for both subjects (Figure 8A). As axon size increases, the neurotubule number also increases but the number of neurotubules per unit axon area decreases. This finding is similar to other studies investigating axon size and neurotubule density in the optic nerve head.20
Figure 8.
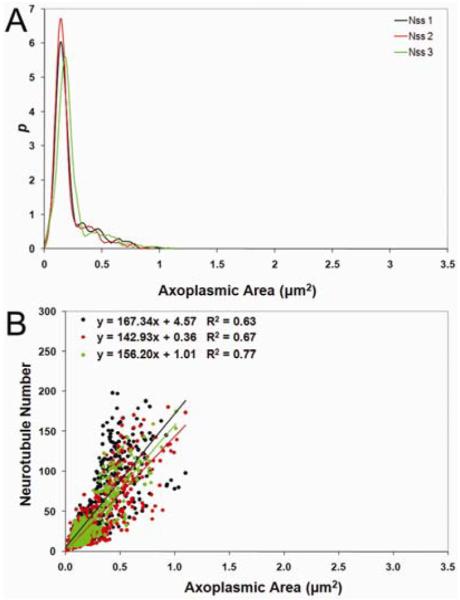
(A) Least-squares linear fits of neurotubule number (k) versus axoplasmic area (Ax) and (B) axoplasmic area probability density function from angular section NSS of 57204 OD used in the statistical algorithm to estimate ρRNFL
Correlation Between Birefringence and RGC Organelles
Subject 57204 had a correlation coefficient of 0.67 (P = 0.005) between PR/UD and ρRNFL (Table 4), and the multilevel model resulted in standardized regression coefficients of 0.50 (P = 0.04). The averaged pattern of PR/UD is shown superimposed on respective ρRNFL for both subjects in Figure 9.
Table 4.
Correlation between PR/UD and ρRNFL using Pearson’s correlation and multi-level model for subject 57204
| Statistical Model | r | P |
|---|---|---|
| Pearson’s Correlation | 0.67 | 0.005 |
| Multi-level Model | 0.5 | 0.04 |
Figure 9.

Average birefringence measurements calculated from EPS-OCT PR/UD radial area and ring scans plotted with respective regional neurotubule density (ρRNFL) for subjects (A) 57204 (B) and 1853. Area and ring scans of PR/UD measured within angular regions that were sampled for neurotubule density surrounding the ONH were averaged together within the respective angular section region resulting in an equal number of PR/UD measurements for every ρRNFL value. N, nasal; T, temporal; S, superior; I, inferior
Morphological measurements from TEM images were used to estimate mean values of axoplasmic area (Ax) mode, axon area (Aa) mode, slope (u) of neurotubule number vs. axoplasmic area [neurotubule packing density], fractional area of axoplasm in the nerve fiber bundle (fx), mitochondrial fractional area in the nerve fiber bundle (xm), mitochondriated axon profile fraction (mp), and length of axonal membrane profiles per unit nerve fiber bundle (Lam/Ab).
Pearson product moment correlation coefficients of the morphological parameters with PR/UD are summarized in Table 5. Correlation coefficients of r = 0.81 (P= 0.01) and r = 0.5 (P = 0.05) were observed between PR/UD and mean (Ax) mode for subjects 1853 and 57204 (Figure 10), respectively. Mean (Ax) mode values were similar for the superior and inferior portions of both eyes and were larger than temporal and nasal portions. Mean (Aa) and PR/UD yielded a significant correlation coefficient of r = 0.79 (P= 0.01) for subject 1853 (Figure 10 B).
Table 5.
RGC Morphological measurements were correlated with phase retardation per unit depth (PR/UD, proportional to birefringence) for subjects 57205 and 1853. RGC axoplasmic area (Ax) mode, neurotubule number (k) vs. Ax least-squares linear slope (u), and fractional area of axoplasm per unit nerve fiber bundle (fx) measurements are associated with non-sparse axons only. Axon area (Aa) mode, mitochondrial fractional area (xm), mitochondria-containing axon profile fraction (mp), and length of axonal membrane per unit nerve fiber bundle area (Lam/Ab) measurements are associated with both sparse and non-sparse axons (s, ns). Asterisks denote morphological parameters that had a significant correlation with PR/UD. NT, Neurotubules
| RGC Axon Morphological Measurement | Abbreviation | 57204 OD | 1853 OS | ||
|---|---|---|---|---|---|
| r | P | r | P | ||
| Least-Squares Linear Slope (number of NT per unit Ax area), (NT/μm2) | mean u | 0.70* | 0.0028 | 0.68 | 0.0941 |
| Mean RGC Axoplasmic Area Mode (μm2) | mean Ax | 0.50* | 0.0500 | 0.81* | 0.0145 |
| Mean Axon Area Mode (μm2) | mean Aa | 0.47 | 0.0600 | 0.79* | 0.0184 |
| Neurotubule Density (number of NT per unit RNFL area), (NT/μm2) | mean ρRNFL | 0.67* | 0.0050 | 0.61 | 0.1077 |
| Axoplasmic Fractional Area (per unit RNFL bundle area), % | mean f | 0.34 | 0.1924 | 0.51 | 0.1934 |
| Mitochondrial Fractional Area (per unit RNFL bundle area), % | mean xm | 0.02 | 0.9500 | — | — |
| Mitochondria-Containing Axon Profile Fraction (per unit RNFL bundle area), % | mean mp | — | — | 0.24 | 0.5708 |
| Axonal Membrane Length (per unit RNFL bundle area), (μm-1) | mean Lam/Ab | 0.24 | 0.3670 | 0.23 | 0.5811 |
Figure 10.

Phase retardation per unit depth (PR/UD, proportional to birefringence) measurements from radial area and ring scans for subject 57204 were averaged together within its respective angular section around the (ONH) and superimposed on (A) mean (Ax) modes for subject 57204 and (B) mean (Aa) and (Ax) modes for subject 1853 measured in corresponding regions of the same eye. N, nasal; T, temporal; S, superior; I, inferior
For subject 57204, a significant correlation coefficient of r = 0.7 (P = 0.002) was observed between section averaged PR/UD and the k vs. Ax regression fit slope (u) which is used as a measure of neurotubule packing density (Figure 11). Arcuate bundle regions had the highest packing density followed by the nasal region and lastly the papillomacular region.
Figure 11.

Phase retardation per unit depth (PR/UD, proportional to birefringence) measurements from radial area and ring scans for subject 57204 were averaged together within its respective angular section around the (ONH) and superimposed on mean (u) [neurotubule packing density] data measured in corresponding regions of the same eye. N, nasal; T, temporal; S, superior; I, inferior
Discussion
Primate RNFL Birefringence
PR/UD measurements were highest superior and inferior to the ONH for both subjects. In subject 57204, the average of the quadrant PR/UD values given in Table 1 for the superior and temporal region are 18.2 ± 1.0°/100 μm (Δn = 4.2 × 10⁻⁴) and 9.3 ± 0.3°/100 μm (Δn = 2.1 × 10⁻⁴). Cense et al.15 measured the RNFL birefringence of two human subjects in vivo using PS-OCT at 840 nm. They also reported higher RNFL birefringence (4.1 × 10⁻⁴) in the superior and inferior areas with the lowest in the temporal region (1.2 × 10⁻⁴). Huang et al.16 calculated similar results of averaged birefringence for the superior (4.2 × 10⁻⁴) and temporal region (2.5 × 10⁻⁴) of 12 human eyes. The SE was greatest in the nasal region for subject 57204 and may have resulted from a thinner RNFL area or eye movements. This finding was similar to others.15
Uncertainty in the PR/UD measurements comes from any error in the retinal nerve fiber layer RNFL thickness (ZRFNL) measured from EPS-OCT intensity images and phase retardation (PR) estimates from the EPS-OCT algorithm. Error in the ZRFNL comes from the refractive index range for the RNFL (4%, n = 1.34-1.39)21 and uncertainty in the exact location of the RNFL boundaries due to the axial resolution limit of the EPS-OCT instrument (5 μm). Noise creates an uncertainty of approximately ± 1° for PR estimates. Thus, uncertainty in PR is fractionally greater in regions with low PR such as the nasal and temporal region. Radial and rotational error in position of the eye during imaging may have caused registration error in PR/UD measurements.
Neurotubule Density of the Primate RNFL
Sources of uncertainty for ρRNFL determination include: sampling RNFL bundles near the angular section boundaries, misclassified cells or cellular structures, different observers for the two eyes studied, and sampling location from the ONH for each eye. The higher ρRNFL values for subject 1853 can be explained by counter bias between the first and second eye. The mean difference (95% limits of agreement) between neurotubule counts of the same RGC axons of two counters for subject 57204 was -1.6(-8.8-5.6) neurotubules.
Some angular sections had more variability in ρRNFL within nerve bundles than others. Most of the variability could be attributed to differences in RNFL nerve bundle area (Ab) measurements since ρRNFL estimates are calculated using (Ab). The standard deviation of RNFL thickness of human retina ranges from 15 μm in the temporal region to 26.5 μm in the inferior region.26 Standard deviations of ρRNFL greater than ± 20 NT/μm2 occurs in the arcuate bundles and the bundles located in the inferior nasal portion of the RNFL near major blood vessels. Bundles lying close or adjacent to temporal blood vessels that approximately overlie the arcuate nerve bundles22 were not excluded from the sampling population. The few histological studies of primate RNFL thickness18, 22-24 do not measure thickness near large blood vessels because RNFL borders could not be accurately determined.25 The RNFL bundle area variation near and away from blood vessels as well judgment as to the location of the RNFL borders would produce variability in ρRNFL estimates.
Glial content (Muller cells and astrocytes) of nerve bundles would also contribute to bundle area variation seen within the same angular section since glial tissue is included in the (Ab) measurement. Ogden22 reported that the proportion of RNFL bundle area occupied by glia is independent of RNFL thickness and does not vary regularly with distance from the ONH in cynomolgus and rhesus monkeys. Angular sections with the highest variability in ρRNFL estimates also had the largest variability in glial content percentage.
Sections TSI, TIS, and TI are sampled from the papillomacular bundle fibers and have the smallest RGC fibers.27 Low mean ρRNFL value could be attributed to a combination of a thin RNFL23 and low number of RGC axons28 that have a significantly smaller mean neurotubule number. The sparse axons in the papillomacular bundles could be a fixation artifact if the smaller axons were not adequately preserved by the perfusion of fixative. A similar pattern of sparse axons was observed for the two eyes studied which should give some assurance that the pattern was not unique to a single eye; however, it is possible that the neurotubules in the small axons of the papillomacular bundle degenerated faster than the large axons found elsewhere. The neurotubules polymerize and de-polymerize very quickly and the smaller axons may be more fragile than the larger axons. The sparse axons and fewer non-sparse axons within octant TI and angular sections TSI and TIS could also be attributed to bilateral optic atrophy (BOA).29
The packing density was greatest for sections SNL, SNM, STM, ITM, and INM which are sampled from arcuate fibers. The arcuate portions of the RNFL are frequently involved in glaucoma and optic neuropathies.28 Higher birefringence values in the superior and inferior region of the eye can be attributed a combination of higher neurotubule packing density, larger axons, and less compartmentalization by glial tissue than other regions of the eye.28
Correlation Between Birefringence and RGC Axon Organelles
The high correlation between Ax and PR/UD in both eyes is interesting because axoplasmic regions of RGC axons are the only areas that neurotubules can inhabit. Additionally, there is a significant correlation between Aa and PR/UD in subject 1853. These findings suggest that a structure within the axoplasm is the source of the birefringence signal. The mean (u) (neurotubule packing density) was more significantly correlated with PR/UD than the mean ρRNFL for subject 57204. This suggests that the birefringence surrounding the ONH results from a difference in NT packing density of the axons themselves and not from a difference in the packing density of axons within bundles.
Lam/Ab fails to correlate with PR/UD in subject 57204 despite increased sampling and further supports the finding30 that cell membranes are not the source of birefringence. Mitochondrial fractional area (xm/Ab) and the percentage of mitochondria containing axons (xm) did not correlate with PR/UD for subject 57204 or 1853, respectively.
Conclusion
Our finding further supports the hypothesis that neurotubules are the primary source of birefringence in the RNFL. The strongest correlation between Δn and PR/UD (P=0.0028) for all the morphological parameters studied was the slope of the regression fit of k vs Ax which represents the neurotubule packing density.
Acknowledgements
Any opinions, interpretations, conclusions, and recommendations are not necessarily endorsed by the U.S. Air Force. We thank Matt Hersh and the Graduate Student Fellows Program run by The University of Texas at Austin’s Division of Statistics and Scientific Computation for their review of the manuscript and Maura Boyle for technical assistance.
Supported by National Eye Institute at the National Institutes of Health (Grant R01EY016462-01A1) and the Long Term Full Time Program (BV0700313000)
References
- 1.Quigley HA, Addicks EM, Green WR. Optic nerve damage in human gluacoma. III. Quantitative correlation of nerve fiber loss and visual field defect in glaucoma, ischemic neuropathy, papilledema, and toxic neuropathy. Arch Ophthalmol. 1982;100:135–146. doi: 10.1001/archopht.1982.01030030137016. [DOI] [PubMed] [Google Scholar]
- 2.Swanson EA, Izatt JA, Hee MR, et al. In-vivo retinal imaging by optical coherence tomography. Opt Lett. 1993;18:1864–1866. doi: 10.1364/ol.18.001864. [DOI] [PubMed] [Google Scholar]
- 3.Cense B, Mujat M, Chen TC, Park BH, de Boer JF. Polarization-sensitive spectral-domain optical coherence tomography using a single line scan camera. Opt Express. 2007;15:2421–2431. doi: 10.1364/oe.15.002421. [DOI] [PubMed] [Google Scholar]
- 4.Weinreb RN, Bowd C, Zangwill LM. Glaucoma detection using scanning laser polarimetry with variable corneal polarization compensation. Archives of Opthalmology. 2003;121:218–224. doi: 10.1001/archopht.121.2.218. [DOI] [PubMed] [Google Scholar]
- 5.Huang XR, Knighton RW. Microtubules Contribute to the Birefringence of the Retinal Nerve Fiber Layer. Investigative Opthalmology and Visual Science. 2005;46:4588–4593. doi: 10.1167/iovs.05-0532. [DOI] [PubMed] [Google Scholar]
- 6.Bass M, editor. Handbook of Optics, Volume 3: Classical Optics, Vision Optics, X-Ray Optics. 2ed. McGraw-Hill Professional; New York: 2000. [Google Scholar]
- 7.Huang XR, Knighton RW. Linear birefringence of the retinal nerve fiber layer measured in vitro with a mulitspectal imaging micropolarimeter. Journal of Biomedical Optics. 2002;7:199–204. doi: 10.1117/1.1463050. [DOI] [PubMed] [Google Scholar]
- 8.Huang X-R, Knighton RW. Theoretical model of the polarization properties of the retinal nerve fiber layer in reflection. Applied Optics. 2003;42:5726–5736. doi: 10.1364/ao.42.005726. [DOI] [PubMed] [Google Scholar]
- 9.Zhou Q, Knighton RW. Light scattering and form birefringence of parallel cylindrical arrays that represent cellular organelles of the retinal nerve fiber layer. Applied Optics. 1997;36:2273–2285. doi: 10.1364/ao.36.002273. [DOI] [PubMed] [Google Scholar]
- 10.Balaratnasinga C, Morgan WH, Bass L, Matich G, Cringle SJ, Yu D. Axonal Transport and Cytoskeletal Changes in the Laminar Regions after Elevated Intraocular Pressure. Investigative Opthalmology and Visual Science. 2007;48:3632–3644. doi: 10.1167/iovs.06-1002. [DOI] [PubMed] [Google Scholar]
- 11.Rylander HG, Kemp NJ, Park JS, Zaatari HN, Milner TE. Birefringence of the primate retinal nerve fiber layer. Experimental Eye Research. 2005;81:81–89. doi: 10.1016/j.exer.2005.01.009. [DOI] [PubMed] [Google Scholar]
- 12.Fortune B, Cull GA, Burgoyen CF. Relative Course of Retinal Nerve Fiber Layer Birefringence and Thickness and Retinal Function Changes after Optic Nerve Transection. Invest Ophthalmol Vis Sci. 2008;49:4444–4452. doi: 10.1167/iovs.08-2255. [DOI] [PMC free article] [PubMed] [Google Scholar]
- 13.Fortune B, Wang L, Cull G, Cioffi GA. Intravitreal Colchicine Causes Decreased RNFL Birefringence without Altering RNFL Thickness. Investigative Opthalmology and Visual Science. 2008;49:255–261. doi: 10.1167/iovs.07-0872. [DOI] [PubMed] [Google Scholar]
- 14.Kemp NJ, Park J, Zaatari HN, Rylander HG, Milner TE. High-sensitivity determination of birefringence in turbid media with enhanced polarization-sensitive optical coherence tomography. J Opt Soc Am A-Opt Image Sci Vis. 2005;22:552–560. doi: 10.1364/josaa.22.000552. [DOI] [PubMed] [Google Scholar]
- 15.Cense B, Chen TC, Park BH, Pierce MC, Boer JFd. Thickness and Birefringence of Healthy Retinal Nerve Fiber Layer Tissue Measured with Polarization-Sensitive Optical Coherence Tomography. Investigative Opthalmology and Visual Science. 2004;45:2606–2612. doi: 10.1167/iovs.03-1160. [DOI] [PubMed] [Google Scholar]
- 16.Huang X-R, Bagga H, Greenfield DS, Knighton RW. Variation of Peripapillary Retinal Nerve Fiber Layer Birefringence in Normal Human Subjects. Investigative Opthalmology and Visual Science. 2004;45:3073–3080. doi: 10.1167/iovs.04-0110. [DOI] [PubMed] [Google Scholar]
- 17.Hogan MJ, Alvarado JA, Weddell JE. Histology of the Human Eye. W.B. Saunder’s Company; Philadelphia: 1971. [Google Scholar]
- 18.Quigley HA, Addicks EM. Quantitative Studies of Retinal Nerve Fiber Layer Defects. Archives of Opthalmology. 1982;100:807–814. doi: 10.1001/archopht.1982.01030030811018. [DOI] [PubMed] [Google Scholar]
- 19.Perry VH. The ganglion cell layer of the mammalian retina. Progress in Retinal Research. 1982;1:53–80. [Google Scholar]
- 20.Hernandez C, Blackburn E, Alvarez J. Calibre and Microtubule Content of the Non-Medullated and Myelinated Domains of Optic Nerve Axons of Rats. European Journal of Neuroscience. 1989;1:654–658. doi: 10.1111/j.1460-9568.1989.tb00371.x. [DOI] [PubMed] [Google Scholar]
- 21.Sardar DK, Salinas FS, Perez JJ, Tsin AT. Optical characterization of bovine retinal tissues. Journal of Biomedical Optics. 2004;9:624–631. doi: 10.1117/1.1688813. [DOI] [PubMed] [Google Scholar]
- 22.Ogden TE. Nerve Fiber Layer of the Primate Retina: Thickness and Glial Content. Vision Research. 1983;23:581–587. doi: 10.1016/0042-6989(83)90063-9. [DOI] [PubMed] [Google Scholar]
- 23.Radius RL. Thickness of the Retinal Nerve Fiber Layer in Primate Eyes. Archives of Opthalmology. 1980;98:1625–1629. doi: 10.1001/archopht.1980.01020040477018. [DOI] [PubMed] [Google Scholar]
- 24.Morgan JE, Waldock A, Jeffery G, Cowey A. Retinal nerve fibre layer polarimetry: histological and clinical comparison. Br J Ophthalmol. 1998;82:684–690. doi: 10.1136/bjo.82.6.684. [DOI] [PMC free article] [PubMed] [Google Scholar]
- 25.Frenkel S, Morgan J, Blumenthal E. Histological measurement of retinal nerve fibre layer thickness. Eye. 2005;19:491–498. doi: 10.1038/sj.eye.6701569. [DOI] [PubMed] [Google Scholar]
- 26.Cohen MJ, Kaliner E, Kogan SFM, Miron H, Blumenthal EZ. Morphometric Analysis of Human Peripapillary Retinal Nerve Fiber Layer Thickness. Investigative Opthalmology and Visual Science. 2008;49:941–944. doi: 10.1167/iovs.07-0621. [DOI] [PubMed] [Google Scholar]
- 27.Ogden TE. Nerve Fiber Layer of the Primate Retina: Morphometric Analysis. Investigative Opthalmology and Visual Science. 1984;25:19–29. [PubMed] [Google Scholar]
- 28.Pollock SC, Miller NR. Retinal Nerve Fiber Layer. International Ophthalmology Clinic. 1986;26:201–222. doi: 10.1097/00004397-198602640-00019. [DOI] [PubMed] [Google Scholar]
- 29.Fortune B, Wang L, Bui BV, Burgoyen CF, Cioffi GA. Idiopathic Bilateral Optic Atrophy in the Rhesus Macaque. Investigative Opthalmology and Visual Science. 2005;46:3943–3956. doi: 10.1167/iovs.04-1160. [DOI] [PubMed] [Google Scholar]
- 30.Knighton RW, Huang X, Zhou Q. Microtubule Contribution to the Reflectance of the Retinal Nerve Fiber Layer. Investigative Opthalmology and Visual Science. 1998;39:189–193. [PubMed] [Google Scholar]