

Abstract
Previous human studies have demonstrated that midazolam-induced signal changes on scalp EEG recording include widespread augmentation of sigma-oscillations and that the amplitude of such oscillations is correlated to the severity of midazolam-induced amnesia. Still unanswered questions include whether midazolam-induced sigma-augmentation also involves the medial temporal region, which plays a role in memory encoding. Taking advantage of rare and unique opportunities to monitor neuronal activities using intracranial electrocorticography (ECoG) recording, we determined how intravenous administration of midazolam induced spectral frequency changes in the human cerebral cortex, including the medial temporal region. We studied three children with focal epilepsy who underwent subdural electrode placement and extraoperative ECoG recording for subsequent resection of the seizure focus; an intravenous bolus of midazolam was given to abort an ongoing simple-partial seizure or to provide sedation prior to induction of general anesthesia. ‘Midazolam-induced ECoG frequency alteration’ in sites distant from the seizure focus was sequentially animated on their individual three-dimensional MR images. The common ECoG changes induced by midazolam included gradual augmentation of sigma-oscillations (12-16 Hz) in the widespread non-epileptic regions, including the medial temporal region. The spatial and temporal alteration of ECoG spectral frequency pattern can be appreciated via animation movies. Midazolam-induced sigma-augmentation was observed in the medial temporal region in our relatively small cohort of human subjects. In-vivo animation of ECoG spectral measures provided a unique situation to study the effect of midazolam on neuronal processing in the deep brain regions.
Introduction
Midazolam is a benzodiazepine derivative widely utilized as a sedative and anticonvulsant agent, and known to produce anterograde amnesia [1-3]. Previous neuroimaging studies have shown that the effects of midazolam could be spatially-specific rather than purely global on the brain. Studies of healthy adult volunteers using positron emission tomography (PET) showed that midazolam infusion resulted in decreased cerebral blood flow in discrete brain regions including the insular, cingulate, prefrontal, thalamus, parietal-temporal association areas and hippocampus [4,5]. Due to its poor temporal resolution, these PET studies were not designed to delineate the dynamic change of brain activity induced by midazolam. Scalp electroencephalography (EEG) and magnetoencephalography are often used to assess the dynamic change of cortical activities in humans. A previous study of healthy adult volunteers using scalp EEG recording showed that intravenous administration of midazolam resulted in a global increase in amplitude ranging from 12 to 30 Hz within two minutes [6]. Another study also showed that midazolam-induced changes on scalp EEG recording include global augmentation of sigma-oscillations and that augmentation of such-oscillations was correlated to the severity of sedation [2]. It has been proposed that the amplitude of such oscillations on scalp EEG may be used to monitor the degree of sedation [2].
The medial temporal lobe structures including both hippocampus and parahippocampal gyrus are known to be responsible for memory encoding in humans [7,8]. Although the dynamics of neuronal activities in the medial temporal region are of great interest to investigators, assessment of neuronal activities in the medial temporal region is not tenable using scalp EEG recording. The dynamics of neuronal activities in the medial temporal region have been studied using intracranial electrocorticography (ECoG) recording in unique cohort of patients with focal epilepsy [9-15]. Spatial resolution of intracranial ECoG recording is as good as 1 cm, and a signal-to-noise ratio of ECoG is far better compared to that of scalp EEG. Can we address some of the unanswered questions regarding the dynamic changes of neuronal activities induced by midazolam, using ECoG recording? According to the observations derived from the above-mentioned scalp EEG studies [2,6] and neuroimaging studies [4,5], we specifically hypothesized that administration of midazolam would elicit augmentation of sigma-oscillations (12-16 Hz) in the medial temporal region in humans. In rare occasions during intracranial ECoG recording in our institute, midazolam was intravenously administered to patients with focal epilepsy, while the medial temporal region was apparently free from ongoing epileptic discharges. Taking advantage of such rare and unique opportunities, we decided to assess midazolam-induced spectral amplitude changes in the medial temporal region. Here, we sequentially delineated how intravenous administration of midazolam induced ECoG spectral changes in the cerebral cortex, using in-vivo animation on a three-dimensional-MRI. We specifically determined whether intravenous administration of midazolam increased sigma-oscillations in the medial temporal region.
Materials and Methods
Patients
The inclusion criteria of the present study consisted of: (i) a two-stage epilepsy surgery using continuous ECoG recording with subdural electrodes with a sampling frequency of 1,000 Hz in Children's Hospital of Michigan, Detroit, between April 2006 and January 2009; (ii) subdural electrode placement involving the medial temporal lobe region; (iii) subdural ECoG was digitally recorded when a bolus of midazolam was given to abort an ongoing simple-partial seizure or to provide sedation prior to induction of general anesthesia; (iv) the medial temporal region at least on one hemisphere was apparently free from ongoing seizure discharges when midazolam was given. The exclusion criteria consisted of: (i) a bolus of midazolam was given during a complex-partial seizure or secondarily generalized tonic-clonic seizure. The main measures of interest in the present study were spectral amplitude changes induced by midazolam rather than epileptic seizures. A total of 59 patients underwent a two-stage epilepsy surgery using continuous ECoG recording with subdural electrodes in our institute during the above-mentioned period. Thereby, we studied a series of three children (two girls ages 10 and 17 years; one boy age 16 years; Table 1) who had ECoG recording satisfying both inclusion and exclusion criteria. Past medical history was unremarkable in all patients; all patients achieved mental and physical development at appropriate ages; neurological exams were normal in all patients. We took advantage of such rare and unique opportunities to study the effect of midazolam on human cerebral cortex in a way not possible using scalp EEG recording. The study has been approved by the Institutional Review Board at Wayne State University, and written informed consent was obtained from the parents or guardians of all subjects.
Table 1. Patient data.
| Patient number | Age at surgery | Gender | Duration of epilepsy | Type of clinical seizures | Seizure onset zone | MRI findings | Medication |
|---|---|---|---|---|---|---|---|
| 1 | 10 year old | Female | 3 months | SPS, CPS, sGTC | Left superior frontal gyrus | Tumor | Levetiracetam (1500 mg/day) |
| 2 | 16 year old | Male | 11 years | SPS, CPS, sGTC | Right and left medial temporal lobe structures | Normal | Zonisamide (600 mg/day) & Topiramate (200 mg/day) |
| 3 | 17 year old | Female | 16 years | SPS, CPS, sGTC | Left superior frontal gyrus | Normal | Lamotrigine (500 mg/day) |
SPS: simple partial seizures. CPS: complex partial seizures. sGTC: secondarily generalized tonic-clonic seizures.
Two-stage epilepsy surgery using extraoperative ECoG recording
For extraoperative video-ECoG recording, as a part of clinical management of medically-uncontrolled focal epilepsy, platinum grid electrodes (10mm inter-contact distance; 4mm diameter; Ad-tech, Racine, WI, USA) were surgically implanted on the left hemisphere in patient 1 and on both right and left hemispheres in patients 2 and 3. The location of each subdural electrode was co-registered to each individual's three-dimensional surface MR image (Figures 1, 2, and 3), as previously described in detail [16-18]. The accuracy of this procedure was reported previously as 1.24 ± 0.66 mm with a maximal misregistration of 2.7 mm [16].
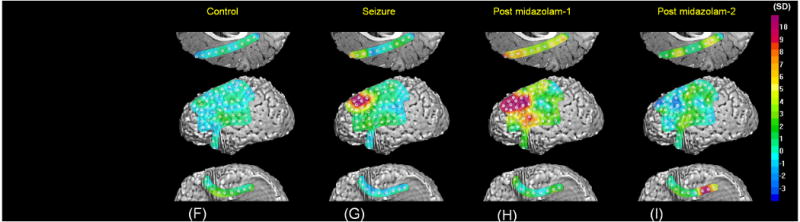
Figure 1. ECoG frequency alteration induced by a seizure and subsequent administration of midazolam in patient 1.
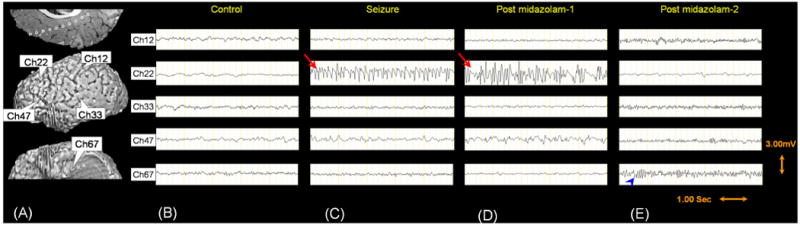
Forty subdural electrodes on the left frontal lobe (33 on the lateral surface and 7 on the medial surface), 17 electrodes on the left parietal lobe (14 on the lateral surface and 3 on the medial surface), and 16 electrodes on the left temporal lobe (12 on the temporal neocortex and 4 on the medial temporal region) were included into further analyses.
An electrographic seizure occurred in the epilepsy monitoring unit, when the patient had verbal communication with a physician. The seizure discharges (red arrows in [C] and [D]) were characterized by paroxysmal rhythmic discharges at alpha and sigma range, followed by rhythmic spike-and-wave discharges arising from the left superior frontal cortex overlying the tumor; the seizure discharge was slowly propagated to the adjacent left frontal neocortex. During this seizure event, the patient continued to communicate with the physician appropriately and denied having an epileptic seizure. Neither tremor nor clonic movement of the body was noted. Intravenous boluses of midazolam (0.1 mg/kg) were given twice to abort the ongoing electrographic seizure and to reduce the risk of generalized tonic-clonic seizure. The seizure discharge lasted 10 minutes. Quantitative assessment of ECoG amplitude spectra showed that the seizure discharge was initially characterized by focal augmentation of alpha- and sigma-amplitudes in the seizure focus followed by amplitude augmentation of widespread frequency bands as the seizure progressed. The seizure offset was characterized by sweep subsidence of amplitudes of all eight frequency bands but delta band in the seizure focus. The non-epileptic brain region distant from the seizure focus (i.e.: the inferior-frontal region, parietal lobe, temporal neocortex as well as the medial temporal lobe structure) showed gradual augmentation of sigma-oscillations (best shown by a blue arrowhead in [E]) with a waxing and waning pattern. [F] – [I] show z-score maps (standard deviation score maps) of ECoG spectral amplitudes.
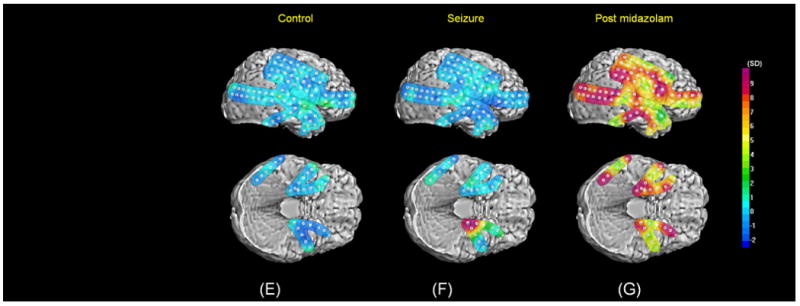
Figure 2. ECoG frequency alteration induced by a seizure and subsequent administration of midazolam in patient 2.
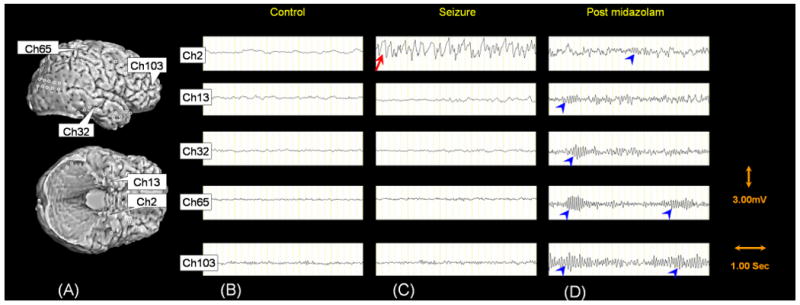
Twenty-six subdural electrodes on the right frontal lobe, 15 electrodes on the right parietal lobe, 46 electrodes on the right temporal lobe (39 on the temporal neocortex and 7 on the medial temporal region), 8 electrodes on the right occipital lobe, and 10 electrodes on the left temporal lobe (4 on the temporal neocortex and 6 on the medial temporal region) were included into further analyses.
An electrographic seizure occurred in the epilepsy monitoring unit, when the patient was asleep. The seizure discharges (denoted by a red arrow in [C]) were characterized by paroxysmal rhythmic discharges involving alpha and sigma bands, followed by rhythmic spike-and-wave discharges arising from the left medial temporal region; the seizure discharge was slowly propagated to the adjacent left temporal lobe region. During this seizure event, the patient did not show clinical changes. Neither tremor nor clonic movement of the body was noted. This seizure was considered as simple partial seizure, since no alteration of consciousness was noted when another electrographic seizure event showing a similar ECoG finding occurred during awake state. An intravenous bolus of midazolam (0.1 mg/kg) was given in order to abort the ongoing electrographic seizure. The seizure discharge lasted 40 seconds. Quantitative assessment of ECoG amplitude spectra showed that the seizure discharge was initially characterized by focal augmentation of alpha- and sigma-amplitudes in the seizure focus followed by amplitude augmentation of widespread frequency bands as the seizure progressed. Following the seizure offset, the non-epileptic brain region distant from the seizure focus showed gradual augmentation of sigma-oscillations (denoted by blue arrowheads in [D]) with a waxing and waning pattern. [E] – [G] show z-score maps (standard deviation score maps) of ECoG spectral amplitudes.
Figure 3. ECoG frequency alteration induced by sedation using midazolam and subsequent general anesthesia induction in patient 3.
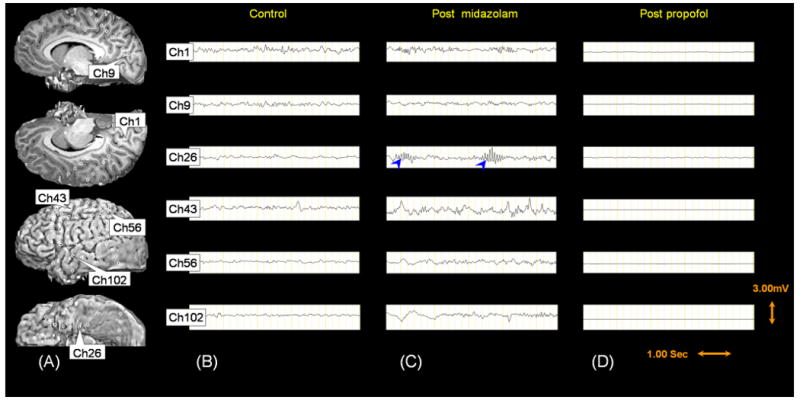

Thirty-seven subdural electrodes on the left frontal lobe (31 on the lateral surface and 6 on the medial surface), 33 electrodes on the left parietal lobe (27 on the lateral surface and 6 on the medial surface), 26 electrodes on the left temporal lobe (20 on the temporal neocortex and 6 on the medial temporal region), 4 electrodes on the left medial occipital region, 7 electrodes on the right medial frontal region, 3 electrodes on the right medial parietal region, 2 electrodes on the right medial occipital region were included into further analyses.
An intravenous bolus of midazolam (0.03 mg/kg) was given in order to provide sedation prior to induction of general anesthesia. Prior to the administration of propofol, significant augmentation of sigma-amplitudes was noted in the left medial temporal region (denoted by blue arrowheads in [C]). Two and a half minutes after administration of midazolam, general anesthesia was induced using an intravenous bolus of propofol (2.5 mg/kg); sweep reduction in the amplitudes of all eight frequency bands was noted in the entire electrode sites. Visual assessment of ECoG recording showed electrical silence lasting for 60 seconds [D]. Subsequently, ECoG recording showed a burst-suppression pattern characterized by waxing and waning of ECoG amplitudes of all frequency bands (see Video S3). [E] – [G] show z-score maps (standard deviation score maps) of ECoG spectral amplitudes.
Patients were subsequently transferred to the epilepsy monitoring unit and extraoperative ECoG was recorded for three to five days using a Nihon Kohden Neurofax 1100A Digital System (Nihon Kohden America Inc, Foothill Ranch, CA, USA) with a sampling frequency at 1,000 Hz and the amplifier band pass at 0.08 to 300 Hz. ECoG signals were re-montaged to an average reference [19-21], and seizure onset zones were visually identified [14]. Following extraoperative ECoG recording, patients 1 and 3 underwent surgical resection of the seizure focus (a portion of the left superior frontal region in both patients). Patient 2 underwent implantation of vagus-nerve stimulator instead of cortical resection, since extraoperative ECoG recording revealed that some epileptic seizures arose from the left hippocampus, whereas other epileptic seizures independently arose from the right hippocampus.
Quantitative measurement of ECoG changes induced by midazolam
ECoG spectral amplitudes for each subdural electrode site were quantitatively measured using a method similar to that reported in previous studies [20,22,23]. Subdural electrodes showing artifacts, depth electrodes, and subdural electrodes overlying another electrode array were excluded from further analyses; a total of 290 subdural electrodes (73 in patient 1, 105 in patient 2 and 112 in patient 3) were included into subsequent analyses. The quantitative ECoG analysis was performed using the BESA® EEG V.5.1.8 software (MEGIS Software GmbH, Gräfelfing, Germany).
A consecutive series of forty 4.10-sec epochs, treated as the “control period” of 164 sec, were placed immediately prior to the seizure onset in patients 1 and 2. Similarly, forty 4.10-sec epochs were placed immediately prior to the preoperative administration of midazolam in patient 3. In addition, 370 and 248 epochs were placed at the period of interest involving ‘seizure onset’, ‘administration of midazolam’, ‘seizure offset’ and ‘postictal period’ in patients 1 and 2, respectively. Similarly, 215 epochs were placed at the period involving ‘administration of midazolam’ and ‘general anesthesia induction’ in patient 3. Placement of further epochs was not tenable due to the prominent movement-related artifacts affecting ECoG signals.
After the placement of consecutive epochs, an amplitude spectrum (x-axis unit: Hz; y-axis unit: μV/Hz) was created for each epoch and each electrode site, using Fast Fourier Transformation. The software subsequently displayed the ECoG spectral amplitude (unit: μV) at each epoch within preset frequency bands, which was calculated as the summation of all frequency components under the amplitude spectral curve within the given frequency band. The frequency bands were preset as follows [20]: 0.5-4.0 Hz (‘delta band’), 4.0-8.0 Hz (‘theta band’), 8.0-12.0 Hz (‘alpha band’), 12-16 Hz (‘sigma band’), 16-32 Hz (‘beta band’), 32-64 Hz (‘low-frequency gamma band’), 64-100 Hz (‘high-frequency gamma band’) and 100-200 Hz (‘very high-frequency gamma band’). The ECoG spectral amplitude of 32-64 Hz was calculated without a 58-62 Hz component, if visual inspection revealed a 60 Hz artifact peak on the amplitude spectral curve for all subdural electrodes; similarly, the spectral amplitude at 100-200 Hz was calculated without components at 118-122 Hz and 178-182 Hz, as needed [20].
Statistical assessment and in-vivo animation of ECoG spectral amplitudes
The mean and standard deviation of ECoG spectral amplitudes during the control period were calculated for each electrode site and for ‘delta’, ‘theta’, ‘alpha’, ‘sigma’, ‘beta’, ‘low-frequency gamma’, ‘high-frequency gamma’ and ‘very high-frequency gamma’ bands. Subsequently, a z-score (also known as standard deviation score) of ECoG spectral amplitude was computed for each frequency band, each electrode site and each epoch following the control period. In order to animate ‘when’, ‘where’ and ‘how much’ ECoG spectral amplitudes were altered, z-scores of ECoG spectral amplitude for each frequency band were sequentially animated on the individual three-dimensional MRI, as previously described [24,25]. In short, each ECoG measure (represented by a z-score) was registered into the SurGe Interpolation Software 1.2 (Web site: http://mujweb.cz/www/SurGe/surgemain.htm), and the interpolated topography map of each ECoG measure was accurately superimposed to the individual three-dimensional MRI. Finally, all interpolated topography maps were sequentially registered to the Microsoft Windows Movie Maker 5.1 (Microsoft Corporation, Redmond, WA, USA), and this procedure yielded a movie file showing sequential alteration of each ECoG measure.
In the present study, alteration of ECoG spectral amplitude at a given channel at a given epoch was expressed using a z-score. We recognized that we should consider and minimize the risk of Type I error in the repeated measurements of ECoG spectral amplitudes across eight frequency bands, 73 - 112 sites and 215 - 370 epochs. For example, patient 1 had a total of 213,120 repeated measurements of ECoG spectral amplitudes during the period of interest. Thereby, the risk of Type I error occurring at least in a frequency band at a channel at an epoch was 0.12 if |z-score| above 5 was defined as significance threshold. On the other hand, the risk of Type I error was 0.0004 if |z-score| above 6 was defined as significance threshold. |Z-score| above 6 was previously used as significance threshold in previous clinical studies [26]. The maxima and minima of z-scores for all frequency bands during the period of interest were presented in Tables 2 and 3.
Table 2. ECoG spectral amplitude alteration induced by an epileptic seizure.
| (A) Maximal Augmentation of ECoG Spectral Amplitude during the Epileptic Seizure. | |||||||||||
|---|---|---|---|---|---|---|---|---|---|---|---|
| Frequency Band | Delta | Theta | Alpha | Sigma | Beta | Low-Frequency Gamma | High-Frequency Gamma | Very-High-Frequency Gamma | |||
| Patient #1 | Left Frontal Neocortex (the seizure focus) | 44.5 | 125.4 | 293.9 | 196.2 | 135.6 | 69.2 | 51.1 | 74.2 | ||
| Left Frontal Neocortex (the nonepileptic cortex surrounding the focus) | 16.2 | 9.2 | 18.8 | 11.0 | 27.3 | 26.9 | 9.1 | 10.1 | |||
| Left Parietal Neocortex | 5.3 | 3.0 | 4.4 | 8.0 | 6.6 | 2.9 | 10.0 | 9.1 | |||
| Left Temporal Neocortex | 6.1 | 7.5 | 6.2 | 7.2 | 6.9 | 4.3 | 3.0 | 3.8 | |||
| Left Medial Temporal Region | 4.1 | 5.2 | 3.6 | 5.5 | 2.5 | 2.5 | 2.5 | 1.5 | |||
| Patient #2 | Right Frontal Neocortex | 0.9 | 1.4 | 2.3 | 2.8 | 1.5 | 1.1 | 0.7 | 0.7 | ||
| Right Parietal Neocortex | 2.3 | 0.5 | 1.6 | 2.9 | 1.4 | 1.4 | 1.3 | 1.6 | |||
| Right Temporal Neocortex | 1.1 | 1.0 | 2.2 | 2.2 | 1.1 | 1.5 | 0.5 | 0.6 | |||
| Right Medial Temporal Region | 1.5 | 2.1 | 2.0 | 3.1 | 0.8 | 0.4 | 1.3 | 2.0 | |||
| Left Medial Temporal Region | 5.1 | 10.2 | 7.3 | 11.0 | 12.0 | 11.7 | 4.0 | 6.1 | |||
| (B) Maximal Attenuation of ECoG Spectral Amplitude during the Epileptic Seizure. | |||||||||||
| Patient #1 | Left Frontal Neocortex (the seizure focus) | -1.2 | -0.1 | 0.2 | -0.2 | 0.7 | 1.3 | -1.4 | -1.7 | ||
| Left Frontal Neocortex (the nonepileptic cortex surrounding the focus) | -1.4 | -1.3 | -2.5 | -1.3 | -1.3 | -2.4 | -2.3 | -2.2 | |||
| Left Parietal Neocortex | -0.4 | -0.8 | -0.6 | -0.5 | -0.4 | -0.7 | -3.0 | -2.4 | |||
| Left Temporal Neocortex | -1.5 | -1.5 | -1.5 | -2.4 | -1.2 | -2.4 | -1.3 | -1.3 | |||
| Left Medial Temporal Region | -1.6 | -1.2 | -1.4 | -1.8 | -3.2 | -1.8 | -2.8 | -2.7 | |||
| Patient #2 | Right Frontal Neocortex | -0.5 | -1.2 | -0.8 | -1.1 | -1.8 | -1.2 | -1.7 | -1.1 | ||
| Right Parietal Neocortex | -1.2 | -1.0 | -0.7 | -0.7 | -0.8 | -0.9 | -1.2 | -1.2 | |||
| Right Temporal Neocortex | -1.2 | -1.2 | -1.6 | -1.2 | -1.4 | -1.7 | -1.7 | -1.4 | |||
| Right Medial Temporal Region | -0.9 | -1.4 | -2.7 | -1.3 | -1.6 | -0.9 | -1.3 | -1.6 | |||
| Left Medial Temporal Region | -1.9 | 1.0 | -0.3 | -0.2 | -0.7 | -1.4 | -1.1 | -1.2 | |||
The maximum z-score for each frequency band and each lobe during the period between the seizure onset and offset is described. Patient 1 had the seizure focus in the left superior frontal region and augmentation of ECoG spectral amplitudes in all eight freqeuncy bands (0.5 – 200 Hz) was noted in the seizure focus during the active seizure period. Patient 2 had a seizure arising from the left medial temporal region; augmentation of ECoG spectral amplitudes in six freqeuncy bands involving 4 – 64 Hz and 100 – 200 Hz was noted in the seizure focus during the active seizure period.
The minimum z-score for each frequency band and each lobe during the period between the seizure onset and offset is described. Neither patient 1 nor patient 2 had a z-score smaller than -6 in any electrode site or frequency band during the active seizure period.
Table 3. ECoG spectral amplitude alteration induced by intravenous administration of midazolam.
| (A) Maximal Augmentation of ECoG Spectral Amplitude following the Administration of Midazolam | ||||||||||
|---|---|---|---|---|---|---|---|---|---|---|
| Frequency Band | Delta | Theta | Alpha | Sigma | Beta | Low-Frequency Gamma | High-Frequency Gamma | Very-High-Frequency Gamma | ||
| Patient #1 | Left Frontal Neocortex (the seizure focus) | 25.6 | 5.4 | 10.0 | 10.3 | 0.2 | -1.3 | -2.2 | -3.0 | |
| Left Frontal Neocortex (the non-epileptic cortex surrounding the focus) | 2.5 | 0.3 | 5.4 | 7.1 | 12.7 | 9.2 | 4.6 | 1.9 | ||
| Left Parietal Neocortex | 7.1 | 3.2 | 4.9 | 18.3 | 15.3 | 25.6 | 20.2 | 12.7 | ||
| Left Temporal Neocortex | 6.1 | 0.8 | 1.5 | 7.3 | 10.9 | 8.1 | 4.9 | 2.5 | ||
| Left Medial Temporal Region | 8.7 | 2.5 | 2.6 | 18.1 | 5.9 | 3.3 | -1.3 | -1.2 | ||
| Patient #2 | Right Frontal Neocortex | 7.8 | 7.7 | 9.0 | 14.3 | 8.7 | 7.8 | 3.8 | 2.5 | |
| Right Parietal Neocortex | 3.7 | 4.0 | 6.1 | 16.4 | 8.8 | 15.4 | 11.8 | 8.1 | ||
| Right Temporal Neocortex | 15.0 | 2.4 | 4.2 | 13.8 | 10.6 | 7.1 | 5.3 | 6.3 | ||
| Right Medial Temporal Region | 5.6 | 6.9 | 6.1 | 10.4 | 7.8 | 7.9 | 6.9 | 14.0 | ||
| Left Medial Temporal Region | 3.8 | 8.9 | 8.2 | 11.2 | 12.1 | 7.9 | 3.7 | 4.7 | ||
| Patient #3 | Left Frontal Neocortex | 3.7 | 2.9 | 2.9 | 4.8 | 5.3 | 2.4 | 2.3 | 3.5 | |
| Left Parietal Neocortex | 2.0 | 2.3 | 4.4 | 4.5 | 4.9 | 5.7 | 5.8 | 5.7 | ||
| Left Temporal Neocortex | 5.8 | 2.2 | 3.9 | 5.1 | 6.6 | 5.8 | 5.0 | 4.8 | ||
| Left Medial Temporal Region | 6.7 | 2.3 | 7.4 | 22.0 | 16.6 | 8.8 | 1.5 | 2.1 | ||
| Left Occipital Neocortex | 1.9 | 2.9 | 2.4 | 2.5 | 2.4 | 2.2 | 2.6 | 2.3 | ||
| Right Occipital Neocortex | 4.6 | 2.2 | 0.1 | 1.9 | 2.5 | 4.6 | 2.7 | 2.6 | ||
| (B) Maximal Attenuation of ECoG Spectral Amplitude following the Administration of Midazolam | ||||||||||
| Patient #1 | Left Frontal Neocortex (the seizure focus) | -2.5 | -2.7 | -3.9 | -2.4 | -4.0 | -6.8 | -5.1 | -8.0 | |
| Left Frontal Neocortex (the non-epileptic cortex surrounding the focus) | -1.7 | -2.3 | -3.3 | -1.9 | 1.6 | -0.7 | -1.7 | -2.2 | ||
| Left Parietal Neocortex | -1.9 | -2.4 | -3.5 | -1.9 | -0.8 | -0.2 | -3.1 | -5.5 | ||
| Left Temporal Neocortex | -1.7 | -3.8 | -3.0 | -2.6 | 0.7 | 0.6 | -1.2 | -1.8 | ||
| Left Medial Temporal Region | -2.3 | -1.2 | -1.1 | -1.1 | -0.8 | -1.6 | -3.8 | -4.0 | ||
| Patient #2 | Right Frontal Neocortex | -1.2 | -1.4 | -1.6 | -1.4 | -2.1 | -1.7 | -2.2 | -2.6 | |
| Right Parietal Neocortex | -1.9 | -1.8 | -1.3 | -1.2 | -1.2 | -1.5 | -1.5 | -1.5 | ||
| Right Temporal Neocortex | -1.4 | -2.3 | -2.2 | -1.9 | -2.6 | -1.9 | -2.0 | -0.6 | ||
| Right Medial Temporal Region | -2.5 | -2.8 | -2.9 | -1.4 | -1.6 | -3.2 | -4.3 | -0.6 | ||
| Left Medial Temporal Region | -2.6 | -1.6 | -1.4 | -1.5 | -1.5 | -1.6 | -1.4 | -0.6 | ||
| Patient #3 | Left Frontal Neocortex | -2.1 | -3.0 | -3.9 | -4.3 | -5.6 | -10.3 | -6.8 | -11.0 | |
| Left Parietal Neocortex | -2.8 | -3.1 | -3.5 | -4.4 | -4.9 | -4.0 | -2.3 | -1.7 | ||
| Left Temporal Neocortex | -2.1 | -3.3 | -3.8 | -4.1 | -6.5 | -1.8 | -2.6 | -1.6 | ||
| Left Medial Temporal Region | -3.3 | -4.7 | -3.3 | -4.2 | -8.1 | -11.9 | -6.8 | -6.0 | ||
| Left Occipital Neocortex | -4.2 | -4.8 | -4.3 | -4.1 | -5.3 | -3.3 | -2.5 | -2.6 | ||
| Right Occipital Neocortex | -3.7 | -5.6 | -4.0 | -4.6 | -4.8 | -5.1 | -3.0 | -2.7 | ||
The maximum z-score for each frequency band and each lobe during the period following administration of midazolam is described. Neither measures derived from the period prior to the seizure offset nor the period following administration of propofol is included in this table. All three subjects had augmentation of sigma amplitudes (represented as a z-score greater than 6) in the medial temporal region following intravenous administration of midazolam. Such augmentation of sigma amplitudes was noted not only in the medial temporal region but also in the some neocortical sites in patients 1 and 2.
The minimum z-score for each frequency band and each lobe during the period following administration of midazolam is described. Neither measures derived from the period prior to the seizure offset nor the period following administration of propofol is included in this table.
We specifically determined whether augmentation of sigma-oscillations was induced in the medial temporal region following intravenous administration of midazolam in patients 1 and 2 (Table 3). The assessed sites included: the left medial temporal region which was free from ongoing ictal discharges when midazolam was given in patient 1 and the right medial temporal region also free from ongoing ictal discharges in patient 2. We also determined whether sigma-augmentation was induced by midazolam in the medial temporal region during the 2.5-minute period following intravenous administration of midazolam but before intravenous administration of propofol in patient 3. Table 3 summarizes spectral amplitude changes induced by midazolam but not those induced by a mixed effect of midazolam and propofol.
Results
In all subjects, ECoG signals were satisfactorily obtained, not being contaminated with myographic artifacts associated with facial movement. In patient 3, the intubation procedure did not induce signal artifacts on ECoG recording, but the subsequent scalp preparation induced prominent movement-related signal artifacts, which made further quantitative ECoG analysis impossible. Individual ECoG changes are described in Figures 1, 2 and 3 as well as Tables 2 and 3 in detail. The sequential changes of ECoG spectral amplitudes are delineated in animation movies (Video S1, S2 and S3 [supplementary files on the website]).
ECoG changes associated with a seizure and subsequent i.v. midazolam (patients 1 and 2)
Epileptic seizures were characterized by sustained rhythmic ECoG activity with focal onset and the rhythmic discharges gradually building up in amplitude and slowly propagated to areas adjacent to the seizure focus. Significant and sustained increase in the amplitudes of wide frequency bands (Table 2A) was noted in the seizure focus during the active seizure period (Figures 1 and 2). Neither patient 1 nor patient 2 apparently showed clinical changes associated with the seizure discharges on ECoG. To abort ongoing seizures and prevent subsequent secondarily generalized tonic-clonic convulsion, intravenous boluses of midazolam were given to subjects (0.1 mg/kg twice for patient 1; 0.1 mg/kg once for patient 2), and the seizure discharge subsequently subsided. By two minutes following the seizure offset, on the other hand, gradual and prominent augmentation of sigma amplitudes (Table 3A) was noted with a waxing and waning pattern in the widespread non-epileptic regions including the medial temporal region (Figures 1 and 2; Videos S1 and S2).
ECoG changes associated with i.v. midazolam and propofol (patient 3)
An intravenous bolus of midazolam (0.03 mg/kg) was given to patient 3 in the operation room, to provide sedation prior to induction of general anesthesia. By ninety seconds following administration of midazolam (i.e.: prior to administration of propofol), significant augmentation of sigma-amplitudes was noted in the medial temporal region (Table 3A). Two and a half minutes after administration of midazolam, general anesthesia was induced using an intravenous bolus of propofol (2.5 mg/kg); sweep reduction in the amplitudes of all eight frequency bands was noted in the entire electrode sites. Visual assessment of ECoG recording showed diffuse suppression lasting for 1 minute (Figure 3; Video S3). Subsequently, ECoG recording showed a burst-suppression pattern characterized by alternating augmentation and suppression of ECoG amplitudes of all eight frequency bands.
Midazolam-induced augmentation of sigma-oscillations in the medial temporal region
The common midazolam-induced ECoG changes included significant augmentation of sigma-amplitudes in the medial temporal region (Table 3A). The medial temporal regions on both hemispheres showed sigma-augmentation in patient 2, in whom the specific site of interest was the right medial temporal region, which was apparently free from ongoing seizure discharges when midazolam was given. The maximum z-score of sigma-amplitudes in the medial temporal region was 16.8 on average across the three subjects (standard deviation: 5.9).
Discussion
The major findings in the present study can be summarized in the following points. i) In-vivo animation of ECoG spectral measures satisfactorily delineated the dynamic change of neuronal activity in the deeply-situated brain regions including the medial temporal region. ii) Midazolam-induced sigma-augmentation did exist in the medial temporal region in our small cohort of human subjects.
Significance of midazolam-induced sigma-augmentation in the medial temporal region
Studies of human subjects with focal epilepsy have reported that sigma-range activity is a major portion of visually-prominent neuronal activities generated by the medial temporal region during interictal states [11,14,15]. Here, the present study demonstrated that such sigma-oscillations were augmented following intravenous administration of midazolam. How can we interpret this observation? Since limitations in our study included the small sample size, our observations should be interpreted with a caution. According to the results of present ECoG study and previous scalp EEG studies [2,6], we speculate that midazolam-induced sigma-augmentation involve not only the medial temporal region but also widespread neocortical areas. Plausible hypotheses for midazolam-induced sigma-augmentation include that sigma-oscillations represent an idling rhythm and that the amplitude of sigma-oscillations reflects a level of cortical inhibition [2]. This hypothesis is consistent with the observations in previous PET studies that intravenous administration of midazolam induced decreased consciousness along with reduction of cerebral blood flow in the medial temporal region in addition to other neocortical areas [4,5]. Further studies are required to determine whether midazolam-induced alteration of medial temporal sigma-oscillations are dose-dependent and how such ECoG measures are associated with cognitive and behavioral measures such as amnesia, sedation and memory problems.
Sigma-oscillations in the medial temporal region may be of physiological rather than epileptogenic nature
Previous human studies of adults and children using intracranial ECoG recording reported that sigma-range oscillations showing a waxing and waning pattern can be seen in the medial temporal region such as the hippocampus and parahippocampal gyrus [9,11,12,14]. Such sigma-oscillations in the hippocampus are often called “hippocampal spindles”; some investigators believed that such spindles represent a physiological activity [11,14], whereas others suspected that sigma-oscillations in the medial temporal region possibly represent an epileptogenic activity triggering epileptic seizures [9,12]. The present study showed that intravenous administration of an antiepileptic agent, midazolam, elicited augmentation of sigma-oscillations in the medial temporal region in all three subjects (Figures 1, 2 and 3); this observation supports the hypothesis that sigma-oscillations in the medial temporal region may be of physiological rather than epileptogenic nature. If the medial temporal sigma-oscillations are of epileptogenic nature, such sigma-oscillations may become attenuated rather than augmented, following administration of midazolam.
Methodological issues
Intracranial ECoG changes induced by sedative or anesthetic agents have been understudied. Potential methodological limitations of such analysis should be discussed. One of the major limitations of ECoG recording is sampling error. ECoG analysis was limited to the brain region where subdural electrodes were placed [27]. In the present study, subdural electrodes were placed only in the presumed epileptogenic hemisphere in one subject; we were not able to evaluate ECoG amplitudes in the majority of contralateral cortices.
Another limitation of ECoG recording is that healthy human brains cannot be investigated. In the present study, all three subjects had a diagnosis of focal epilepsy, and midazolam was intravenously given due to a clinical reason. The present study excluded ECoG recordings in case midazolam was given when a seizure had already evolved into complex partial or secondarily generalized types, in order to prevent ongoing seizure discharges from masking the effect of midazolam on the relatively healthy brain regions.
Previous studies using scalp EEG recording have shown that chronic usage of antiepileptic drugs can produce persistent and diffuse augmentation of sigma and beta activities (reviewed in [28]). In the present study, all three subjects had been chronically treated with oral antiepileptic drugs. Considerable inter-individual difference in the magnitude of midazolam-induced sigma-oscillations could be partially attributed to chronic treatment using different antiepileptic drugs. The epileptogenic zone may have an abnormal baseline amplitude of sigma-oscillations, and a long duration of epilepsy itself may have altered sigma-oscillations globally in some patients. In patient 2, whose epileptogenic zones involved both medial temporal lobes, the ECoG response to midazolam could have been abnormal in these areas. Furthermore, recorded ECoG waveforms may be altered by the specifications of subdural electrodes (such as size and material) [29]. Nevertheless, quantitative assessment of ECoG signals in the present study delineated significant changes in sigma amplitudes between the control period and the period following the administration of midazolam.
In the present study, an amplitude spectrum was created as a summary measure for each 4.10-sec epoch, assuming that ECoG frequency remains stationary within each epoch [20,22,23]. Thus, the results of spectral measures in the present study should be interpreted with a caution preferably together with raw ECoG traces. Non-stationary ECoG changes may be better appreciated by visual assessment of raw ECoG traces.
Supplementary Material
An electrographic seizure was associated with augmentation of widespread frequency bands (including the sigma band) in the left superior frontal region. Augmentation of low-frequency (32 – 64 Hz), high-frequency (64 – 100 Hz) and very high-frequency gamma-oscillations (100 – 200 Hz) was noted in the presumed seizure focus in the left superior frontal gyrus. The seizure offset was associated with subsidence of such amplitude augmentation in the left superior frontal region. Following administration of midazolam, gradual sigma-augmentation was noted in the widespread region (including the medial temporal lobe structures) with a waxing and waning pattern. SD: standard deviation score also known as z-score.
An electrographic seizure was associated with augmentation of widespread frequency bands in the left medial temporal lobe region. The seizure offset was associated with subsidence of such amplitude augmentation in the left medial temporal lobe region. Following administration of midazolam, gradual sigma-augmentation was noted in the widespread region (including both medial temporal lobe structures) with a waxing and waning pattern. SD: standard deviation score also known as z-score.
An intravenous bolus of midazolam (0.03 mg/kg) was given in order to provide sedation before induction of general anesthesia. Prior to the administration of propofol, significant sigma-augmentation was noted in the left medial temporal region. Following the initiation of intravenous propofol administration, sweep reduction in the all amplitudes was noted in the entire electrode sites. Subsequently, ECoG recording showed a burst-suppression pattern characterized by waxing and waning of ECoG amplitudes of all frequency bands. SD: standard deviation score also known as z-score.
Acknowledgments
This work was supported by NIH grant NS47550 (to E. Asano). We are grateful to Chika Kuzumi, M.D. in the Department of Anesthesia at Children's Hospital of Michigan and Erik Brown, B.S.E.E. in the Wayne State University for the collaboration and assistance in performing the studies described above.
Footnotes
Publisher's Disclaimer: This is a PDF file of an unedited manuscript that has been accepted for publication. As a service to our customers we are providing this early version of the manuscript. The manuscript will undergo copyediting, typesetting, and review of the resulting proof before it is published in its final citable form. Please note that during the production process errors may be discovered which could affect the content, and all legal disclaimers that apply to the journal pertain.
References
- 1.Reitan JA, Porter W, Braunstein M. Comparison of psychomotor skills and amnesia after induction of anesthesia with midazolam or thiopental. Anesth Analg. 1986;65:933–937. [PubMed] [Google Scholar]
- 2.Veselis RA, Reinsel R, Alagesan R, Heino R, Bedford RF. The EEG as a monitor of midazolam amnesia: changes in power and topography as a function of amnesic state. Anesthesiology. 1991;74:866–874. doi: 10.1097/00000542-199105000-00011. [DOI] [PubMed] [Google Scholar]
- 3.Kain ZN, Hofstadter MB, Mayes LC, Krivutza DM, Alexander G, Wang SM, Reznick JS. Midazolam: effects on amnesia and anxiety in children. Anesthesiology. 2000;93:676–684. doi: 10.1097/00000542-200009000-00016. [DOI] [PubMed] [Google Scholar]
- 4.Veselis RA, Reinsel RA, Beattie BJ, Mawlawi OR, Feshchenko VA, DiResta GR, Larson SM, Blasberg RG. Midazolam changes cerebral blood flow in discrete brain regions: an H2(15)O positron emission tomography study. Anesthesiology. 1997;87:1106–1117. doi: 10.1097/00000542-199711000-00015. [DOI] [PubMed] [Google Scholar]
- 5.Reinsel RA, Veselis RA, Dnistrian AM, Feshchenko VA, Beattie BJ, Duff MR. Midazolam decreases cerebral blood flow in the left prefrontal cortex in a dose-dependent fashion. Int J Neuropsychopharmacol. 2000;3:117–127. doi: 10.1017/S1461145700001814. [DOI] [PubMed] [Google Scholar]
- 6.Breimer LT, Hennis PJ, Burm AG, Danhof M, Bovill JG, Spierdijk J, Vletter AA. Quantification of the EEG effect of midazolam by aperiodic analysis in volunteers. Pharmacokinetic/pharmacodynamic modelling. Clin Pharmacokinet. 1990;18:245–253. doi: 10.2165/00003088-199018030-00006. [DOI] [PubMed] [Google Scholar]
- 7.Alkire MT, Gruver R, Miller J, McReynolds JR, Hahn EL, Cahill L. Neuroimaging analysis of an anesthetic gas that blocks human emotional memory. Proc Natl Acad Sci U S A. 2008;105:1722–1727. doi: 10.1073/pnas.0711651105. [DOI] [PMC free article] [PubMed] [Google Scholar]
- 8.Bakker A, Kirwan CB, Miller M, Stark CE. Pattern separation in the human hippocampal CA3 and dentate gyrus. Science. 2008;319:1640–1642. doi: 10.1126/science.1152882. [DOI] [PMC free article] [PubMed] [Google Scholar]
- 9.Montplaisir J, Leduc L, Laverdière M, Walsh J, Saint-Hilaire JM. Sleep spindles in the human hippocampus: normal or epileptic activity? Sleep. 1981;4:423–428. doi: 10.1093/sleep/4.4.423. [DOI] [PubMed] [Google Scholar]
- 10.Gross DW, Gotman J. Correlation of high-frequency oscillations with the sleep-wake cycle and cognitive activity in humans. Neuroscience. 1999;94:1005–1018. doi: 10.1016/s0306-4522(99)00343-7. [DOI] [PubMed] [Google Scholar]
- 11.Malow BA, Carney PR, Kushwaha R, Bowes RJ. Hippocampal sleep spindles revisited: physiologic or epileptic activity? Clin Neurophysiol. 1999;110:687–693. doi: 10.1016/s1388-2457(99)00008-5. [DOI] [PubMed] [Google Scholar]
- 12.Nakabayashi T, Uchida S, Maehara T, Hirai N, Nakamura M, Arakaki H, Shimisu H, Okubo Y. Absence of sleep spindles in human medial and basal temporal lobes. Psychiatry Clin Neurosci. 2001;55:57–65. doi: 10.1046/j.1440-1819.2001.00785.x. [DOI] [PubMed] [Google Scholar]
- 13.Clemens Z, Mölle M, Eross L, Barsi P, Halász P, Born J. Temporal coupling of parahippocampal ripples, sleep spindles and slow oscillations in humans. Brain. 2007;130:2868–2878. doi: 10.1093/brain/awm146. [DOI] [PubMed] [Google Scholar]
- 14.Asano E, Mihaylova T, Juhász C, Sood S, Chugani HT. Effect of sleep on interictal spikes and distribution of sleep spindles on electrocorticography in children with focal epilepsy. Clin Neurophysiol. 2007;118:1360–1368. doi: 10.1016/j.clinph.2007.02.021. [DOI] [PMC free article] [PubMed] [Google Scholar]
- 15.Moroni F, Nobili L, Curcio G, De Carli F, Tempesta D, Marzano C, De Gennaro L, Mai R, Francione S, Lo Russo G, Ferrara M. Procedural learning and sleep hippocampal low frequencies in humans. Neuroimage. 2008;42:911–918. doi: 10.1016/j.neuroimage.2008.05.027. [DOI] [PubMed] [Google Scholar]
- 16.von Stockhausen HM, Theil A, Herholz K, Pietrzyk U. A convenient method for topographical localization of intracranial electrodes with MRI and a conventional radiograph. Neuroimage. 1997;5:S514. Abstract. [Google Scholar]
- 17.Muzik O, Chugani DC, Zou G, Hua J, Lu Y, Lu S, Asano E, Chugani HT. Multimodality Data Integration in Epilepsy. Int J Biomed Imaging. 2007 doi: 10.1155/2007/13963. [DOI] [PMC free article] [PubMed] [Google Scholar]
- 18.Nishida M, Asano E, Juhász C, Muzik O, Sood S, Chugani HT. Cortical glucose metabolism correlates negatively with delta-slowing and spike-frequency in epilepsy associated with tuberous sclerosis. Hum Brain Mapp. 2008;29:1255–1264. doi: 10.1002/hbm.20461. [DOI] [PMC free article] [PubMed] [Google Scholar]
- 19.Crone NE, Boatman D, Gordon B, Hao L. Induced electrocorticographic gamma activity during auditory perception. Brazier Award-winning article, 2001. Clin Neurophysiol. 2001;112:565–582. doi: 10.1016/s1388-2457(00)00545-9. [DOI] [PubMed] [Google Scholar]
- 20.Nishida M, Juhász C, Sood S, Chugani HT, Asano E. Cortical glucose metabolism positively correlates with gamma-oscillations in nonlesional focal epilepsy. Neuroimage. 2008;42:1275–1284. doi: 10.1016/j.neuroimage.2008.06.027. [DOI] [PMC free article] [PubMed] [Google Scholar]
- 21.Asano E, Nishida M, Fukuda M, Rothermel R, Juhász C, Sood S. Differential visually-induced gamma-oscillations in human cerebral cortex. Neuroimage. 2009;45:477–489. doi: 10.1016/j.neuroimage.2008.12.003. [DOI] [PMC free article] [PubMed] [Google Scholar]
- 22.Gotman J, Levtova V, Farine B. Graphic representation of the EEG during epileptic seizures. Electroencephalogr Clin Neurophysiol. 1993;87:206–214. doi: 10.1016/0013-4694(93)90020-v. [DOI] [PubMed] [Google Scholar]
- 23.Asano E, Muzik O, Shah A, Juhász C, Chugani DC, Kagawa K, Benedek K, Sood S, Gotman J, Chugani HT. Quantitative visualization of ictal subdural EEG changes in children with neocortical focal seizures. Clin Neurophysiol. 2004;115:2718–2727. doi: 10.1016/j.clinph.2004.06.020. [DOI] [PMC free article] [PubMed] [Google Scholar]
- 24.Brown EC, Rothermel R, Nishida M, Juhász C, Muzik O, Hoechstetter K, Sood S, Chugani HT, Asano E. In-vivo animation of auditory-language-induced gamma-oscillations in children with intractable focal epilepsy. Neuroimage. 2008;41:1120–1131. doi: 10.1016/j.neuroimage.2008.03.011. [DOI] [PMC free article] [PubMed] [Google Scholar]
- 25.Fukuda M, Nishida M, Juhasz C, Muzik O, Sood S, Chugani HT, Asano E. Short-latency median-nerve somatosensory-evoked potentials and induced gamma-oscillations in humans. Brain. 2008;131:1793–1805. doi: 10.1093/brain/awn100. [DOI] [PMC free article] [PubMed] [Google Scholar]
- 26.Swamy GK, Ostbye T, Skjaerven R. Association of preterm birth with long-term survival, reproduction, and next-generation preterm birth. JAMA. 2008;299:1429–1436. doi: 10.1001/jama.299.12.1429. [DOI] [PubMed] [Google Scholar]
- 27.Velly LJ, Rey MF, Bruder NJ, Gouvitsos FA, Witjas T, Regis JM, Peragut JC, Gouin FM. Differential dynamic of action on cortical and subcortical structures of anesthetic agents during induction of anesthesia. Anesthesiology. 2007;107:202–212. doi: 10.1097/01.anes.0000270734.99298.b4. [DOI] [PubMed] [Google Scholar]
- 28.Blume WT. Drug effects on EEG. J Clin Neurophysiol. 2006;23:306–311. doi: 10.1097/01.wnp.0000229137.94384.fa. [DOI] [PubMed] [Google Scholar]
- 29.Litt B, Cranstoun SD. Engineering principles. In: Ebersole JS, Pedley TA, editors. Current practice of clinical electroencephalography. Philadelphia: Lippincott Williams and Wilkins; 2003. pp. 32–71. [Google Scholar]
Associated Data
This section collects any data citations, data availability statements, or supplementary materials included in this article.
Supplementary Materials
An electrographic seizure was associated with augmentation of widespread frequency bands (including the sigma band) in the left superior frontal region. Augmentation of low-frequency (32 – 64 Hz), high-frequency (64 – 100 Hz) and very high-frequency gamma-oscillations (100 – 200 Hz) was noted in the presumed seizure focus in the left superior frontal gyrus. The seizure offset was associated with subsidence of such amplitude augmentation in the left superior frontal region. Following administration of midazolam, gradual sigma-augmentation was noted in the widespread region (including the medial temporal lobe structures) with a waxing and waning pattern. SD: standard deviation score also known as z-score.
An electrographic seizure was associated with augmentation of widespread frequency bands in the left medial temporal lobe region. The seizure offset was associated with subsidence of such amplitude augmentation in the left medial temporal lobe region. Following administration of midazolam, gradual sigma-augmentation was noted in the widespread region (including both medial temporal lobe structures) with a waxing and waning pattern. SD: standard deviation score also known as z-score.
An intravenous bolus of midazolam (0.03 mg/kg) was given in order to provide sedation before induction of general anesthesia. Prior to the administration of propofol, significant sigma-augmentation was noted in the left medial temporal region. Following the initiation of intravenous propofol administration, sweep reduction in the all amplitudes was noted in the entire electrode sites. Subsequently, ECoG recording showed a burst-suppression pattern characterized by waxing and waning of ECoG amplitudes of all frequency bands. SD: standard deviation score also known as z-score.