

Abstract
Aminoglycosides are broad-spectrum antibacterials to which some bacteria have acquired resistance. The most common mode of resistance to aminoglycosides is enzymatic modification of the drug by different classes of enzymes including acetyltransferases (AAC’s). Thus, the modification of aminoglycosides by AAC(2’) from Mycobacterium tuberculosis and AAC(3) from Escherichia coli was studied using aminoglycoside microarrays. Results show that both enzymes modify their substrates displayed on an array surface in a manner that mimics their relative levels of modification in solution. Because aminoglycosides that are modified by resistance-causing enzymes have reduced affinities for binding their therapeutic target, the bacterial rRNA aminoacyl-tRNA site (A-site), arrays were probed for binding to a fluorescently labeled oligonucleotide mimic of the A-site after modification. A decrease in binding was observed when aminoglycosides were modified by AAC(3). In contrast, a decrease in binding of the A-site is not observed when aminoglycosides are modified by AAC(2’). Interestingly, these effects mirror the biological functions of these enzymes: the AAC(3) used in this study is known to confer aminoglycoside resistance while the AAC(2’) is chromosomally encoded and unlikely to play a role in resistance. These studies lay a direct foundation for studying resistance to aminoglycosides and can also have more broad applications in identifying and studying non-aminoglycoside carbohydrates or proteins as substrates for acetyltransferase enzymes.
1. Introduction
Aminoglycoside antibiotics are broad-spectrum antibiotics that are used to treat both Gram-negative and Gram-positive bacterial infections. Streptomycin was the first clinically used aminoglycoside antibiotic. It was introduced in the 1940’s and was one of the first drugs to treat tuberculosis.1 Since that time, aminoglycosides have been prescribed for infections, and as a result an increase in resistant infections has been observed.2,3
The antibacterial activity of aminoglycosides is primarily due to their ability to bind to the aminoacyl-tRNA site (A-site) in bacterial ribosomes, resulting in alteration of A-site dynamics that leads to recognition of non-cognate tRNAs.4-7 Alteration of A-site dynamics caused by aminoglycoside binding has been observed in both crystal structures and in solution with oligonucleotide mimics of the bacterial rRNA A-site and more closely correlates with antibacterial activity than A-site affinity.8-10
Several modes of aminoglycoside resistance have been observed. These include: modification of bacterial rRNA targets to disrupt hydrogen bonding and thus diminish affinity for aminoglycosides,11 altering the composition of the cell membrane to diminish the uptake of the drug, and enzymatic modification.12 Enzymatic modification is the most common cause of resistance to aminoglycosides and results in a significant decrease in affinity (greater than two orders of magnitude) for the bacterial rRNA target.13 A suite of clinically relevant enzymes modify aminoglycosides including members of the acetyltransferase (AAC) class (Figure 1).
Figure 1.

Modification of the aminoglycoside tobramycin by AAC(2’) resistance-causing enzyme from M. tuberculosis or the AAC(3) resistance-causing enzyme from E. coli.
In a previous study, aminoglycoside O-2” nucleotidyltransferase (ANT(2”)) and aminoglycoside O-3’ phosphoryltransferase (APH(3’)) activities were assayed directly on a microarray surface using site-specifically immobilized aminoglycosides.14 The same array was then used to determine the effect of modification on recognition of a fluorescently labeled oligonucleotide mimic of the bacterial rRNA A-site. Herein we describe studies of aminoglycoside modification by two AAC’s and its effect on A-site binding. Aminoglycoside arrays have previously been used to study binding of AAC enzymes, but not enzymatic activity.15,16 Specifically, the AAC(2’) from Mycobacterium tuberculosis, an enzyme whose biological activity is unknown but modifies aminoglycosides, and the AAC(3) from Escherichia coli, an enzyme known to confer resistance to aminoglycosides, were studied by monitoring aminoglycoside modification by the transfer of a radioactive tag from 14C-acetyl coenzyme A (AcCoA) onto the surface. These two enzymes were chosen 1.) because the effect of their modification on A-site binding has not been previously studied; 2.) to determine if clinically relevant enzymes can be distinguished from ones that are not.
2. Experimental
2.1 General
The plasmids encoding the genes for Mycobacterium tuberculosis AAC(2’)-Ic and Escherichia coli AAC(3)-IV were generously provided by Prof. John Blanchard (Department of Biochemistry, Albert Einstein College of Medicine). Nanopure water was used unless otherwise indicated. All chemicals were at least reagent grade and were purchased from Acros or Fluka with the following exceptions: Acetyl-CoA and propargylamine (MP Biochemicals); [14C]Acetyl-CoA (PerkinElmer); DNase I (Promega); SnakeSkin™ dialysis tubing (Pierce Biotechnology); and agarose (Fisher Scientific).
2.2 Expression and isolation of AAC(2’)-Ic from M. tuberculosis
AAC(2’)-Ic was isolated using a modified version of the previously published procedure described by Hegde et al.17 A pET23a plasmid harboring a gene for the AAC(2’)-Ic was transformed into BL21(DE3)pLysS cells and a 1 L culture was grown in LB containing 50 mg/L carbenicillin at 37 °C to an OD600 ~1.0. The culture was cooled at 20 °C for 15 min and then was induced with 0.2 mM isopropyl β-D-1-thiogalactopyranoside (IPTG) and further grown for 8 h at 20 °C. Cells were pelleted by centrifugation (10,000 rpm, 20 min, 4 °C) and resuspended in 25 mL of buffer A (25 mM triethanolamine, pH 7.8, 50 mM NaCl, 1mM EDTA, 1 mM DTT, 1 mM PMSF, 0.2 μg/mL lysozyme, and 1 μg/mL DNase I). The solution was stirred at 4 °C for 20 min and then lysed by sonication while incubating on ice (20 × 5 second bursts with a 9 second wait time between each burst; after a 4 min incubation on ice, the sonication cycle was repeated). Cellular debris was pelleted by centrifugation.
AAC(2’) was selectively precipitated using ammonium sulfate. Solid ammonium sulfate was added to the supernatant to a final concentration of 0.85 M and the solution was stirred for 1 h at 4 °C. The solution was centrifuged (14,000 rpm, 1 h, 4 °C) and the pellet was discarded. Solid ammonium sulfate was added to a final concentration of 1.6 M to the supernatant, and the solution was stirred for 2 h at 4 °C. AAC(2’) was pelleted by centrifugation (14,000 rpm, 1 h, 4 °C). The supernatant was discarded and the pellet was resuspended in a minimal amount of buffer B (25 mM triethanolamine, pH 7.8, 1 mM DTT, 1 mM EDTA, 50 mM NaCl, and 0.5 M (NH4)2SO4). The sample was then dialyzed against buffer B overnight at 4 °C (3,500 MWCO). The protein was concentrated using Sartorius Vivaspin ultrafiltration tubes (10,000 MWCO, polyethersulfone membrane), and stored at -20 °C after glycerol was added to a final concentration of 50%.
The purity of the protein was assessed by SDS-PAGE and determined to be ~30%. Total protein concentration was determined using a Micro BCA Protein Assay Kit (Pierce Biotechnology). Enzymatic activity was confirmed using a phosphocellulose assay as described.18 Spectrophotometric assays were completed to determine the KM and kcat of this enzyme preparation, and the values were similar to those previously reported.17
2.3 Expression and isolation of AAC(3)-IV
AAC(3)-IV was isolated using a modified version of the procedure described by Magalhaes and Blanchard19 as detailed below. A pET23a plasmid harboring a gene for the AAC(3)-IV protein was transformed into E. coli BL21(DE3)pLysS. A single colony was used to inoculate 1 L of LB media containing 50 mg/L carbenicillin. The culture was grown for 24 h at 37 °C. Cells were pelleted by centrifugation (10,000 rpm, 20 min, 4 °C) and were resuspended in 25 mL of 20 mM triethanolamine•HCl, pH 7.8, containing 1 mM PMSF. Cells were lysed by sonication as described above. After sonication, 50 units of DNase I was added and the mixture was stirred on ice for 30 min. Cellular debris was pelleted by centrifugation (8000 rpm, 1 h, 4 °C), and the supernatant was dialyzed (3,500 MWCO) overnight at 4 °C into 20 mM triethanolamine•HCl, pH 7.8.
The protein mixture was concentrated using a Sartorius Vivaspin concentration device (10,000 MWCO, polyethersulfone membrane). Glycerol was added to a final concentration of 50%, and the protein was stored at -20 °C. The molecular weight of ~28 kDa was confirmed via SDS-PAGE, and its purity was estimated to be > 90%. Protein concentration was determined using a Micro BCA Protein Assay Kit. Enzymatic activity was confirmed using a phosphocellulose assay as described.18 Spectrophotometric assays were also completed to determine the KM and kcat of this enzyme preparation, and the values were similar to those previously reported.19
2.4 Preparation of alkyne-displaying agarose slides
Silane prep glass microscope slides (Sigma-Aldrich) were prepared as previously described20 with one modification—100 mg of NaCNBH3 was used in the reduction step instead of 300 mg.
2.5 Immobilization of azido-aminoglycosides onto the slide surface
Azido-aminoglycosides were synthesized as previously described.14,20 Spotting solutions consisted of 10 mM Tris-HCl, pH 8.5, 100 μM TBTA21 dissolved in 4:1 butanol:DMSO, 1 mM CuSO4, 100 μM ascorbic acid, 10% glycerol, and serially diluted concentrations of the azido-aminoglycoside.22 The concentrations of aminoglycoside in the spotting solution for the AAC(2’) microarrays were 5 mM, 1.67 mM, 0.556 mM, 0.185 mM, and 0 mM. For the AAC(3) microarrays, the concentrations of aminoglycoside in the spotting solutions were: 5 mM, 1 mM, 0.2 mM, 0.04 mM, and 0 mM.
Slides were equipped with a silicon gasket that has two blocks to allow separation of the AAC modification reaction and the blank lysate that serves as a negative control. After the aminoglycosides were spotted identically in the two blocks, the slides were incubated at room temperature for 2 h in a humidity chamber. They were then washed by pipetting 240 μL of assay buffer (for AAC(2’): 100 mM KH2PO4, pH 7.0; for AAC(3): 50 mM HEPES, pH 7.5) into each block and incubating for 5 min at room temperature; the solution was pipetted out of the blocks. This wash step was repeated three times.
2.6 Determination of the amount of aminoglycoside immobilized on the slide surface
To determine the amount of aminoglycoside immobilized onto the slide surface, a silicon gasket that created 50 microwells on the slide surface was affixed to the microarray. Then, different concentrations of 1, 2, 3, and 4 were immobilized into each well. After incubation for 2 h at 100% humidity, the wells were washed three times by incubating 12 μL of buffer in each well for 5 min (for AAC(2’): 100 mM KH2PO4, pH 7.0; for AAC(3): 50 mM HEPES, pH 7.5). These washes, which contained unreacted azido-aminoglycoside that was not immobilized onto the array surface, were pooled and placed into a well of a 96-well plate. To these solutions was added 100 μL of a 1 mM fluorescamine prepared in dry acetone. The fluorescence signal in the plate was immediately measured using a BioTek-HT fluorescence plate reader using a 360/40 nm excitation filter and a 460/40 nm emission filter. Data were compared to standard solutions of 1, 2, 3, and 4. Signals above background were only observed for the two highest spot concentrations. (For the AAC(2’) microarrays, this corresponds to spotting solutions containing 5 mM and 1.67 mM aminoglycoside; for the AAC(3) microarrays, this corresponds to spotting solutions containing and 5 mM and 1 mM aminoglycoside. In all cases, 400 nL of spotting solution is delivered to the surface.
2.7 Enzymatic modification of immobilized aminoglycosides with AAC enzymes using 14C-labeled AcCoA
Reactions were completed in 240 μL total volume. Each reaction consisted of: assay buffer (for AAC(2’): 100 mM KH2PO4, pH 7.0; for AAC(3): 50 mM HEPES, pH 7.5), 0.13 nmoles of 14C-labeled AcCoA, 5 nmoles cold AcCoA, and resistance-causing enzyme (0.9 μg for AAC(2’) or 0.3 μg total protein for AAC(3)) or blank BL21(DE3) pLysS control lysate (0.9 μg for AAC(2’) experiments or 0.3 μg for AAC(3) experiments). Reactions were carried out for 20 h at 37 °C at 100% humidity to prevent evaporation. After reaction, the slides were submersed in 0.2% SDS and the silicon gasket was removed. They were then washed with 0.2% SDS for an additional 30 min at 37 °C followed by H2O for 10 min at 37 °C. Slides were air dried, exposed in a phosphorimager cassette and scanned using a Bio-Rad FX phosphorimager. Data were quantified using QuantityOne software.
2.8 Determination of the amount of aminoglycoside modified by resistance-causing enzymes on the surface
The amount of radioactivity deposited onto the surface was determined using the counts of the 14C immobilized relative to the total radioactive counts added to each reaction. Using this information and the moles of aminoglycoside immobilized on the slide surface (determined from the fluorescamine assay described above), the moles and percentage of modified aminoglycoside on the surface were determined.
2.9 Probing modified slides with the fluorescently labeled ribosomal A-site mimic
Prior to hybridization of the labeled A-site mimic (5), slides were pre-equilibrated with 600 μL of hybridization buffer (8 mM Na2HPO4, pH 7.1, 1 mM EDTA, and 185 mM NaCl) containing 200 μg/mL BSA and the solution evenly spread over the surface with a piece of parafilm. After 10 min at room temperature, the parafilm and excess buffer were removed. A 600 μL solution of 1 μM 5 (purchased from Dharmacon) in hybridization buffer was refolded by incubating for 4 min at 95 °C followed by slow cooling to room temperature. Then, bovine serum albumin (BSA) was added to a final concentration of 100 μg/mL to prevent non-specific binding, and the solution was applied to the slide surface. The array was incubated for 40 min at room temperature in the dark. Unbound RNA was washed off the surface by delivering 10 × 1 mL hybridization buffer containing 200 μg/mL of BSA to the array surface followed by 5 × 1 mL H2O. Slides were air dried and scanned at 532 nm with an Axon GenePix 4000A microarray scanner, and data were quantified using QuantityOne software.
2.10 Synthesis of kanamycin A-triazole
Please see the Supporting Information for details of the synthesis of kanamycin A-triazole.
3. Results
To study aminoglycoside modification by the acetyltransferase class of resistance-causing enzymes and the effect of modification on binding an oligonucleotide mimic of the bacterial A-site, we synthesized20,23 and immobilized four azido-aminoglycosides onto alkyne-functionalized agarose arrays14,24 via a Huisgen cycloaddition reaction21 (Figure 2). The positions where the azido-groups were installed into each aminoglycoside was governed by the ease of functionalization of a primary hydroxyl group.14,23,25 For the kanamycin A (1) and the tobramycin (2) derivatives, the 6”OH group was functionalized. In crystal structures of these aminoglycosides complexed with the bacterial rRNA A-site, there are no contacts between the 6”OH group and RNA.26,27 Therefore, immobilization through the 6”OH group should not significantly affect A-site binding. Structures of AAC(2’) complexed with both tobramycin and kanamycin A are also available.28 In these structures, the 6”OH groups of both kanamycin A and tobramycin do not form critical direct contacts with the enzyme and are exposed to solvent. In these structures there is sufficient space for triazole functionalization and surface immobilization at the 6”OH.29 There are no known structures of AAC(3)-aminoglycoside complexes. The neamine (3) and the neomycin B (4) derivatives were functionalized at similar positions—the 5 and 5”OH groups, respectively. Both hydroxyl groups form an intramolecular hydrogen bond with the 2’NH2. The 5OH group of neamine does not form stabilizing interactions with the rRNA A-site mimic; thus immobilization at this site is unlikely to significantly affect RNA binding. The 5”OH group of neomycin does hydrogen bond with the N7 of G1491.26
Figure 2.
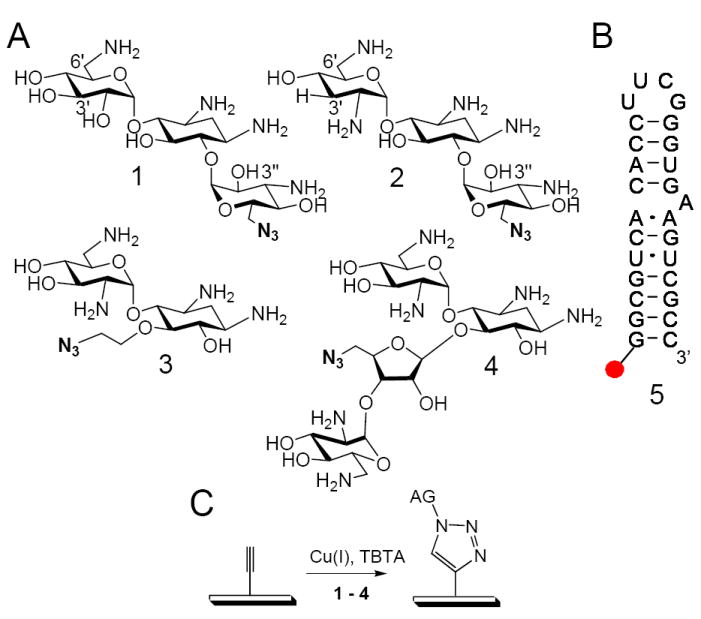
A, the structures of the azido-aminoglycosides used to construct the array: (1) Kanamycin A mimic, (2) Tobramycin mimic, (3) neamine mimic, (4) neomycin B mimic. B, the structures of the 5’-end DY547-labeled oligonucleotide mimics of the bacterial rRNA A-site. C, the Huisgen dipolar cycloaddition reaction used to anchor 1–4 onto the agarose array surface.
Aminoglycosides were spotted in duplicate sets inside two blocks of a silicon gasket that was placed over the array. This allowed two hybridizations to be completed simultaneously on the same surface—one containing the resistance-causing enzyme of interest and the other containing a cell lysate without the resistance-causing enzyme. Each block also contained cold AcCoA and trace 14C-labeled AcCoA. Therefore, if modification occurs on the surface, then 14C is deposited at the corresponding positions. The relative signal allows for readout of the amount of aminoglycoside that was modified. Indeed, signal was only observed when the AAC enzymes were added to the array; no signal was observed when a lysate that does not contain the resistance-causing enzyme was added (Figures 3 and 4).
Figure 3.

Modification of aminoglycosides by AAC(2’) on a microarray and the subsequent effect on binding to an oligonucleotide mimic of the bacterial A-site, 5. A, a representative image of modification of aminoglycosides 1, 2, 3, and 4 (Figure 2) by AAC(2’). The two halves of the microarray were spotted in the same manner. The left side was incubated with a cell lysate that does not contain AAC(2’) and [14C]acetyl-CoA. As expected, there is no transfer of the radioactive tag to the aminoglycosides immobilized on the surface. The right side labeled “+AAC(2’)” was incubated with cell lysate (partially purified) with AAC(2’) and [14C]acetyl-CoA. B, Plots of the data from two microarray experiments represented in Panel A. 1+ is the data for compound 1 when incubated with a cell lysate containing AAC(2’); 1- is the data for compound 1 when incubated with a cell lysate that does not contain AAC(2’); 2+ is the data for compound 2 when incubated with a cell lysate containing AAC(2’) while 2- was not incubated with AAC(2’), etc. C, the microarray in panel A was probed fro binding 5 after 1, 2, 3, and 4 were modified by AAC(2’). The left side of the microarray was incubated without AAC(2’) while the right side was incubated with AAC(2’). D, Plots of data for two microarray experiments represented in Panel C.
Figure 4.
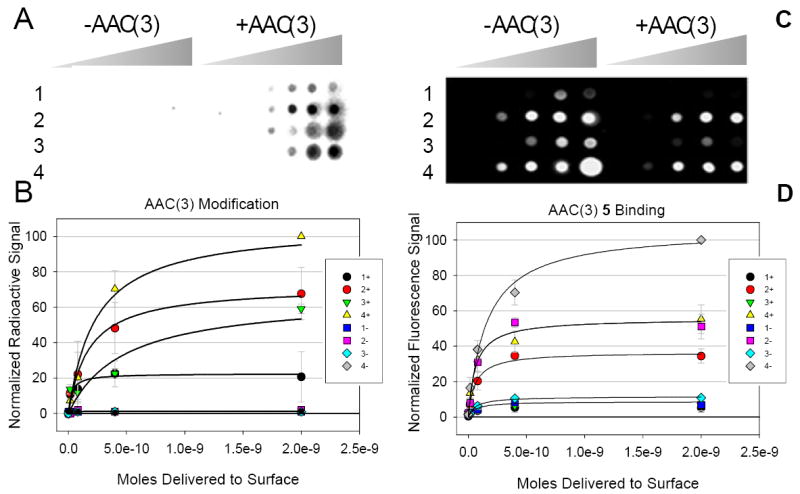
Modification of aminoglycosides by AAC(3) on a microarray and the subsequent effect on binding to an oligonucleotide mimic of the bacterial A-site, 5. A, a representative image of modification of aminoglycosides 1, 2, 3, and 4 (Figure 2) by AAC(3). The two halves of the microarray were spotted in the same manner. The left side was incubated with a cell lysate that does not contain AAC(3) and [14C]acetyl-CoA. As expected, there is no transfer of the radioactive tag to the aminoglycosides immobilized on the surface. The right side labeled “+AAC(3)” was incubated with AAC(3) and [14C]acetyl-CoA. B, Plots of the data from two microarray experiments represented in Panel A. 1+ is the data for compound 1 when incubated with a cell lysate containing AAC(3); 1- is the data for compound 1 when incubated with a cell lysate that does not contain AAC(3); 2+ is the data for compound 2 when incubated with AAC(3) while 2- was not incubated with AAC(3), etc. C, the microarray in panel A was probed fro binding 5 after 1, 2, 3, and 4 were modified by AAC(3). The left side of the microarray was incubated without AAC(3) while the right side was incubated with AAC(3). D, Plots of data for two microarray experiments represented in Panel C.
Modification of aminoglycosides by AAC(2’) and the effect on binding 5
The aminoglycoside arrays were first probed for modification by the AAC(2’) from M. tuberculosis. This enzyme is not known to confer resistance to aminoglycoside antibiotics. Modification of arrayed aminoglycosides by AAC(2’) was observed for aminoglycosides that contain a 2’NH2 group (2–4). The trends in modification of the compounds on the array show that the neamine (3) and neomycin (4) derivatives are modified to the highest and similar extents. Tobramycin (2) was modified at about 60% of the extent of 3 and 4 at the highest loading and approximately maintains this relative level throughout the loading range (Figure 3). In contrast, the aminoglycoside with a 2’OH group, the kanamycin A derivative (1), did not give measurable signal. Previously it has been shown that AAC(2’) can acetylate kanamycin A, however, the kcat/KM is small compared to modification of aminoglycosides that contain a 2’NH2 group. For example, in the presence of fixed and saturating concentrations of AcCoA, kanamycin A and tobramycin have kcat/KM’s of 4.75 × 10⁴ and 3.64 × 10⁷ M-1 sec-1, respectively.17 The difference in the extent of modification therefore depends on the structure of the aminoglycosides and the functional groups that they present, not the manner in which the compounds are displayed on the surface because 1 and 2 are displayed similarly and only differ by the functional groups at the 2’ and 3’ positions.
After modification, the arrays were washed to remove protein bound to the surface and probed with a fluorescently labeled (5’-DY547) mimic of the bacterial A-site (5) to determine if the modified aminoglycosides on the array have a diminished affinity towards its therapeutic target.5,14,30 For the unmodified aminoglycoside, the relative signal observed at each loading on the array for binding to the A-site is 4 > 2 > 3 > 1 (Figures 3 and 4). This trend correlates with the trends in affinities for the parent (un-functionalized, unmodified) aminoglycosides that were determined by surface plasmon resonance spectroscopy.30 A significant decrease in binding of the A-site to aminoglycosides modified by AAC(2’) was not observed. Only neomycin B at the highest ligand loading (5 mM aminoglycoside in the spotting solution) showed diminished binding upon modification that is not within error.
To determine why a decrease in binding was not observed, the amount of aminoglycoside that was modified on the array was estimated. First, the amount of aminoglycoside immobilized on the surface was determined using fluorescamine, as previously described.14,31 Comparison of these values to the amount of AcCoA deposited onto the array using the radioactive signals allowed determination of the fraction of aminoglycosides that was modified on the array. Results show only a small percentage of the arrayed aminoglycosides is modified by AAC(2’) (Table 1). For example, at the highest compound loading only 3%, 5%, and 2% of array-immobilized compounds 2, 3, and 4, respectively, were modified while at the second highest compound loading only 8%, 19%, and 7% of array immobilized 2, 3, and 4, respectively, were modified. The detection limit of fluorescamine precluded measurement of the amount of aminoglycoside immobilized at lower ligand loadings. Attempts to increase the amount of aminoglycoside modified onto the array surface by increasing the concentration of enzyme, the amount of AcCoA, and the incubation time did not increase the percent of aminoglycoside modified on the surface so that a significant difference in the binding of 5 to modified aminoglycosides could be observed.
Table 1.
Summary of the percentages of aminoglycosides modified at the two highest aminoglycoside concentrations in the spotting buffer and the subsequent effect on binding to 5, an oligonucleotide mimic of the bacterial A-site.
| % Modified at Highest [Aminoglycoside]a | % Decrease in Binding 5 at Highest [Aminoglycoside]a | % Modifed at Second Highest [Aminoglycoside]b | % Decrease in Binding 5 at Second Highest [Aminoglycoside]b | |
|---|---|---|---|---|
| AAC(2’) | ||||
| 1 | N/A | N/A | N/A | N/A |
| 2 | 3 | 4c | 8 | 3c |
| 3 | 5 | 1c | 19 | 2c |
| 4 | 2 | 23 | 17 | 7c |
| AAC(3) | ||||
| 1 | 7 | 0c | 42 | 1c |
| 2 | 17 | 15 | 58 | 14 |
| 3 | 24 | 5c | 42 | 4c |
| 4 | 16 | 44 | 53 | 28 |
For AAC(2’) and AAC(3), this concentration is 5 mM.
For AAC(2’) this concentration is 1.67 mM while for AAC(3) this concentration is 1 mM.
The fluorescence intensity for binding to 5 for the aminoglycoside incubated with a cell lysate without the resistance-causing enzyme and with the resistance-causing enzyme are within error.
Modification of aminoglycosides by AAC(3) and the effect on binding 5
Modification by another acetyltransferase, the AAC(3) from E. coli, was also studied. The AAC(3) resistance-causing enzyme is most interesting because it can specifically modify a wide variety of aminoglycosides including gentamycin, tobramycin, neomycin, and apramycin,19,32 and thus confers resistance to aminoglycoside antibiotics. Because it has a wide specificity for clinically used aminoglycosides, the identification of features in substrates that allow for modification is very important.
The same series of experiments that were completed with AAC(2’) were also completed with AAC(3). The order of the amount of modification on the surface is 4 ≈3 ≈2 >1. In solution experiments have shown that neomycin B (4-like) and tobramycin (2-like) have similar kcat/KM’s of 1.6 × 10⁸ and 1.1 × 10⁸, respectively, while kanamycin A (1-like) has a lower kcat/KM of 3.4 × 105.17 Thus, the relative values obtained from the array correlate well with solution measurements.
The amount of aminoglycoside modified on the array surface was also determined using the fluorescamine assay described above and the amount of radioactivity deposited at aminoglycoside-functionalized positions. Much more of the aminoglycoside on the array is modified by AAC(3) than by AAC(2’) (Table 1). For the highest ligand loading (5 mM aminoglycoside in the spotting solution), 7%, 17%, 24%, and 16% of the immobilized aminoglycosides are modified for 1, 2, 3, and 4, respectively. At the second highest ligand loading (1 mM aminoglycoside in the spotting solution), 42%, 58%, 42%, and 53% of the immobilized aminoglycoside is modified for 1, 2, 3, and 4, respectively.
After modification the arrays were washed to remove bound protein and probed for binding to 5. Results show that aminoglycosides modified by AAC(3) have reduced affinities for binding to 5 (Figure 4). The largest reduction in affinity is observed for 4 followed by 2. Interestingly, modification by 3 did not reduce binding of 5 as much as 2 or 4 despite similar extents of modification. This suggests that 3 binds differently to the A-site. Indeed, in a crystal structure of the A-site complexed with neamine, the RNA folds into a significantly different conformation than when bound to kanamycin, tobramycin, or neomycin and forms different contacts with the aminoglycoside.26,33
4. Discussion
Aminoglycosides are a class of antibacterials that binds to the bacterial rRNA A-site and cause perturbation of A-site dynamics.8 Enzymatic modification of aminoglycosides by resistance-causing enzymes leads to bacterial resistance by causing a decrease in binding affinity. There are three main types of aminoglycoside modifications include phosphorylation, nucleotidylation, and acetylation, which is the most common. We studied modification by two acetyltransferases, M. tuberculosis AAC(2’) and E. coli AAC(3). Insights into how acetylation of these two positions affects A-site binding can be gained from crystal structures and minimum inhibitory concentrations (MIC) data.
4.1 The importance of aminoglycoside 2’NH2 and 3NH2 in binding of the bacterial A-site
Crystal structures of an oligonucleotide mimic of the bacterial A-site complexed with all four parent aminoglycosides used in this study have been reported.26,27 Interestingly, the 2’ position does not form direct contacts with the A-site in any of the complexes. The 2’ position in tobramycin and neomycin B makes water mediated contacts with the phosphodiester backbone of A1493; tobramycin makes additional water mediated contacts to the phosphodiester backbone of A1492 and the N7 of G1491. The 2’ position of all four parent aminoglycosides makes intramolecular hydrogen bonds, some of which are water mediated. This may suggest that modification of the 2’ position may not affect A-site binding as much as modification at other positions such as the 1, 2”, 3 or, 6’, which all make direct contacts to the RNA.
In contrast, analysis of crystal structures of all four parent aminoglycosides used is this study complexed with the bacterial rRNA A-site show that the 3NH2 forms the same series of important, direct contacts: it participates in hydrogen bonds with the N7 of G1464 and the phosphates in A1493 and G1494.26,27 Therefore, disruption of this series of critical contacts would significantly diminish binding to the A-site. These interactions appear to be important for maintaining the RNA-aminoglycoside complex than the interactions formed by the 2’ position because most are water mediated and intramolecular.
The more critical nature of the contacts made by the 3NH2 than the 2’NH2 is also supported by the MIC of tobramycin and 2’-Ac and 3-Ac tobramycin.34 In E. coli strains that lack resistance-causing enzymes, tobramycin has an MIC of 0.5 μg/mL whereas the MICs for 2’-Ac tobramycin and 3-Ac tobramycin are 32 and 256 μg/mL respectively. Therefore the 2’-acetylated derivative is 8-fold more potent than the 3-acetylated derivative, suggesting that the 3-Ac tobramycin cannot interact with the A-site as strongly as 2’-Ac tobramycin. The 2’NH2 is also not in as close proximity to portions of the A-site that could affect binding to the A-site via steric effects.26,27
4.2 Comparison of M. tuberculosis AAC(2’) and E. coli AAC(3): Can the biological function of acetyltransferases be distinguished using microarrays?
Acetyltransferases are common enzymes that modify a variety of substrates including proteins, carbohydrates, lipids, metabolites, arylamine drugs, and carcinogens. Clearly, not all AAC’s play roles in bacterial resistance. To determine if our microarray platform could distinguish between AAC’s that are clinically relevant to bacterial resistance from ones that are not, we studied the ability of M. tuberculosis AAC(2’) and E. coli AAC(3). The former is chromosomally encoded and not known to confer aminoglycoside resistance; its biological substrate may be mycothiol. The latter is encoded in plasmids and known to confer aminoglycoside resistance.
Both the AAC(2’) and the AAC(3) modify the aminoglycoside derivatives that have an amino group in the corresponding position; 2–4 and 1–4, respectively. The kanamycin derivative, 1, contains an OH group in the 2’ position; previous studies have shown that the kcat/Km of M. tuberculosis AAC(2’) for hydroxyl groups are three orders of magnitude lower, than amino groups (comparison of kanamycin and tobramycin at fixed, saturating concentrations of AcCoA).17 This could explain, at least in part, why modification of 1 was not observed. Though both enzymes can modify the aminoglycosides when displayed on an array surface, the extent of modification is different. AAC(3) modifies ~5-fold more of the arrayed substrate at the highest ligand loading (5 mM aminoglycoside in the spotting solution) than AAC(2’) (Table 1). This correlates with the differences in kcat/Km’s of the two enzymes in the presence of saturating concentrations of AcCoA: the kcat/Km for kanamycin is 7-fold greater for AAC(3) than AAC(2’); for tobramycin, 3-fold; and for neomycin B, 25-fold.17,19 Previously reported experiments with arrays of 2 and 3 that were modified by ANT(2”) and APH(3’) show that both of these enzymes can modify as much as 80% of the arrayed aminoglycoside.14 Evidently, the extent of modification on the surface is correlated with the biological function of the enzyme.
Moreover, the extent of modification influences the decrease in A-site binding. A decrease in binding was only observed when 4 at the highest ligand loading (5 mM) was modified by M. tuberculosis AAC(2’). In contrast, a decrease in A-site binding was observed when X and X were modified by AAC(3). Less significant decreases were observed for Y and Y. These results are in contrast to our previous experiments with an aminoglycoside nucleotidyltransferase (ANT(2”)) and an aminoglycoside phosphoryltransferase (APH(3’)) resistance-causing enzymes, in which significant reductions in the binding of modified aminoglycosides to the bacterial A-site were observed. 14
5. Implications
Microarray technologies are finding a niche in furthering the understanding of a wide variety of cellular processes. They are most commonly used to probe gene expression on a genome-wide scale.35 Protein microarrays have also been used extensively to study protein-protein interactions and protein modification.36,37 Small molecule microarrays have been developed to identify chemical probes for protein,38-42 and carbohydrate microarrays are becoming an important enabling technology to understand the roles of sugars in biological processes.43-50 Perhaps our investigations into developing arrays to study sugar modification will go beyond studying antibiotic resistance. One potential application is to identify the physiological substrates of AAC(2’). This enzyme is chromosomally encoded therefore it is not likely that its physiological function is to confer aminoglycoside resistance. Crystal structures of AAC(2’) bound to substrate has led to the hypothesis that it could modify an intermediate of mycothiol, which is the major reducing agent in bacteria.28 Such hypotheses, and others, about the substrates for glycan modifying enzymes could be tested by profiling arrays of sugars for modification by AAC(2’) and other enzymes.
Supplementary Material
Acknowledgments
We thank Prof. John Blanchard for the generous gift of the plasmids encoding resistance-causing enzymes. This work was supported by the Camille and Henry Dreyfus New Faculty Award (to MDD), A NYSTAR JD Watson Award (to MDD), The University at Buffalo UB2020 Interdisciplinary Research Development Fund (IRDF) Award (to MDD and Prof. Terry Connell), The Research Cooperation for a Cottrell Scholar Award (to MDD), The New York State Center of Excellence in Bioinformatics and Life Sciences, and the National Institutes of Health (R01-GM079235).
Abbreviations
- AAC(2’)
aminoglycoside N-2’-acetyltransferase
- AAC(3)
aminoglycoside N-3-acetyltransferase
- AcCoA
Acetyl-Coenzyme A
- ANT(2”)
aminoglycoside O-2”-nucleotidyltransferase
- APH(3’)
aminoglycoside O-3’-phosphoryltransferase
- A-site
aminoacyl tRNA site
- BSA
bovine serum albumin
- DTT
dithiothreitol
- DY547
a dye with spectral properties similar to Cy3
- EDTA
ethylene diamine tetraacetic acid
- HEPES
4-(2-Hydroxyethyl)piperazine-1-ethanesulfonic acid
- IPTG
isopropyl β-D-1-thiogalactopyranoside
- kcat
turnover number
- KM
Michaelis-Menten constant
- LB
Luria-Bertani broth
- MWCO
molecular weight cut off
- PMSF
phenylmethylsulphonyl fluoride
- rRNA
ribosomal RNA
- TBTA
tris(benzyltriazolylmethyl)amine
Footnotes
Publisher's Disclaimer: This is a PDF file of an unedited manuscript that has been accepted for publication. As a service to our customers we are providing this early version of the manuscript. The manuscript will undergo copyediting, typesetting, and review of the resulting proof before it is published in its final citable form. Please note that during the production process errors may be discovered which could affect the content, and all legal disclaimers that apply to the journal pertain.
References
- 1.Jones D, Metzger HJ, Schatz A, Waksman SA. Science. 1944;100:103–105. doi: 10.1126/science.100.2588.103. [DOI] [PubMed] [Google Scholar]
- 2.Clatworthy AE, Pierson E, Hung DT. Nat Chem Biol. 2007;3:541–548. doi: 10.1038/nchembio.2007.24. [DOI] [PubMed] [Google Scholar]
- 3.Waksman SA, Reilly HC, Schatz A. Proc Natl Acad Sci USA. 1945;31:157–164. doi: 10.1073/pnas.31.6.157. [DOI] [PMC free article] [PubMed] [Google Scholar]
- 4.Moazed D, Noller HF. Nature. 1987;327:389–394. doi: 10.1038/327389a0. [DOI] [PubMed] [Google Scholar]
- 5.Fourmy D, Recht MI, Blanchard SC, Puglisi JD. Science. 1996;274:1367–1371. doi: 10.1126/science.274.5291.1367. [DOI] [PubMed] [Google Scholar]
- 6.Yoshizawa S, Fourmy D, Puglisi JD. Science. 1999;285:1722–1725. doi: 10.1126/science.285.5434.1722. [DOI] [PubMed] [Google Scholar]
- 7.Ogle JM, Brodersen DE, Clemons WM, Jr, Tarry MJ, Carter AP, Ramakrishnan V. Science. 2001;292:897–902. doi: 10.1126/science.1060612. [DOI] [PubMed] [Google Scholar]
- 8.Kaul M, Barbieri CM, Pilch DS. J Am Chem Soc. 2006;128:1261–1271. doi: 10.1021/ja056159z. [DOI] [PubMed] [Google Scholar]
- 9.Kaul M, Barbieri CM, Pilch DS. J Am Chem Soc. 2004;126:3447–3453. doi: 10.1021/ja030568i. [DOI] [PubMed] [Google Scholar]
- 10.Shandrick S, Zhao Q, Han Q, Ayida BK, Takahashi M, Winters GC, Simonsen KB, Vourloumis D, Hermann T. Angew Chem Int Ed Engl. 2004;43:3177–3182. doi: 10.1002/anie.200454217. [DOI] [PubMed] [Google Scholar]
- 11.Beauclerk AA, Cundliffe E. J Mol Biol. 1987;193:661–671. doi: 10.1016/0022-2836(87)90349-4. [DOI] [PubMed] [Google Scholar]
- 12.Magnet S, Blanchard JS. Chem Rev. 2005;105:477–498. doi: 10.1021/cr0301088. [DOI] [PubMed] [Google Scholar]
- 13.Llano-Sotelo B, Azucena EF, Jr, Kotra LP, Mobashery S, Chow CS. Chem Biol. 2002;9:455–463. doi: 10.1016/s1074-5521(02)00125-4. [DOI] [PubMed] [Google Scholar]
- 14.Disney MD, Barrett O. J Biochemistry. 2007;46:11223–11230. doi: 10.1021/bi701071h. [DOI] [PubMed] [Google Scholar]
- 15.Disney MD, Magnet S, Blanchard JS, Seeberger PH. Angew Chem Int Ed Engl. 2004;43:1591–1594. doi: 10.1002/anie.200353236. [DOI] [PubMed] [Google Scholar]
- 16.Disney MD, Seeberger PH. Chemistry. 2004;10:3308–3314. doi: 10.1002/chem.200306017. [DOI] [PubMed] [Google Scholar]
- 17.Hegde SS, Javid-Majd F, Blanchard JS. J Biol Chem. 2001;276:45876–45881. doi: 10.1074/jbc.M108810200. [DOI] [PubMed] [Google Scholar]
- 18.Ho II, Chan CY, Cheng AF. Antimicrob Agents Chemother. 2000;44:39–42. doi: 10.1128/aac.44.1.39-42.2000. [DOI] [PMC free article] [PubMed] [Google Scholar]
- 19.Magalhaes ML, Blanchard JS. Biochemistry. 2005;44:16275–16783. doi: 10.1021/bi051777d. [DOI] [PMC free article] [PubMed] [Google Scholar]
- 20.Childs-Disney JL, Wu M, Pushechnikov A, Aminova O, Disney MD. ACS Chem Biol. 2007;2:745–754. doi: 10.1021/cb700174r. [DOI] [PubMed] [Google Scholar]
- 21.Chan TR, Hilgraf R, Sharpless KB, Fokin VV. Org Lett. 2004;6:2853–2855. doi: 10.1021/ol0493094. [DOI] [PubMed] [Google Scholar]
- 22.Speers AE, Cravatt BF. Chem Biol. 2004;11:535–546. doi: 10.1016/j.chembiol.2004.03.012. [DOI] [PubMed] [Google Scholar]
- 23.Disney MD, Childs-Disney JL. Chembiochem. 2007;8:649–656. doi: 10.1002/cbic.200600569. [DOI] [PubMed] [Google Scholar]
- 24.Afanassiev V, Hanemann V, Wolfl S. Nucleic Acids Res. 2000;28:E66. doi: 10.1093/nar/28.12.e66. [DOI] [PMC free article] [PubMed] [Google Scholar]
- 25.Michael K, Wang H, Tor Y. Bioorg Med Chem. 1999;7:1361–1371. doi: 10.1016/s0968-0896(99)00071-1. [DOI] [PubMed] [Google Scholar]
- 26.Francois B, Russell RJ, Murray JB, Aboul-ela F, Masquida B, Vicens Q, Westhof E. Nucleic Acids Res. 2005;33:5677–5690. doi: 10.1093/nar/gki862. [DOI] [PMC free article] [PubMed] [Google Scholar]
- 27.Vicens Q, Westhof E. Chem Biol. 2002;9:747–755. doi: 10.1016/s1074-5521(02)00153-9. [DOI] [PubMed] [Google Scholar]
- 28.Vetting MW, Hegde SS, Javid-Majd F, Blanchard JS, Roderick SL. Nat Struct Biol. 2002;9:653–658. doi: 10.1038/nsb830. [DOI] [PubMed] [Google Scholar]
- 29.Structures of tobramycin bound to an oligonucleotide mimic of the bacterial rRNA A-site and to AAC(2’) are available in the Supporting Information.
- 30.Wong CH, Hendrix M, Priestley ES, Greenberg WA. Chem Biol. 1998;5:397–406. doi: 10.1016/s1074-5521(98)90073-4. [DOI] [PubMed] [Google Scholar]
- 31.Udenfriend S, Stein S, Bohlen P, Dairman W, Leimgruber W, Weigele M. Science. 1972;178:871–872. doi: 10.1126/science.178.4063.871. [DOI] [PubMed] [Google Scholar]
- 32.Davies J, O’Connor S. Antimicrob Agents Chemother. 1978;14:69–72. doi: 10.1128/aac.14.1.69. [DOI] [PMC free article] [PubMed] [Google Scholar]
- 33.When the aminoglycoside derivatives are immobilized onto the arrays, a triazole is formed. To determine the effect of the triazole on the ability of AAC(3) to modify the aminoglycoside derivative, a triazole-functionalized kanamycin A was synthesized by conjugating propargylamine to 1 using a Huisgen dipolar cycloaddition reaction. The kcat and Km were determined using saturating concentrations of AcCoA and varying concentrations of kanamycin A-triazole. Interestingly, the kcat’s are similar for kanamycin A and kanamycin A-triazole while the Km is 10-fold lower for kanamycin-triazole.19
- 34.Sicsic S, Le Bigot JF, Vincent C, Cerceau C, Le Goffic F. J Antibiot (Tokyo) 1982;35:574–579. doi: 10.7164/antibiotics.35.574. [DOI] [PubMed] [Google Scholar]
- 35.Schena M, Shalon D, Davis RW, Brown PO. Science. 1995;270:467–470. doi: 10.1126/science.270.5235.467. [DOI] [PubMed] [Google Scholar]
- 36.MacBeath G, Schreiber SL. Science. 2000;289:1760–1763. doi: 10.1126/science.289.5485.1760. [DOI] [PubMed] [Google Scholar]
- 37.Zhu H, Klemic JF, Chang S, Bertone P, Casamayor A, Klemic KG, Smith D, Gerstein M, Reed MA, Snyder M. Nat Genet. 2000;26:283–289. doi: 10.1038/81576. [DOI] [PubMed] [Google Scholar]
- 38.Hergenrother PJ, Depew KM, Schreiber SL. J Am Chem Soc. 2000;122:7849–7850. [Google Scholar]
- 39.MacBeath G, Koehler AN, Schreiber SL. J Am Chem Soc. 1999;121:7967–7968. [Google Scholar]
- 40.Barnes-Seeman D, Park SB, Koehler AN, Schreiber SL. Angew Chem Int Ed Engl. 2003;42:2376–2379. doi: 10.1002/anie.200351043. [DOI] [PubMed] [Google Scholar]
- 41.Koehler AN, Shamji AF, Schreiber SL, Barnes-Seeman D, Park SB. J Am Chem Soc. 2003;125:8420–8421. doi: 10.1021/ja0352698. [DOI] [PubMed] [Google Scholar]
- 42.Kuruvilla FG, Shamji AF, Sternson SM, Hergenrother PJ, Schreiber SL. Nature. 2002;416:653–657. doi: 10.1038/416653a. [DOI] [PubMed] [Google Scholar]
- 43.Fukui S, Feizi T, Galustian C, Lawson AM, Chai W. Nat Biotechnol. 2002;20:1011–1017. doi: 10.1038/nbt735. [DOI] [PubMed] [Google Scholar]
- 44.Blixt O, Head S, Mondala T, Scanlan C, Huflejt ME, Alvarez R, Bryan MC, Fazio F, Calarese D, Stevens J, Razi N, Stevens DJ, Skehel JJ, van Die I, Burton DR, Wilson IA, Cummings R, Bovin N, Wong CH, Paulson JC. Proc Natl Acad Sci USA. 2004;101:17033–17038. doi: 10.1073/pnas.0407902101. [DOI] [PMC free article] [PubMed] [Google Scholar]
- 45.Nimrichter L, Gargir A, Gortler M, Altstock RT, Shtevi A, Weisshaus O, Fire E, Dotan N, Schnaar RL. Glycobiology. 2004;14:197–203. doi: 10.1093/glycob/cwh022. [DOI] [PubMed] [Google Scholar]
- 46.Disney MD, Seeberger PH. Chem Biol. 2004;11:1701–1707. doi: 10.1016/j.chembiol.2004.10.011. [DOI] [PubMed] [Google Scholar]
- 47.Houseman BT, Mrksich M. Chem Biol. 2002;9:443–454. doi: 10.1016/s1074-5521(02)00124-2. [DOI] [PubMed] [Google Scholar]
- 48.Park S, Lee MR, Shin I. Nat Protoc. 2007;2:2747–2758. doi: 10.1038/nprot.2007.373. [DOI] [PubMed] [Google Scholar]
- 49.Park S, Shin I. Angew Chem Int Ed Engl. 2002;41:3180–3182. doi: 10.1002/1521-3773(20020902)41:17<3180::AID-ANIE3180>3.0.CO;2-S. [DOI] [PubMed] [Google Scholar]
- 50.Wang D, Liu S, Trummer BJ, Deng C, Wang A. Nat Biotechnol. 2002;20:275–281. doi: 10.1038/nbt0302-275. [DOI] [PubMed] [Google Scholar]
Associated Data
This section collects any data citations, data availability statements, or supplementary materials included in this article.