

Abstract
It has been suggested that the right inferior frontal gyrus (IFG) plays a critical role in manual response inhibition, although neuroimaging studies of healthy adults have also reported widespread activations in other cortical regions during a variety of response inhibition tasks. We conducted a functional magnetic resonance imaging (fMRI) experiment to examine whether the activation of the IFG is dependent on the type of visuo-motor associations during response inhibition by varying the feature of the stop signal (color vs. orientation) in the stop-signal task. Results from 12 subjects showed that the bilateral ventral posterior IFG, anterior insula, inferior frontal junction (IFJ), middle temporal gyrus (MTG) and fusiform gyrus (FG) are active during response inhibition cued by both color and orientation stop signals. While only the MTG showed differential activity to the two stop signals, both MTG and FG showed significantly stronger activity during successful than unsuccessful stopping of unwanted responses cued by orientation and color, respectively. Our findings suggest that the right ventral posterior IFG may play a more general role in response inhibition regardless of the feature of the visual signal, while successful inhibition may depend on efficient processing of the signal.
Keywords: ventrolateral prefrontal cortex, stop-signal task, cognitive control, insula cortex, visually-guided response control
1. Introduction
Executive control is a high-order cognitive function for orchestrating multiple cognitive and behavioral processes in order to achieve certain behavioural goals. Response inhibition, one of the key components of executive control (Miyake et al., 2000), is a cognitive-motor process for canceling planned actions or withholding inappropriate and impulsive responses. Flexible control of response inhibition is important even for daily routines in dealing with the ever-changing environment. For example, a pedestrian would stop walking and wait on the side of the curb before crossing the street if a car is approaching. Studies of brain damage have shown that deficiency in inhibition or disinhibition is commonly associated with dysfunctional frontal lobes in humans (Shallice and Burgess, 1993; Shallice et al., 1996).
Accumulating evidence shows that a cortical network of frontal, parietal and temporal regions is involved in response inhibition (Aron and Poldrack, 2006; Garavan et al., 1999; Leung and Cai, 2007; Rubia et al., 2001). Among these regions, the right IFG has been emphasized to play a central role in response inhibition studies using various tasks, including the go/no-go task (e.g. Garavan et al., 1999; Konishi et al., 1998; Konishi et al., 1999) and the stop-signal task (e.g. Aron and Poldrack, 2006; Rubia et al., 2001, Rubia et al., 2003). A typical go/no-go task requires one to respond to a frequently presented stimulus and not respond to a less frequently presented stimulus, and the stop-signal task requires one to respond to a frequently presented target stimulus but to withhold the response occasionally when the target stimulus was followed by a stop signal. Severe impairment of performance on the stop-signal task was observed in patients with frontal lobe damage involving the right IFG (Aron et al., 2003). Temporary reduction of performance was also observed when transcranial magnetic stimulus was applied to the right posterior IFG of healthy adults, while similar effects were not reported for stimulation of other cortical regions including the left IFG (Chambers et al., 2006; Chambers et al., 2007). These findings together suggest that the right IFG is particularly important for response inhibition.
Although it has been shown that the right IFG plays a critical role in response inhibition, the literature suggests that it is both anatomically and functionally heterogeneous (see review by Petrides and Pandya, 2002). We recently found differential activation of the ventral posterior IFG in both hemispheres in correspondence to canceling hand versus eye movements, using the stop-signal task (Leung and Cai, 2007). Sakagami and his colleagues (2001) found that neurons in the ventrolateral prefrontal cortex of monkeys differentiate between color, but not motion, stimuli cueing no-go versus go responses. These findings together suggest that the activity of IFG reflects specific stimulus-response association during inhibition of hand movements. Our goal was to examine the functional organization by information type in the human cortex during manual response inhibition.
Since previous studies have mostly used non-spatial visual cues (objects and letters), the effect of visual cue on response inhibition has not yet been determined. We used the stop-signal paradigm with color and orientation stop signals to directly examine whether the activation of IFG during manual response inhibition is dependent on the visual feature of stop signal (see Figure 1). We also examined other cortical regions because numerous neuroimaging studies of response inhibition have reported activations in regions other than the right IFG, including the left IFG, inferior parietal lobe (IPL), middle temporal gyrus (MTG), middle frontal gyrus (MFG) and frontal motor areas (Aron et al., 2006; Li et al., 2006; Rubia et al., 2001). We applied a conjunction analysis to determine the activations common to response inhibition guided by color and orientation stop signals.
Figure 1.
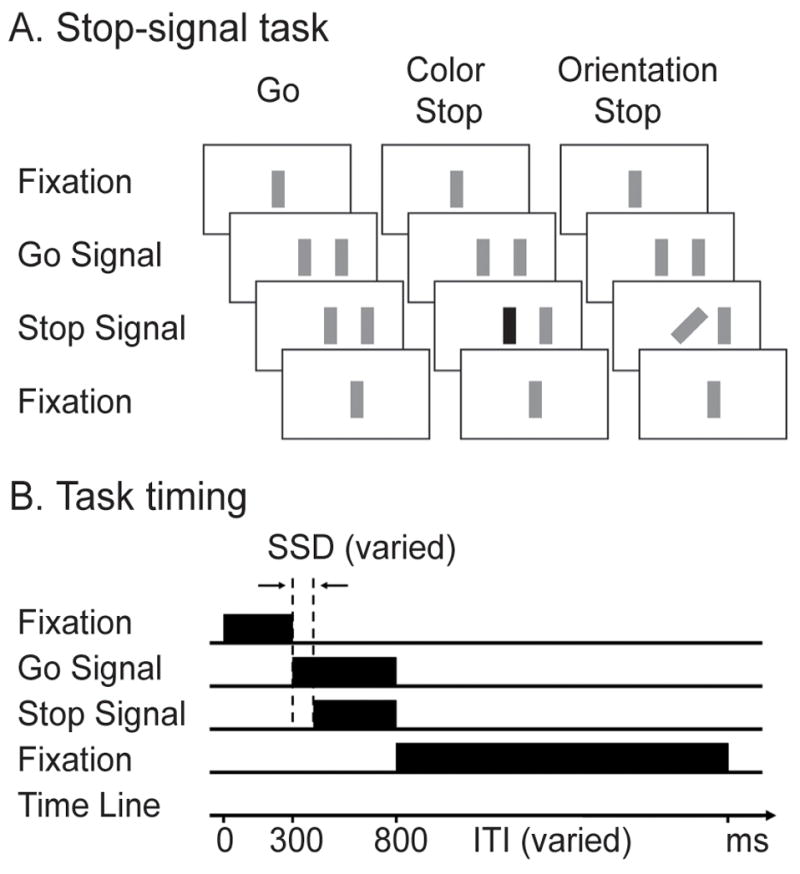
Color and orientation stop-signal tasks. A. Go trials were the same for the color and orientation tasks, with a peripheral stimulus (go signal) appeared to the left or right of the fixation bar (center) indicating the participants to generate a corresponding manual response. On stop trials, the fixation bar changed (stop signal) after the presentation of the go signal, indicating the demand of canceling the planned response. The stop signal was indicated by a color change in the color task and an orientation change in the orientation task. B. Timing of visual events during the sample trials: go and color stop and orientation stop. Stop signal delay (SSD) is the time interval between the onsets of the go and stop signals.
2. Results
Behavioral results
The average accuracies on responding to the go signals were high in both the color task (mean and standard deviation: 95±4%) and the orientation task (97±3%) and the average reaction times were 500±65ms and 509±59ms, respectively. The mean accuracy on stop trials was 71±14% for the color task and 74±14% for the orientation task. The mean stop-signal reaction times (SSRTs) were 281±41ms and 284±21ms for the color and orientation stop-signal tasks, respectively. Thus, performance across the two stop-signal tasks was approximately equated (all p’s > 0.30). As expected, the averaged SSD of successful stop trials was significantly shorter than that of unsuccessful stop trials in the color (118±8ms vs. 205±16ms) and orientation (125±12ms vs. 202±11ms) tasks (p< 0.001).
Cortical activations during response inhibition cued by color and orientation stop signals
Overall, contrasting successful stop trials with go trials (SS-G) revealed widespread activations in the lateral prefrontal cortex, parietal cortex and temporal cortex during both stop-signal tasks. For response inhibition cued by the color stop signal (Figure 2A), we found greater activations in the right ventral IFG/insula, right dorsal IFG near the junction of inferior frontal sulcus and precentral sulcus (IFJ), left MFG, left superior parietal lobe (SPL), left inferior temporal gyrus (ITG) and right posterior and anterior fusiform gyrus (FGp & FGa) (p< 0.001, uncorrected; cluster size ≥9). For response inhibition cued by the orientation stop signal (Figure 2B), we found greater activations in the bilateral ventral IFG/insula, left IFJ, right MFG, pre-supplementary motor areas (pre-SMA), right premotor cortex (extending to the frontal eye field [FEF]), right IPL, bilateral MTG and left FGp (p< 0.001, uncorrected; cluster size ≥9). Table 1 shows the list of activation clusters that were above a significance threshold of p< 0.05 (FDR corrected) for each stop-signal task. Furthermore, ROI analysis indicated that the bilateral MTG and right IPL exhibited stronger responses to the orientation stop signal than to the color stop signal (left MTG: paired t=3.58, p< 0.005; right MTG: paired t=5.01, p< 0.001; right IPL: paired t=2.89, p< 0.02; see Figure 2C), though differences in activation in the fusiform areas were insignificant (all t’s < 1). Importantly, direct contrasts of the two response inhibition conditions (color [SS-G] vs. orientation [SS-G]) did not reveal difference in activity in the ventral IFG or IFJ, even at a lower threshold (p< 0.05, uncorrected). The ventral IFG or IFJ also did not show hemispheric differences in activation during response inhibition cued by either stop signal (all t’s < 1) and activity in these two regions was not significantly correlated with the behavioral measurements of response inhibitions (SSRT) for either task.
Figure 2.

Activations during the color and orientation stop-signal tasks. A. SS-G (successful stop vs. go) contrast map of the color task shows suprathreshold activations during response inhibition cued by color change. B. SS-G contrast map shows suprathreshold activations during response inhibition cued by orientation change. The threshold of both contrast maps was set at p<0.001 (uncorrected with cluster size ≥9). Numbers indicate the z-coordinates in millimeters of the axial slices. L, left; R, right. C. Average beta values of regions involved in stop-signal processing. The left and right MTG and right IPL showed stronger responses to the orientation stop signal (blue bars) than to the color stop signal (red bars). MTG, middle temporal gyrus; IPL, inferior parietal lobule; FGa, anterior fusiform gyrus. *, p<0.05; **, p<0.005; ***, p<0.001. The first letter (“R” and “L”) of the abbreviations for the anatomical structures indicate the side the hemisphere (right and left, respectively).
Table 1.
Activation foci of the SS-G contrast of the color and orientation stop-signal tasks (cluster p< 0.05, corrected; cluster size≥ 9)
| MNI coordinates | |||||
|---|---|---|---|---|---|
| Region | cluster size | z value | x | y | z |
| Color task | |||||
| Frontal lobe | |||||
| right IFGv/anterior insula | 99 | 4.25 | 33 | 21 | −3 |
| right IFGd (IFJ) | 96 | 4.18 | 42 | 9 | 24 |
| left MFG | 73 | 3.8 | −48 | 27 | 33 |
| Parietal lobe | |||||
| left SPL | 51 | 3.51 | −24 | −57 | 45 |
| Temporal lobe | |||||
| left ITG | 524 | 4.69 | −57 | −57 | 0 |
| right FGp | 103 | 3.76 | 36 | −75 | −12 |
| right FGa | 3.39 | 36 | −54 | −18 | |
| Occipital lobe | |||||
| near left cuneus | 101 | 3.72 | −21 | −72 | 21 |
| Orientation task | |||||
| Frontal lobe | |||||
| right IFGv/anterior insula | 152 | 5.16 | 39 | 27 | 6 |
| left IFGd (IFJ) | 117 | 4.37 | −36 | 3 | 30 |
| right PM/FEF | 173 | 4.37 | 30 | 3 | 42 |
| right MFG | 4.17 | 36 | 0 | 54 | |
| left IFGv/anterior insula | 194 | 4.24 | −33 | 24 | −9 |
| right pre-SMA | 119 | 3.93 | 6 | 9 | 60 |
| left pre-SMA | 3.79 | −6 | 9 | 51 | |
| right MFG | 51 | 4.46 | 24 | 45 | 18 |
| Parietal lobe | |||||
| right IPL | 41 | 4.32 | 39 | −45 | 45 |
| right SMG | 40 | 3.93 | 54 | −30 | 42 |
| Temporal lobe | |||||
| left FGp | 881 | 5.42 | −42 | −75 | −12 |
| right ITG/MTG | 1372 | 5.05 | 51 | −63 | −3 |
| left MTG | 45 | 3.81 | −60 | −51 | 9 |
| near right MTG | 41 | 4.68 | 45 | −3 | −18 |
Abbreviation
FEF: frontal eye field
FGa: anterior fusiform gyrus
FGp: posterior fusiform gyrus
IFGv: ventral inferior frontal gyrus
IFGd: dorsal inferior frontal gyrus
IFJ: inferior frontal junction
IPL: inferior parietal lobe
ITG: inferior temporal gyrus
MFG: middle frontal gyrus
MTG: middle temporal gyrus
PM: premotor cortex
SMG: supramarginal gyrus
SPL: superior parietal lobe
Common activation across color and orientation stop-signal tasks
Conjunction analysis was conducted to localize cortical regions involved in response inhibition guided by both color and orientation stop signals by determining suprathreshold activations in both SS-G contrasts. Common activations were found in the ventral IFG/insula, IFJ, MTG, FGp and FGa (p< 0.001, uncorrected; Figure 3A), with the right ventral IFG/insula and left FGa above the significance threshold of p< 0.05 (FDR corrected; see Table 2). ROI analysis confirmed that the level of activity in the ventral IFG and IFJ in both hemispheres was not significantly different between the color and orientation stop-signal tasks (F<1, Figure 3C).
Figure 3.

Common activations during response inhibition cued by color and orientation stop signals. A. Suprathreshold activations were identified in both color and orientation SS-G contrasts (p<0.001 uncorrected). Arrows indicate the activation clusters in the right IFG and left FGa (p<0.05 corrected; see Table 2). Numbers indicate the z-coordinates in millimeters of the axial slices. B. The same results are shown on the lateral surface of the left and right hemispheres of a rendered brain averaged using the whole group. C. Average beta values showing about equal level of activations in the IFG and IFJ during response inhibition cued by color (red bars) and orientation (blue bars) stop signals. See Figure 2 and Table 1 for abbreviation.
Table 2.
Results from conjunction analysis using the SS-G contrasts for the color and orientation stop-signal tasks (p< 0.05, corrected at the cluster level) See Table 1 for abbreviations
| MNI coordinates | |||||
|---|---|---|---|---|---|
| Region | cluster size | z value | x | y | z |
| Frontal lobe | |||||
| right IFGv/anterior Insula | 82 | 4.22 | 36 | 24 | 0 |
| Temporal/Occipital lobe | |||||
| left FGa | 145 | 4.03 | −42 | −60 | −15 |
| left lingual gyrus | 3.53 | −24 | −66 | −9 | |
Cortical activation corresponding with successful versus unsuccessful response inhibition
To further characterize the function of the ventral IFG and IFJ during successful response inhibition, we contrasted their activity during successful stopping (SS-G) with that during unsuccessful stopping (US-G). We found a similar pattern of activation in the ventral IFG/insula and IFJ during unsuccessful stopping in both tasks as in successful stopping (see above), using the same threshold (p< 0.001, uncorrected; cluster size ≥9). Using the ROIs identified from the SS-G contrast of each task, we confirmed that both the right and the left IFJ were more active during successful inhibition compared to unsuccessful inhibition for the color stop-signal task (p< 0.02), while only the right IFJ was more active in successful inhibition for the orientation stop-signal task (p< 0.06). The ventral IFG, however, did not show significant differences in activation comparing successful and unsuccessful inhibition for either stop-signal task (p>0.1).
ROI analysis further revealed that the FGa showed significantly stronger activation during successful inhibition compared to unsuccessful inhibition for the color task, while a similar difference was observed in the MTG for the orientation task (paired t-tests, all p’s < 0.05) (see Figure 4).
Figure 4.
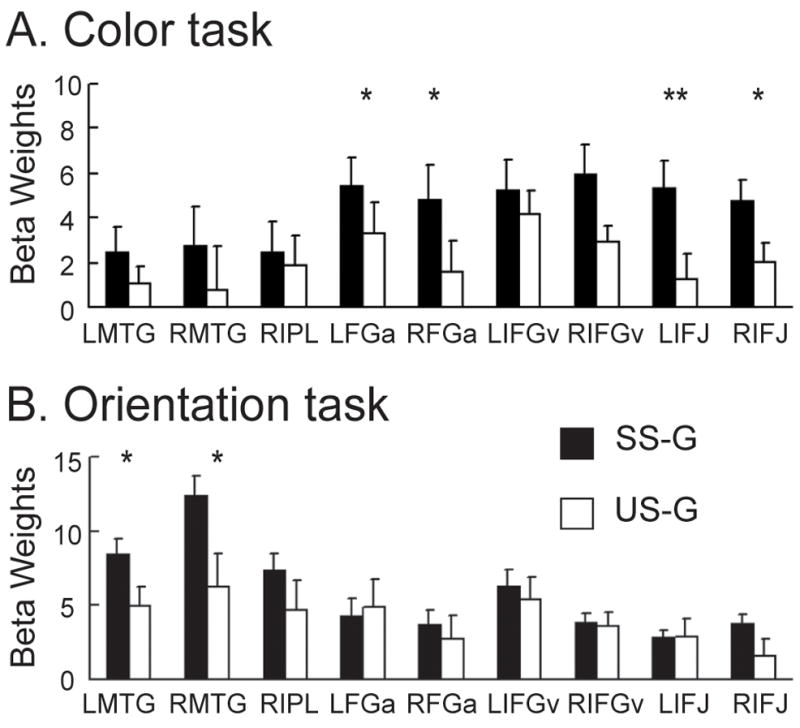
The bar charts show the average beta values of successful inhibition (SS-G) (black bars) and unsuccessful inhibition (US-G) (white bars) for the color stop-signal task (A) and orientation stop-signal task (B). *, p<0.05; **, p<0.005. See Table 1 for abbreviation.
3. Discussion
Consistent with the findings in previous neuroimaging studies using the stop-signal paradigm (Aron and Poldrack, 2006; Leung and Cai, 2007; Rubia et al., 2001; Rubia et al., 2003), our data revealed that the right ventral posterior IFG and anterior insula are about equally active during manual response inhibition cued by color and orientation stop signals. The MTG and FG were significantly more active during successful stopping relative to unsuccessful stopping in orientation and color stop-signal task, respectively. In addition, our results showed that the IFJ but not the ventral IFG seems to be modulated by the success of response inhibition.
IFG in response inhibition
Result from the conjunction analysis showed that the posterior IFG (and the anterior insula) in both hemispheres are equally involved in manual response inhibition cued by color and orientation stop signals. There were two main clusters of activation in the IFG: dorsal and ventral IFG. The peaks in the dorsal IFG clusters (with coordinates: x=−42, y=6, z=27 and x=45, y=9, z=30) are nearby the junction of inferior frontal sulcus and precentral sulcus (IFJ). The IFJ has been associated with numerous cognitive control processes such as task coordination, interference control and set shifting (Derrfuss et al., 2004; Brass et al., 2005). The activation in the right ventral IFG is mainly located in the posterior part of the pars triangularis, extending to the neighboring anterior insular cortex (peak coordinates: x=36, y=24, z=0). The locus of this activation in the right ventral IFG is close to the activation previously found common to inhibition of eye and hand movements (Leung and Cai, 2007). It is also close to the activation previously reported for successful inhibition in contrast with response execution in manual stop-signal studies (Aron and Poldrack, 2006; Aron et al., 2007; Rubia et al., 2001; Xue et al., 2008) and for successful inhibition in contrast with unsuccessful inhibition in a go/no-go study (Menon et al., 2001) and stop-signal studies (Rubia et al., 2003; Rubia et al., 2007). Besides, Ramautar et al., (2006) found similar N2/P3 event-related potentials (ERPs) in response inhibition guided by both visual and auditory stop signals, suggesting sensory-independent brain regions underlying response inhibition. It is possible that the source of their common ERP signals is the ventral posterior IFG. Taken together, by showing that the activation of IFG is independent of the visual feature of the stop signal, our findings provide additional evidence supporting that the role IFG as a common control mechanism for response inhibition (Aron et al., 2004; Konishi et al., 1999).
It is worth noting that the posterior IFG activations observed in the stop-signal studies seem to be apart from those observed in the go/no-go studies. A recent meta-analysis of results from neuroimaging studies of the go/no-go task (Simmonds et al., 2007) showed a major cluster of activation in the right IFG that is anterior to the IFJ and dorsal to ventral IFG activations found in our stop-signal tasks. The activation in the left posterior IFG during the go/no-go task reported in Rubia et al. (2001) is also dorsal to the activation in the ventral posterior IFG in our study. These unmatched activations are probably due to the different level of cognitive processes required by the go/no-go task and the stop-signal task, such as working memory and verbalization.
IFG and successful and failure to inhibit
We found that the activity in ventral IFG was not significantly different between successful and unsuccessful inhibition, which is consistent with finding in a previous study (Aron and Poldrack, 2006). While it may seem counterintuitive, it does not necessarily contradict with the involvement of IFG in response inhibition. Based on the race model (Logan and Cowan, 1984), two conditions have to be met in order to successfully inhibit an initiated response: one is the triggering a stop process and another is that the interval between go and stop signals must be short enough for a triggered stop process to interrupt the go process before the go process reaches the threshold. The stop process is likely to be triggered in both successful and unsuccessful stops though the outcomes are different. Perhaps the ventral IFG plays a role in triggering the stop process by linking the stop signal with response inhibition (i.e., visual-motor association), but not actually in interrupting the go process per se.
However, it cannot be excluded that the ventral IFG may also be involved in other cognitive processes required by response inhibition tasks, such as orientation of attention to response-relevant external stimuli (Corbetta and Shulman, 2002), processing of infrequent visual stimuli (e.g. Linden et al., 1999) and rule representation (e.g. Bunge et al., 2003). A recent fMRI study has ruled out stimulus infrequency as a major factor for the activation of ventral IFG in response inhibition, using a modified go/no-go task (Chikazoe et al., 2009). Nonetheless, it has also been shown that the right IFG was more active during successful response inhibition than during unsuccessful response inhibition (Rubia et al., 2003). Since the staircase procedure was used in Rubia et al. study, the differences between successful and unsuccessful inhibition could also be influenced by covariant changes in SSDs and response strategy (e.g., waiting).
In contrast, the bilateral IFJ showed significantly stronger activation during successful inhibition than unsuccessful inhibition in the color stop-signal tasks and the effect was also approaching significance in the right IFJ in the orientation stop-signal task. This suggests that the IFJ may have a more direct effect on interrupting the initiated movement (go process). Previous studies have also observed activations in the IFJ during inhibition of pre-potent responses in the go/no-go task (Rubia et al., 2001) and the Stroop task (Derrfuss et al., 2004; Leung et al., 2000; Mead et al., 2002; Milham et al., 2002; Zysset et al., 2001). Recent studies further suggested that the IFJ is involved in set shifting and task switching in cognitive control tasks such as the Wisconsin Card Sorting Task (WCST) (Brass et al., 2005; Derrfuss et al., 2005). However, most cognitive control tasks do require some level of response inhibition, such as inhibition of learned task rules in the WCST. The involvement of IFJ across numerous cognitive control tasks suggests that this region may play a more general role in response inhibition during executive control of behavior. However, a recent go/no-go study found that the activation of the IFJ was more associated with processing infrequent visual stimuli (Chikazoe et al., 2009). It is thus possible that a stronger activation of the IFJ during successful inhibition is caused by a better and faster interpretation of behaviorally relevant cues (i.e., the stop signals) in conjunction with the posterior visual association regions (MTG and FG) (see below).
One limitation of the current study is that we have less unsuccessful stop trials than successful stop trials due to our focus of studying successful response inhibition. However, it is unlikely that our findings are strongly influenced by the difference in number of trials because the differentiation in activation associated with successfulness in response inhibition was not a general phenomenon across all ROIs and some were even cue specific. Another caveat is that we did not observe a strong correlation between the SSRT and the activity in either IFJ or IFG. There are two potential reasons. First, the shortest and the longest SSDs among the four SSDs used in the tasks might bias the estimation of SSRT (Band et al., 2003). Second the majority of the SSRTs were clustered within the half standard deviation range of the mean SSRT, which likely reduced the chance of finding significant correlations.
Stop-signal processing
Our results showed that the FG and MTG are strongly activated during the visually-guided stopping of manual responses. Previous studies have demonstrated that the human FG is involved in processing non-spatial visual information and the MTG in processing visuo-spatial information (Bartels and Zeki, 2000; Ungerleider and Mishkin, 1982). Consistent with previous findings, we found stronger activity in the bilateral MTG during the orientation task than during the color task. The activity in FG during the color task, however, was not significantly stronger compared to the orientation task. Since the FG is also involved in processing shapes (e.g. Haxby et al., 1991) and the visual stimuli in our two tasks are of the same shape, it is possible that the color stop signal (color change) only induced a weaker and more dispersed activation in the FG.
It is intriguing that the FG is more active on successful stop trials than on unsuccessful stop trials in the color stop-signal task, whereas the MTG is more active on successful stop trials than on unsuccessful trials in the orientation stop-signal task. The weaker activation in these regions during unsuccessful stop trials may reflect poor processing of the stop signal and hence failure in response inhibition. These findings suggest that the visual association areas may play an important role in efficient processing of the visual stop signals and interact with the IFG directly during response inhibition.
Conclusion
Our study provided novel results showing that the right ventral posterior IFG is equally involved in response inhibition cued by different visual signals, while previous studies in non-human primates have shown that many neurons respond to multiple features and neurons with specific and nonspecific preferences are intermixed within the lateral prefrontal cortex (Sakagami et al., 2001). We cannot rule out the possibility that the sensory specificity may exist at the cellular level but undetectable by the spatial resolution of fMRI. Nonetheless, our findings suggest that the ventral IFG may be involved in the stimulus-response association end of the stop process whereas the IFJ may be involved in successful inhibition of manual responses. Our data also provide evidence showing that the FG and MTG contribute to visual processing of stop signals during response inhibition. However, we cannot exclude the possibility that the activation of the IFG may also be partially associated with other cognitive processes involved in response inhibition, such as orientation of attention, representation of stop signals and retrieval and maintenance of task rules. Indeed, the IFG has been implicated in various cognitive functions including attentional orientation to response-relevant stimuli (Corbetta and Shulman, 2002) and rule representation (Bunge et al., 2003; Sakai and Passingham, 2006). It is becoming clear that the IFG is functional heterogeneous. Further studies are needed to distinguish the neural activity during motor response inhibition in comparison with other cognitive processes involved in response inhibition tasks.
4. Experimental Procedure
Subjects
Twelve healthy young adults (aged between 18 – 36 yrs, 6 male and 6 female) were recruited from the university campus and the psychology subject pool. None had a history of neurological, psychiatric or addictive disorders according to self-report. All subjects had normal or corrected to normal vision. They were all right handed, with the Edinburgh handedness scores ranging from 0.83 to 1 (Oldfield, 1971). All subjects provided written consent, which is approved by the local IRB.
Color and Orientation Stop-signal tasks
The stop-signal task consists of a mixture of go trials and stop trials (Figure 1). On each trial, after the presentation of a central fixation (a bar) for 300ms, a bar (go signal) was presented visually on either the left or right side of the screen at about 10 degrees of eccentricity from the central fixation. On go trials, subjects were asked to respond as quickly as possible by pressing the left or right button in correspondence to the side of the go signal using their left or right thumbs. On stop trials (about 30% of trials), shortly after the presentation of the go signal, the central bar changed (stop signal) in either color (in the color task) or orientation (in the orientation task) for 300ms. There were 4 colors (orange, blue, cyan and purple) and 4 orientations (0°, 45°, 90° and 135°). To equate the visual perceptual experience across the two tasks, bars with a different orientation were used in different runs of the color stop-signal task and bars with a different color were used in different runs of the orientation stop-signal task. Namely, the two tasks were identical except for the specified change in visual feature in association with their stop signal. Subjects were told to try their best to withhold from making a button press once they saw the stop signal. A go response was considered successful if a correct response was made within a 700-ms time window. A stop response was considered successful if no response was made within a 1-second time window. The delay interval between go signal and stop signal is called stop signal delays (SSDs). Fixed SSDs were used in this study instead of the staircase procedure to avoid the potential confounding effect of covariant changes in SSD and response strategy (e.g. waiting) when comparing successful and unsuccessful response inhibition trials. Four SSDs were determined individually using their behavioral data from a training session prior to scanning (see below). The stop signal reaction time (SSRT), the reaction time to cancel an initiated response, was calculated using an integration method following the race model (Logan and Cowan, 1984). SSRT=T−SSD, where T is the point when the integration of go reaction times equals to the proportion of unsuccessful stop trials. SSRT was determined using this formula for each SSD for each subject.
General Procedures and Apparatus
Each subject was trained extensively on the stop-signal task (4 runs) before scanning. The task used for training was similar to the main task described above, except a circle was used as the stop signal instead of a color or an orientation change. Five SSDs (25, 100, 175, 250, 325ms) were used and they were randomly assigned across the stop trials of each run. Based on the training data, four SSDs were adjusted to achieve an overall accuracy of 70% accuracy on stop trials and to cover the entire stop accuracy range (0–100%). We equated at a higher accuracy because our main focus was to study successful response inhibition guided by different stop signals.
During the fMRI experiment, each subject performed 3 runs of the color stop-signal task and 3 runs of the orientation stop-signal task. The color and orientation runs were counterbalanced within and across subjects. The sequence of go and stop trials in each run was generated using the optseq program, which was designed to optimize the sensitivity to detect task-related changes in BOLD signal (Dale, 1999) (http://surfer.nmr.mgh.harvard.edu/optseq). Each run consisted of 34 go trials, 16 stop trials and 56 null events. Null events were intervals during which subjects merely fixated at the center of the screen. The interval between two consecutive go signals varied between 3 to 9 s (averaged 4.68 s). Each run was finished with a blank period (21s) during which the central fixation bar was displayed in the center of the screen.
Visual stimuli were rear-projected onto a screen positioned at the back of the magnet bore opening. Subjects viewed the visual stimuli through a mirror mounted on the head coil. Stimuli presentation was controlled and response data were collected with E-prime version 1.1.4.1 (Psychology Software Tools, Pittsburgh, PA) running on the Windows XP operation system on a personal computer (PC) (Pentium 4, Dell Dimension 5100, Dell Inc). A response box interfaced with the PC through the parallel port was used for collecting manual responses.
Image acquisition and protocol
MR images were acquired using a Philips 3 T Achieva system with an eight-channel SENSE head coil (Cleveland, OH). Head movement was minimized using foam padding and a tape across the forehead. We first collected a series of high-resolution structural 3D images (T1-weighted, 3D turbo field echo, 176 sagittal slices, slice thickness=1mm, TR/TE=9.9/4.6ms, matrix=256×256, FOV=25×25cm). A series of T1-weighted inplane structural images was then collected parallel to the anterior-posterior commissural (AC-PC) line (24 axial slices, slice thickness=5mm, TR/TE=300/5.0ms, Matrix=256×256, FOV=22×22cm). Seven series of functional images were acquired along the same AC-PC plane using a standard T2*-sensitive gradient-recalled single shot echo planar pulse sequence (24 axial slices, 5mm thick, interleaved, TR/TE=1500/30ms, Matrix=64×64, FOV=22×22cm, Flip angle=80°, 170 volumes/session [255 s]).
Image processing
Image processing was carried out using Statistical Parametric Mapping version 2 (SPM2, Welcome Department of Imaging Neuroscience, University College London, http://www.fil.ion.ucl.ac.uk/spm/). DICOM (Digital Imaging and Communications in Medicine) images were first converted into analyzed image format using MRIcro version 1.40 (http://www.sph.sc.edu/comd/rorden/mricro.html). Images were screened for obvious artifacts such as ghosting and motion. Runs with images showing large motion and artifact were removed from analysis. The first four images of each series of functional images were discarded in each run to allow T1 signal to achieve equilibrium. Remaining images were corrected for slice timing and realigned to correct for head motion. Functional series with images of greater than 3mm translational and 2° of rotational motion were excluded from data analysis. A mean functional image volume was derived for each individual using the realigned images. The inplane and high-resolution 3D anatomical images were segmented into grey and white matter and co-registered with the mean functional image. The segmented inplane image was then normalized to the Montreal Neurological Institute (MNI) grey matter template, using a 12-parameter affine registration followed by a series of nonlinear transformations (Friston et al., 1995). The normalization parameters were then applied to all the realigned functional images. Finally, all functional images were spatially smoothed with a Gaussian kernel of 8mm at full-width at half maximum (FWHM) and were high-pass filtered with a cutoff of 1/128 Hz.
Image analysis
The design matrix consisted of seven vectors: left go (G), right G, left successful stop (SS), right SS, left unsuccessful stop (US), right US, and missed go in each stop-signal task (Because we did not find differences in left and right stopping responses, they were combined in the results described below). Each vector was constructed using the onset times of the relevant trials. Each vector was convolved with a canonical hemodynamic response function and entered as a regressor in the general linear model (GLM) (Friston et al. 1995). To eliminate artifacts caused by task-related motion, six motion parameters were entered as covariates. This procedure was recently shown to increase the signal-to-noise ratio and improve task effects estimated using the GLM (Johnstone et al., 2006). For voxel-wise analysis, estimated parameters (beta values) were calculated and assigned to each voxel for each condition of each task. A random effects model was applied to generate group contrast maps. Activations corresponding to response inhibition were identified using the SS-G contrast for each stop-signal task using a simple t-test. A combination of significance threshold (p<0.001 uncorrected) and cluster filter (9 contiguous voxels) was applied to all contrasts. A paired t-test was conducted to compare and contrast cortical activations involved in response inhibition during the two stop-signal tasks (color [SS-G] versus orientation [SS-G]). To reveal areas commonly involved in response inhibition processes cued by different sensory cues, we also applied a conjunction analysis using the SS-G contrasts from the color and orientation stop-signal tasks (Friston et al., 2005; Nichols et al., 2005). The conjunction analysis was assessed using a significance threshold of p<0.001 (uncorrected) in order to show activations that are suprathreshold in both SS-G contrasts.
The coordinates of the activation peaks were reported based on MNI system. We conducted ROI analysis to investigate the differences in response inhibition cued by color and orientation stop signals and to confirm the observed common activations. Since the literature showed that the human fusiform gyrus (FG) has two functional subdivisions for color processing, anterior FG (FGa) and posterior FG (FGp) (Bartels and Zeki, 2000), we defined two ROIs in the fusiform gyrus (FGa with y coordinate > −65mm and FGp with y coordinate ≤−65mm) using the color SS-G contrast. We also defined an ROI in the MTG using the orientation SS-G contrast. The MTG has been associated with processing visuo-spatial information (Ungerleider and Mishkin, 1982; Wilms et al., 2005). Ventral IFG and IFJ ROIs were defined using the SS-G contrasts for both stop-signal tasks as well as the conjunction map. All ROIs were spheres of 8-mm radius with the center at the peak activation coordinates. Data from each subject were extracted from the ROIs using Marsbar (Brett et al., 2002) (http://marsbar.sourceforge.net/), and beta-values were compared using paired t-test.
Acknowledgments
This work was supported by the State University of New York at Stony Brook, a Drescher Award and NIH DA023044. We thank Dr. Mark Wagshul and the staff of Department of Radiology for their generous support.
Footnotes
Publisher's Disclaimer: This is a PDF file of an unedited manuscript that has been accepted for publication. As a service to our customers we are providing this early version of the manuscript. The manuscript will undergo copyediting, typesetting, and review of the resulting proof before it is published in its final citable form. Please note that during the production process errors may be discovered which could affect the content, and all legal disclaimers that apply to the journal pertain.
References
- Aron AR, Fletcher PC, Bullmore ET, Sahakian BJ, Robbins TW. Stop-signal inhibition disrupted by damage to right inferior frontal gyrus in humans. Nat Neurosci. 2003;6:115–6. doi: 10.1038/nn1003. [DOI] [PubMed] [Google Scholar]
- Aron AR, Robbins TW, Poldrack RA. Inhibition and the right inferior frontal cortex. Trends Cogn Sci. 2004;8:170–7. doi: 10.1016/j.tics.2004.02.010. [DOI] [PubMed] [Google Scholar]
- Aron AR, Poldrack RA. Cortical and subcortical contributions to Stop signal response inhibition: role of the subthalamic nucleus. J Neurosci. 2006;26:2424–33. doi: 10.1523/JNEUROSCI.4682-05.2006. [DOI] [PMC free article] [PubMed] [Google Scholar]
- Aron AR, Behrens TE, Smith S, Frank MJ, Poldrack RA. Triangulating a cognitive control network using diffusion-weighted magnetic resonance imaging (MRI) and functional MRI. J Neurosci. 2007;27:3743–52. doi: 10.1523/JNEUROSCI.0519-07.2007. [DOI] [PMC free article] [PubMed] [Google Scholar]
- Band GP, van der Molen MW, Logan GD. Horse-race model simulations of the stop-signal procedure. Acta Psychol (Amst) 2003;112:105–42. doi: 10.1016/s0001-6918(02)00079-3. [DOI] [PubMed] [Google Scholar]
- Bartels A, Zeki S. The architecture of the colour centre in the human visual brain: new results and a review. Eur J Neurosci. 2000;12:172–93. doi: 10.1046/j.1460-9568.2000.00905.x. [DOI] [PubMed] [Google Scholar]
- Brass M, Derrfuss J, Forstmann B, von Cramon DY. The role of the inferior frontal junction area in cognitive control. Trends Cogn Sci. 2005;9:314–6. doi: 10.1016/j.tics.2005.05.001. [DOI] [PubMed] [Google Scholar]
- Brett M, Anton JL, Valabregue R, Poline JB. Region of interest analysis using an SPM toolbox. In: 8th International Conference on Functional Mapping of the Human Brain, Sendai, Japan. NeuroImage. 2002;16 [Google Scholar]
- Bunge SA, Kahn I, Wallis JD, Miller EK, Wagner AD. Neural circuits subserving the retrieval and maintenance of abstract rules. J Neurophysiol. 2003;90:3419–28. doi: 10.1152/jn.00910.2002. [DOI] [PubMed] [Google Scholar]
- Chambers CD, Bellgrove MA, Stokes MG, Henderson TR, Garavan H, Robertson IH, Morris AP, Mattingley JB. Executive “brake failure” following deactivation of human frontal lobe. J Cogn Neurosci. 2006;18:444–55. doi: 10.1162/089892906775990606. [DOI] [PubMed] [Google Scholar]
- Chambers CD, Bellgrove MA, Gould IC, English T, Garavan H, McNaught E, Kamke M, Mattingley JB. Dissociable mechanisms of cognitive control in prefrontal and premotor cortex. J Neurophysiol. 2007;98:3638–47. doi: 10.1152/jn.00685.2007. [DOI] [PubMed] [Google Scholar]
- Chikazoe J, Jimura K, Asari T, Yamashita KI, Morimoto H, Hirose S, Miyashita Y, Konishi S. Functional Dissociation in Right Inferior Frontal Cortex during Performance of Go/No-Go Task. Cereb Cortex. 2009;19(1):146–52. doi: 10.1093/cercor/bhn065. [DOI] [PubMed] [Google Scholar]
- Corbetta M, Shulman GL. Control of goal-directed and stimulus-driven attention in the brain. Nat Rev Neurosci. 2002;3:201–15. doi: 10.1038/nrn755. [DOI] [PubMed] [Google Scholar]
- Dale AM. Optimal experimental design for event-related fMRI. Hum Brain Mapp. 1999;8:109–14. doi: 10.1002/(SICI)1097-0193(1999)8:2/3<109::AID-HBM7>3.0.CO;2-W. [DOI] [PMC free article] [PubMed] [Google Scholar]
- Derrfuss J, Brass M, von Cramon DY. Cognitive control in the posterior frontolateral cortex: evidence from common activations in task coordination, interference control, and working memory. Neuroimage. 2004;23:604–12. doi: 10.1016/j.neuroimage.2004.06.007. [DOI] [PubMed] [Google Scholar]
- Derrfuss J, Brass M, Neumann J, von Cramon DY. Involvement of the inferior frontal junction in cognitive control: meta-analyses of switching and Stroop studies. Hum Brain Mapp. 2005;25:22–34. doi: 10.1002/hbm.20127. [DOI] [PMC free article] [PubMed] [Google Scholar]
- Friston KJ, Holmes AP, Poline JB, Grasby PJ, Williams SC, Frackowiak RS, Turner R. Analysis of fMRI time-series revisited. Neuroimage. 1995;2:45–53. doi: 10.1006/nimg.1995.1007. [DOI] [PubMed] [Google Scholar]
- Friston KJ, Penny WD, Glaser DE. Conjunction revisited. Neuroimage. 2005;25:661–7. doi: 10.1016/j.neuroimage.2005.01.013. [DOI] [PubMed] [Google Scholar]
- Garavan H, Ross TJ, Stein EA. Right hemispheric dominance of inhibitory control: an event-related functional MRI study. Proc Natl Acad Sci U S A. 1999;96:8301–6. doi: 10.1073/pnas.96.14.8301. [DOI] [PMC free article] [PubMed] [Google Scholar]
- Haxby JV, Grady CL, Horwitz B, Ungerleider LG, Mishkin M, Carson RE, Herscovitch P, Schapiro MB, Rapoport SI. Dissociation of object and spatial visual processing pathways in human extrastriate cortex. Proc Natl Acad Sci U S A. 1991;88:1621–5. doi: 10.1073/pnas.88.5.1621. [DOI] [PMC free article] [PubMed] [Google Scholar]
- Johnstone T, Ores Walsh KS, Greischar LL, Alexander AL, Fox AS, Davidson RJ, Oakes TR. Motion correction and the use of motion covariates in multiple-subject fMRI analysis. Hum Brain Mapp. 2006;27:779–88. doi: 10.1002/hbm.20219. [DOI] [PMC free article] [PubMed] [Google Scholar]
- Konishi S, Nakajima K, Uchida I, Sekihara K, Miyashita Y. No-go dominant brain activity in human inferior prefrontal cortex revealed by functional magnetic resonance imaging. Eur J Neurosci. 1998;10:1209–13. doi: 10.1046/j.1460-9568.1998.00167.x. [DOI] [PubMed] [Google Scholar]
- Konishi S, Nakajima K, Uchida I, Kikyo H, Kameyama M, Miyashita Y. Common inhibitory mechanism in human inferior prefrontal cortex revealed by event-related functional MRI. Brain. 1999;122(Pt 5):981–91. doi: 10.1093/brain/122.5.981. [DOI] [PubMed] [Google Scholar]
- Leung HC, Skudlarski P, Gatenby JC, Peterson BS, Gore JC. An event-related functional MRI study of the stroop color word interference task. Cereb Cortex. 2000;10:552–60. doi: 10.1093/cercor/10.6.552. [DOI] [PubMed] [Google Scholar]
- Leung HC, Cai W. Common and differential ventrolateral prefrontal activity during inhibition of hand and eye movements. J Neurosci. 2007;27:9893–900. doi: 10.1523/JNEUROSCI.2837-07.2007. [DOI] [PMC free article] [PubMed] [Google Scholar]
- Li CS, Huang C, Constable RT, Sinha R. Imaging response inhibition in a stop-signal task: neural correlates independent of signal monitoring and post-response processing. J Neurosci. 2006;26:186–92. doi: 10.1523/JNEUROSCI.3741-05.2006. [DOI] [PMC free article] [PubMed] [Google Scholar]
- Linden DE, Prvulovic D, Formisano E, Vollinger M, Zanella FE, Goebel R, Dierks T. The functional neuroanatomy of target detection: an fMRI study of visual and auditory oddball tasks. Cereb Cortex. 1999;9:815–23. doi: 10.1093/cercor/9.8.815. [DOI] [PubMed] [Google Scholar]
- Logan GD, Cowan WB, Davis KA. On the ability to inhibit simple and choice reaction time responses: a model and a method. J Exp Psychol Hum Percept Perform. 1984;10:276–91. doi: 10.1037//0096-1523.10.2.276. [DOI] [PubMed] [Google Scholar]
- Mead LA, Mayer AR, Bobholz JA, Woodley SJ, Cunningham JM, Hammeke TA, Rao SM. Neural basis of the Stroop interference task: response competition or selective attention? J Int Neuropsychol Soc. 2002;8:735–42. doi: 10.1017/s1355617702860015. [DOI] [PubMed] [Google Scholar]
- Menon V, Adleman NE, White CD, Glover GH, Reiss AL. Error-related brain activation during a Go/NoGo response inhibition task. Hum Brain Mapp. 2001;12:131–43. doi: 10.1002/1097-0193(200103)12:3<131::AID-HBM1010>3.0.CO;2-C. [DOI] [PMC free article] [PubMed] [Google Scholar]
- Milham MP, Erickson KI, Banich MT, Kramer AF, Webb A, Wszalek T, Cohen NJ. Attentional control in the aging brain: insights from an fMRI study of the stroop task. Brain Cogn. 2002;49:277–96. doi: 10.1006/brcg.2001.1501. [DOI] [PubMed] [Google Scholar]
- Miyake A, Friedman NP, Emerson MJ, Witzki AH, Howerter A, Wager TD. The unity and diversity of executive functions and their contributions to complex “Frontal Lobe” tasks: a latent variable analysis. Cognit Psychol. 2000;41:49–100. doi: 10.1006/cogp.1999.0734. [DOI] [PubMed] [Google Scholar]
- Nichols T, Brett M, Andersson J, Wager T, Poline JB. Valid conjunction inference with the minimum statistic. Neuroimage. 2005;25:653–60. doi: 10.1016/j.neuroimage.2004.12.005. [DOI] [PubMed] [Google Scholar]
- Oldfield RC. The assessment and analysis of handedness: the Edinburgh inventory. Neuropsychologia. 1971;9:97–113. doi: 10.1016/0028-3932(71)90067-4. [DOI] [PubMed] [Google Scholar]
- Petrides M, Pandya DN. Comparative cytoarchitectonic analysis of the human and the macaque ventrolateral prefrontal cortex and corticocortical connection patterns in the monkey. Eur J Neurosci. 2002;16:291–310. doi: 10.1046/j.1460-9568.2001.02090.x. [DOI] [PubMed] [Google Scholar]
- Ramautar JR, Kok A, Ridderinkhof KR. Effects of stop-signal modality on the N2/P3 complex elicited in the stop-signal paradigm. Biol Psychol. 2006;72:96–109. doi: 10.1016/j.biopsycho.2005.08.001. [DOI] [PubMed] [Google Scholar]
- Rubia K, Russell T, Overmeyer S, Brammer MJ, Bullmore ET, Sharma T, Simmons A, Williams SC, Giampietro V, Andrew CM, Taylor E. Mapping motor inhibition: conjunctive brain activations across different versions of go/no-go and stop tasks. Neuroimage. 2001;13:250–61. doi: 10.1006/nimg.2000.0685. [DOI] [PubMed] [Google Scholar]
- Rubia K, Smith AB, Brammer MJ, Taylor E. Right inferior prefrontal cortex mediates response inhibition while mesial prefrontal cortex is responsible for error detection. Neuroimage. 2003;20:351–8. doi: 10.1016/s1053-8119(03)00275-1. [DOI] [PubMed] [Google Scholar]
- Rubia K, Smith AB, Taylor E, Brammer M. Linear age-correlated functional development of right inferior fronto-striato-cerebellar networks during response inhibition and anterior cingulate during error-related processes. Hum Brain Mapp. 2007;28:1163–77. doi: 10.1002/hbm.20347. [DOI] [PMC free article] [PubMed] [Google Scholar]
- Sakagami M, Tsutsui K, Lauwereyns J, Koizumi M, Kobayashi S, Hikosaka O. A code for behavioral inhibition on the basis of color, but not motion, in ventrolateral prefrontal cortex of macaque monkey. J Neurosci. 2001;21:4801–8. doi: 10.1523/JNEUROSCI.21-13-04801.2001. [DOI] [PMC free article] [PubMed] [Google Scholar]
- Sakai K, Passingham RE. Prefrontal set activity predicts rule-specific neural processing during subsequent cognitive performance. J Neurosci. 2006;26:1211–8. doi: 10.1523/JNEUROSCI.3887-05.2006. [DOI] [PMC free article] [PubMed] [Google Scholar]
- Shallice T, Burgess P. Supervisory control of action and thought selection. In: Baddeley LW, editor. Attention: selection, awareness, and control: a tribute to Donald Broadbent. Clarendon; Oxford: 1993. pp. 171–187. [Google Scholar]
- Shallice T, Burgess P, Robertson I. The domain of supervisory processes and temporal organization of behaviour. Philos Trans R Soc Lond B Biol Sci. 1996;351:1405–11. doi: 10.1098/rstb.1996.0124. discussion 1411-2. [DOI] [PubMed] [Google Scholar]
- Simmonds DJ, Pekar JJ, Mostofsky SH. Meta-analysis of Go/No-go tasks demonstrating that fMRI activation associated with response inhibition is task-dependent. Neuropsychologia. 2008;46:224–32. doi: 10.1016/j.neuropsychologia.2007.07.015. [DOI] [PMC free article] [PubMed] [Google Scholar]
- Ungerleider LG, Mishkin M. Two cortical visual systems. In: Ingle DJ, Goodale MA, Mansfield RJW, editors. Analysis of Visual Behavior. The MIT Press; Cambridge: 1982. pp. 549–586. [Google Scholar]
- Wilms M, Eickhoff SB, Specht K, Amunts K, Shah NJ, Malikovic A, Fink GR. Human V5/MT+: comparison of functional and cytoarchitectonic data. Anat Embryol (Berl) 2005;210:485–95. doi: 10.1007/s00429-005-0064-y. [DOI] [PubMed] [Google Scholar]
- Xue G, Aron AR, Poldrack RA. Common Neural Substrates for Inhibition of Spoken and Manual Responses. Cereb Cortex. 2008;18(8):1923–32. doi: 10.1093/cercor/bhm220. [DOI] [PubMed] [Google Scholar]
- Zysset S, Muller K, Lohmann G, von Cramon DY. Color-word matching stroop task: separating interference and response conflict. Neuroimage. 2001;13:29–36. doi: 10.1006/nimg.2000.0665. [DOI] [PubMed] [Google Scholar]