Abstract
Sporadic Parkinson's disease (sPD) is a nervous system-wide disease that presents with a bradykinetic movement disorder and frequently progresses to include depression and cognitive impairment. Cybrid models of sPD are based on expression of sPD platelet mitochondrial DNA (mtDNA) in neural cells and demonstrate some similarities to sPD brains. In sPD and CTL cybrids we characterized aspects of mitochondrial biogenesis, mtDNA genomics, composition of the respirasome and the relationships among isolated mitochondrial and intact cell respiration. Cybrid mtDNA levels varied and correlated with expression of PGC-1α a transcriptional co-activator regulator of mitochondrial biogenesis. Levels of mtDNA heteroplasmic mutations were asymmetrically distributed across the mitochondrial genome; numbers of heteroplasmies were more evenly distributed. Neither levels nor numbers of heteroplasmies distinguished sPD from CTL. sPD cybrid mitochondrial ETC subunit protein levels were not altered. Isolated mitochondrial complex I respiration rates showed limited correlation with whole cell complex I respiration rates in both sPD and CTL cybrids. Intact cell respiration during the normoxic-anoxic transition yielded Km values for oxygen that directly related to respiration rates in CTL but not in sPD cell lines. Both sPD and CTL cybrid cells are substantially heterogeneous in mitochondrial genomic and physiologic properties. Our results suggest that mtDNA depletion may occur in sPD neurons and could reflect impairment of mitochondrial biogenesis. Cybrids remain a valuable model for some aspects of sPD but their heterogeneity mitigates against a simple designation of sPD phenotype in this cell model.
Keywords: Parkinson's disease; cybrid, mitochondrial biogenesis, mitochondrial DNA, heteroplasmy, respiration
Introduction
Sporadically occurring Parkinson's disease (sPD) is the most commonly occurring neurodegenerative movement disorder of adults. Dopamine neurons in the substantia nigra are the most vulnerable to degeneration in sPD, which for many years was discussed exclusively as a nigral dopaminergic degeneration disorder. Recent studies have reshaped our vision of sPD and revealed that it is a nervous system-wide disorder that exhibits protein aggregation pathology initially in gut enteric neurons, followed by vagal motorneurons years before advancing rostrally into substantia nigra. Appearance of nigral pathology beyond the clinical motor symptom threshold is followed by further rostral advance of protein aggregation pathology into limbic and frontal cortical areas (Braak, et al., 2001, Braak, et al., 2006, Braak, et al., 2003, Braak, et al., 2004, Braak, et al., 1999). This extensive temporal neuropathological nature of sPD correlates with additional frequent clinical manifestations of sPD such as depression, cognitive impairment and autonomic dysfunction.
We and others have pursued the hypothesis that sPD is a systemic mitochondrial disorder with widespread bioenergetic deficiencies, where the clinical expression primarily affects nervous tissue and targets nigra for neurodegeneration. Recent support for this hypothesis derived from analysis of mtDNA deletions in nigral neurons from aging and sPD subjects (Bender, et al., 2006, Bender, et al., 2008, Kraytsberg, et al., 2006, Reeve, et al., 2008). Loss of detectable cytochrome oxidase histochemical activity was associated with increased proportion of deleted mtDNA's that had unique boundaries across different subjects, suggesting the possibility of clonal expansion of mtDNA deletions within neuronal populations.
We pursued this hypothesis with the cybrid (“cytoplasmic hybrid”) model in which donor platelet mtDNA is expressed in human neural SH-SY5Y neuroblastoma cells devoid of endogenous mtDNA from chronic ethidium bromide treatment (Borland, et al., 2009, Cassarino, et al., 1997, Parker and Swerdlow, 1998, Swerdlow, 2007, Swerdlow, et al., 2001, Swerdlow, et al., 1998, Swerdlow, et al., 1996, Trimmer and Bennett, 2009, Trimmer, et al., 2000). These mtDNA-depleted rho0 cells require metabolic support and are passed as a single cell line. By creating cybrid lines from sPD and age-matc0hed clinical controls in the same rho0 line, donor mtDNA is selectively amplified against constant host and environmental backgrounds. In our sPD cybrids, certain lines spontaneously form Lewy body inclusions with all the morphological and biochemical properties of Lewy bodies found in sPD nigral neurons (Trimmer, et al., 2004).
We undertook the present study to characterize further the relationship between mtDNA genotypes and respiratory phenotypes that might distinguish sPD from CTL cybrids and to begin to explore the role of mitochondrial biogenesis signaling. We used qPCR and mismatch cleaving enzyme (Surveyor Nuclease®) (Bannwarth, et al., 2005, Bannwarth, et al., 2006) for initial characterization of mtDNA abundances and heteroplasmies in Lewy body-forming sPD cybrid cell lines. We also determined the levels of multiple electron transport chain (ETC) proteins and respiratory properties of intact cybrid cells metabolizing glucose compared to those of their isolated mitochondria metabolizing complex I or complex II substrates. Finally, we characterized the respiration of cybrid cells during their normoxic-anoxic transitions to estimate apparent affinity constants of their ETC's for oxygen (Gnaiger, 2003, Pecina, et al., 2004).
We find that sPD cybrids are notably heterogeneous in these properties, implying that donor mtDNA's expressed in the cybrid lines exert substantial influence over mitochondrial biogenesis and physiology. Although cybrids can reflect sPD protein aggregation pathology, at the mitochondrial genomic and physiological levels they do not sort easily into disease-specific groups.
Materials and methods
Cybrid creation
Cybrid cell lines were created by fusing platelets from individuals with idiopathic (sporadic) Parkinson's disease (sPD) or disease-free controls (CTL) with rho0 cells created in SH-SY5Y neuroblastoma cells by long-term exposure to ethidium bromide to deplete selectively mitochondrial DNA (mtDNA). Blood samples were collected under an IRB-approved protocol, and details of cybrid creation are provided elsewhere (Swerdlow et al., 1996; Swerdlow et al., 1998; Trimmer et al., 2004). Cybrid cell lines were routinely cultured in growth medium (GM), consisting of high glucose DMEM with 10% FBS, 100 μg/ml pyruvate, 50 μg/ml uridine, and antibiotic-antimycotic: 100 Units/ml penicillin G, 100μg/ml streptomycin, 0.25 μg/ml amphotericin β. Cells were fed every 2-3 days and passed once a week.
Isolation of purified mitochondria from cybrid cells
SH-SY5Y, rho0, sPD and CTL cybrid cell lines were grown in high glucose Dulbecco's modified Eagle's medium (Gibco, Grand Island, NY) supplemented with 10% fetal bovine serum, uridine (50 ug/ml) and pyruvate (100 ul/ml) in T175 flasks. Medium was changed every 2 to 4 days and cultures were passed as they approached confluence. Purified mitochondria were prepared by a modification of the method of Graziewicz et al (Graziewicz, et al., 2002). For each cybrid line, cells were scraped from 20 to 30 confluent T175 flasks, washed twice with PBS and pelleted at 200 × g for 10 min. Pellets were resuspended in 9 volumes of HDB buffer (5 mM KHPO4, 2 mM MgCl2, 1 mM 2-mercaptoethanol, 1 mM PMSF and 1:100 Protease Inhibitor Cocktail Set I (Calbiochem, San Diego, CA), pH7.5) and held on ice for 1.5 hours. The cell suspension was then homogenized for 50 passes using a Dounce homogenizer (0.05 mm clearance). An equal volume of 2.5X Mannitol-Sucrose buffer (0.525 M mannitol, 0.175 M sucrose, 5 mM Tris-HCl, 5 mM EDTA, 5 mM MgCl2, pH 7.5) was added to the homogenate and the suspension centrifuged for 10 min. at 470 × g, 4° C. The supernatant was saved and the pellet resuspended in 1X Mannitol-Sucrose buffer. Both the first supernatant and pellet suspension were centrifuged for 10 min. at 470 × g at 4° C. Both second spin supernatants were collected and centrifuged for 20 min. at 17,000 × g at 4° C. The resulting pellet was resuspended in 10 ml mitochondrial isolation buffer (0.15 M KCl, 20 mM K phosphate, 1 mM EDTA, pH 7.6) using 10 passes in a glass-teflon homogenizer (0.15 mm clearance) and layered onto gradients of 12 ml 10 % Ficoll, 10 ml 7.5% Ficoll (w/v in isolation buffer). Gradients were ultracentrifuged for 40 min at 85,470 × g at 4° C. The final purified mitochondrial pellet was processed as described below.
Real-time quantitative PCR
We used both SybrGreen detection of individual double-stranded DNA PCR products and multiplex PCR simultaneous detection of up to four PCR products. iScript reverse transcriptase, iQ SybrGreen PCR mix and iQ Powermix were obtained from BioRad. All PCR primers were designed using Beacon Designer software and custom synthesized and HPLC purified by Sigma-Genosys, Operon or InVitrogen. Equal amounts of total RNA (1 μg.) from cybrid cells were reverse transcribed simultaneously into cDNA using the same batch of iScript and random hexamer primers. Each PCR assay for individual mitochondrial genes or D-loop was carried out in 25 uL volume in triplicate or quadruplicate and utilized a full-length human mtDNA PCR-generated using primers at the BamH1 site in ND6 and Roche Expand Long Template PCR mix. The substrate for generating this mtDNA copy number standard was Roche human genomic DNA. The purified 16.5 kbase band was assayed using a QuantIT DNA kit and converted to copy number. The qPCR conditions for mtDNA genes were activation at 95°C for 5 min, followed by 50 cycles of 95°C melting for 10 sec/50°C annealing/extension for 1 min. Primers and probes were used at 250 nM. ~2 kbase amplicons of the mtDNA coding region used primers A-H as described in Bannwarth, et al. (Bannwarth, et al., 2006) qPCR conditions for these amplicons used SybrGreen detection and 25 nM [primers]; cycle conditions were 95 °C for 3 min, then 50 cycles of 95 °C for 30sec, 57 °C for 30sec, 72 °C for 4min. Circular mtDNA standards for qPCR analysis of amplicons from these primers were made from Roche human genomic DNA treated with Plasmid-Safe exonuclease followed by purification on Mobio columns. Roche genomic DNA served as the standard for qPCR assays of 18S rRNA gene. Human fetal brain total RNA (Clontech) was reverse transcribed into cDNA and used as a qPCR standard for estimation of relative PGC-1α levels in cybrid cDNA samples.
Surveyor Nuclease® Assay for mtDNA Mismatches
The concentration of DNA in amplicons from primers A-H was estimated after separation on a 0.8% E-gel and comparing with the Gel-Doc (BioRad) their band intensity to the intensity of the bands in the 1kb ladder whose concentration is known. 400ng of amplicon DNA was mixed with 2ul of “Enhancer” and 2ul Surveyor Nuclease® to 0.2mL PCR tubes on ice that were then mixed and incubated at 42°C for 60 min. Tubes were then transferred to ice and 2ul of Stop Solution added. Controls (undigested amplicons) were run alongside their corresponding digests on 12K DNA chips (Experion®, BioRad).
Western blot of mitochondria for ETC proteins
100 ug of total cell protein or 25 ug of purified mitochondrial protein were loaded onto 4-12% Bis-Tris CriterionTM precast gels (BioRad) and separated. The proteins were then transferred to nitrocellulose membranes using the iBlot transfer system (Invitrogen). Complex I subunits were detected by immunoblotting using the following antibodies purchased from Mitosciences: MS111 against subunit NDUFA9 at 1.125 μg/mL, MS110 against subunit NDUFS3 at 0.5 μg/mL, MS109 against an 8kDa subunit at 1 μg/mL, MS107 against subunit NDUFB4 at 0.5 μg/mL, and MS105 against subunit NDUFB8 followed by an IRDye® 800 goat anti-mouse secondary at 1:15,000 (Li-cor). Subunits from complexes I-V were detected by immunoblotting using the Mitoprofile® human total OXPHOS complexes detection kit at 1:575 (Mitosciences) followed by an IRDye® 800 goat anti-mouse secondary at 1:25,000 (Li-cor). Mitofilin was assayed as an estimate of mitochondrial mass in each sample and was detected by immunoblotting using the MSM02 antibody at 2 μg/mL purchased from Mitosciences followed by an IRDye® 800 goat anti-mouse secondary (Li-cor). Beta-actin was used as a loading control for cellular proteins and was detected by immunoblotting using a polyclonal beta-actin antibody purchased from Abcam followed by an IRDye® 680 goat anti-rabbit secondary at 1:15,000 (Li-cor). The membranes were visualized and bands quantified using the Odyssey infrared imaging system (Li-Cor).
Measurement of respiration of intact cybrid cells
PD and CTL undifferentiated cybrid cells were grown to 80-90% confluence and harvested with trypsin. Aliquots of 2 to 5 million cells/ml in serum-free, high-glucose DMEM were studied in an Oroboros Oxygraph II respirometer in the intact state using a “high resolution respirometry” approach (Hutter et al., 2006). The Oxygraph instrument and software provide real-time output of both oxygen levels and oxygen consumption rates in each of the two 2.0 ml analysis chambers. Each cell line was studied in duplicate, and experiments were repeated 2-4 times for each cell line. After stabilization, baseline respiration rates were determined, followed by measurement of respiration in the presence of 2 ug/ml oligomycin to inhibit ATP synthase. Pulsed 0.5 ul aliquots of 100 μM FCCP were then added every 30 seconds to promote gradual uncoupling of respiration to the maximum uncoupled state, followed by addition of 0.1 uM rotenone (final concentration) to inhibit complex I, then 2.5 uM antimycin A/0.5 uM myxothiazole to inhibit complex III. Aliquots of cells were saved for measurement of mitochondrial mass using MitoTracker Green (MTG) dye (InVitrogen, Carlsbad, CA) based on cardiolipin external standards. Dilutions of cell suspensions were incubated for 20 min at 37o C in 32 nM MTG/0.1% Triton X-100/PBS then read on a Tecan plate reader at 485 nM excitation/ 535 nm emission. Cardiolipin external standards gave a linear response over the range of 2 to 10 ug/ml. Respiration rates under each condition were calculated on a per-million live cells and per-mg cardiolipin basis.
Measurement of respiration of isolated cybrid mitochondria
During the course of isolating cybrid cell mitochondria, 1/4th of the P2 pellet was removed prior to purification by gradient centrifugation and suspended in 5 ml MiRO5 mitochondrial respiration media. 2.3 ml of this suspension was placed into each calibrated chamber of the Oxygraph and allowed to warm to 37 °C and to saturate with room air. The chambers were then sealed and respiration assayed after the following sequence of addition of substrates: glutamate (10mM)/malate (2mM); ADP (5mM); rotenone (0.5uM); succinate (5mM); antimycinA (2.5uM)/myxothiazol (0.5uM). The suspensions were then removed and saved for cardiolipin assay.
Results
Table 1 provides the demographics of the sPD and CTL subjects used to produce the cybrid cell lines in the present study. All but one of the sPD subjects had disease of moderate severity. The exception was PD59, who had advanced disease and whose cybrid cells were notable for their anaerobic respiratory nature and marked level of mtDNA depletion (see below).
Table 1.
Demographics of CTL and PD Subjects Used to Create Cybrid Cell Lines
| CYBRID ID | AGE AT CYBRID CREATION | SEX OF PATIENT | DIAGNOSIS | ETHNICITY | H&Y | PD DURATION IN YRS | |
|---|---|---|---|---|---|---|---|
| 56 | 72 | M | CTL | W | NA | ||
| 62 | 60 | F | CTL | AA | NA | ||
| 64 | 60 | F | CTL | W | NA | ||
| 68 | 69 | M | CTL | W | NA | ||
| 91 | 61 | F | CTL | W | NA | ||
| mean | 61 | ||||||
| 59 | 51 | M | PD | W | 4 | 11 | |
| 60 | 79 | F | PD | W | 2 | 12 | |
| 61 | 65 | M | PD | AA | 2 | 15 | |
| 63 | 73 | F | PD | W | 2 | 14 | |
| 65 | 69 | M | PD | W | 2 | 18 | |
| 66 | 75 | M | PD | W | 2 | 7 | |
| 67 | 72 | M | PD | W | 2 | 8 | |
| mean | 67 |
Cybrids were studied at a mean +/− SD passage number after creation of 24.4 +/− 4.9 for sPD and 26.3 +/− 6.5 for CTL cybrids. Table 2 shows the results of the qPCR analysis for mtDNA copy numbers assayed in gradient-purified mitochondrial DNA's isolated from sPD and CTL cybrid lines. Table 2 shows that sPD cybrid cells overall had lower mtDNA abundances in both D-loop and six coding genes.
Table 2.
Mitochondrial DNA Gene Copy Numbers in CTL and PD Cybrid Cell Purified Mitochondria
| cell line | 12srRNA | ND4 | ND2 | CO1 | CO2 | CO3 | D-Loop |
|---|---|---|---|---|---|---|---|
| CTL56 | 8.13 | 7.22 | 9.86 | 18.4 | 40.4 | 47 | 13 |
| CTL62 | 11.3 | 9.48 | 13.8 | 40.1 | 40.7 | 2.55 | 13.1 |
| CTL64 | 22.2 | 22.4 | 14.5 | 50.6 | 43.5 | 27.8 | 19.3 |
| CTL68 | 20.3 | 12.1 | 18.2 | 6.31 | 153 | 166 | 12.6 |
| CTL81 | 20.7 | 14.9 | 10.4 | 3.33 | 134 | 118 | 13.8 |
| mean | 16.53 | 13.22 | 13.35 | 23.75 | 82.32 | 72.27 | 14.36 |
| SEM | 2.84 | 2.63 | 1.52 | 9.32 | 25.16 | 30.29 | 1.25 |
| PD59 | 0.338 | 0.301 | 0.367 | 0.136 | 0.284 | 0.211 | 0.67 |
| PD60 | 4.39 | 4.05 | 5.8 | 7.82 | 22.7 | 24.4 | 9.45 |
| PD61 | 1.19 | 1.36 | 1.6 | 2.64 | 5.72 | 6.93 | 2.62 |
| PD63 | 5.47 | 4.31 | 3.58 | 4.49 | 17.2 | 18.4 | 5.6 |
| PD65 | 21.9 | 15.6 | 22.2 | 4.38 | 124 | 135 | 23.5 |
| PD66 | 3.34 | 2.89 | 4.71 | 5.85 | 11.6 | 13.1 | 5.37 |
| PD67 | 2.5 | 2.06 | 3.25 | 3.5 | 8.02 | 9.13 | 6.77 |
| mean | 5.59 | 4.37 | 5.93 | 4.12 | 27.07 | 29.60 | 7.71 |
| SEM | 2.80 | 1.95 | 2.80 | 0.92 | 16.39 | 17.82 | 2.84 |
| P (Mann-Whitney) | 0.03 | 0.03 | 0.048 | 0.073 | 0.018 | 0.2 | 0.048 |
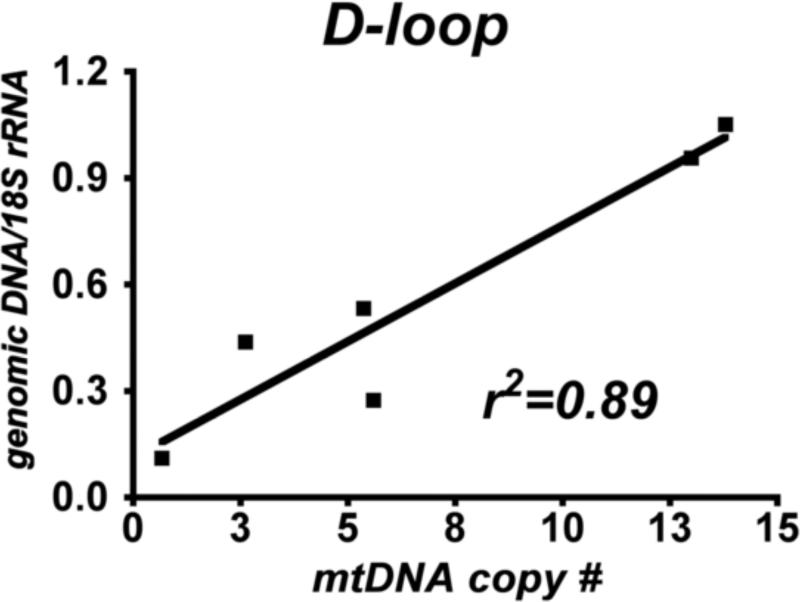
Figure 1 shows the linear relationship (R=0.95) between mtDNA copy number estimated from D-loop qPCR copy number of genomic DNA, normalized to 18S rRNA gene DNA content, and D-loop copy number from analysis of a fixed amount (1 ng) of DNA isolated from gradient purified mitochondria of the same cybrid line cultured months earlier. This finding shows that our use of DNA from purified mitochondria provides the same degree of estimation of mtDNA copy number as does a more traditional approach of assaying mtDNA copy number in relationship to genomic DNA housekeeping gene abundance. This high degree of correlation among mtDNA gene abundances allows us to contrast respiration rates in isolated cybrid cell mitochondria to mtDNA gene copy numbers in those same mitochondria.
Figure 1.
Correlation between mtDNA D-loop abundance from qPCR analysis of DNA in gradient-purified mitochondria (x-axis) and genomic DNA samples (y-axis) from sPD and CTL cybrid cells. The mitochondria and genomic DNA were isolated from cells cultured months apart by two separate individuals.
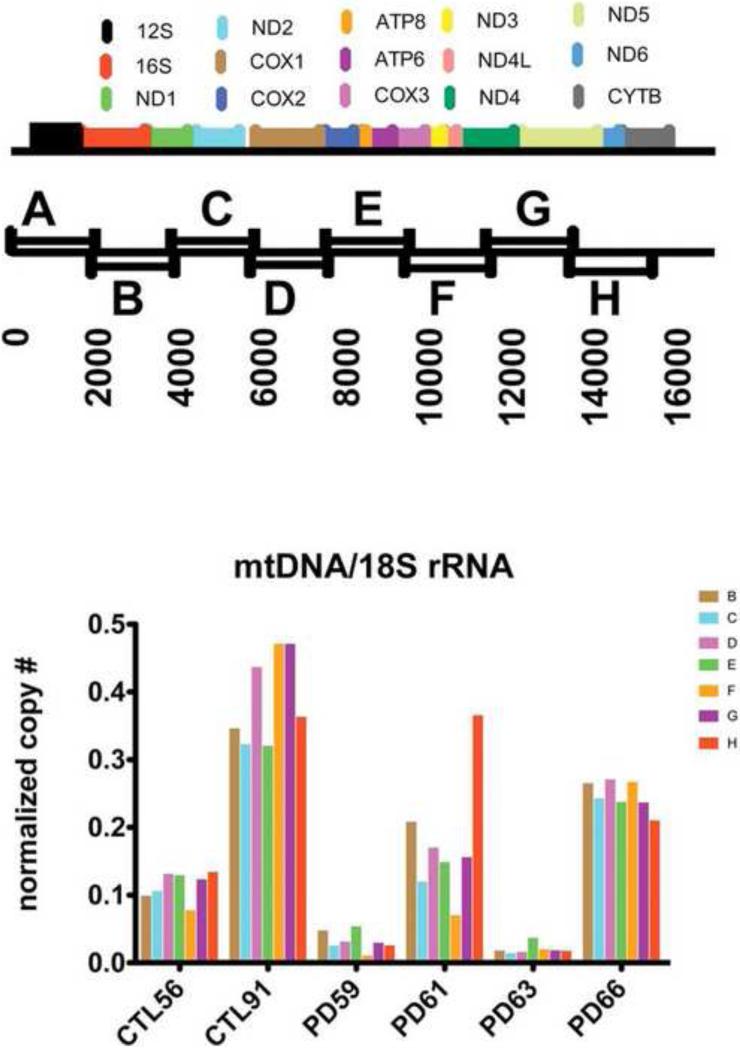
Figure 2 shows the distribution across coding regions of mtDNA ETC genes of the eight ~2 kbase amplicons from overlapping primer pairs B-H (Bannwarth, et al., 2005, Bannwarth, et al., 2006). Figure 2 also shows the results of qPCR analysis of cybrid genomic DNA using these primer pairs, with results normalized to abundance of 18S rRNA housekeeping DNA. Two sPD cybrid lines (PD59, PD63) showed substantial depletion of all amplicons. With a few exceptions most amplicons were present in levels close to their neighbors in the same cybrid DNA sample. This suggests that on a cell population basis, there was no evidence for the consistent presence of substantial levels of mtDNA deletions that spanned any of these primer pairs.
Figure 2.
(top) Diagram of the eight overlapping PCR primers A-H and their approximate positions with respect to mtDNA coding genes. Primers are taken from Bannwarth, et al.(Bannwarth, et al., 2005, Bannwarth, et al., 2006) (bottom) qPCR analyis of abundance of each of seven amplicons from primers B-H (Bannwarth, et al., 2006) from four sPD and two CTL cybrid lines.
The results are normalized to content of 18S rRNA gene content per sample.
Heteroplasmy analysis
We used Surveyor Nuclease® to define abundances and numbers of heteroplasmies within each of the eight ~2 kbase PCR products that cover nearly the entire mtDNA coding region for 4 sPD and 2 CTL cybrid lines (Figure 2). The principle behind Surveyor Nuclease® is that it will cut mismatches and provide an indication of approximate location of the heteroplasmies relative to either end of the priming sites of each ~2 kbase PCR fragment. We combined Surveyor Nuclease® with high-sensitivity automated electrophoresis analysis of DNA (Experion®, BioRad) and standardized software detection of bands to estimate product sizes and amounts. The Surveyor Nuclease® approach by itself does not define the specific mutations causing the heteroplasmies or their absolute locations within each PCR product. Rather, it provides an estimate of their numbers and locations relative to the primer sites within each PCR product.
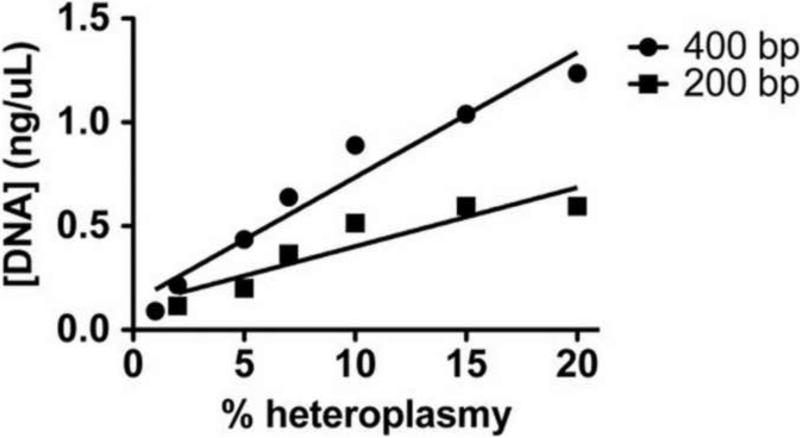
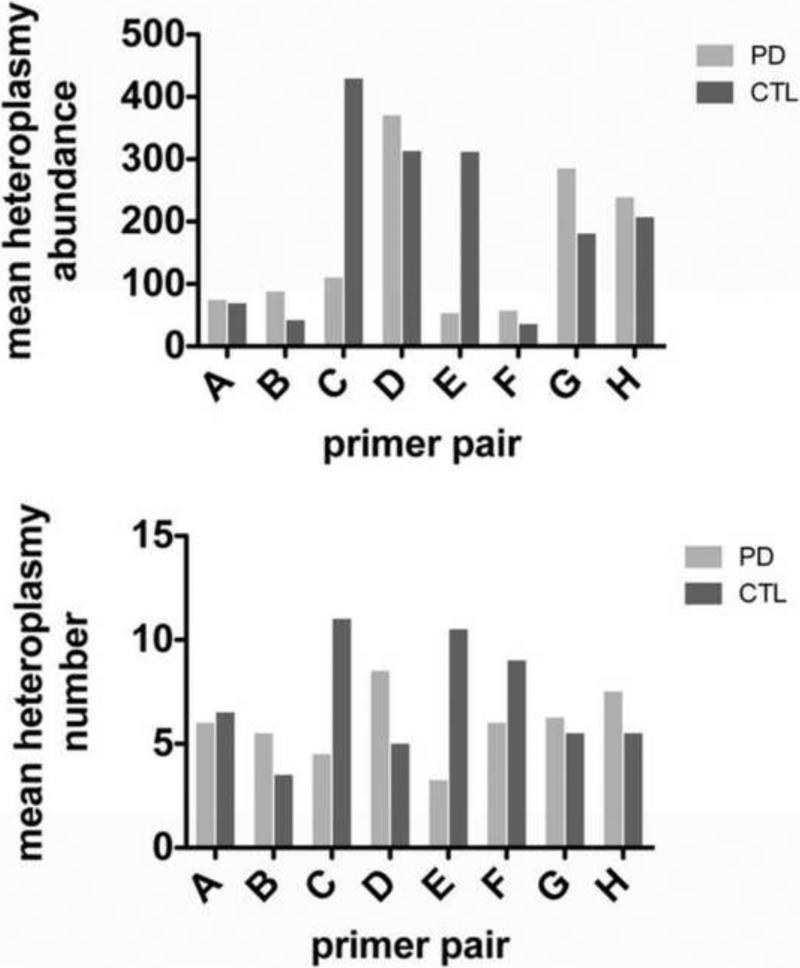
By varying the amount of mismatch-control PCR products provided by the manufacturer, we determined that Surveyor Nuclease® combined with automated gel electrophoresis (Experion®) allowed detection down to ~2% heteroplasmy abundance (Figure 3). We then assayed all 48 PCR products (6 cybrid lines X 8 PCR products per cybrid) in duplicate before and after Surveyor Nuclease® treatment on the Experion DNA chips and found the results of Figure 4. In the top panel of Figure 4 we show the mean heteroplasmy levels in sPD and CTL cybrids derived from the [DNA] determined by the Experion analysis for each heteroplasmy band. There was little heteroplasmy abundance in either sPD or CTL mtDNA's in the amplicons from primer pairs A, B and F. In the other primer pair amplicons, Surveyor nuclease detected higher heteroplasmy abundances, but there was no clear pattern separating sPD from CTL cybrid mtDNA's. The bottom panel of Figure 4 shows mean numbers of heteroplasmies detected for each primer pair, independent of the abundance of each individual heteroplasmy band. The mean numbers of heteroplasmies were more constant across the mitochondrial genome and again did not clearly distinguish sPD from CTL cybrids.
Figure 3.
Linear relationships among %heteroplasmy abundances of plasmid DNA mismatch control samples and DNA levels as determined by the Experion automated electrophoresis system and imaging software.
Figure 4.
Graphs of mean heteroplasmy abundances (top) and heteroplasmy numbers (bottom) in amplicons A-H from genomic DNA samples of sPD and CTL cybrids, subjected to Surveyor Nuclease®.
Mitochondrial biogenesis
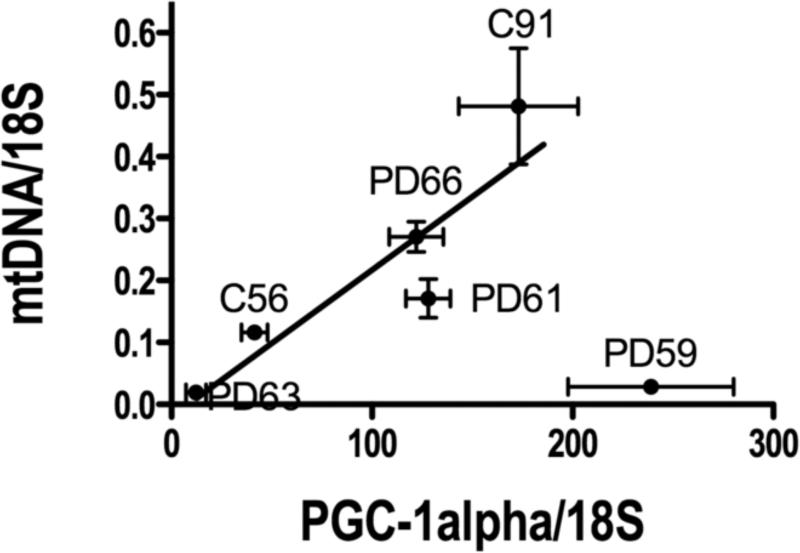
We then tested the hypothesis that variations in mtDNA abundance in each cybrid line was related to activity of the mitochondrial biogenesis system by examining the relationship between mtDNA and expression levels of PGC-1α, a major transcriptional regulator of mitochondrial biogenesis (Scarpulla, 2006, Scarpulla, 2008). As shown in Figure 5, there is a linear relationship between these two variables in 5/6 cybrid lines, with one outlier, cybrid PD59 that was manufactured from platelet mtDNA of an advanced PD patient.
Figure 5.
Relationship between expression of PGC-1α and mtDNA abundance in sPD (n=4) and CTL (n=2) cybrids. PGC-1α abundance was measured by qPCR in cybrid cDNA samples and normalized to 18S rRNA levels in those samples. mtDNA abundance was calculated as the average of levels measured in cybrid genomic DNA with qPCR using the A-H primers (see Methods), also normalized to 18S rRNA gene levels in those samples. The value for PD59 was not included in the regression analysis that showed R=0.9.
Respiration Studies
We carried out two kinds of room air respiration studies in the cybrid cells. First, we studied intact cells metabolizing glucose and used the “high resolution respirometry” approach pioneered by Gnaiger (Hutter, et al., 2006). In this approach, a fixed number of living cells (based on Trypan Blue exclusion) is placed into a calibrated chamber of the Oroboros oxygraph. Basal respiration in high glucose DMEM is measured, followed by its oligomycin-sensitive component, followed by incremental FCCP injections to uncouple respiration from producing a proton gradient, followed by inhibition with rotenone to determine the complex I component of maximal respiration, followed by antimycinA/myxothiazole to determine the typically small remaining complex II/III component.
In the other room air respiration studies we grew each sPD or CTL cybid cell line in bulk (24-28 T150 flasks), harvested the cells and isolated crude mitochondrial pellets. The mitochondria were resuspended in mitochondrial respiration buffer and added to the Oxygraph chambers in duplicate. State 4 respiration at complex I was determined after adding glutamate/malate, followed by State 3 respiration after adding ADP, followed by rotenone to inhibit complex I. Succinate was then added to determine State 3 respiration through complex II followed by antimycinA/myxothiazole to inhibit complex III. In both intact cell and mitochondrial respiration studies we normalized the respiration rates to content of cardiolipin, an abundant inner membrane phospholipid that we used as a marker for mitochondrial mass.
The results of the room air respiration studies in intact cells and isolated mitochondria are summarized in Table 3. There were non-significant trends for reductions of complex I-mediated respiration in both intact cells and isolated mitochondria in sPD compared to CTL cybrids. There were no obvious differences between CTL and sPD cybrid cells in terms of how the ETC was coupled to ATP synthesis or proton pumping. The uncoupled control ratios (UCR) in both cybrid groups were ~1.5, lower than typically found with this approach in primary cells. For example, Hutter et al reported UCR of ~3 in HUVEC using the same approach (Hutter, et al., 2006). Also shown in Table 3 are the results from Oxyblot® assay for protein carbonyl content in the PD and CTL cybrid mitochondria. There were no differences between the two groups in terms of total mitochondrial protein carbonyl content.
TABLE 3.
Room Air Respiration Values and Oxyblot Intensities for Intact Cells and Isolated Mitochondria from CTL and sPD Cybrids
| INTACT CELL RESPIRATION | ISOLATED MITOCHONDRIAL RESPIRATION | ||||||||
|---|---|---|---|---|---|---|---|---|---|
| RCR | UCR | FCCP-rot | FCCP-rot/ug cardiol | normalized to cardiolipin | |||||
| CI | CII | CI ST3/ST4 | Oxyblot | ||||||
| C56 | 5.46 | 1.74 | 30.47 | 0.74 | 0.68 | 0.25 | 3.01 | 0.77 | |
| C62 | 1.81 | 1.08 | 2.35 | 0.05 | −0.01 | 0.77 | 0.90 | ||
| C64 | 4.30 | 1.53 | 14.45 | 0.62 | 0.95 | 0.99 | 3.61 | 0.84 | |
| C68 | 5.23 | 1.68 | 22.01 | 0.75 | 0.24 | 0.22 | 2.66 | 1.30 | |
| C91 | 4.37 | 1.62 | 41.48 | 1.18 | 0.82 | 1.11 | 2.61 | 0.70 | |
| mean | 4.23 | 1.53 | 22.15 | 0.67 | 0.54 | 0.64 | 2.53 | 0.90 | |
| SEM | 0.65 | 0.12 | 6.69 | 0.18 | 0.18 | 0.24 | 0.48 | 0.11 | |
| P59 | 1.05 | 1.00 | 0.00 | 0.00 | 0.00 | 0.00 | 1.03 | 0.67 | |
| P60 | 5.33 | 2.49 | 25.38 | 0.68 | 0.48 | 0.56 | 3.58 | 0.50 | |
| P61 | 4.24 | 1.76 | 13.10 | 0.39 | 0.03 | 0.04 | 1.38 | 1.58 | |
| P63 | 2.51 | 1.18 | 8.00 | 0.37 | 0.45 | 0.04 | 2.42 | 1.26 | |
| P65 | 3.45 | 1.36 | 9.88 | 0.25 | 0.29 | 0.32 | 1.80 | 0.74 | |
| P66 | 3.58 | 1.53 | 15.96 | 0.47 | 0.93 | 1.08 | 3.36 | 1.02 | |
| P67 | 4.59 | 1.32 | 21.39 | 0.70 | 0.52 | 0.39 | 4.01 | 0.92 | |
| mean | 3.54 | 1.52 | 13.39 | 0.41 | 0.39 | 0.35 | 2.51 | 0.96 | |
| SEM | 0.54 | 0.18 | 3.22 | 0.09 | 0.12 | 0.15 | 0.44 | 0.14 | |
Abbreviations: RCR= respiratory control ratio (FCCP uncoupled/oligomycin); UCR= uncoupled control ratio (FCCP uncoupled/basal); rot=rotenone; cardiol= cardiolipin; CI= complex I; CII= complex II; ST3/ST4= state 3 (+ADP)/state 4 (−ADP); Oxyblot= lane intensity of protein carbonyls
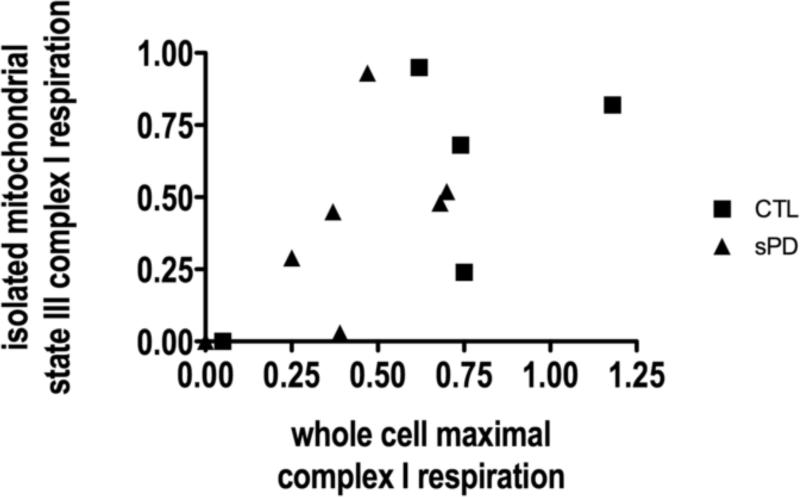
A comparison of FCCP-uncoupled, maximal complex I-mediated respiration in whole cybrid cells compared to state 3 (ADP added), complex-I mediated respiration in the isolated mitochondria from these same cybrid cells showed limited correlations in both sPD and CTL cybrid lines (Figure 6). Because Figure 6 reports respiration rates normalized to cardiolipin content, as an estimate of mitochondrial mass, the limited correlation among intact cellular and isolated mitochondrial respirations implies that one cannot assume that direct measurements of respiration using mitochondrial substrates necessarily reflects respiration of those same mitochondria when subject to intracellular metabolic regulation.
Figure 6.
Limited correlations among complex I respiration rates of intact cells compared metabolizing glucose to their isolated mitochondria. Rotenone-sensitive, FCCP-uncoupled respiration in intact cybrid cells, normalized to cardiolipin content, is plotted on the x-axis against state 3 (ADP added), rotenone-sensitive respiration in their isolated mitochondria metabolizing glutamate/malate, also normalized to cardiolipin content.
Because respiration at room air pO2 may not reflect how the respiratory chain functions in situ where pO2 levels are several fold lower, we characterized respiration changes during the normoxic-anoxic transition (Pecina, et al., 2004). In these experiments intact cell respiration is allowed to proceed while chamber oxygen is depleted to ~zero. The respiration rates are then plotted against oxygen levels in the chamber, and the data are fitted to a rectangular hyperbolic binding equation to derive an estimate of Km for oxygen. An example of this type of respiration analysis is provided in Supplemental Figure 1.
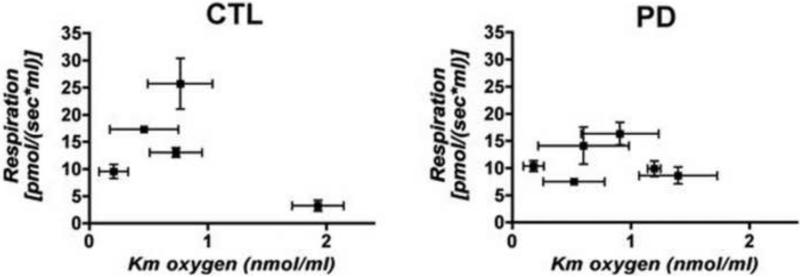
The relationships of oxygen Km's compared to intact cell basal respiration rates, determined from multiple independent cultures and respiration studies of each sPD and CTL cybrid cell line, are displayed in Figure 7. There are no apparent differences among magnitudes of the oxygen Km's between sPD and CTL cybrid cells. Rather, Figure 7 shows that the regulation of apparent affinity for oxygen as a function of basal respiration was different in CTL cybrids compared to sPD cybrids. With the exception of one outlier that had very little respiration, the CTL cybrid respiration rates were directly related to their apparent Km's for oxygen with a fairly steep slope (Figure 7). In other words, as respiration rates declined, the apparent affinities for oxygen increased (Km gets smaller) as if in a compensatory manner to maximize efficiency of reducing oxygen. In contrast, no such relationship between respiration rates and apparent Km's for oxygen existed for the sPD cybrids, suggesting a fundamental difference between CTL and sPD cybrid cells as to how the respiratory chain is dynamically.
Figure 7.
Relationships among apparent Km's for oxygen for sPD and CTL cybrids and basal respiration rates in intact cybrid cells metabolizing glucose. Shown are mean +/− SEM values from multiple independent culture experiments for each cell line. The Km for oxygen was estimated by rectangular hyperbolic curve fitting of the respiration vs. [oxygen] data in the normoxic-anoxic transitions (see Methods).
ETC protein assays
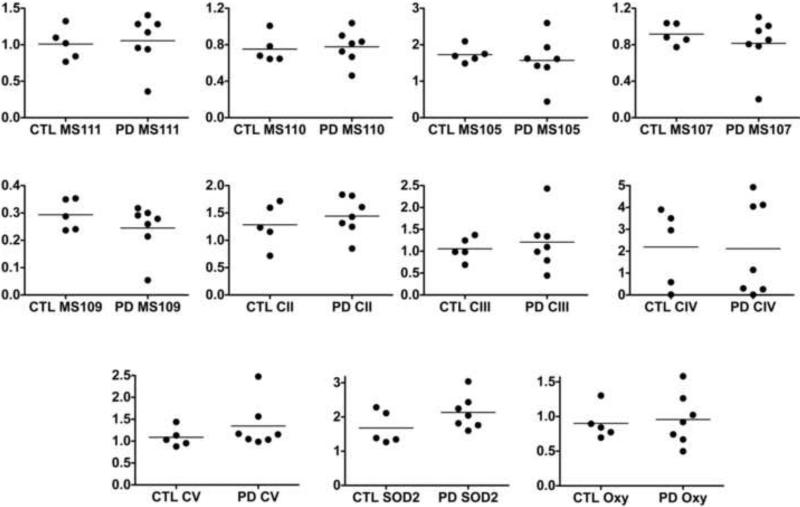
In our cybrid mitochondrial preparations we assayed levels of multiple complex I proteins and individual representatives of proteins from complexes II-V using Western blotting and antibody cocktails from MitoSciences. We also assayed levels of SOD2, a major matrix oxidative stress protein, and protein carbonyls in the mitochondrial preparations with the Oxyblot® technique. We normalized these protein levels to content of cardiolipin as a marker for mitochondrial mass. As shown in Figure 8 we found frequent heterogeneity of protein levels but did not observe any significant differences between CTL and sPD cybrid mitochondria in any of these protein levels normalized to mitochondrial mass. There was a non-significant trend (P=0.15) for elevation of SOD2 levels in sPD cybrids. There were no correlations among any cardiolipin-normalized ETC protein levels and CTL or sPD cybrid mitochondrial CI or CII State 3 respiration rates that had also been normalized to cardiolipin content (not shown).
Figure 8.
Levels of multiple ETC proteins, SOD2 and protein carbonyls in gradient-purified mitochondria isolated from sPD and CTL cybrid lines and normalized to cardiolipin content. Complex I proteins=MS105-MS111; CII=complex II; CIII=complex III; CIV=complex IV; CV=complex V.
Respiration and mitochondrial DNA copy numbers
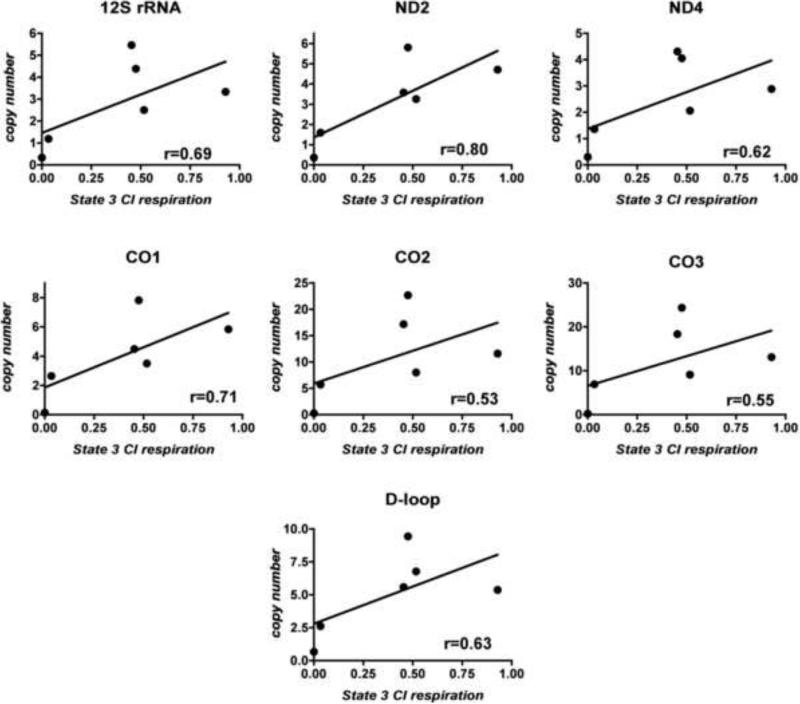
With the exception of CO subunit 2, all of the ETC proteins we assayed by Western blot are coded for by the nuclear genome. Although we did not have available antibodies to quantify a number of mtDNA-encoded ETC proteins, we did explore the possibility that mtDNA gene copy numbers might correlate with observed mitochondrial respiratory rates. Figure 9 shows that the copy numbers of five mtDNA ETC protein genes, the D-loop and the 12S rRNA gene correlated moderately (r=0.53-0.80) with sPD cybrid mitochondrial State 3 respiration driven by complex I substrates. This result suggests that a major factor influencing respiration rate in the cybrid cells is the availability of essential catalytic subunits of complexes I and IV that are coded by the mitochondrial genome.
Figure 9.
Correlations among complex I-driven state 3 respiration in gradient-purified mitochondria of sPD cybrids and their copy number content of mtDNA genes and D-loop assayed by qPCR.
Discussion
In this study we have undertaken an initial examination of properties of mitochondrial genomes in cybrids derived from sPD subjects and compared these genomic characteristics to their ETC biochemistries and respiratory physiologies in both the intact state where metabolic control systems are operative, and in isolated mitochondria where specific ETC complex substrates are provided. The overall goal of these experiments was to ascertain the nature of any genotype-phenotype relationships that exist when different sPD mtDNA's are expressed in a constant host environment (SH-SY5Y rho0). In this manner, differences observed should arise from properties of the donor mtDNA's as they are replicated and expressed over time. Hopefully these genotype-phenotype relationships can guide the structure of future studies in sPD tissues.
There are at least three major findings and several important caveats. Our first finding, and perhaps the most important one, is we found that sPD cybrids demonstrate variable levels of depletion of mitochondrial genes. These deficiencies were found using two completely different qPCR approaches (typical D-loop qPCR vs. amplification of multiple overlapping ~2 kbase products), with two different substrates (DNA isolated from purified mitochondria vs. genomic DNA), in cell lines cultured several months apart by two different persons. Because these cell lines had gone through multiple and ~comparable numbers of passages since their creation, failure to populate normal levels of mtDNA genes must derive from one or more deficiencies of mitochondrial biogenesis.
Multiple transcription factors and transcriptional co-activators of the PGC-1 family, including PPAR-gamma coactivator-1 alpha (PGC-1α) target genes that regulate nuclear-encoded mitochondrial ETC proteins, mitochondrial DNA transcription, translation and replication machinery, and protein import. (Scarpulla, 2006, Scarpulla, 2008). PGC-1α appears to play a major role in mitochondrial biogenesis in several tissues, and its expression was regulated by neuronal nitric oxide production in brain hypoxia-induced increases in mtDNA (Gutsaeva, et al., 2008). In our study we did not search for involvement of nitric oxide synthase(s) in regulation of PGC-1α and mtDNA levels, but it is an attractive possibility.
That we observed significant heterogeneity among mtDNA gene levels in sPD and CTL cybrids implies that properties of mtDNA's expressed in the cybrid lines exert more control over mtDNA levels than anticipated, particularly since mtDNA replication is controlled by nuclear-encoded genes. Known mitochondrial factors that could be responsible for stimulating mtDNA biogenesis include nitric oxide (see above). We believe that a better understanding of mtDNA-driven mechanisms that regulate mtDNA levels, as suggested by our results in cybrids, will lead to a better understanding of how mtDNA levels “self-regulate” in sPD and other disease states, above and beyond general effects of aging.
In our second finding, use of the Surveyor Nuclease® technology provided an overview of heteroplasmy abundances (levels) and numbers in mtDNA's from sPD cybrid cells. The Surveyor technology detected ~40-50 heteroplasmic mutations in each sPD or CTL cybrid cell line, but some heteroplasmies may be counted twice, depending on their location within each amplicon. Even if this approach results in a two-fold overestimation of heteroplasmic mutations, the average number per cybrid line (~20-25) is still substantial.
We found that heteroplasmic mtDNA mutations were more abundant in certain regions in both sPD and CTL. There were no obvious patterns of heteroplasmy abundance or numbers that allowed a clear distinction between sPD and CTL cybrid mtDNA's. In combination, these findings imply that defining pathogenic, heteroplasmic mtDNA mutations in sPD compared to CTL cybrids will be a daunting task, if they even exist.
There are several other important limitations of our heteroplasmy analysis that further limit its interpretation. First, the mismatch nuclease approach does not define the precise nature of the mismatches; this would require isolation of the individual bands and sequencing. Second, our estimate of mismatch abundances is only an estimate and would need confirmation by independent techniques such as site-specific qPCR. Third, and probably most important, even if we knew the identities of individual mtDNA heteroplasmic mutations and their exact locations and abundances, we still would not know their biological significances in terms of impairment of ETC catalytic efficiency or respiratory capacity.
If mtDNA abnormalities participate in sPD pathogenesis, it is not clear to us whether individual mutations at high abundance are necessarily important for a chronic disease like sPD, compared to clustering of low abundance mutations in certain coding regions, the “microheteroplasmy” concept (Smigrodzki and Khan, 2005). What our initial findings do suggest is that if mtDNA heteroplasmic mutations are important for the sPD cybrid phenotype, it is likely that the pathogenic mtDNA mutations are a small subset of those detected with the Surveyor technique. Separating potentially pathogenic mtDNA heteroplasmic mutations from those functionally silent appears to be a difficult task.
From the perspective of mtDNA propagation in cybrids, we do not know whether these heteroplasmic mutations were present in the original platelet mtDNA's used to create the cybrid lines, as we no longer possess these platelet samples, or whether they arose during propagation of the cybrids, or some combination of events. We also do not know how these heteroplasmic mutations are distributed among individual cybrid cells. We are presently carrying out a similar analysis of sPD and CTL brain mitochondrial DNA's to determine if similar heteroplasmy patterns are present. We then can extend this approach to single brain neurons from these samples to address the question of whether patterns of heteroplasmy are general or neuron specific.
In our third major finding, we did not find correlations across cybrids of levels of the ten ETC proteins with either intact cellular or isolated mitochondrial respiration rates. Because only one (CO-2) of the proteins assayed is coded by the mitochondrial genome, it is possible that the other nuclear DNA-encoded proteins are regulated more independently of respiratory capacity compared to mtDNA-encoded ETC proteins believed to provide essential catalytic roles. The moderate correlations we observed among mtDNA gene copy numbers and mitochondrial respiration rates are consistent with but do not prove that concept. At the minimum, these findings show that a complex process such as respiration is regulated by processes more complicated than the level of its individual protein components. In addition, we found limited correlations among intact cell and isolated mitochondrial complex I respiration rates. Given this finding, it may be more relevant to cell mitochondrial metabolism in tissues to assay, whenever possible, intact cell respiration where metabolic control systems are preserved. Cybrid models by design isolate mtDNA expression against constant nuclear genetic and environmental backgrounds. By their nature they will exclude nuclear genetic and epigenetic influences on the physiology of the mitochondria. The magnitude of these influences is presently unknown but likely significant. As an example, mutations in the LRRK2 gene appear to account for 1-2% of sporadic PD. There also appear to be unknown factors that influence penetrance of LRRK2 mutations that may account for increased prevalence of non-LRRK2 PD phenotypes found in LRRK2 mutation-bearing families (Latourelle, et al., 2008). These potential influences on the PD cellular phenotype would not be expressed in a cybrid model. Potential effects on mitochondrial physiology of other rarer PD autosomal mutations, such as in genes for parkin, DJ-1, PINK1 and α-synuclein would also not be expressed in a cybrid model.
A final caveat in terms of what relevance sPD cybrid cells may have for understanding pathogenesis of sPD neurodegeneration is that we do not know what relationship, if any, platelet mtDNA has to brain mtDNA in a given subject. In addition, we do not know whether the respiration patterns we observe in sPD cybrid cells reflect changes of sPD neurons. Our host cell, while neural in nature, is a tumor cell and not a primary neuron.
In spite of these limitations, it is appealing to consider that we have created cell models that show variable degrees of mtDNA depletion, including some with marked depletion that lead to nearly anaerobic states, similar to what has been described in individual sPD and aging brain nigral neurons (Bender, et al., 2006, Bender, et al., 2008, Kraytsberg, et al., 2006). In that context it is also important to note that one CTL cybrid line also showed mtDNA depletion and substantially impaired respiration. A CTL subject was defined as one free of clinical symptoms at the time of blood donation to create a cybrid line. Such an individual could be destined to develop sPD and thus may carry mtDNA abnormalities that become apparent when expressed in a cybrid model. While one can be reasonably confident of the diagnosis of sPD in individuals who have had careful histories and examinations, followed by symptomatic improvement on dopaminergic therapy, the same degree of security regarding freedom from sPD pathology cannot as confidently exist in a person based solely on lack of clinical symptoms. Thus, the exact nature of “CTL” identity in studies such as ours must always be viewed in this context.
We are intrigued by the differences in the apparent Km values for oxygen and their relationships to respiration between the CTL and sPD cybrid groups. Many of our calculated Km values are similar to those reported for oxygen and cytochrome oxidase (0.05-0.5 μM, (Erecinska and Silver, 2001)), but one cannot assume that we are assaying oxygen affinity for cytochrome oxidase. In addition, the relationship between mitochondrial respiration and oxygen level is complex and dependent on ratios of ATP/ADP and NADH/NAD+ (Wilson, et al., 1977) that we cannot easily control in our intact cells.
While a detailed biophysical understanding of the origins of this finding is not yet available, it suggests that there are complex differences in how the ETC, the so-called “respirasome”, may be assembled or regulated in the sPD cybrid cells. At the minimum, our findings show that trying to distinguish disease from control cell lines based solely on maximum catalytic activities of one or two ETC complexes is too simplistic and does not reveal important differences in complexities of respiratory control.
We propose that sPD has dysfunctional mitochondrial biogenesis, at least in terms of mtDNA levels, as a core component of its pathogenesis. The drift into increasingly anaerobic metabolism is predicted to follow such progressive mtDNA depletion and may account for increasing appearance of CO-negative neurons in sPD nigra (Bender, et al., 2006). If this hypothesis is correct, then therapeutic intervention to correct the causes of this impaired mtDNA level may restore energy-requiring neuronal and synaptic functions and interrupt the cycle of neurodegeneration. Further insights into the molecular pathogenesis of mtDNA gene depletions can accrue from studying their appearances over time in a cell model such as those created with cybrid technology.
Supplementary Material
Supplemental Figure 1. Normoxic-anoxic transition experiment example. Shown is a respiratory tracing from a sPD cybrid cell line that is allowed to deplete chamber oxygen levels (blue line) to ~zero. Vertical black lines represent individual data points collected that are shown. Curve fitting was carried out in GraphPad Prism using single site Michaelis-Menten rectangular hyperbolic curve fitting.
Acknowledgements
This research was supported by NS39788, AG023443 and the D. Loy Stewart Research Fund. We thank Dr. Erich Gnaiger for helpful advice about the respiration experiments.
Abbreviations
- ETC
electron transport chain
- mtDNA
mitochondrial DNA
- sPD
sporadic Parkinson's disease
Footnotes
Publisher's Disclaimer: This is a PDF file of an unedited manuscript that has been accepted for publication. As a service to our customers we are providing this early version of the manuscript. The manuscript will undergo copyediting, typesetting, and review of the resulting proof before it is published in its final citable form. Please note that during the production process errors may be discovered which could affect the content, and all legal disclaimers that apply to the journal pertain.
Competing Interests
The authors declare that they have no competing interests.
References
- 1.Bannwarth S, Procaccio V, Paquis-Flucklinger V. Surveyor Nuclease: a new strategy for a rapid identification of heteroplasmic mitochondrial DNA mutations in patients with respiratory chain defects. Hum Mutat. 2005;25:575–582. doi: 10.1002/humu.20177. [DOI] [PubMed] [Google Scholar]
- 2.Bannwarth S, Procaccio V, Paquis-Flucklinger V. Rapid identification of unknown heteroplasmic mutations across the entire human mitochondrial genome with mismatch-specific Surveyor Nuclease. Nat Protoc. 2006;1:2037–2047. doi: 10.1038/nprot.2006.318. [DOI] [PubMed] [Google Scholar]
- 3.Bender A, Krishnan KJ, Morris CM, Taylor GA, Reeve AK, Perry RH, Jaros E, Hersheson JS, Betts J, Klopstock T, Taylor RW, Turnbull DM. High levels of mitochondrial DNA deletions in substantia nigra neurons in aging and Parkinson disease. Nat Genet. 2006;38:515–517. doi: 10.1038/ng1769. [DOI] [PubMed] [Google Scholar]
- 4.Bender A, Schwarzkopf RM, McMillan A, Krishnan KJ, Rieder G, Neumann M, Elstner M, Turnbull DM, Klopstock T. Dopaminergic midbrain neurons are the prime target for mitochondrial DNA deletions. J Neurol. 2008 doi: 10.1007/s00415-008-0892-9. [DOI] [PubMed] [Google Scholar]
- 5.Borland MK, Mohanakumar KP, Rubinstein JD, Keeney PM, Xie J, Capaldi R, Dunham LD, Trimmer PA, Bennett JP., Jr. Relationships among molecular genetic and respiratory properties of Parkinson's disease cybrid cells show similarities to Parkinson's brain tissues. Biochim Biophys Acta. 2009;1792:68–74. doi: 10.1016/j.bbadis.2008.09.014. [DOI] [PMC free article] [PubMed] [Google Scholar]
- 6.Braak E, Sandmann-Keil D, Rub U, Gai WP, de Vos RA, Steur EN, Arai K, Braak H. alpha-synuclein immunopositive Parkinson's disease-related inclusion bodies in lower brain stem nuclei. Acta Neuropathol (Berl) 2001;101:195–201. doi: 10.1007/s004010000247. [DOI] [PubMed] [Google Scholar]
- 7.Braak H, de Vos RA, Bohl J, Del Tredici K. Gastric alpha-synuclein immunoreactive inclusions in Meissner's and Auerbach's plexuses in cases staged for Parkinson's disease-related brain pathology. Neurosci Lett. 2006;396:67–72. doi: 10.1016/j.neulet.2005.11.012. [DOI] [PubMed] [Google Scholar]
- 8.Braak H, Del Tredici K, Rub U, de Vos RA, Jansen Steur EN, Braak E. Staging of brain pathology related to sporadic Parkinson's disease. Neurobiol Aging. 2003;24:197–211. doi: 10.1016/s0197-4580(02)00065-9. [DOI] [PubMed] [Google Scholar]
- 9.Braak H, Ghebremedhin E, Rub U, Bratzke H, Del Tredici K. Stages in the development of Parkinson's disease-related pathology. Cell Tissue Res. 2004;318:121–134. doi: 10.1007/s00441-004-0956-9. [DOI] [PubMed] [Google Scholar]
- 10.Braak H, Sandmann-Keil D, Gai W, Braak E. Extensive axonal Lewy neurites in Parkinson's disease: a novel pathological feature revealed by alpha-synuclein immunocytochemistry. Neurosci Lett. 1999;265:67–69. doi: 10.1016/s0304-3940(99)00208-6. [DOI] [PubMed] [Google Scholar]
- 11.Cassarino DS, Fall CP, Swerdlow RH, Smith TS, Halvorsen EM, Miller SW, Parks JP, Parker WD, Jr., Bennett JP., Jr. Elevated reactive oxygen species and antioxidant enzyme activities in animal and cellular models of Parkinson's disease. Biochim Biophys Acta. 1997;1362:77–86. doi: 10.1016/s0925-4439(97)00070-7. [DOI] [PubMed] [Google Scholar]
- 12.Erecinska M, Silver IA. Tissue oxygen tension and brain sensitivity to hypoxia. Respir Physiol. 2001;128:263–276. doi: 10.1016/s0034-5687(01)00306-1. [DOI] [PubMed] [Google Scholar]
- 13.Gnaiger E. Oxygen conformance of cellular respiration. A perspective of mitochondrial physiology. Adv Exp Med Biol. 2003;543:39–55. doi: 10.1007/978-1-4419-8997-0_4. [DOI] [PubMed] [Google Scholar]
- 14.Graziewicz MA, Day BJ, Copeland WC. The mitochondrial DNA polymerase as a target of oxidative damage. Nucleic Acids Res. 2002;30:2817–2824. doi: 10.1093/nar/gkf392. [DOI] [PMC free article] [PubMed] [Google Scholar]
- 15.Gutsaeva DR, Carraway MS, Suliman HB, Demchenko IT, Shitara H, Yonekawa H, Piantadosi CA. Transient hypoxia stimulates mitochondrial biogenesis in brain subcortex by a neuronal nitric oxide synthase-dependent mechanism. J Neurosci. 2008;28:2015–2024. doi: 10.1523/JNEUROSCI.5654-07.2008. [DOI] [PMC free article] [PubMed] [Google Scholar]
- 16.Hutter E, Unterluggauer H, Garedew A, Jansen-Durr P, Gnaiger E. High-resolution respirometry--a modern tool in aging research. Exp Gerontol. 2006;41:103–109. doi: 10.1016/j.exger.2005.09.011. [DOI] [PubMed] [Google Scholar]
- 17.Kraytsberg Y, Kudryavtseva E, McKee AC, Geula C, Kowall NW, Khrapko K. Mitochondrial DNA deletions are abundant and cause functional impairment in aged human substantia nigra neurons. Nat Genet. 2006;38:518–520. doi: 10.1038/ng1778. [DOI] [PubMed] [Google Scholar]
- 18.Latourelle JC, Sun M, Lew MF, Suchowersky O, Klein C, Golbe LI, Mark MH, Growdon JH, Wooten GF, Watts RL, Guttman M, Racette BA, Perlmutter JS, Ahmed A, Shill HA, Singer C, Goldwurm S, Pezzoli G, Zini M, Saint-Hilaire MH, Hendricks AE, Williamson S, Nagle MW, Wilk JB, Massood T, Huskey KW, Laramie JM, DeStefano AL, Baker KB, Itin I, Litvan I, Nicholson G, Corbett A, Nance M, Drasby E, Isaacson S, Burn DJ, Chinnery PF, Pramstaller PP, Al-hinti J, Moller AT, Ostergaard K, Sherman SJ, Roxburgh R, Snow B, Slevin JT, Cambi F, Gusella JF, Myers RH. The Gly2019Ser mutation in LRRK2 is not fully penetrant in familial Parkinson's disease: the GenePD study. BMC Med. 2008;6:32. doi: 10.1186/1741-7015-6-32. [DOI] [PMC free article] [PubMed] [Google Scholar]
- 19.Parker WD, Jr., Swerdlow RH. Mitochondrial dysfunction in idiopathic Parkinson disease. Am J Hum Genet. 1998;62:758–762. doi: 10.1086/301812. [DOI] [PMC free article] [PubMed] [Google Scholar]
- 20.Pecina P, Gnaiger E, Zeman J, Pronicka E, Houstek J. Decreased affinity for oxygen of cytochrome-c oxidase in Leigh syndrome caused by SURF1 mutations. Am J Physiol Cell Physiol. 2004;287:C1384–1388. doi: 10.1152/ajpcell.00286.2004. [DOI] [PubMed] [Google Scholar]
- 21.Reeve AK, Krishnan KJ, Elson JL, Morris CM, Bender A, Lightowlers RN, Turnbull DM. Nature of mitochondrial DNA deletions in substantia nigra neurons. Am J Hum Genet. 2008;82:228–235. doi: 10.1016/j.ajhg.2007.09.018. [DOI] [PMC free article] [PubMed] [Google Scholar]
- 22.Scarpulla RC. Nuclear control of respiratory gene expression in mammalian cells. J Cell Biochem. 2006;97:673–683. doi: 10.1002/jcb.20743. [DOI] [PubMed] [Google Scholar]
- 23.Scarpulla RC. Transcriptional paradigms in mammalian mitochondrial biogenesis and function. Physiol Rev. 2008;88:611–638. doi: 10.1152/physrev.00025.2007. [DOI] [PubMed] [Google Scholar]
- 24.Smigrodzki RM, Khan SM. Mitochondrial microheteroplasmy and a theory of aging and age-related disease. Rejuvenation Res. 2005;8:172–198. doi: 10.1089/rej.2005.8.172. [DOI] [PubMed] [Google Scholar]
- 25.Swerdlow RH. Mitochondria in cybrids containing mtDNA from persons with mitochondriopathies. J Neurosci Res. 2007;85:3416–3428. doi: 10.1002/jnr.21167. [DOI] [PubMed] [Google Scholar]
- 26.Swerdlow RH, Parks JK, Cassarino DS, Binder DR, Bennett JP, Jr., Di Iorio G, Golbe LI, Parker WD., Jr. Biochemical analysis of cybrids expressing mitochondrial DNA from Contursi kindred Parkinson's subjects. Exp Neurol. 2001;169:479–485. doi: 10.1006/exnr.2001.7674. [DOI] [PubMed] [Google Scholar]
- 27.Swerdlow RH, Parks JK, Davis JN, 2nd, Cassarino DS, Trimmer PA, Currie LJ, Dougherty J, Bridges WS, Bennett JP, Jr., Wooten GF, Parker WD. Matrilineal inheritance of complex I dysfunction in a multigenerational Parkinson's disease family. Ann Neurol. 1998;44:873–881. doi: 10.1002/ana.410440605. [DOI] [PubMed] [Google Scholar]
- 28.Swerdlow RH, Parks JK, Miller SW, Tuttle JB, Trimmer PA, Sheehan JP, Bennett JP, Jr., Davis RE, Parker WD., Jr. Origin and functional consequences of the complex I defect in Parkinson's disease. Ann Neurol. 1996;40:663–671. doi: 10.1002/ana.410400417. [DOI] [PubMed] [Google Scholar]
- 29.Trimmer PA, Bennett JP., Jr. The cybrid model of sporadic Parkinson's disease. Exp Neurol. 2009;218:320–325. doi: 10.1016/j.expneurol.2009.03.016. [DOI] [PMC free article] [PubMed] [Google Scholar]
- 30.Trimmer PA, Borland MK, Keeney PM, Bennett JP, Jr., Parker WD., Jr. Parkinson's disease transgenic mitochondrial cybrids generate Lewy inclusion bodies. J Neurochem. 2004;88:800–812. doi: 10.1046/j.1471-4159.2003.02168.x. [DOI] [PubMed] [Google Scholar]
- 31.Trimmer PA, Swerdlow RH, Parks JK, Keeney P, Bennett JP, Jr., Miller SW, Davis RE, Parker WD., Jr. Abnormal mitochondrial morphology in sporadic Parkinson's and Alzheimer's disease cybrid cell lines. Exp Neurol. 2000;162:37–50. doi: 10.1006/exnr.2000.7333. [DOI] [PubMed] [Google Scholar]
- 32.Wilson DF, Owen CS, Holian A. Control of mitochondrial respiration: a quantitative evaluation of the roles of cytochrome c and oxygen. Arch Biochem Biophys. 1977;182:749–762. doi: 10.1016/0003-9861(77)90557-4. [DOI] [PubMed] [Google Scholar]
Associated Data
This section collects any data citations, data availability statements, or supplementary materials included in this article.
Supplementary Materials
Supplemental Figure 1. Normoxic-anoxic transition experiment example. Shown is a respiratory tracing from a sPD cybrid cell line that is allowed to deplete chamber oxygen levels (blue line) to ~zero. Vertical black lines represent individual data points collected that are shown. Curve fitting was carried out in GraphPad Prism using single site Michaelis-Menten rectangular hyperbolic curve fitting.


