

Abstract
This study aimed to test the hypothesis that adipocyte TG accumulation could be altered by specifically perturbing pyruvate metabolism. We treated cultured 3T3-L1 adipocytes with chemical inhibitors of lactate dehydrogenase (LDH) and pyruvate carboxylase (PC), and characterized their global effects on intermediary metabolism using metabolic flux and isotopomer analysis. Inhibiting the enzymes over several days did not alter the adipocyte differentiation program as assessed by the expression levels of peroxisome proliferator-activated receptor-γ and glycerol-3-phosphate dehydrogenase. The main metabolic effects were to up-regulate intracellular lipolysis and decrease TG accumulation. Inhibiting PC also up-regulated glycolysis. Flux estimates indicated that the reduction in TG was due to decreased de novo fatty acid synthesis. Exogenous addition of free fatty acids dose-dependently increased the cellular TG level in the inhibitor-treated adipocytes, but not in untreated control cells. The results of this study support our hypothesis regarding the critical role of pyruvate reactions in TG synthesis.
Keywords: adipocyte, pyruvate, lipid metabolism, de novo fatty acid synthesis, metabolic flux analysis
Introduction
In the adipocyte, pyruvate plays a versatile role in energy production, biosynthesis, and redox balance. Pyruvate is mainly formed from glucose through glycolysis. While pyruvate can be converted into alanine by alanine aminotransferase, its metabolic fate is largely determined by the following three reactions: (a) efflux from the cell via reduction to lactate by lactate dehydrogenase (LDH); (b) complete oxidation or anaplerosis via decarboxylation to acetyl-CoA by the pyruvate dehydrogenase complex (PDC); and (c) anaplerosis via carboxylation to oxaloacetate (OAA) by pyruvate carboxylase (PC). The PDC and PC reactions not only contribute to the production of ATP via the TCA cycle and oxidative phosphorylation, but also supply the carbon substrate (acetyl-CoA) for de novo fatty acid synthesis and NADPH generation (via the malate cycle) (Ballard and Hanson, 1967). The activities of both PC and PDC are low in undifferentiated 3T3-L1 cells, but increase 20- and 7-fold, respectively, upon differentiation (Freytag and Utter, 1980; Hu et al., 1983). In Zucker fatty rats, PC gene expression is elevated 2∼5-fold at the onset of obesity compared to lean controls (Lynch et al., 1992). The expression of LDH is also higher in adipocytes than preadipocytes both in vitro and in vivo (Soukas et al., 2001). In rats (Newby et al., 1989) and humans (Kashiwagi et al., 1983), lactate production accounts for a significantly higher fraction of adipocyte glucose metabolism in obese, diabetic subjects (50∼62 %) compared with lean controls (5∼15 %) (DiGirolamo et al., 1992).
These findings suggest that adipocyte differentiation and ensuing enlargement, which is mainly characterized by triglyceride (TG) accumulation, may require coordinated adjustments in pyruvate metabolism. To investigate this idea at the level of reaction fluxes, we recently applied metabolic flux analysis (MFA) to newly differentiating 3T3-L1 adipocytes (Si et al., 2007). Results of this analysis showed that increased TG storage correlated with a significant shift in pyruvate flux from lactate fermentation into the TCA cycle.
The goal of this study was to test the hypothesis that TG accumulation in adipocytes could be modulated by specifically perturbing the flux distribution around pyruvate. We used oxamate (OXA) and phenylacetate (PA) to inhibit LDH and PC, respectively, and examined their global effects on the metabolic flux distribution of in vitro differentiated 3T3-L1 adipocytes. OXA is a structural analogue of pyruvate, and competitively inhibits LDH activity in a variety of cell types, including adipocytes (Hood et al., 1985). Upon uptake, PA is converted into phenylacetyl-CoA, which inhibits the activation of PC by acetyl-CoA (Bahl et al., 1997). Treating the cultured adipocytes with OXA or PA not only down-regulated the flux through LDH or PC, respectively, but also significantly reduced TG accumulation. The reduction in TG reflected broadly distributed flux changes throughout adipocyte metabolism, including glycolysis, lipolysis, and de novo fatty acid synthesis.
Materials and Methods
Materials
3T3-L1 cells were kindly provided by Prof. Barbara Corkey (Boston University School of Medicine, MA). Tissue culture reagents including Dulbecco's Modified Eagle's Medium (DMEM), calf serum (CS), fetal bovine serum (FBS), human insulin, and penicillin/streptomycin were purchased from Invitrogen (Carlsbad, CA). [1,2-13C]glucose was purchased from Cambridge Isotope Laboratories (Andover, MA). Unless otherwise noted, all other chemicals were purchased from Sigma (St. Louis, MO).
Cell culture and differentiation
3T3-L1 preadipocytes were plated onto 24-well plates and expanded in preadipocyte growth medium consisting of DMEM supplemented with CS (10 % v/v), penicillin and streptomycin. Medium was replenished every other day. Two days post-confluence, the cells were induced to differentiate using an adipogenic cocktail (1 μg/ml insulin, 0.5 mM isobutylmethylxanthine, and 1 μM dexamethasone) added to a basal medium (DMEM with 10 % FBS and penicillin/streptomycin). After 48 hrs, the first induction medium was replaced with a second medium consisting of the basal adipocyte medium supplemented with only insulin. After another 48 hrs, the second medium was replaced with the adipocyte basal medium containing different concentrations of OXA or PA. A subset of the inhibition experiments supplemented the basal medium with varying amounts of oleic acid (OA) or linoleic acid (LA). The amount of fatty acid supplementation reflected in vivo concentrations reported for mice (Menahan and Sobocinski, 1983). The fatty acids were added to the culture medium in complex with bovine serum albumin (BSA) at a 2:1 molar ratio. Replenishing the fatty acid and/or inhibitor added basal medium occurred every other day during the remainder of the culture experiments.
Microscopy
At the indicated time points, cellular morphology was recorded using phase-contrast microscopy (Nikon-US, Melville, NY). The images were analyzed using the SimplePCI software package (Compix Inc., Cranberry Township, PA). Intracellular lipid droplets were visualized by Oil Red O staining as described previously (Hauner et al., 2001).
Real-time RT PCR
Total RNA was isolated using the RNeasy Mini Kit from QIAGEN (Valencia, CA). Reverse transcription was performed on a PTC-100 Programmable Thermal Controller (MJ Research, Waltham, MA) using the High-Capacity cDNA Archive Kit (Applied Biosystems, Foster City, CA) with random primers. The peroxisome proliferator-activated receptor-γ (PPAR-γ) and glycerol-3-phosphate dehydrogenase (GPDH) mRNA and 18S rRNA levels were determined using the TaqMan Gene Expression assay (Applied Biosystems, Foster City, CA). All gene expression data were normalized to the 18S rRNA contents in corresponding samples. Fold-changes with respect to untreated control were calculated using the normalized data.
Metabolite assays
Metabolite measurements were performed both on cell lysates and spent medium samples as described previously (Si et al., 2007). Cells were lysed in situ with a 0.1 % SDS buffer and sonicated. Immediately after collection, the spent medium samples were cleaned of cell debris by a brief centrifugation step. Free glycerol, TG and FFA were measured using enzymatic assay kits (Sigma). Glucose and lactate concentrations were measured using the methods of Trinder (Trinder, 1969) and Loomis (Loomis, 1961), respectively. Amino acids were quantified by HPLC (Alliance 2690, Waters, Milford, MA) using fluorescence-based detection following pre-column derivatization of primary or secondary amines with 6-aminoquinolyl-N-hydroxysuccinimidyl-carbamate (Cohen and De Antonis, 1994). All metabolite data were normalized by the corresponding cell sample DNA content, which was determined with a fluorescence-based assay using the Hoechst dye.
Oxygen uptake
The dissolved oxygen in the culture medium was measured using a needle-type fiber-optic microsensor (MicroxTX3, Presens, Regensburg, Germany). The concentration data were related to the oxygen uptake rate (OUR) using a diffusion-reaction model. The measured OUR was used for relative comparisons between the treatment groups and not used for MFA in order to independently confirm the calculated OUR.
Stoichiometric model and metabolic flux analysis (MFA)
A stoichiometric network model of adipocyte intermediary metabolism was constructed as described previously (Si et al., 2007). Table S1 in the supplementary materials section provides a complete listing of the reactions. Intracellular fluxes were estimated from measurements on metabolite uptake and output rates (exchange fluxes) by solving a constrained non-linear optimization problem with stoichiometric and thermodynamic constraints (Nolan et al., 2006).
Isotopomer model
Model based analysis of isotopomer distribution patterns provided additional flux estimates for selected experimental conditions. Briefly, calculation of reaction fluxes from mass isotopomer distribution data proceeded as follows (see Supplementary Materials for additional details). The calculation initializes with an assumed set of reaction fluxes that satisfy the metabolite balance constraints (step 0). Steady state isotopomer balance equations then calculate the corresponding isotopomer distribution pattern (step 1). This calculation utilized the elementary metabolite unit (EMU) framework (Antoniewicz et al., 2007) to reduce the number of model equations and variables. The EMU decomposition also eliminated non-linear equations of mass isotopomer distribution (MID) and reaction flux variables. The next algorithm step compares the simulated isotopomer pattern against measured data and updates the reaction fluxes (step 2). Steps 1 and 2 repeat until the simulated and measured data converge. These steps were implemented through non-linear constrained optimization. The objective function was to minimize the sum-squared error between measured and calculated exchange fluxes as well as intracellular metabolite mass isotopomer distribution patterns. The optimization problem was solved using a custom code written in MATLAB (Natick, MA).
Isotopomer measurements
Preliminary model simulations identified glucose labeled on carbons 1 and 2 as the optimal isotopomer input substrate. Thus, the labeling experiments used an enriched medium with [1,2-13C]glucose added at a final concentration of 4.5 g/L to a glucose-free basal medium (DMEM supplemented with 10 % FBS and penicillin/streptomycin). After 2 days of culture in 6-well plates with the labeling medium, intracellular metabolites were isolated from the cells through two sets of extractions (Ritter et al., 2008). Before the extractions, the cells were briefly washed with cold (4 °C) PBS.
For the initial extraction, each well received 600 μL of cold methanol/chloroform (2:1, v/v). After transferring 500 μL of the cell extract to sample tubes containing 500 μL of cold chloroform, each well received another rinse with 900 μL of a 3.8 mM tricine/methanol (10:9, v/v) solution. The liquid sample collected from the rinse was added to the sample tubes with the methanol/chloroform extract. The samples were vortexed and then centrifuged for 5 min at 0 °C with 16,000×g to collect the aqueous layer. For the second extraction, each well received 800 uL of the cold methanol/tricine solution. Cell extracts were collected following a 5 min incubation at 4 °C and then transferred to sample tubes containing the organic (choloroform) phase of the first extraction. The sample tubes were again vortexed and centrifuged for 5 min at 0 °C with 16,000×g. The aqueous phases from both extractions were combined, heated for 4 min at 90°C, and centrifuged for 10 min at 0 °C with 16,000×g. The supernatant was collected and then dried.
LC-MS analysis was performed on an LTQ Linear Ion Trap mass spectrometer coupled to a Surveyor HPLC system (ThermoFinnigan, San Jose, CA). The mass spectrometer was operated in negative ion mode with selected reaction monitoring. Prior to injection, the previously dried samples were dissolved in water/methanol (50:50, v/v). Chromatographic separation used a C18 reverse-phase column (Atlantis, Waters, Milford, MA). The mobile phases were a 0.1 % (w/v) acetic acid solution (A) and methanol (B). The eluent from the HPLC entered the mass spectrometer via direct injection at a flow rate of 200 μL/min.
Statistics
Comparisons between two experimental groups were performed using one-way ANOVA. The number of biological replicates is indicated in the figure or table legends. Group means were deemed to be statistically significantly different when p < 0.05.
Results
Proliferation and differentiation
Chemical inhibitors were first added to the culture medium on day 4 post-induction to avoid interfering with the early differentiation program of the 3T3-L1 cells. Treatment with the chemical inhibitors at the indicated levels did not significantly affect the total cell number on day 12 post-induction, when the cultures were terminated (Figure 1A). Differentiation was assessed by measuring the mRNA expression of PPAR-γ and GPDH on days 8 and 12 post-induction (Brun et al., 1996; Pairault and Green, 1979). The inhibitors had no statistically significant effect on the expression of either gene on day 8 (Panel A). The inhibitor treated cells showed slightly higher gene expression levels on day 12 (Panel B).
Figure 1.
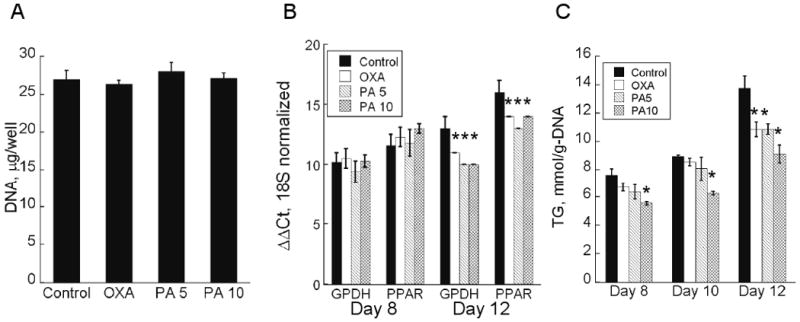
Adipocyte proliferation and differentiation. (A) Total DNA per well on day 12 post-induction. Data shown are means ± SD (n=6). (B) Gene expression levels of PPAR-γ and GPDH on days 8 and 12 post-induction (n=5). Values indicate real-time RT-PCR iteration counts for which the corresponding melt curves peaked above set threshold. All values were normalized with respect to the iteration counts of 18S rRNA. (C) Intracellular TG on days 8, 10 and 12 post-induction. Data shown are means ± SD (n=6). *: statistically significantly different from untreated control (p < 0.05).
Reduction in TG accumulation
The amount of intracellular TG in the adipocytes was monitored at different time points after beginning the inhibitor treatments (Figure 1C). The largest differences relative to the untreated control were observed on day 12 post-induction, when the adipocytes were expected to have achieved their mature phenotype. Based on this observation, the remainder of this study focused on metabolite data collected between days 10 and 12 post-induction. Morphological assessment showed that the induced cells were round and contained visible lipid droplets. Oil Red O staining visually confirmed that adipocytes treated with OXA and PA contained less lipid than the untreated controls (Figure 2). The reduction in TG on day 12 varied from 21 to 34 % depending on the inhibitor type and concentration, with 10 mM PA having the largest effect (Figure 1C). The intracellular FFA concentration (Figure 3A) was unaffected by OXA, but significantly reduced by 9 and 17 % with 5 and 10 mM PA treatment, respectively.
Figure 2.
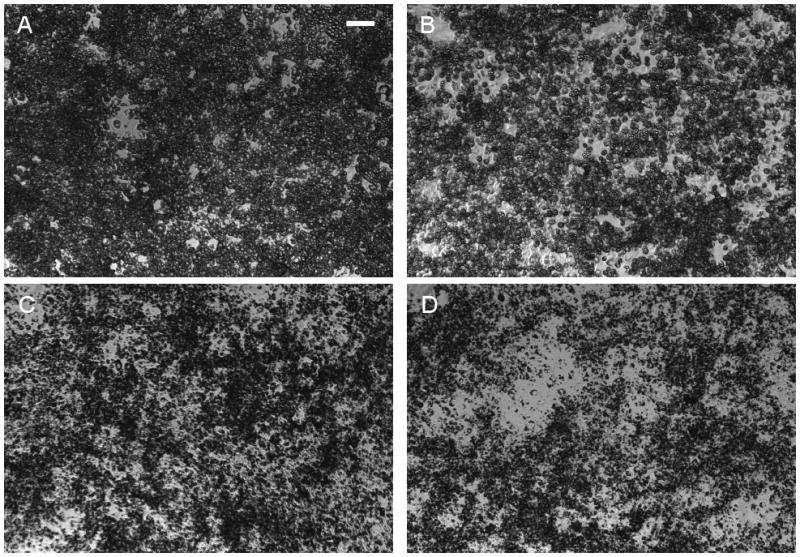
Oil-Red O stained images of 3T3-L1 cells on day 12 post-induction. (A) Control, (B) 20 mM OXA, (C) 5 mM PA, and (D) 10 mM PA. Scale bar is 100 μm.
Figure 3.
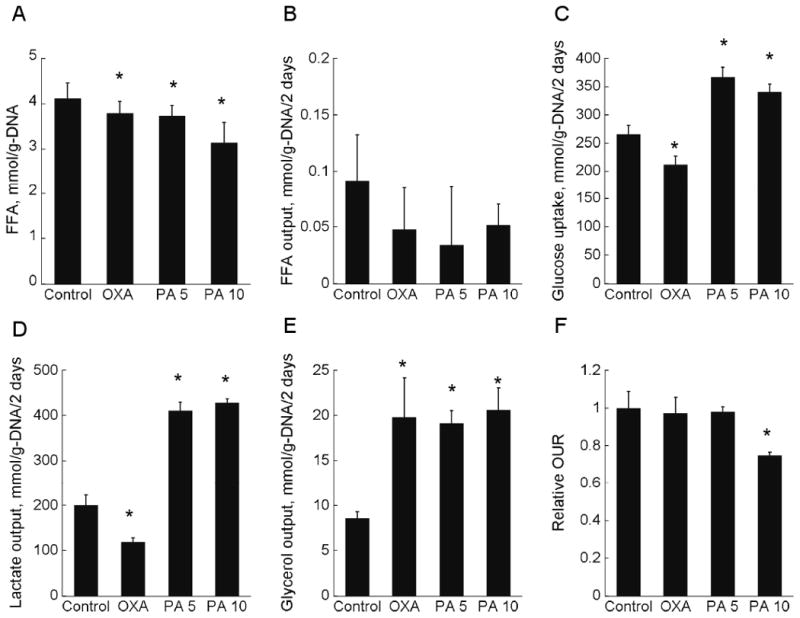
Metabolite profile on day 12 post-induction. (A) Intracellular FFA, (B) FFA output, (C) glucose uptake, (D) lactate output, (E) glycerol output, and (F) OUR. Data shown are means ± SD (n=6). *: statistically significantly different from untreated control (p < 0.05).
Metabolite profile
To examine whether the chemical inhibitors also affected other parts of adipocyte metabolism, we measured the uptake or output of 25 primary metabolites on day 12 post-induction. For brevity, the following description focuses only on the profiles of glucose, lactate, glycerol, FFA and oxygen. The amino acids were utilized to smaller extents, accounting for less than 10 % of total carbon uptake (Table S2). The inhibitory effect of OXA on LDH was dose-dependent (Figure 3D). At 20 mM, OXA treatment significantly inhibited lactate output by 40 % compared to untreated control. This treatment also significantly reduced glucose uptake by 20 % (Figure 3C). The largest effect was observed for glycerol output, which was raised 1.3-fold (Figure 3E). Oxygen consumption was not significantly affected by OXA treatment (Figure 3F). Treatment with 5 and 10 mM PA significantly increased glucose uptake by 38 and 28 %, respectively (Figure 3C) and lactate output by more than 2-fold (Figure 3D). Treatment with 5 and 10 mM PA also significantly increased glycerol output by 1.2- and 1.4-fold, respectively (Figure 3E). Oxygen consumption was significantly affected (25 % reduction) at the higher concentration (Figure 3F). The net release of FFA into the medium was negligible and not significantly different across all treatment conditions (Figure 3B).
Metabolic flux analysis (MFA)
We applied MFA to integrate the metabolite measurements and quantify the broader impact of the inhibitors on adipocyte intermediary metabolism. Figure 4 summarizes the estimated fluxes through the major pathways. The complete flux data are shown in Table S3. As suggested by the glucose profile, OXA down-regulated the flux through glycolysis (17∼26 %). In addition, flux through the PPP (82 %), pyruvate flux entering the TCA cycle (21 %), PC flux (41 %) and citrate transport out of the mitochondria (44 %) were all decreased. The reactions of the TCA cycle and oxidative phosphorylation were not significantly affected. While de novo fatty acid synthesis decreased by 49 %, TG synthesis and lipolysis both increased by 65 and 131 %, respectively. The net effect was to reduce TG accumulation by 52 %. The OUR estimate from the flux model showed no statistical difference between control and OXA treatment, in good agreement with the measurements.
Figure 4.

Flux distribution through major metabolic pathways on day 12 post-induction. Top to bottom, data shown are mean fluxes ± SD (n=6) of control, 20 mM OXA, and 10 mM PA. All units are in mmol/g-DNA/2 days. Fluxes that are statistically significantly different from untreated control (p < 0.05) are shown in bold. Mitochondrial metabolites are shaded in gray.
The effects of PA were dose-dependent. Both 5 and 10 mM treatment increased the flux through glycolysis (15∼60 %), but only the lower concentration reduced the PPP flux (83 %). The total pyruvate flux into the mitochondrial reactions was not affected at 5 mM, but significantly decreased (29 %) at the higher concentration. The PC flux decreased by 23 and 33 % in the 5 and 10 mM PA conditions, respectively. At 10 mM PA, PDC flux also decreased by 27 %. Citrate transport out of the mitochondria also decreased, by 40 and 46 % in the 5 and 10 mM PA conditions, respectively. The other reactions of the TCA cycle were not affected. The calculated OUR was in qualitative agreement with the experimental results. Estimates from MFA predicted a 23 % decrease in OUR for the 10 mM PA condition and no significant difference for the 5 mM condition. Measurements showed a 52 % decrease in OUR for the 10 mM condition and no significant difference for the 5 mM condition. The calculated trend for CO2 output was similar to that for the OUR. Compared to untreated control, the estimated effects on CO2 output were no change and a 23 % decrease for the 5 and 10 mM conditions, respectively. Finally, the PA treatment reduced de novo fatty acid synthesis by ca. 40 %. The fluxes through other lipogenic reactions (including esterification) were increased 64 ∼75 %, with the higher concentration having the larger effect. The effect on lipolysis was larger, with increases of 1.2- and 1.4-fold, respectively, in cultures treated with 5 and 10 mM PA. Flux through phosphoenolpyruvate carboxykinase (PEPCK), a key step in glycerogenesis, also decreased by 40 %. The net result was that TG accumulation was reduced by 40 %.
Isotopomer analysis
To corroborate the MFA results, we obtained additional flux estimates from isotopic labeling experiments performed on selected treatment groups. There was overall excellent agreement between the two sets of flux estimates as the isotopomer analysis confirmed all major trends predicted by the MFA. For example, both MFA and isotopomer analysis estimated a 10 % decrease in glycolysis with 10 mM PA treatment. The estimated decrease in PPP flux was 48 and 61 %, respectively, based on MFA and isotopomer analysis. Other notable flux changes corroborated by the isotopomer analysis were the reduction in de novo fatty acid synthesis (60 and 89 % by MFA and isotopomer analysis, respectively) and citrate export from the mitochondria (58 and 91 % by MFA and isotopomer analysis, respectively). The agreement in the flux estimates was somewhat less quantitative for a few selected reactions in and around the TCA cycle. For example, both MFA and isotopomer analysis estimated a decrease in TCA cycle activity with 10 mM PA treatment. The reduction in flux was 60 and 17 % based on MFA and isotopomer analysis.
Free fatty acid supplementation
The MFA results suggested that both OXA and PA reduced net TG storage by suppressing de novo fatty acid synthesis. Therefore, we tested whether the inhibitors' effects could be countered by exogenously introducing free fatty acids (FFA) through medium supplementation. Varying amounts of oleic (OA) or linoleic (LA) acid were added to the culture medium beginning on day 4 post-induction. Measurements on fresh and spent medium samples showed dose-dependent net uptake of both OA and LA by the adipocytes (Figure 5A). Overall, the mono- (OA) and polyunsaturated fatty acids (LA) produced similar effects (Figures 5B and 5C). When the culture medium was supplemented with OA or LA, cells treated with OXA accumulated nearly the same amount of TG as the untreated controls. The differences in the TG level between the treated and untreated cells were statistically insignificant for all doses (0.15 – 0.5 mM) of OA and LA. Supplementing the culture medium with OA or LA also attenuated the reduction in cellular TG achieved by PA treatment. The attenuation was dose-dependent, and quantitatively greater in cells treated with the lower concentration of PA. At the highest dose, OA or LA supplementation completely abolished the TG lowering effect of 5 mM PA treatment. Even at the highest dose of OA or LA, the effect of 10 mM PA treatment was not completely reversed. Nevertheless, OA or LA supplementation dose-dependently increased the TG level up to 2-fold. Interestingly, OA or LA supplementation had no effect on the TG level of untreated control cells.
Figure 5.
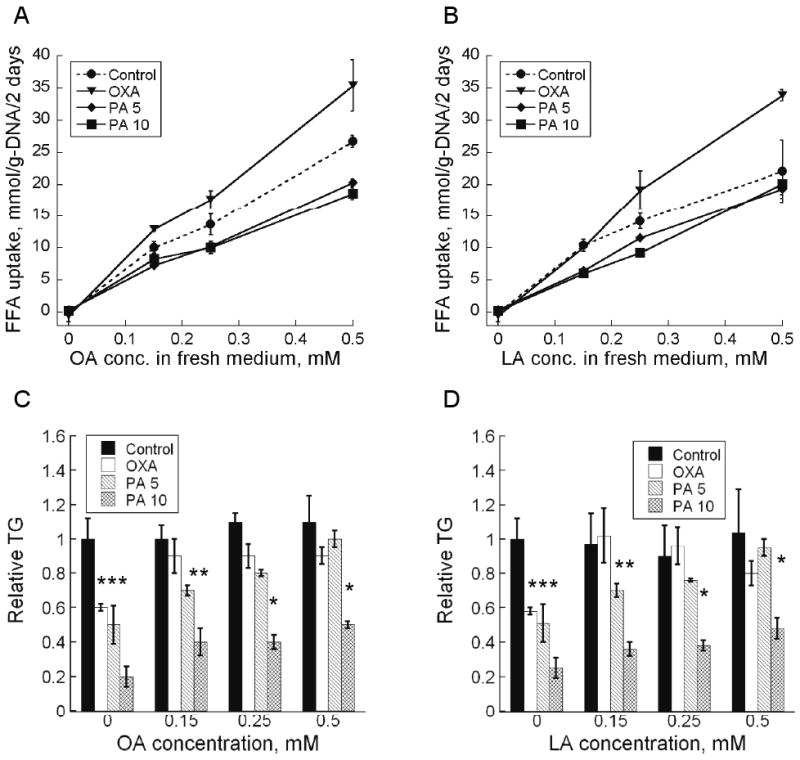
(A) OA and (B) LA consumption between days 10 and 12 post-induction. Effect of (C) OA and (D) LA on intracellular TG on day 12 post-induction. Data shown are means ± SD (n=3). *: statistically significantly different from untreated control (p < 0.05).
Discussion
A previous study on the metabolic profile of in vitro 3T3-L1 adipogenesis pointed to a strong correlation between induction of lipogenic activity and a re-distribution of reaction fluxes around pyruvate (Si et al., 2007). In this study, we used chemical inhibitors to investigate whether specifically perturbing pyruvate metabolism affects TG accumulation. The two inhibitors, OXA and PA, both lowered the targeted reaction flux in a dose-dependent manner (Table S3, reactions #7 and #11). Although these inhibitors work acutely, our goal was to achieve sustained down-regulation of the target reaction fluxes. Therefore, the inhibitors were administered over an extended period from day 4 post-induction, when visible lipid droplets first appeared, to day 12, when the induced 3T3-L1 cells were considered mature adipocytes. Indeed, the reduction in TG correlated with the treatment duration (Figure 1C). This reduction did not appear to reflect a disruption of normal proliferation (Figure 1A) and differentiation (Figure 1B).
We applied a previously developed MFA model (Si et al., 2007) to characterize the effects of the chemical inhibitors on adipocyte intermediary metabolism. To assess the accuracy of the model, we compared the calculated and experimentally determined OUR trends across the different treatment groups. Flux calculations (Table S3, reaction #60) correctly predicted that the inhibitors either decreased (10 mM PA condition) or did not affect (20 mM OXA and 5 mM PA conditions) the OUR. Model estimates were also corroborated by previous reports on the effects of LDH or PC inhibition. For example, we found that inhibiting LDH decreased glucose uptake, consistent with studies on the effect of OXA on tumor cell (HeLa S3) glycolysis (Goldberg and Colowick, 1965; Goldberg et al., 1965). Similar results were obtained in Chinese hamster ovary cells when LDH was down-regulated by homologous recombination (Chen et al., 2001) or siRNA treatment (Kim and Lee, 2007). Literature evidence was also found for the PPP flux estimate. Treatment of Krebs ascites cells with (80 mM) OXA was shown to dramatically reduce the activity of the PPP (by 50 %) via a redox-coupled mechanism (Gumaa and McLean, 1969). The MFA model of this study estimated an 82 % smaller PPP flux in OXA treated adipocytes compared to untreated control cells. One explanation for the smaller PPP flux involves a reduced demand for NADPH by de novo fatty acid synthesis (Fabregat et al., 1987) as discussed below.
Consistent with our hypothesis, we found that inhibiting LDH or PC reduced TG accumulation. The model calculations (Table S3, reaction #24) and measurements on intracellular FFA levels (Figure 3A) both suggested that this reduction was due to a suppression of de novo fatty acid synthesis. We tested this explanation by providing an exogenous source of FFA to the cells, thereby relieving the dependence of TG formation on de novo synthesis. In cells inhibited with OXA, supplementing the culture medium with OA or LA completely relieved the dependence on intracellular fatty acid synthesis. In cells inhibited with PA, the effect depended on the dose of both the inhibitor and the FFA (Figures 5C and 5D). These findings cannot rule out the possibility that the exogenously supplied FFA stimulated TG synthesis through another mechanism, for example induction of PPAR-γ (Grimaldi, 2007). However, such a mechanism is unlikely, since the FFA supplementation did not affect the TG level of untreated control cells.
In addition to de novo fatty acid synthesis, the inhibitors down-regulated anaplerosis into the TCA cycle and citrate efflux from the mitochondria. These flux adjustments could reflect the following dependencies. Fatty acid synthesis demands a cytosolic supply of acetyl-CoA, which is formed via cleavage of citrate by the ATP-dependent citrate lyase. The cytosolic pool of citrate is derived via export from the mitochondrial pool. The export of citrate drains the pool available for the TCA cycle. One way to compensate against this drain is to replenish the mitochondrial OAA pool, which is an anaplerotic function attributed to PC (Ballard and Hanson, 1967). Based on these supply-demand relationships, the down-regulation of fatty acid synthesis by OXA and PA can be traced to an inhibition of PC-mediated anaplerosis. Inhibition by OXA was likely indirect, and resulted from diminished glycolysis and total pyruvate supply. In contrast, PA directly suppresses PC activity through its metabolic derivative phenylacetyl-CoA, which is a known allosteric inhibitor of the enzyme (Bahl et al., 1997).
Another shared effect of both inhibitors was to up-regulate glycerol output (Figure 3E). Despite increasing glycerol output, which normally correlates with lipolysis, the inhibitors did not trigger significant FFA release into the medium (Figure 3B). It is unlikely that there was a greater demand for FFA by β-oxidation, because the OUR either decreased or remained unaffected. A more plausible conclusion is that the inhibitor treatments led to increased cycling between lipolysis and re-esterification. In vivo, the recycling of FFAs in adipose tissue can be as high as 30 % in rats (Vaughan, 1962) and 40 % in humans (Jensen et al., 2001) and has been suggested as a buffering mechanism against uncontrolled FFA release during periods of active lipolysis (Reshef et al., 1970). This recycling requires glycerol 3-phosphate (G3P), which may be derived from glycolysis or glycerogenesis (Reshef et al., 2003). Model calculations estimated that the inhibitor treatments raised the net flux of glycerol-3-phosphate (G3P) formation by 64∼75 % (Table S3, net difference between reactions #3 and #4). Increased recycling of intracellular FFA could also reflect an up-regulation of hormone-sensitive lipase (HSL) activity. In adipocytes, HSL is a key lipolytic enzyme catalyzing the hydrolysis of intracellular TG and diacylglycerol (Carmen and Victor, 2006), whose activity is inhibited by long-chain acyl-CoAs (LC-CoAs) (Hu et al., 2005; Jepson and Yeaman, 1992; Severson and Hurley, 1984). In this study, we found significantly lower levels of FFA in the inhibitor treated cells compared to untreated controls (Figure 3A).
Taken together, the results of this inhibition study support the idea that adipose tissue mass could be controlled by suppressing fatty acid synthesis in adipocytes. Our results are supported by earlier in vivo studies that have found a significant correlation between PC activity and de novo lipid synthesis (Ballard and Hanson, 1967; Freytag and Utter, 1980; Mackall and Lane, 1977; Patel and Hanson, 1970; Patel et al., 1971). The correlation is especially noteworthy in animal models of obesity. Spydevold and Greenraum reported that the PC activity in the adipose tissue is 200 times greater in obese Zucker rats (fa/fa) than their lean litter mages (fa/-) (Spydevold et al., 1978) Interestingly, PC activity in the liver was not significantly different (Lynch et al., 1992; Spydevold et al., 1978), suggesting that the obesity-related change in enzyme activity is tissue-specific.
Nevertheless, the physiological consequence and therapeutic relevance of inhibiting adipocyte fatty acid synthesis warrants further examination. One question is whether de novo fatty acid synthesis contributes quantitatively to TG formation in adipocytes in vivo. A recent long-term study involving human subjects found that 20 % of newly synthesized TG in subcutaneous fat pads is derived from de novo synthesized fatty acids (Strawford et al., 2004). A second question is whether white adipose tissue is a major site of de novo fatty acid synthesis. In humans, the liver is considered to be the main organ for fatty acid synthesis (Hillgartner et al., 1995). However, the activities of lipogenic enzymes in the liver and adipose tissue are essentially similar when normalized by the respective cellular protein contents (Swierczynski et al., 2000). In humans, the various adipose tissue depots combined weigh ca. 10 times more than the liver. In this light, de novo fatty acid synthesis in adipocytes on aggregate could be a quantitatively significant process in the accumulation of body fat.
It is worth pointing out that treating the adipocytes with a PC inhibitor not only decreased cellular TG loading but also increased net glucose uptake, which could potentially aid in lowering the high blood glucose of obese-diabetic subjects. The increased glucose uptake was accompanied by elevated lactate production, which possibly reflects a metabolic adaptation against reduced oxidative phosphorylation efficiency. Model calculations and OUR measurements indicated that strong inhibition of PC (10 mM PA) significantly attenuated the flux of pyruvate entering the TCA cycle and reduced the ATP yield from oxidative phosphorylation (Table S3, reaction #22 and #23). Similar up-regulation of anaerobic glycolysis have been reported in other studies involving hypoxia (Zhang et al., 1999) or treatments with different inhibitors of oxidative phosphorylation, including rotenone (Bashan et al., 1993), cyanide (Mercado et al., 1989), and 2,4-dinitrophenol (Kang et al., 2001; Rossmeisl et al., 2000).
In conclusion, the results of this study support the hypothesis that the pyruvate reactions exert significant flux control over TG accumulation in adipocytes. These results potentially suggest a strategy for intervention against adiposity in humans at the level of cellular metabolism, as the pathways of intermediary metabolism are extremely well conserved across different species. Such a strategy warrants further studies, for example using in vivo models, to confirm the role of anaplerosis in controlling adipocyte TG synthesis across a range of physiological conditions. Given that chemical inhibitors could very well affect multiple enzymes, the use of target-specific inhibitors such as siRNAs will be crucial to these future studies.
Supplementary Material
Acknowledgments
The authors gratefully acknowledge Dr. David Wilber in the Tufts Department of Chemistry for mass spectrometry help and use of facilities. The authors also thank Dr. Michael L. Lovett for his assistance with oxygen measurements. This work was in part supported by a National Institutes of Health grant (DK67228-01) and National Science Foundation grant (0651359) to KL.
Footnotes
Publisher's Disclaimer: This is a PDF file of an unedited manuscript that has been accepted for publication. As a service to our customers we are providing this early version of the manuscript. The manuscript will undergo copyediting, typesetting, and review of the resulting proof before it is published in its final citable form. Please note that during the production process errors may be discovered which could affect the content, and all legal disclaimers that apply to the journal pertain.
References
- Antoniewicz MR, et al. Elementary metabolite units (EMU): a novel framework for modeling isotopic distributions. Metab Eng. 2007;9:68–86. doi: 10.1016/j.ymben.2006.09.001. [DOI] [PMC free article] [PubMed] [Google Scholar]
- Bahl JJ, et al. In vitro and in vivo suppression of gluconeogenesis by inhibition of pyruvate carboxylase. Biochem Pharmacol. 1997;53:67–74. doi: 10.1016/s0006-2952(96)00660-0. [DOI] [PubMed] [Google Scholar]
- Ballard FJ, Hanson RW. The citrate cleavage pathway and lipogenesis in rat adipose tissue: replenishment of oxaloacetate. J Lipid Res. 1967;8:73–9. [PubMed] [Google Scholar]
- Bashan N, et al. Mechanisms of adaptation of glucose transporters to changes in the oxidative chain of muscle and fat cells. Am J Physiol. 1993;264:C430–40. doi: 10.1152/ajpcell.1993.264.2.C430. [DOI] [PubMed] [Google Scholar]
- Brun RP, et al. Differential activation of adipogenesis by multiple PPAR isoforms. Genes Dev. 1996;10:974–84. doi: 10.1101/gad.10.8.974. [DOI] [PubMed] [Google Scholar]
- Carmen GY, Victor SM. Signalling mechanisms regulating lipolysis. Cell Signal. 2006;18:401–8. doi: 10.1016/j.cellsig.2005.08.009. [DOI] [PubMed] [Google Scholar]
- Chen K, et al. Engineering of a mammalian cell line for reduction of lactate formation and high monoclonal antibody production. Biotechnol Bioeng. 2001;72:55–61. doi: 10.1002/1097-0290(20010105)72:1<55::aid-bit8>3.0.co;2-4. [DOI] [PubMed] [Google Scholar]
- Cohen SA, De Antonis KM. Applications of amino acid derivatization with 6-aminoquinolyl-N-hydroxysuccinimidyl carbamate. Analysis of feed grains, intravenous solutions and glycoproteins. J Chromatogr A. 1994;661:25–34. doi: 10.1016/0021-9673(93)E0821-B. [DOI] [PubMed] [Google Scholar]
- DiGirolamo M, et al. Lactate production in adipose tissue: a regulated function with extra-adipose implications. FASEB J. 1992;6:2405–12. doi: 10.1096/fasebj.6.7.1563593. [DOI] [PubMed] [Google Scholar]
- Fabregat I, et al. The NADPH consumption regulates the NADPH-producing pathways (pentose phosphate cycle and malic enzyme) in rat adipocytes. Mol Cell Biochem. 1987;74:77–81. doi: 10.1007/BF00221914. [DOI] [PubMed] [Google Scholar]
- Freytag SO, Utter MF. Induction of pyruvate carboxylase apoenzyme and holoenzyme in 3T3-L1 cells during differentiation. Proc Natl Acad Sci U S A. 1980;77:1321–5. doi: 10.1073/pnas.77.3.1321. [DOI] [PMC free article] [PubMed] [Google Scholar]
- Goldberg EB, Colowick SP. The Role Of Glycolysis In The Growth Of Tumor Cells. 3. Lactic Dehydrogenase As The Site Of Action Of Oxamate On The Growth Of Cultured Cells. J Biol Chem. 1965;240:2786–90. [PubMed] [Google Scholar]
- Goldberg EB, et al. The Role Of Glycolysis In The Growth Of Tumor Cells. Iv. The Basis Of Glucose Toxicity In Oxamate-Treated, Cultured Cells. J Biol Chem. 1965;240:2791–6. [PubMed] [Google Scholar]
- Grimaldi PA. Peroxisome proliferator-activated receptors as sensors of fatty acids and derivatives. Cell Mol Life Sci. 2007;64:2459–64. doi: 10.1007/s00018-007-7278-5. [DOI] [PMC free article] [PubMed] [Google Scholar]
- Gumaa KA, McLean P. Effect of oxamate, pyruvate, nicotinamide and streptozotocin on the pentose phosphate pathway intermediates in ascites tumour cells. Biochem Biophys Res Commun. 1969;35:86–93. doi: 10.1016/0006-291x(69)90486-0. [DOI] [PubMed] [Google Scholar]
- Hauner H, et al. Cultures of human adipose precursor cells. In: Ailhaud G, editor. Adipose tissue protocols. Humana Press; Totowa, N.J.: 2001. p. xiii.p. 334. [Google Scholar]
- Hillgartner FB, et al. Physiological and molecular mechanisms involved in nutritional regulation of fatty acid synthesis. Physiol Rev. 1995;75:47–76. doi: 10.1152/physrev.1995.75.1.47. [DOI] [PubMed] [Google Scholar]
- Hood RL, et al. Inhibition by potential metabolic inhibitors of in vitro adipose tissue lipogenesis. Comparative Biochemistry and Physiology Part B: Biochemistry and Molecular Biology. 1985;81:667–670. doi: 10.1016/0305-0491(85)90383-9. [DOI] [PubMed] [Google Scholar]
- Hu CW, et al. Induction of pyruvate dehydrogenase in 3T3-L1 cells during differentiation. J Biol Chem. 1983;258:2315–20. [PubMed] [Google Scholar]
- Hu L, et al. Regulation of lipolytic activity by long-chain acyl-coenzyme A in islets and adipocytes. Am J Physiol Endocrinol Metab. 2005;289:E1085–92. doi: 10.1152/ajpendo.00210.2005. [DOI] [PubMed] [Google Scholar]
- Jensen MD, et al. Lipid metabolism during fasting. Am J Physiol Endocrinol Metab. 2001;281:E789–793. doi: 10.1152/ajpendo.2001.281.4.E789. [DOI] [PubMed] [Google Scholar]
- Jepson CA, Yeaman SJ. Inhibition of hormone-sensitive lipase by intermediary lipid metabolites. FEBS Lett. 1992;310:197–200. doi: 10.1016/0014-5793(92)81328-j. [DOI] [PubMed] [Google Scholar]
- Kang J, et al. Effects of cellular ATP depletion on glucose transport and insulin signaling in 3T3-L1 adipocytes. Am J Physiol Endocrinol Metab. 2001;280:E428–35. doi: 10.1152/ajpendo.2001.280.3.E428. [DOI] [PubMed] [Google Scholar]
- Kashiwagi A, et al. In vitro insulin resistance of human adipocytes isolated from subjects with noninsulin-dependent diabetes mellitus. J Clin Invest. 1983;72:1246–54. doi: 10.1172/JCI111080. [DOI] [PMC free article] [PubMed] [Google Scholar]
- Kim SH, Lee GM. Down-regulation of lactate dehydrogenase-A by siRNAs for reduced lactic acid formation of Chinese hamster ovary cells producing thrombopoietin. Appl Microbiol Biotechnol. 2007;74:152–9. doi: 10.1007/s00253-006-0654-5. [DOI] [PubMed] [Google Scholar]
- Loomis ME. An enzymatic fluorometric method for the determination of lactic acid in serum. J Lab Clin Med. 1961;57:966–969. [PubMed] [Google Scholar]
- Lynch CJ, et al. Pyruvate carboxylase in genetic obesity. Am J Physiol. 1992;262:E608–18. doi: 10.1152/ajpendo.1992.262.5.E608. [DOI] [PubMed] [Google Scholar]
- Mackall JC, Lane MD. Role of pyruvate carboxylase in fatty acid synthesis: alterations during preadipocyte differentiation. Biochem Biophys Res Commun. 1977;79:720–5. doi: 10.1016/0006-291x(77)91171-8. [DOI] [PubMed] [Google Scholar]
- Menahan LA, Sobocinski KA. Comparison of carbohydrate and lipid metabolism in mice and rats during fasting. Comp Biochem Physiol B. 1983;74:859–64. doi: 10.1016/0305-0491(83)90157-8. [DOI] [PubMed] [Google Scholar]
- Mercado CL, et al. Enhanced glucose transport in response to inhibition of respiration in Clone 9 cells. Am J Physiol. 1989;257:C19–28. doi: 10.1152/ajpcell.1989.257.1.C19. [DOI] [PubMed] [Google Scholar]
- Newby FD, et al. Effects of streptozocin-induced diabetes on glucose metabolism and lactate release by isolated fat cells from young lean and older, moderately obese rats. Diabetes. 1989;38:237–243. doi: 10.2337/diab.38.2.237. [DOI] [PubMed] [Google Scholar]
- Nolan RP, et al. Identification of distributed metabolic objectives in the hypermetabolic liver by flux and energy balance analysis. Metab Eng. 2006;8:30–45. doi: 10.1016/j.ymben.2005.08.004. [DOI] [PubMed] [Google Scholar]
- Pairault J, Green H. A study of the adipose conversion of suspended 3T3 cells by using glycerophosphate dehydrogenase as differentiation marker. Proc Natl Acad Sci U S A. 1979;76:5138–42. doi: 10.1073/pnas.76.10.5138. [DOI] [PMC free article] [PubMed] [Google Scholar]
- Patel MS, Hanson RW. Carboxylation of pyruvate by isolated rat adipose tissue mitochondria. J Biol Chem. 1970;245:1302–10. [PubMed] [Google Scholar]
- Patel MS, et al. Pathway of carbon flow during fatty acid synthesis from lactate and pyruvate in rat adipose tissue. J Lipid Res. 1971;12:179–91. [PubMed] [Google Scholar]
- Reshef L, et al. A Possible Physiological Role for Glyceroneogenesis in Rat Adipose Tissue. J Biol Chem. 1970;245:5979–5984. [PubMed] [Google Scholar]
- Reshef L, et al. Glyceroneogenesis and the Triglyceride/Fatty Acid Cycle. J Biol Chem. 2003;278:30413–30416. doi: 10.1074/jbc.R300017200. [DOI] [PubMed] [Google Scholar]
- Ritter JB, et al. Simultaneous extraction of several metabolites of energy metabolism and related substances in mammalian cells: optimization using experimental design. Anal Biochem. 2008;373:349–69. doi: 10.1016/j.ab.2007.10.037. [DOI] [PubMed] [Google Scholar]
- Rossmeisl M, et al. Decreased fatty acid synthesis due to mitochondrial uncoupling in adipose tissue. Faseb J. 2000;14:1793–800. doi: 10.1096/fj.99-0965com. [DOI] [PubMed] [Google Scholar]
- Severson DL, Hurley B. Inhibition of the hormone-sensitive lipase in adipose tissue by long-chain fatty acyl coenzyme A. Lipids. 1984;19:134–8. doi: 10.1007/BF02534504. [DOI] [PubMed] [Google Scholar]
- Si Y, et al. Flux profile and modularity analysis of time-dependent metabolic changes of de novo adipocyte formation. Am J Physiol Endocrinol Metab. 2007;292:E1637–46. doi: 10.1152/ajpendo.00670.2006. [DOI] [PubMed] [Google Scholar]
- Soukas A, et al. Distinct transcriptional profiles of adipogenesis in vivo and in vitro. J Biol Chem. 2001;276:34167–74. doi: 10.1074/jbc.M104421200. [DOI] [PubMed] [Google Scholar]
- Spydevold SO, et al. Adaptive responses of enzymes of carbohydrate and lipid metabolism to dietary alteration in genetically obese Zucker rats (fa/fa) Eur J Biochem. 1978;89:329–39. doi: 10.1111/j.1432-1033.1978.tb12534.x. [DOI] [PubMed] [Google Scholar]
- Strawford A, et al. Adipose tissue triglyceride turnover, de novo lipogenesis, and cell proliferation in humans measured with 2H2O. Am J Physiol Endocrinol Metab. 2004;286:E577–88. doi: 10.1152/ajpendo.00093.2003. [DOI] [PubMed] [Google Scholar]
- Swierczynski J, et al. Comparative study of the lipogenic potential of human and rat adipose tissue. Metabolism. 2000;49:594–9. doi: 10.1016/s0026-0495(00)80033-5. [DOI] [PubMed] [Google Scholar]
- Trinder P. Determination of blood glucose using an oxidase-peroxidase system with a non-carcinogenic chromogen. J Clin Pathol. 1969;22:158–61. doi: 10.1136/jcp.22.2.158. [DOI] [PMC free article] [PubMed] [Google Scholar]
- Vaughan M. The Production and Release of Glycerol by Adipose Tissue Incubated in Vitro. J Biol Chem. 1962;237:3354–3358. [PubMed] [Google Scholar]
- Zhang JZ, et al. Regulation of glucose transport by hypoxia. Am J Kidney Dis. 1999;34:189–202. doi: 10.1016/s0272-6386(99)70131-9. [DOI] [PubMed] [Google Scholar]
Associated Data
This section collects any data citations, data availability statements, or supplementary materials included in this article.