

Abstract
Endogenous estrogens play an integral role in the etiology of breast, endometrial, and possibly ovarian cancer. Estrogen metabolism yields products that are potentially both estrogenic and genotoxic, yet individual metabolic patterns are just beginning to be explored in epidemiologic studies. Within the Nurses’ Health Study II, we examined reproducibility of 15 urinary estrogens and estrogen metabolites (EM) among 110 premenopausal women with three luteal phase urine samples collected over three years. EM were measured by a recently developed high-performance liquid chromatography-tandem mass spectrometry (LC-MS2) method with high sensitivity, specificity, and precision. We assessed Spearman correlations and intraclass correlation coefficients (ICCs) across the three samples. Correlations between urinary estrone or estradiol and the estrogen metabolites were only modest (r=0.1–0.5). The 2- and 4-hydroxylation pathways were highly correlated (r=0.9) but weakly inversely correlated with the 16-hydroxylation pathway (r=−0.2). Reproducibility within woman over time was fairly high for the three pathways, with ICCs ranging from 0.52 (16-hydroxylation pathway) to 0.72 (2-hydroxylation pathway). ICCs were similarly high for 2-catechols and the individual catechols (ICCs=0.58–0.72). Individual and grouped methylated 2-catechols had fairly high ICCs (0.51–0.62), but ICCs were low for the methylated 4-catechols (0.14–0.27). These data indicate that, in general, urinary EM levels vary substantially among individuals compared with intraindiviual variability. Reproducibility within person over time for most EM measures is comparable to or better than well-vetted biomarkers like plasma cholesterol and, in postmenopausal women, estradiol.
Estrogens play an integral role in the etiology of breast, endometrial, and possibly ovarian cancer (1). The role of circulating estrogens in the etiology of breast cancer is well established in postmenopausal women (2–5) and estrogen levels may be important among premenopausal women, although evidence is not entirely consistent (6–13). The metabolism of estrone and estradiol yields products that are potentially both estrogenic and genotoxic (14–19). Oxidation of estrone and estradiol occurs at the C-2 and C-4 positions to yield catechol estrogens (2-hydroxyestrone, 2-hydroxyestradiol, 4-hydroxyestrone) and at the C-16 position to yield 16α-hydroxyestrone (see Figure 1) (14, 20). With further metabolism, the catechol estrogens are methylated into 2-methoxyestrone, 2-methoxyestradiol, 2-hydroxyestrone-3-methyl ether, 4-methoxyestrone and 4-methoxyestradiol. Metabolites in the 16-hydroxy pathway are further metabolized into 17-epiestriol, estriol, 16-ketoestradiol, and 16-epiestriol. Based on experimental studies, metabolites along these pathways are hypothesized to have differential estrogenic and genotoxic activity. It has been hypothesized that metabolism favoring the 2-hydroxylation over the 16-hydroxylation pathway may be inversely associated with breast cancer risk (21). Although some studies have analyzed the 2- and 16α-hydroxyestrone metabolites with breast cancer risk in humans (22–34) very little evidence exists regarding other metabolites, or groups of metabolites.
Figure 1.
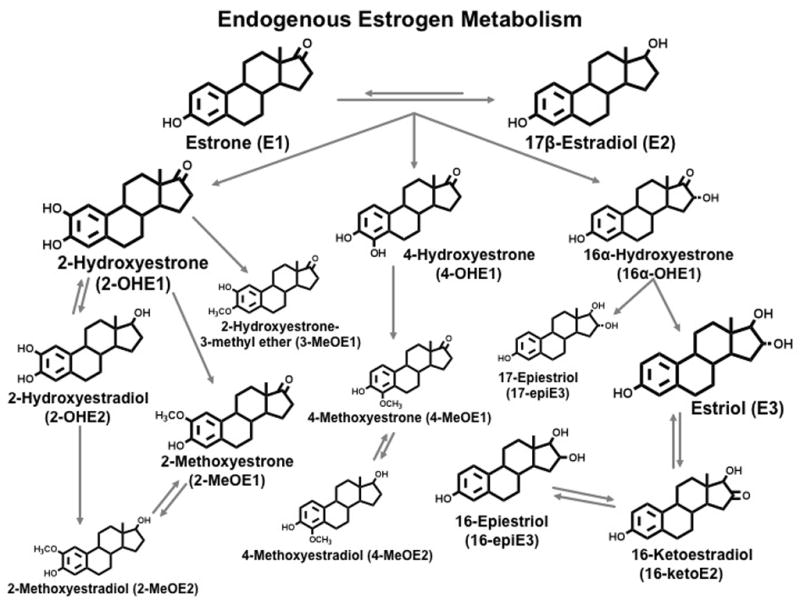
Endogenous Estrogen Metabolism
A high-performance liquid chromatography-tandem mass spectrometry (LC-MS2) assay was developed to measure concurrently 15 estrogens and estrogen metabolites (EM) in urine with high sensitivity, specificity, accuracy and reproducibility (35, 36). These EM can be quantitated in 0.5mL of urine, and the assay is sufficiently rapid and robust for epidemiologic research. Although we have assessed the reproducibility within-woman over time of plasma estrogens (37), no one has assessed intraindividual variability over time of urinary EM. We assessed reproducibility over a 2- to 3-year period of the 15 EM in the luteal phase among 110 premenopausal women within the Nurses’ Health Study II (NHSII).
Methods
Study population
The NHSII was established in 1989, when 116,678 female registered nurses, aged 25 to 42 years, completed and returned a questionnaire. The cohort continues to be followed biennially by questionnaire to update exposures and ascertain newly diagnosed disease. Between 1996 and 1999, 29,611 cohort members who were cancer-free and between the ages of 32 and 52 years provided blood and urine samples. Of these, 18,521 were premenopausal participants who provided blood and urine samples timed within the menstrual cycle; the women had not used oral contraceptives, been pregnant, or breastfed within the preceding six months. They provided luteal phase urine samples collected 7–9 days before the anticipated start of their next cycle. Samples were shipped, via overnight courier with an ice-pack, to our laboratory where the urine was aliquoted and stored in liquid nitrogen freezers (≤ −130° C). Approximately 93% of luteal samples were received within 26 hours of collection.
Among the premenopausal women who provided samples timed within the menstrual cycle, a random sample of those who were not planning to be pregnant or lactating were invited to participate in the “hormone stability study”. Details of the hormone stability study have been published previously (37). Briefly, second and third collection kits for blood and urine were mailed to women who returned the first kit without being reminded and who remained eligible to participate. Of the 412 women invited, 74% (N=304) and 57% (N=236) provided a second and third set of samples, respectively.
For each collection, women completed a questionnaire recording their weight, average menstrual cycle length, first day of the menstrual cycle during which the blood and urine samples were collected, and whether the urine was a first morning sample. In addition, women returned a postcard recording the first day of their next menstrual cycle, allowing us to back-date the luteal day of the urine collection.
Of the 236 women with collections for 3 different menstrual cycles over a 2- to 3-year period, 110 women with luteal samples collected between 3 and 11 days before the start of the next menstrual cycle for each of the 3 collections were selected for the urine reproducibility study. These women were included in the previously published paper on intraindividual reproducibility of plasma hormones (37). From the 330 possible samples (110 women x 3 collections), there were 3 women missing the second sample and 5 missing the third sample, for a total of 322 samples. The study was approved by the Committee on the Use of Human Subjects in Research at Harvard School of Public Health and Brigham and Women’s Hospital.
Laboratory Methods
All three of the urine samples from a single woman were assayed together; the samples were ordered randomly and labeled such that the laboratory could not identify samples from the same woman. For each collection for each woman, 500μL of frozen urine was sent to the Laboratory of Proteomics and Analytical Chemistry, SAIC-Frederick, Inc., Frederick, MD. Given that endogenous estrogens and their metabolites are usually present in urine as glucuronide and sulfate conjugates, an initial hydrolysis step was included. Each urine sample was thawed and mixed, and 400 μL was immediately aliquoted into a clean screw-cap glass tube and 20 μL of an internal standard solution containing 1.6 ng of each of five deuterated EM (17β-estradiol-d4, estriol-d3, 2-hydroxy-17β-estradiol-d5, 2-methoxy-17β-estradiol-d5, 16-epiestriol-d3) was added, followed by 0.5 mL of 0.15 M acetate buffer, pH 4.1, containing 2 mg of ascorbic acid and β-glucuronidase/sulfatase from Helix pomatia (Type HP-2) (Sigma-Aldrich, St. Louis, MO). The deuterated EM are used to correct for loss of urinary EM during the hydrolysis, extraction, derivatization, and LC-MS2 steps of the assay procedure. Details of the assay have been published previously (35, 38). In brief, quantitative data were acquired using a TSQ Quantum-AM triple quadrupole mass spectrometer coupled with a Surveyor HPLC system (Thermo, San Jose, CA). Both the HPLC and the mass spectrometer were controlled by Xcalibur software (Thermo). Quantitation of each EM in urine was carried out using Xcalibur Quan Browser (Thermo). Calibration curves for the 15 EM were constructed by plotting EM/deuterium labeled EM peak area ratios versus amounts of the EM. The amount of EM in the urine sample was then interpolated using a linear function. The overall coefficients of variation (CVs) from masked replicate quality control samples placed in each batch ranged from 1.0% (2-hydroxyestrone) to 6.5% (4-methoxyestrone).
Creatinine was measured in two batches: the first with 228 samples at the Endocrine Core Laboratory at Emory University (Atlanta, GA) using Sigma Diagnostics creatinine agents, the second with 95 samples at Dr. Nader Rifai’s laboratory at the Boston Children’s Hospital (Boston, MA). CVs were ≤4.5% in both labs.
Plasma follicular and luteal samples from each of the three collections were assayed at the same time for each woman. Estrogens and progesterone were measured at Quest Diagnostics-Nichols Institute (San Juan Capistrano, CA); details of the assay methods have been described in detail previously (39). CVs were ≤14% for plasma hormones.
Statistical Analysis
Absolute concentrations of individual EM were adjusted for creatinine to convert the data to pmol/mg creatinine. Individual EM were combined according to chemical characteristics (e.g., catechols and methylated catechols) and pathways (e.g., 2-hydroxylation, 4- hydroxylation, 16- hydroxylation pathways), and absolute concentrations of these EM groups were calculated by summing the individual EM in the group. Parent EM was calculated as the sum of estrone and estradiol. Total EM was calculated as the sum (pmol/L) of each of the 15 EM. Percent EM were obtained by dividing the individual or grouped EM by the total EM. Ratios of selected EM groups also were calculated. Although we did not assess most ratios of individual EM, we evaluated the 2-hydroxyestrone/16α-hydroxyestrone ratio, given the interest in this ratio as a potential predictor of breast cancer risk.
From among the 322 total samples, we identified and excluded statistical outliers using the extreme studentized deviate many-outlier procedure (40) for each of the absolute and percent EM measures and the EM ratios. This resulted in the removal of up to 5 values in several of the EM.
For absolute measures and ratios, we calculated geometric means and 5th and 95th percentiles on the natural log scale, and exponentiated the values back to the original scale; means and percentiles for percent measures were calculated on the original scale. To examine Spearman correlations and intraclass correlation coefficients (ICCs) among the EM, we first calculated probit scores for each individual at each collection. The advantage of probit scores is that they have a normal distribution even if the original data are skewed and confidence intervals are more accurate (41). Scores were calculated as Φ−1 [i/(N+1)] where Φ is the cumulative distribution function for a standard normal distribution, i is the rank of the participant within the collection, and N is the number of participants in the collection (41). We averaged the probit scores over the three collections to calculate Spearman correlation coefficients. Between-person and within-person variances were estimated from the three sets of probit scores using a linear mixed model. To assess reproducibility over the 2- to 3-year period, we calculated ICCs by dividing the between-person variance by the sum of the within- and between-person variances; 95% confidence intervals (CI) were also calculated (42). To transform the probit score ICCs to rank correlations, we used the following formula: ICCrank=6/π*sin−1(ICCprobit/2) (41). ICCs calculated using log-transformed EM data were similar to probit-transformed data. We tried adjusting for variables assessed at each urine collection, including age, date of collection, first morning urine, luteal day, BMI, and menstrual cycle length. Adjustment for these factors did not change our results; therefore we did not include these variables in the final model.
Results
A total of 110 women were included in these analyses; 102 women contributed all 3 urine samples, 3 women were missing the second sample and 5 were missing the third sample. The three urine collections were conducted over an average of 34 months (range, 24–46 months). At the first collection, women ranged in age from 34 to 49 years (mean, 41 years) with a mean BMI of 24.6 kg/m2 and weight ranging from 41 to 116 kg. A total of 83% of samples were first morning urine. Two women each contributed three samples from anovulatory cycles (defined as progesterone levels <400ng/dL); 15 women contributed one sample from an anovulatory cycle. Samples were collected an average of 7 days before the first day of the woman’s next menstrual cycle (5th–95th percentile, 4 to 10 days).
Geometric (or arithmetic for % measures) means and 5th-95th percentile ranges of the individual EM, EM groups and selected EM ratios are presented in Table 1. Mean total EM was 219 pmol/mg creatinine, with the main contributors being 2-hydroxyestrone (28% of the total), estriol (17% of the total), and estrone (15% of the total). The EM with the lowest concentrations were four of the methylated catechol EM (2-methoxyestradiol, 2-hydroxyestrone-3-methyl ether, 4-methoxyestrone, and 4-methoxyestradiol), each contributing <1% to the total. Catechol EM concentrations were higher than methylated catechol EM (catechol EM/methylated catechol EM ratios ranged from ~7 to 36). EM in the 16-hydroxylation pathway were more abundant than the 2-hydroxylation pathway (2-:16-hydroxylation pathway ratio=0.90) and EM in the 2-hydroxylation pathway were more abundant than the 4-hydroxylation pathway (4-:2-hydroxylation pathway ratio=0.11).
Table 1.
Means* and ranges of individual and grouped urinary estrogens and estrogen metabolites (EM), expressed as absolute concentrations (pmol/mg creatinine), percent of the total EM, and selected EM ratios; first collection.
| EM measure | Mean (5th-95th percentile) |
||
|---|---|---|---|
| pmol/mg creatinine | % of total | ||
| Total EM | 219 (117-454) | ||
| Parent EM | 44.0 (21.6-84.4) | 21.1 (12.0-33.9) | |
| Estrone | 31.0 (13.7-62.3) | 14.97 (7.85-25.03) | |
| Estradiol | 12.3 (5.40-27.3) | 6.15 (2.54-12.67) | |
| Catechol EM | 68.2 (22.9-214) | 35.36 (11.79-64.57) | |
| 2-Catechol EM | 59.7 (18.1-198) | 31.22 (10.09-55.34) | |
| 2-Hydroxyestrone | 53.3 (16.4-179) | 28.02 (9.18-51.10) | |
| 2-Hydroxyestradiol | 5.94 (1.80-20.8) | 3.20 (0.96-6.09) | |
| 4-Catechol EM | 4-Hydroxyestrone | 7.57 (2.24-25.7) | 4.14 (0.99-8.39) |
| Methylated Catechol EM | 8.72 (2.91-26.5) | 4.65 (1.47-9.27) | |
| Methylated 2-Catechol EM | 8.46 (2.76-24.8) | 4.54 (1.38-9.23) | |
| 2-Methoxyestrone | 5.93 (1.93-19.7) | 3.25 (0.86-7.36) | |
| 2-Methoxyestradiol | 0.79 (0.30-2.14) | 0.40 (0.17-0.74) | |
| 2-Hydroxyestrone-3-methyl ether | 1.41 (0.42-4.39) | 0.80 (0.25-1.55) | |
| Methylated 4-Catechol EM | 0.20 (0.08-0.57) | 0.11 (0.04-0.24) | |
| 4-Methoxyestrone | 0.16 (0.06-0.47) | 0.09 (0.03-0.21) | |
| 4-Methoxyestradiol | 0.04 (0.01-0.14) | 0.02 (0.00-0.07) | |
| 2-Hydroxylation Pathway EM | 69.6 (22.0-209) | 35.76 (12.08-61.51) | |
| 4-Hydroxylation Pathway EM | 7.85 (2.37-26.2) | 4.25 (1.11-8.44) | |
| 16-Hydroxylation Pathway EM | 76.9 (32.6-184) | 38.88 (17.16-67.15) | |
| 16α-Hydroxyestrone | 12.9 (4.70-40.1) | 7.09 (1.70-14.59) | |
| Estriol | 32.6 (11.1-93.2) | 17.44 (5.68-34.12) | |
| 17-Epiestriol | 2.19 (0.52-10.5) | 1.51 (0.24-5.28) | |
| 16-Ketoestradiol | 18.2 (7.99-43.9) | 9.21 (3.47-15.57) | |
| 16-Epiestriol | 7.30 (3.50-16.3) | 3.65 (1.60-6.33) | |
|
Ratios |
|||
| Ratios | 4-Catechol/2-Catechols | 0.13 (0.06-0.29) | |
| 2-Catechols/16-Pathway | 0.78 (0.15-3.38) | ||
| Catechols/16-Pathway | 0.89 (0.18-3.96) | ||
| 4-Pathway/2-Pathway | 0.11 (0.05-0.24) | ||
| 2-Pathway/16-Pathway | 0.90 (0.19-3.80) | ||
| 4-Pathway/16-Pathway | 0.10 (0.02-0.46) | ||
| 2,4-Pathway/16-Pathway | 1.01 (0.21-4.27) | ||
| 2-Pathway/4,16-Pathway | 0.78 (0.18-2.63) | ||
| 2-Catechols/Methylated 2-Catechols | 7.06 (2.73-18.3) | ||
| 4-Catechol/Methylated 4-Catechols | 36.2 (7.98-146) | ||
| Catechols/Methylated Catechols | 7.80 (3.06-20.6) | ||
| Parent Estrogens/Estrogen Metabolites | 0.26 (0.14-0.51) | ||
Means/ranges are geometric for absolute and ratio measures, arithmetic for % measures.
Absolute concentrations of most EM were fairly consistent across the three collections (data not shown). The largest difference in levels was for 2-hydroxyestrone, and therefore 2-catechols, catechols, and 2-pathway EM, with higher levels in the first collection (mean=53.3 pmol/mg creatinine) than in the second and third collections (means=46.4 and 45.0 pmol/mg creatinine). The levels in the 16-pathway also decreased slightly in subsequent collections, with means of 76.9, 71.4, and 72.3 pmol/mg creatinine for 16-pathway EM in the first, second, and third collections, respectively. Relative measures were very consistent across the three collections with the largest differences <1.2% for %estrone and %estradiol. Ratios of groups of metabolites were also very consistent. The largest changes were for 2-catechols/methylated 2-catechols (means=7.06, 6.92, 6.62 for the three collections, respectively) and 4-catechols/methylated 4-catechols (comparable means=36.2, 35.2, 32.8). Finally, the 2-hydroxyestrone/16α-hydroxyestrone ratio decreased slightly across the three collections (means=4.12, 3.80, 3.59, respectively).
Correlations among absolute and percent measures for individual and grouped EM are shown in Table 2. On an absolute scale, estrone and estradiol were moderately correlated (r=0.62). However, correlations between estrone and most of the other individual estrogen metabolites were more modest (r=0.07 – 0.52). Estradiol correlations with most individual metabolites were even lower; r’s for most metabolites were <0.35. However, individual EM within each pathway were generally moderately to highly correlated with one another (five EM within the 2-hydroxylation pathway r=0.41-0.87; five EM in the 16-hydroxylation pathway r=0.35–0.79), though there was less correlation among the three EM in the 4-hydroxylation pathway (r=0.22–0.30). The 2- and 4-hydroxylation pathways were highly correlated (r=0.87), but the 16-hydroxylation pathway was weakly inversely correlated with the 2- and 4-hydroxylation pathways (r=−0.19 and −0.20, respectively). On the relative scale, %estrone and %estradiol were modestly positively correlated (r=0.48), but were inversely correlated with %2- and %4-hydroxylation pathways (e.g., %estradiol and %2-hydroxylation pathway r=−0.38). The correlation between the %2- and %4-hydroxylation pathways was high (r=0.77). The%16-hydroxylation pathway was highly inversely correlated with the %2- and %4-hydroxylation pathways (r=−0.90 and −0.77, respectively) and unrelated to %estrone (r=−0.06) or %estradiol (r=0.12).
Table 2.
Spearman correlations of individual and grouped urinary estrogens and estrogen metabolites (EM), expressed as absolute concentrations and percent of total EM for the average of 3 collections.
| Cat | 2Cat | 4Cat | Me Cat | Me-2Cat | Me-4Cat | 2Path | 4Path | 16Path | Total EM | |||||||||||||||||
|---|---|---|---|---|---|---|---|---|---|---|---|---|---|---|---|---|---|---|---|---|---|---|---|---|---|---|
| Parent | E1 | E2 | 2OHE1 | 2OHE2 | 4OHE1 | 2MeE1 | 2MeE2 | 2OH3Me | 4MeE1 | 4MeE2 | 16aOHE1 | E3 | 17EpiE3 | 16KetoE2 | 16EpiE3 | |||||||||||
| Parent EM | 1.0 | 0.96 | 0.79 | 0.32 | 0.32 | 0.33 | 0.27 | 0.32 | 0.48 | 0.48 | 0.45 | 0.42 | 0.45 | 0.38 | 0.37 | 0.11 | 0.36 | 0.33 | 0.33 | 0.28 | 0.25 | 0.26 | 0.36 | 0.43 | 0.64 | |
| E1 | 0.93 | 1.0 | 0.62 | 0.40 | 0.40 | 0.41 | 0.36 | 0.39 | 0.52 | 0.52 | 0.48 | 0.50 | 0.49 | 0.32 | 0.33 | 0.07 | 0.44 | 0.40 | 0.30 | 0.29 | 0.20 | 0.25 | 0.35 | 0.41 | 0.66 | |
| E2 | 0.73 | 0.48 | 1.0 | 0.06 | 0.06 | 0.07 | 0.01 | 0.10 | 0.27 | 0.26 | 0.26 | 0.12 | 0.23 | 0.40 | 0.35 | 0.12 | 0.10 | 0.10 | 0.32 | 0.19 | 0.28 | 0.21 | 0.30 | 0.35 | 0.46 | |
| Catechol EM | −0.30 | −0.24 | −0.41 | 1.0 | 1.00 | 0.99 | 0.89 | 0.89 | 0.64 | 0.63 | 0.65 | 0.66 | 0.44 | 0.31 | 0.30 | 0.15 | 0.99 | 0.89 | −0.19 | −0.20 | −0.24 | −0.10 | −0.10 | 0.03 | 0.65 | |
| 2-Catechol EM | −0.30 | −0.24 | −0.42 | 0.99 | 1.0 | 0.99 | 0.90 | 0.86 | 0.62 | 0.62 | 0.64 | 0.67 | 0.43 | 0.29 | 0.29 | 0.15 | 0.99 | 0.86 | −0.18 | −0.20 | −0.24 | −0.10 | −0.09 | 0.03 | 0.65 | |
| 2OHE1 | −0.29 | −0.23 | −0.41 | 0.99 | 1.00 | 1.0 | 0.87 | 0.87 | 0.64 | 0.64 | 0.66 | 0.67 | 0.45 | 0.29 | 0.29 | 0.15 | 0.99 | 0.87 | −0.18 | −0.19 | −0.24 | −0.09 | −0.09 | 0.02 | 0.65 | |
| 2OHE2 | −0.31 | −0.23 | −0.42 | 0.81 | 0.83 | 0.79 | 1.0 | 0.76 | 0.56 | 0.56 | 0.57 | 0.67 | 0.41 | 0.25 | 0.25 | 0.06 | 0.89 | 0.77 | −0.13 | −0.19 | −0.17 | −0.06 | −0.06 | 0.09 | 0.60 | |
| 4-Catechol EM | 4OHE1 | −0.14 | −0.11 | −0.25 | 0.82 | 0.76 | 0.77 | 0.58 | 1.0 | 0.60 | 0.60 | 0.60 | 0.56 | 0.43 | 0.30 | 0.30 | 0.06 | 0.87 | 1.00 | −0.21 | −0.21 | −0.25 | −0.10 | −0.16 | −0.01 | 0.58 |
| Me Catechol EM | 0.28 | 0.26 | 0.12 | 0.37 | 0.36 | 0.37 | 0.30 | 0.38 | 1.0 | 1.00 | 0.98 | 0.76 | 0.85 | 0.46 | 0.43 | 0.20 | 0.70 | 0.61 | −0.18 | −0.11 | −0.26 | −0.04 | −0.05 | −0.07 | 0.45 | |
| Me 2-Catechol EM | 0.28 | 0.27 | 0.12 | 0.37 | 0.36 | 0.37 | 0.30 | 0.37 | 1.00 | 1.0 | 0.98 | 0.76 | 0.84 | 0.44 | 0.41 | 0.18 | 0.70 | 0.61 | −0.18 | −0.11 | −0.27 | −0.05 | −0.06 | −0.07 | 0.45 | |
| 2MeE1 | 0.24 | 0.21 | 0.12 | 0.41 | 0.40 | 0.41 | 0.33 | 0.40 | 0.97 | 0.97 | 1.0 | 0.73 | 0.77 | 0.41 | 0.39 | 0.19 | 0.71 | 0.62 | −0.20 | −0.12 | −0.28 | −0.07 | −0.09 | −0.09 | 0.44 | |
| 2MeE2 | 0.13 | 0.21 | −0.12 | 0.39 | 0.40 | 0.40 | 0.44 | 0.30 | 0.70 | 0.70 | 0.65 | 1.0 | 0.59 | 0.32 | 0.32 | 0.10 | 0.71 | 0.57 | −0.11 | −0.04 | −0.18 | −0.06 | 0.00 | 0.12 | 0.50 | |
| 2OH3Me | 0.31 | 0.30 | 0.17 | 0.15 | 0.13 | 0.14 | 0.15 | 0.18 | 0.81 | 0.82 | 0.73 | 0.46 | 1.0 | 0.41 | 0.37 | 0.19 | 0.50 | 0.45 | −0.08 | −0.01 | −0.17 | 0.04 | 0.03 | 0.01 | 0.32 | |
| Me 4-Catechol EM | 0.24 | 0.14 | 0.29 | 0.03 | 0.02 | 0.03 | −0.01 | 0.02 | 0.36 | 0.36 | 0.33 | 0.21 | 0.36 | 1.0 | 0.93 | 0.48 | 0.33 | 0.32 | 0.12 | 0.06 | 0.06 | −0.01 | 0.16 | 0.19 | 0.36 | |
| 4MeE1 | 0.26 | 0.17 | 0.27 | 0.03 | 0.02 | 0.03 | 0.01 | 0.03 | 0.36 | 0.36 | 0.32 | 0.25 | 0.35 | 0.94 | 1.0 | 0.22 | 0.32 | 0.32 | 0.11 | 0.03 | 0.08 | 0.03 | 0.13 | 0.18 | 0.33 | |
| 4MeE2 | 0.04 | −0.01 | 0.07 | 0.02 | 0.03 | 0.04 | −0.05 | −0.02 | 0.21 | 0.21 | 0.22 | 0.09 | 0.18 | 0.51 | 0.24 | 1.0 | 0.17 | 0.07 | 0.05 | 0.08 | −0.03 | −0.09 | 0.08 | 0.08 | 0.17 | |
| 2-Pathway EM | −0.27 | −0.22 | −0.38 | 0.98 | 0.99 | 0.99 | 0.82 | 0.77 | 0.46 | 0.46 | 0.50 | 0.47 | 0.22 | 0.07 | 0.07 | 0.05 | 1.0 | 0.87 | −0.19 | −0.19 | −0.25 | −0.10 | −0.09 | 0.03 | 0.66 | |
| 4-Pathway EM | −0.13 | −0.11 | −0.25 | 0.82 | 0.76 | 0.77 | 0.59 | 1.00 | 0.39 | 0.38 | 0.40 | 0.31 | 0.19 | 0.06 | 0.06 | 0.00 | 0.77 | 1.0 | −0.20 | −0.20 | −0.25 | −0.10 | −0.15 | 0.00 | 0.58 | |
| 16-Pathway EM | −0.03 | −0.06 | 0.12 | −0.88 | −0.87 | −0.88 | −0.69 | −0.76 | −0.53 | −0.53 | −0.56 | −0.47 | −0.28 | −0.14 | −0.15 | −0.04 | −0.90 | −0.77 | 1.0 | 0.85 | 0.95 | 0.55 | 0.87 | 0.82 | 0.48 | |
| 16αOHE1 | −0.01 | 0.04 | −0.01 | −0.75 | −0.74 | −0.74 | −0.63 | −0.65 | −0.35 | −0.35 | −0.38 | −0.30 | −0.16 | −0.16 | −0.20 | 0.05 | −0.76 | −0.66 | 0.83 | 1.0 | 0.74 | 0.49 | 0.79 | 0.66 | 0.37 | |
| E3 | −0.08 | −0.13 | 0.11 | −0.82 | −0.81 | −0.82 | −0.63 | −0.71 | −0.55 | −0.55 | −0.57 | −0.48 | −0.33 | −0.18 | −0.16 | −0.11 | −0.84 | −0.71 | 0.95 | 0.70 | 1.0 | 0.45 | 0.77 | 0.78 | 0.40 | |
| 17EpiE3 | 0.07 | 0.04 | 0.11 | −0.48 | −0.47 | −0.47 | −0.39 | −0.43 | −0.24 | −0.23 | −0.28 | −0.28 | −0.05 | −0.09 | −0.08 | −0.07 | −0.48 | −0.43 | 0.52 | 0.47 | 0.39 | 1.0 | 0.53 | 0.35 | 0.30 | |
| 16KetoE2 | 0.04 | 0.03 | 0.16 | −0.78 | −0.77 | −0.77 | −0.64 | −0.70 | −0.35 | −0.35 | −0.39 | −0.34 | −0.11 | 0.00 | −0.02 | 0.04 | −0.79 | −0.71 | 0.86 | 0.77 | 0.74 | 0.48 | 1.0 | 0.72 | 0.48 | |
| 16EpiE3 | 0.00 | −0.02 | 0.11 | −0.63 | −0.63 | −0.64 | −0.41 | −0.55 | −0.46 | −0.46 | −0.49 | −0.23 | −0.27 | −0.03 | −0.05 | 0.02 | −0.66 | −0.55 | 0.74 | 0.53 | 0.72 | 0.25 | 0.60 | 1.0 | 0.57 | |
Note: Correlations in bottom left of table are EM expressed as % of total EM; Correlations in top right are expressed as absolute concentrations of EM. Correlations ≥|0.40| are bolded.
Correlations between luteal urinary estrogens and follicular and luteal plasma estrogens are presented in Table 3. The strongest correlations were between luteal urinary estrone and luteal plasma estrone and estrone sulfate (r=0.56 and 0.57, respectively) as well as follicular plasma estrone sulfate (r=0.49). Luteal urinary estradiol was modestly correlated with all three luteal plasma estrogens (r=0.36–0.42), but not consistently related to follicular plasma estrogens (r=−0.11–0.26). Luteal urinary total EM was more weakly correlated with luteal plasma estrogens (r=0.26–0.33) than luteal urinary estrone and estradiol. There generally were not high correlations between the luteal urinary individual EM and plasma estrogens (data not shown).
Table 3.
Spearman correlation coefficients for urinary luteal estrogens with plasma follicular and luteal estrogens, average of 3 collections.
| Plasma Estrogens |
||||||
|---|---|---|---|---|---|---|
| Luteal | Follicular | |||||
| Estradiol | Estrone | Estrone sulfate | Estradiol | Estrone | Estrone sulfate | |
| Urinary Luteal Estrogens | ||||||
| Estrone | 0.34 | 0.56 | 0.57 | −0.07 | 0.28 | 0.49 |
| Estradiol | 0.36 | 0.38 | 0.42 | −0.11 | 0.01 | 0.26 |
| Total EM | 0.33 | 0.27 | 0.26 | 0.08 | 0.13 | 0.21 |
N ranges from 87 (follicular estrone) to 106.
Correlations ≥|0.40| are bolded.
Luteal urine and luteal plasma collected the same day.
ICCs are presented in Table 4; absolute measures of individual and grouped EM are adjusted for creatinine. Overall, the ICCs for absolute and %EM were fairly high, although the ICC for total EM was only moderate (ICC=0.39). ICCs for absolute concentrations of the parent estrogens were similar to one another (estrone ICC=0.52, estradiol ICC=0.49) but the ICC for %estrone was higher (0.67). ICCs for the absolute concentrations of individual and grouped catechol estrogens were all ≥0.58, with higher ICCs for the % measures for catechols, 2-catechols, and 2-hydroxyestrone (ICCs increased from 0.72, 0.72, and 0.71 on the absolute scale to 0.85, 0.84, and 0.83 on the relative scale). However, reproducibility of 4-hydroxyestrone was somewhat reduced on the relative scale (ICC=0.51) compared with the absolute scale (ICC=0.58). The methylated 2-catechols had moderate to high ICCs on both the absolute (0.51–0.62) and relative (0.50–0.67) scales. Methylated 4-catechols, which are the EM with the lowest concentrations, had very low ICCs (0.27 and 0.14 for 4-methoxyestrone and 4-methoxyestradiol, and 0.25 for methylated 4-catechols); the ICCs for 4-methoxyestrone and methylated 4-catechols increased slightly on the relative scale, but were still very low (comparable ICCs 0.30 and 0.27). For the pathways, ICCs on both scales were very high for the 2-hydroxylation pathway (0.72 and 0.85 on absolute and % scales), moderate for the 4-hydroxylation pathway with a decline on the relative scale (0.57 and 0.51), and moderate on the absolute scale for the 16-hydroxylation pathway (0.52) but high on the % scale (0.82). ICCs for individual metabolites in the 16-hydroxylation pathway ranged from 0.42 (16-ketoestradiol) to 0.54 (estriol); each was substantially improved on the % scale, ranging from 0.56 (17- and 16-epiestriol) to 0.77 (estriol). ICCs for the EM ratios were very low for ratios comparing the 4- and 2-hydroxylation pathway EM (ICC=0.21 for both 4-catechols/2-catechols and 4-/2-hydroxylation pathway). With the exception of the 4-catechol/methylated 4-catechol (ICC=0.42), the ICCs for other ratios were moderate to high (range 0.58–0.85). The 2-hydroxyestrone/16α-hydroxyestrone ratio had high reproducibility (ICC=0.76) (data not shown).
Table 4.
Intraclass correlation coefficients (95% confidence intervals) for individual and grouped estrogens and estrogen metabolites (EM), expressed as absolute concentrations, percent of total EM, and selected EM ratios.
| ICC (95% CI) |
|||
|---|---|---|---|
| Analyte | Absolute Concentration | % of Total EM | |
| Parent EM | 0.52 (0.41-0.62) | 0.64 (0.54-0.72) | |
| Estrone | 0.52 (0.42-0.63) | 0.67 (0.58-0.75) | |
| Estradiol | 0.49 (0.39-0.60) | 0.52 (0.42-0.62) | |
| Catechol EM | 0.72 (0.64-0.79) | 0.85 (0.80-0.89) | |
| 2-Catechol EM | 0.72 (0.64-0.78) | 0.84 (0.79-0.88) | |
| 2-Hydroxyestrone | 0.71 (0.63-0.78) | 0.83 (0.78-0.87) | |
| 2-Hydroxyestradiol | 0.67 (0.59-0.75) | 0.68 (0.60-0.76) | |
| 4-Catechol EM | 4-Hydroxyestrone | 0.58 (0.48-0.67) | 0.51 (0.41-0.62) |
| Methylated Catechol EM | 0.61 (0.51-0.69) | 0.64 (0.55-0.73) | |
| Methylated 2-Catechol EM | 0.62 (0.52-0.70) | 0.65 (0.56-0.73) | |
| 2-Methoxyestrone | 0.62 (0.52-0.71) | 0.67 (0.59-0.75) | |
| 2-Methoxyestradiol | 0.51 (0.41-0.62) | 0.53 (0.42-0.63) | |
| 2-Hydroxyestrone-3-methyl ether | 0.51 (0.40-0.61) | 0.50 (0.40-0.61) | |
| Methylated 4-Catechol EM | 0.25 (0.15-0.39) | 0.27 (0.17-0.40) | |
| 4-Methoxyestrone | 0.27 (0.17-0.41) | 0.30 (0.20-0.43) | |
| 4-Methoxyestradiol | 0.14 (0.06-0.30) | 0.13 (0.05-0.29) | |
| 2-Pathway EM | 0.72 (0.64-0.78) | 0.85 (0.80-0.89) | |
| 4-Pathway EM | 0.57 (0.47-0.67) | 0.51 (0.40-0.61) | |
| 16-Pathway EM | 0.52 (0.41-0.62) | 0.82 (0.76-0.86) | |
| 16α-Hydroxyestrone | 0.46 (0.35-0.57) | 0.64 (0.55-0.72) | |
| Estriol | 0.54 (0.44-0.64) | 0.77 (0.70-0.83) | |
| 17-Epiestriol | 0.50 (0.39-0.60) | 0.56 (0.46-0.65) | |
| 16-Ketoestradiol | 0.42 (0.31-0.53) | 0.59 (0.49-0.68) | |
| 16-Epiestriol | 0.45 (0.34-0.56) | 0.56 (0.46-0.66) | |
| Total EM | 0.39 (0.28-0.51) | ||
|
EM Ratios |
|||
| 4-Catechol/2-Catechols | 0.21 (0.11-0.35) | ||
| 2-Catechols/16-Pathway | 0.83 (0.78-0.88) | ||
| Catechols/16-Pathway | 0.83 (0.77-0.87) | ||
| 4-Pathway/2-Pathway | 0.21 (0.11-0.35) | ||
| 2-Pathway/16-Pathway | 0.83 (0.77-0.87) | ||
| 4-Pathway/16-Pathway | 0.70 (0.62-0.77) | ||
| 2,4-Pathway/16-Pathway | 0.85 (0.80-0.89) | ||
| 2-Pathway/4,16-Pathway | 0.84 (0.79-0.88) | ||
| 2-Catechols/Methylated 2-Catechols | 0.58 (0.48-0.67) | ||
| 4-Catechol/Methylated 4-Catechols | 0.42 (0.31-0.54) | ||
| Catechols/Methylated Catechols | 0.60 (0.50-0.69) | ||
| Parent Estrogens/Estrogen Metabolites | 0.65 (0.55-0.73) | ||
We conducted several sensitivity analyses to assess the robustness of our overall ICCs, including restricting analyses to first morning urine samples (n=258), ovulatory cycles (n=301), <1 kg/m2 change in BMI across collections (n=137), <2 luteal days difference across collections (n=126), luteal days 6 to 9 prior to next menstrual cycle (n=189), average menstrual cycle length 26–31 days (n=222), and age at all three collections ≤45 years (n=211). Overall there was no single restriction that resulted in consistent substantial improvements in the ICCs (data not shown). The restrictions that resulted in the largest changes in ICCs were BMI and luteal day. Excluding women with BMI changes over the collections generally resulted in small increases in ICCs (e.g., ICC for estradiol increased from 0.49 to 0.53), with a few larger increases (e.g., 16α-hydroxyestrone increased from 0.46 to 0.65). On the % scale, the ICCs increased for parent EM (e.g., %estradiol increased from 0.52 to 0.60) and EM in the 16-hydroxylation pathway (e.g., %16α-hydroxyestrone increased from 0.64 to 0.75). Excluding luteal day differences ≥2 days modestly increased some ICCs that were fairly high to begin with (e.g., methylated catechols ICC changed from 0.61 to 0.68). This exclusion also increased a few modest ICCs (e.g., %4-hydroxyestrone from 0.51 to 0.60) and the low ICC of %4-methoxyestrone to become marginal (0.30 to 0.43); however the already low ICCs for absolute and %4-methoxyestradiol decreased.
Discussion
In this analysis of premenopausal luteal urinary EM, concentration of the 16-hydroxylation pathway EM are most abundant, followed by 2-hydroxylation pathway EM, parent EM, and 4-hydroxylation pathway EM, which make up only a very small proportion of total EM. We observed limited correlation between either estrone or estradiol and the individual estrogen metabolites. However, estrone and estradiol were fairly highly correlated, as were the individual estrogen metabolites within each pathway. 2- and 4-hydroxylation pathway EM were highly correlated, but weakly inversely correlated with 16-hydroxylation pathway EM. We also observed fairly low correlations between plasma estrogens and urinary EM, though correlations with urinary estrone and estradiol were modest. ICCs were generally very high, except for 4-methylated catechols and generally improved when based on the % concentration rather than the absolute concentrations. In addition, results were robust with no substantial changes in sensitivity analyses. Given our use of mid-luteal urine samples in this study, it is not clear whether these results may also apply to follicular EM.
These comprehensive data on premenopausal luteal urinary EM in general show excellent reproducibility over time, with many ICCs>0.60, suggesting that one measure may adequately represent longer-term (i.e., at least 3 years) exposure. These ICCs compare favorably with the reproducibility over a several-year period of serum cholesterol (ICC=0.65) (43), blood pressure (ICC=0.60–0.64) (44), blood glucose (ICC=0.52) (45), pulse (ICC=0.49) (45), and plasma estradiol in postmenopausal women (ICC=0.68) (42), all of which are exposures considered to be reasonably well-measured and reliable predictors of disease in epidemiologic studies.
The relatively low correlation between parent estrogens and estrogen metabolites (e.g., estrone and estradiol correlations with other individual EM≤0.52) and between different estrogen metabolic pathways suggests that these EM convey additional information about patterns of estrogen metabolism beyond assessing estrogen exposure with urinary estrone and estradiol. Some of the low correlations we observed between plasma and urinary estrogens could be due to a combination of factors. Assays conducted in plasma did not include measurement of conjugates while the urine assay does detect all conjugates. For instance, estrone measured in plasma is unconjugated estrone, while estrone measured in urine detects glucuronides and sulfates as well as unconjugated forms. Thus, it is unclear whether the low correlations are due entirely to biologic reasons, or a combination of biologic differences and analytic differences in the assays. Although urinary estrogens include conjugated forms, the low correlations observed suggest it is possible that EM may provide additional insight into the estrogen breast cancer relationship beyond what epidemiologic studies of plasma estrogens can provide.
Few epidemiologic studies have examined estrogen metabolites and breast cancer risk, and they have assessed only 2-hydroxyestrone, 16α-hydroxyestrone, and the 2:16α-hydroxyestrone ratio, with mixed results (22-34). To our knowledge, there are no epidemiologic studies to date of the associations between methoxyestrogens or any metabolites in the 4-hydroxylation pathway and breast cancer risk. The lack of strong correlations between urinary parent estrogens and individual estrogen metabolites and between urinary EM and plasma estrogens suggests that these EM may provide additional insight into the relationship between estrogen levels and risk of breast cancer.
While circulating estrogens are established risk factors for postmenopausal breast cancer (2–5), and may be associated with risk among premenopausal women, although studies are not consistent (6–13), interest in estrogen metabolites derives from the fact that they exhibit differential estrogenic and genotoxic activity and may have different roles in breast carcinogenesis. 4-catechol EM and 16α-hydroxyestrone may have higher estrogenic activity than estradiol (46–52) while 2-catechol EM may act as either weak mitogens (53, 54) or inhibitors of proliferation (55, 56). Catechol estrogens can be oxidized into quinones and induce DNA damage directly through the formation of DNA adducts, or indirectly via redox cycling and generation of reactive oxygen species (20). The methoxy estrogens, which are methylated catechol estrogens, have been hypothesized to lower risk of breast cancer indirectly, by decreasing circulating levels of catechol estrogens, or directly, by inhibiting tumor growth and inducing apoptosis (57–61).
In summary, these data suggest that measuring individual estrogen metabolites may provide information that is not available when only measuring parent estrogens, and that patterns of estrogen metabolism may vary substantially among individuals. Most estrogen metabolites, when measured in premenopausal women in the mid-luteal phase, had high reproducibility over time, suggesting that one measure is enough to reflect longer-term exposure. In addition, the LC-MS2 assay we utilized is highly sensitive and specific, offers relatively high-throughput and robust results, and requires minimal volume. These characteristics all support the investigation of EM in epidemiologic studies of hormonal carcinogenesis.
Acknowledgments
Funding/Support: This study was supported by Research Grants CA67262 and CA50385 from the National Cancer Institute, the Harvard Medical School Eleanor and Miles Shore Fellowship for Scholars in Medicine, the National Cancer Institute Intramural Funding Program of the Division of Cancer Epidemiology and Genetics, and with federal funds of the National Cancer Institute awarded under Contract HHSN261200800001E to SAIC-Frederick. The content of this publication does not necessarily reflect the views or policies of the U.S. Department of Health and Human Services; nor does mention of trade names, commercial products, or organizations imply endorsement by the U.S. Government.
References
- 1.Eliassen AH, Hankinson SE. Endogenous hormone levels and risk of breast, endometrial and ovarian cancers: prospective studies. Adv Exp Med Biol. 2008;630:148–65. [PubMed] [Google Scholar]
- 2.Endogenous Hormones and Breast Cancer Collaborative Group. Endogenous sex hormones and breast cancer in postmenopausal women: reanalysis of nine prospective studies. J Natl Cancer Inst. 2002;94:606–16. doi: 10.1093/jnci/94.8.606. [DOI] [PubMed] [Google Scholar]
- 3.Missmer SA, Eliassen AH, Barbieri RL, Hankinson SE. Endogenous estrogen, androgen, and progesterone concentrations and breast cancer risk among postmenopausal women. J Natl Cancer Inst. 2004;96:1856–65. doi: 10.1093/jnci/djh336. [DOI] [PubMed] [Google Scholar]
- 4.Kaaks R, Rinaldi S, Key TJ, et al. Postmenopausal serum androgens, oestrogens and breast cancer risk: the European prospective investigation into cancer and nutrition. Endocr Relat Cancer. 2005;12:1071–82. doi: 10.1677/erc.1.01038. [DOI] [PubMed] [Google Scholar]
- 5.Eliassen AH, Missmer SA, Tworoger SS, Hankinson SE. Endogenous steroid hormone concentrations and risk of breast cancer: does the association vary by a woman's predicted breast cancer risk? J Clin Oncol. 2006;24:1823–30. doi: 10.1200/JCO.2005.03.7432. [DOI] [PubMed] [Google Scholar]
- 6.Helzlsouer KJ, Alberg AJ, Bush TL, Longcope C, Gordon GB, Comstock GW. A prospective study of endogenous hormones and breast cancer. Cancer Detect Prev. 1994;18:79–85. [PubMed] [Google Scholar]
- 7.Kaaks R, Berrino F, Key T, et al. Serum sex steroids in premenopausal women and breast cancer risk within the European Prospective Investigation into Cancer and Nutrition (EPIC) J Natl Cancer Inst. 2005;97:755–65. doi: 10.1093/jnci/dji132. [DOI] [PubMed] [Google Scholar]
- 8.Kabuto M, Akiba S, Stevens RG, Neriishi K, Land CE. A prospective study of estradiol and breast cancer in Japanese women. Cancer Epidemiol Biomarkers Prev. 2000;9:575–9. [PubMed] [Google Scholar]
- 9.Rosenberg CR, Pasternack BS, Shore RE, Koenig KL, Toniolo PG. Premenopausal estradiol levels and the risk of breast cancer: a new method of controlling for day of the menstrual cycle. Am J Epidemiol. 1994;140:518–25. doi: 10.1093/oxfordjournals.aje.a117278. [DOI] [PubMed] [Google Scholar]
- 10.Thomas HV, Key TJ, Allen DS, et al. A prospective study of endogenous serum hormone concentrations and breast cancer risk in premenopausal women on the island of Guernsey. Br J Cancer. 1997;75:1075–9. doi: 10.1038/bjc.1997.183. [DOI] [PMC free article] [PubMed] [Google Scholar]
- 11.Wysowski DK, Comstock GW, Helsing KJ, Lau HL. Sex hormone levels in serum in relation to the development of breast cancer. Am J Epidemiol. 1987;125:791–9. doi: 10.1093/oxfordjournals.aje.a114596. [DOI] [PubMed] [Google Scholar]
- 12.Micheli A, Muti P, Secreto G, et al. Endogenous sex hormones and subsequent breast cancer in premenopausal women. Int J Cancer. 2004;112:312–8. doi: 10.1002/ijc.20403. [DOI] [PubMed] [Google Scholar]
- 13.Eliassen AH, Missmer SA, Tworoger SS, et al. Endogenous steroid hormone concentrations and risk of breast cancer among premenopausal women. J Natl Cancer Inst. 2006;98:1406–15. doi: 10.1093/jnci/djj376. [DOI] [PubMed] [Google Scholar]
- 14.Yager JD, Davidson NE. Estrogen carcinogenesis in breast cancer. N Engl J Med. 2006;354:270–82. doi: 10.1056/NEJMra050776. [DOI] [PubMed] [Google Scholar]
- 15.Lottering ML, Haag M, Seegers JC. Effects of 17 beta-estradiol metabolites on cell cycle events in MCF-7 cells. Cancer Res. 1992;52:5926–32. [PubMed] [Google Scholar]
- 16.Schutze N, Vollmer G, Knuppen R. Catecholestrogens are agonists of estrogen receptor dependent gene expression in MCF-7 cells. J Steroid Biochem Mol Biol. 1994;48:453–61. doi: 10.1016/0960-0760(94)90193-7. [DOI] [PubMed] [Google Scholar]
- 17.Schutze N, Vollmer G, Tiemann I, Geiger M, Knuppen R. Catecholestrogens are MCF-7 cell estrogen receptor agonists. J Steroid Biochem Mol Biol. 1993;46:781–9. doi: 10.1016/0960-0760(93)90319-r. [DOI] [PubMed] [Google Scholar]
- 18.Jefcoate CR, Liehr JG, Santen RJ, et al. Tissue-specific synthesis and oxidative metabolism of estrogens. J Natl Cancer Inst Monogr. 2000:95–112. doi: 10.1093/oxfordjournals.jncimonographs.a024248. [DOI] [PubMed] [Google Scholar]
- 19.Yue W, Santen RJ, Wang JP, et al. Genotoxic metabolites of estradiol in breast: potential mechanism of estradiol induced carcinogenesis. J Steroid Biochem Mol Biol. 2003;86:477–86. doi: 10.1016/s0960-0760(03)00377-7. [DOI] [PubMed] [Google Scholar]
- 20.Yager JD, Liehr JG. Molecular mechanisms of estrogen carcinogenesis. Annu Rev Pharmacol Toxicol. 1996;36:203–32. doi: 10.1146/annurev.pa.36.040196.001223. [DOI] [PubMed] [Google Scholar]
- 21.Bradlow HL, Hershcopf RJ, Martucci CP, Fishman J. Estradiol 16 alpha-hydroxylation in the mouse correlates with mammary tumor incidence and presence of murine mammary tumor virus: a possible model for the hormonal etiology of breast cancer in humans. Proc Natl Acad Sci U S A. 1985;82:6295–9. doi: 10.1073/pnas.82.18.6295. [DOI] [PMC free article] [PubMed] [Google Scholar]
- 22.Kabat GC, Chang CJ, Sparano JA, et al. Urinary estrogen metabolites and breast cancer: a case-control study. Cancer Epidemiol Biomarkers Prev. 1997;6:505–9. [PubMed] [Google Scholar]
- 23.Ho GH, Luo XW, Ji CY, Foo SC, Ng EH. Urinary 2/16 alpha-hydroxyestrone ratio: correlation with serum insulin-like growth factor binding protein-3 and a potential biomarker of breast cancer risk. Ann Acad Med Singapore. 1998;27:294–9. [PubMed] [Google Scholar]
- 24.Zheng W, Dunning L, Jin F, Holtzman J. Correspondence re: G. C. Kabat et al., Urinary estrogen metabolites and breast cancer: a case-control study. Cancer Epidemiol., Biomark. Prev 6: 505–509, 1997. Cancer Epidemiol Biomarkers Prev. 1998;7:85–6. [PubMed] [Google Scholar]
- 25.Ursin G, London S, Stanczyk FZ, et al. Urinary 2-hydroxyestrone/16alpha-hydroxyestrone ratio and risk of breast cancer in postmenopausal women. J Natl Cancer Inst. 1999;91:1067–72. doi: 10.1093/jnci/91.12.1067. [DOI] [PubMed] [Google Scholar]
- 26.Schneider J, Kinne D, Fracchia A, et al. Abnormal oxidative metabolism of estradiol in women with breast cancer. Proc Natl Acad Sci U S A. 1982;79:3047–51. doi: 10.1073/pnas.79.9.3047. [DOI] [PMC free article] [PubMed] [Google Scholar]
- 27.Adlercreutz H, Fotsis T, Hockerstedt K, et al. Diet and urinary estrogen profile in premenopausal omnivorous and vegetarian women and in premenopausal women with breast cancer. J Steroid Biochem. 1989;34:527–30. doi: 10.1016/0022-4731(89)90138-6. [DOI] [PubMed] [Google Scholar]
- 28.Fowke JH, Qi D, Bradlow HL, et al. Urinary estrogen metabolites and breast cancer: differential pattern of risk found with pre- versus post-treatment collection. Steroids. 2003;68:65–72. doi: 10.1016/s0039-128x(02)00116-2. [DOI] [PubMed] [Google Scholar]
- 29.Kabat GC, O'Leary ES, Gammon MD, et al. Estrogen metabolism and breast cancer. Epidemiology. 2006;17:80–8. doi: 10.1097/01.ede.0000190543.40801.75. [DOI] [PubMed] [Google Scholar]
- 30.Meilahn EN, De Stavola B, Allen DS, et al. Do urinary oestrogen metabolites predict breast cancer? Guernsey III cohort follow-up. Br J Cancer. 1998;78:1250–5. doi: 10.1038/bjc.1998.663. [DOI] [PMC free article] [PubMed] [Google Scholar]
- 31.Muti P, Bradlow HL, Micheli A, et al. Estrogen metabolism and risk of breast cancer: a prospective study of the 2:16alpha-hydroxyestrone ratio in premenopausal and postmenopausal women. Epidemiology. 2000;11:635–40. doi: 10.1097/00001648-200011000-00004. [DOI] [PubMed] [Google Scholar]
- 32.Wellejus A, Olsen A, Tjonneland A, Thomsen BL, Overvad K, Loft S. Urinary hydroxyestrogens and breast cancer risk among postmenopausal women: a prospective study. Cancer Epidemiol Biomarkers Prev. 2005;14:2137–42. doi: 10.1158/1055-9965.EPI-04-0934. [DOI] [PubMed] [Google Scholar]
- 33.Cauley JA, Zmuda JM, Danielson ME, et al. Estrogen metabolites and the risk of breast cancer in older women. Epidemiology. 2003;14:740–4. doi: 10.1097/01.ede.0000091607.77374.74. [DOI] [PubMed] [Google Scholar]
- 34.Eliassen AH, Missmer SA, Tworoger SS, Hankinson SE. Circulating 2-hydroxy-and 16alpha-hydroxy estrone levels and risk of breast cancer among postmenopausal women. Cancer Epidemiol Biomarkers Prev. 2008;17:2029–35. doi: 10.1158/1055-9965.EPI-08-0262. [DOI] [PMC free article] [PubMed] [Google Scholar]
- 35.Xu X, Veenstra TD, Fox SD, et al. Measuring fifteen endogenous estrogens simultaneously in human urine by high-performance liquid chromatography-mass spectrometry. Anal Chem. 2005;77:6646–54. doi: 10.1021/ac050697c. [DOI] [PubMed] [Google Scholar]
- 36.Falk RT, Xu X, Keefer L, Veenstra TD, Ziegler RG. A liquid chromatography-mass spectrometry method for the simultaneous measurement of 15 urinary estrogens and estrogen metabolites: assay reproducibility and interindividual variability. Cancer Epidemiol Biomarkers Prev. 2008;17:3411–8. doi: 10.1158/1055-9965.EPI-08-0355. [DOI] [PMC free article] [PubMed] [Google Scholar]
- 37.Missmer SA, Spiegelman D, Bertone-Johnson ER, Barbieri RL, Pollak MN, Hankinson SE. Reproducibility of plasma steroid hormones, prolactin, and insulin-like growth factor levels among premenopausal women over a 2–3 year period. Cancer Epidemiol Biomarkers Prev. 2006;15:972–8. doi: 10.1158/1055-9965.EPI-05-0848. [DOI] [PubMed] [Google Scholar]
- 38.Xu X, Keefer LK, Ziegler RG, Veenstra TD. A liquid chromatography-mass spectrometry method for the quantitative analysis of urinary endogenous estrogen metabolites. Nat Protoc. 2007;2:1350–5. doi: 10.1038/nprot.2007.176. [DOI] [PubMed] [Google Scholar]
- 39.Hankinson SE, Willett WC, Manson JE, et al. Plasma sex steroid hormone levels and risk of breast cancer in postmenopausal women. J Natl Cancer Inst. 1998;90:1292–9. doi: 10.1093/jnci/90.17.1292. [DOI] [PubMed] [Google Scholar]
- 40.Rosner B. Percentage points for a generalized ESD many-outlier procedure. Technometrics. 1983;25:165–72. [Google Scholar]
- 41.Rosner B, Glynn RJ. Interval estimation for rank correlation coefficients based on the probit transformation with extension to measurement error correction of correlated ranked data. Stat Med. 2007;26:633–46. doi: 10.1002/sim.2547. [DOI] [PubMed] [Google Scholar]
- 42.Hankinson SE, Manson JE, Spiegelman D, Willett WC, Longcope C, Speizer FE. Reproducibility of plasma hormone levels in postmenopausal women over a 2-3-year period. Cancer Epidemiol Biomarkers Prev. 1995;4:649–54. [PubMed] [Google Scholar]
- 43.Shekelle RB, Shryock AM, Paul O, et al. Diet, serum cholesterol, and death from coronary heart disease. The Western Electric study. N Engl J Med. 1981;304:65–70. doi: 10.1056/NEJM198101083040201. [DOI] [PubMed] [Google Scholar]
- 44.Rosner B, Hennekens CH, Kass EH, Miall WE. Age-specific correlation analysis of longitudinal blood pressure data. Am J Epidemiol. 1977;106:306–13. doi: 10.1093/oxfordjournals.aje.a112466. [DOI] [PubMed] [Google Scholar]
- 45.Gordon T, Shurtleff D. The Framingham Study: an epidemiologic investigation of cardiovascular disease. Section 29: Means at each examination and inter-examination variation of specified characteristics: Framingham Study Exam 1 to Exam 10. 1973 pp. DHEW Pub No. (NIH) 74-478. [Google Scholar]
- 46.Van Aswegen CH, Purdy RH, Wittliff JL. Binding of 2-hydroxyestradiol and 4-hydroxyestradiol to estrogen receptors from human breast cancers. J Steroid Biochem. 1989;32:485–92. doi: 10.1016/0022-4731(89)90380-4. [DOI] [PubMed] [Google Scholar]
- 47.Anstead GM, Carlson KE, Katzenellenbogen JA. The estradiol pharmacophore: ligand structure-estrogen receptor binding affinity relationships and a model for the receptor binding site. Steroids. 1997;62:268–303. doi: 10.1016/s0039-128x(96)00242-5. [DOI] [PubMed] [Google Scholar]
- 48.Barnea ER, MacLusky NJ, Naftolin F. Kinetics of catechol estrogen-estrogen receptor dissociation: a possible factor underlying differences in catechol estrogen biological activity. Steroids. 1983;41:643–56. doi: 10.1016/0039-128x(83)90030-2. [DOI] [PubMed] [Google Scholar]
- 49.Miyairi S, Ichikawa T, Nambara T. Structure of the adduct of 16 alpha-hydroxyestrone with a primary amine: evidence for the Heyns rearrangement of steroidal D-ring alpha-hydroxyimines. Steroids. 1991;56:361–6. doi: 10.1016/0039-128x(91)90068-7. [DOI] [PubMed] [Google Scholar]
- 50.Bucala R, Fishman J, Cerami A. Formation of covalent adducts between cortisol and 16 alpha-hydroxyestrone and protein: possible role in the pathogenesis of cortisol toxicity and systemic lupus erythematosus. Proc Natl Acad Sci U S A. 1982;79:3320–4. doi: 10.1073/pnas.79.10.3320. [DOI] [PMC free article] [PubMed] [Google Scholar]
- 51.Swaneck GE, Fishman J. Covalent binding of the endogenous estrogen 16 alpha-hydroxyestrone to estradiol receptor in human breast cancer cells: characterization and intranuclear localization. Proc Natl Acad Sci U S A. 1988;85:7831–5. doi: 10.1073/pnas.85.21.7831. [DOI] [PMC free article] [PubMed] [Google Scholar]
- 52.Lustig RH, Mobbs CV, Pfaff DW, Fishman J. Temporal actions of 16 alpha-hydroxyestrone in the rat: comparisons of lordosis dynamics with other estrogen metabolites and between sexes. J Steroid Biochem. 1989;33:417–21. doi: 10.1016/0022-4731(89)90332-4. [DOI] [PubMed] [Google Scholar]
- 53.Seeger H, Wallwiener D, Kraemer E, Mueck AO. Comparison of possible carcinogenic estradiol metabolites: Effects on proliferation, apoptosis and metastasis of human breast cancer cells. Maturitas. 2005 doi: 10.1016/j.maturitas.2005.08.010. [DOI] [PubMed] [Google Scholar]
- 54.Gupta M, McDougal A, Safe S. Estrogenic and antiestrogenic activities of 16alpha- and 2-hydroxy metabolites of 17beta-estradiol in MCF-7 and T47D human breast cancer cells. J Steroid Biochem Mol Biol. 1998;67:413–9. doi: 10.1016/s0960-0760(98)00135-6. [DOI] [PubMed] [Google Scholar]
- 55.Schneider J, Huh MM, Bradlow HL, Fishman J. Antiestrogen action of 2-hydroxyestrone on MCF-7 human breast cancer cells. J Biol Chem. 1984;259:4840–5. [PubMed] [Google Scholar]
- 56.Vandewalle B, Lefebvre J. Opposite effects of estrogen and catecholestrogen on hormone-sensitive breast cancer cell growth and differentiation. Mol Cell Endocrinol. 1989;61:239–46. doi: 10.1016/0303-7207(89)90135-4. [DOI] [PubMed] [Google Scholar]
- 57.Yue TL, Wang X, Louden CS, et al. 2-Methoxyestradiol, an endogenous estrogen metabolite, induces apoptosis in endothelial cells and inhibits angiogenesis: possible role for stress-activated protein kinase signaling pathway and Fas expression. Mol Pharmacol. 1997;51:951–62. doi: 10.1124/mol.51.6.951. [DOI] [PubMed] [Google Scholar]
- 58.Schumacher G, Neuhaus P. The physiological estrogen metabolite 2-methoxyestradiol reduces tumor growth and induces apoptosis in human solid tumors. J Cancer Res Clin Oncol. 2001;127:405–10. doi: 10.1007/s004320000233. [DOI] [PMC free article] [PubMed] [Google Scholar]
- 59.Lippert C, Seeger H, Mueck AO. The effect of endogenous estradiol metabolites on the proliferation of human breast cancer cells. Life Sci. 2003;72:877–83. doi: 10.1016/s0024-3205(02)02305-6. [DOI] [PubMed] [Google Scholar]
- 60.Liu ZJ, Zhu BT. Concentration-dependent mitogenic and antiproliferative actions of 2-methoxyestradiol in estrogen receptor-positive human breast cancer cells. J Steroid Biochem Mol Biol. 2004;88:265–75. doi: 10.1016/j.jsbmb.2003.12.003. [DOI] [PubMed] [Google Scholar]
- 61.Fukui M, Zhu BT. Mechanism of 2-methoxyestradiol-induced apoptosis and growth arrest in human breast cancer cells. Mol Carcinog. 2009;48:66–78. doi: 10.1002/mc.20458. [DOI] [PubMed] [Google Scholar]