

Abstract
Here we report a reagentless fluorescence sensing technique for glutamine in the submicromolar range based on the glutamine binding protein (QBP). The S179C mutant is labeled with the short-lived acrylodan (lifetime<5ns) and the long-lived tris(dibenzoylmethane) mono(5-amino-1,10-phenanthroline)europium(III) (lifetime>300µs) at the –SH and the N-terminal positions, respectively. In the presence of glutamine the fluorescence of acrylodan is quenched, while the fluorescence of europium complex remains constant. In this report we describe an innovative technique, the so called lifetime assisted ratiometric sensing to discriminate the two fluorescence signals using minimal optics and power requirements. This method exploits the large difference between the fluorescence lifetimes of the two fluorophores to isolate the individual fluorescence from each other by alternating the modulation frequency of the excitation light between 300 Hz and 10 kHz. The result is a ratiometric optical method that does not require expensive and highly attenuating band pass filters for each of the dyes, but only one long pass filter for both. Thus, the signal to noise ratio is enhanced, and at the same time, the optical setup is simplified. The end product is a simple sensing device suitable for low-cost applications such as point-of-care diagnostics or in-the-field analysis.
Keywords: Glutamine, Glutamine Binding Protein, LARS, Optical Biosensor
Introduction
Glutamine, the most plentiful amino acid in the body, is essential for cell growth [1]. Glutamine is an energy substrate for most cells and conducts mitochondrial adenosine triphosphate formation. It also constitutes a precursor for nucleotides, glutamate, and especially glutathione synthesis which is one of the main sources of the antioxidant defense [2, 3, 4]. Glutamine is thus considered as the main respiratory fuel and metabolic precursor for rapidly dividing cells such as enterocytes and immune cells and plays a leading role in the protection against oxidative stress injury [5, 6]. Therefore, it is a natural product that plays a leading role in the protection against oxidative stress injury. On the other hand the glutamine concentration is found to be significantly higher in amygdala-hippocampal complex of people with autistic spectrum disorder than in normal people [7]. It has also been reported that the glutamine synthesis is accelerated in patient with cerebral malaria [8]. Moreover, it is an important nitrogen and carbon source for eukaryotic cell culture [9,11] and it has been shown to be the major energy source for HeLa cells and not sugar [12]. Thus, monitoring glutamine levels is an important in biomedical and biochemical research and in biotechnology.
Currently available glutamine sensing systems rely on glutaminase (EC 3.5.1.2) in combination with glutamate oxidase (EC 1.4.3.11) [13–15]. The latter is required to suppress the interference of glutamic acid to the electrochemical measurements. Other analytical methods are HPLC, LC-MS or Near-infrared spectroscopy [16–21]. All of these require expensive and bulky instrumentation. A far more elegant approach used in this and previous reports [23] employs the glutamine binding protein, which neither require any reagents nor does it transform the substrate to other products.
The glutamine binding protein (QBP) belongs to the family of periplasmic binding proteins (PBP) found between the inner and outer membranes of gram-negative bacteria. QBP scavenges and senses glutamine in the environment. And by coupling to transporters or chemotaxis receptors on the inner membrane, mediates substrate transport or induces chemotaxis towards the nutrient source. X-ray crystallographic analysis of liganded and free PBPs has revealed that PBPs consist of two lobes closing around the ligand, resembling a Venus flytrap [22]. A key aspect of the complexation of the substrate molecule is the accompanied reversible conformational change causing local polarity changes [23]. Hence, the attachment of a polarity sensitive fluorophore such as acrylodan at a certain position with significant polarity change would make the binding protein an optical biosensor. Since this sensor is based solely on conformational changes, no further reagent is necessary.
Previous studies have shown that labeling the cysteine of the S179C variant of glutamine binding protein with acrylodan results in a fluorescence change corresponding to the glutamine concentration [24]. However, such intensity-based measurement suffers from systematic errors due to fluctuation of excitation light, fluorophore concentration, photo-degradation of the fluorophore and any changes of the optical system. Errors arising from these factors can be minimized by utilizing the ratiometric approach. The conventional ratiometric method separates the two desired fluorescence signals optically by costly monochromator or band pass filters attenuating the signal to a considerable extent.
In our earlier reports we have demonstrated another ratiometric method which on the one hand can reduce the fabrication cost significantly and on the other hand greatly simplifies the optical system [25]. This method has been named as lifetime-assisted ratiometric sensing (LARS) approach which measures only the modulated signals. The sensing system is based on the glutamine binding protein S179C variant which is labeled with acrylodan (τ<5ns) and the reference fluorophore ruthenium bis-(2,2’-bipyridyl)-1,10-phenanthroline-9-isothiocyanate (ru(bpp)) (τ~700ns) . This approach exploits the fact that the fluorescence of a dye is demodulated if the modulation frequency largely exceeds twice the reciprocal of its lifetime τ. Due to the large fluorescence lifetime difference between the two dyes, a modulation frequency (ω>2.8MHz) can be selected at which only the fluorescence signal of ru(bpp) is demodulated while the fluorescence of acrylodan is not affected. On the other hand, if the modulation frequency is lower than twice the reciprocal of the lifetime of ru(bpp), both fluorescence signals are modulated and can be measured.
Although the employment of ru(bpp) makes it feasible to develop a low-cost sensor, it remained a difficult task. Such a system suffers from the high noise levels and phase shift that accompany the required modulation frequency range. In this paper, we present an improvement to this approach by replacing ru(bpp) with tris(dibenzoylmethane) mono(5-amino-1,10-phenanthroline)europium(III)) (eu(tdap)) whose lifetime at 300µs is several orders of magnitude longer than that of ru(bpp). The extremely long fluorescence lifetime allows us to use a maximum modulation frequency as low as 7 kHz. This drastic decrease in the modulation frequency and other advantages (see below) makes the development of the low-cost optoelectronic sensor system more practical and realistic. Indeed, in this paper, we describe an inexpensive, miniaturized prototype fluorometer constructed specifically for LARS.
Material and methods
Materials
6-Acryloyl-2-dimethylaminonaphthalene (acrylodan) and tris(2-carboxyethyl)phosphine (TCEP) were purchased from Molecular Probes (Eugene, OR). tris(dibenzoylmethane) mono(5-amino-1,10-phenanthroline)europium(III)), glutaraldehyde (50%), fucose, sucrose, glucose, DEAE Sephadex A-50, Dimethyl sulfoxide (DMSO), NaCl, KH2PO4, Na2HPO4, NaH2PO4, Trizma® hydrochloride (Tris-HCl)and MgCl2 were purchased from Sigma-Aldrich. Tryptone and yeast extract for the Lysogeny broth (LB) were obtained from Becton Dickinson (Sparks, MD). The SnakeSkin T Dialysis Tubing (10K MWCO) was purchased from Pierce (Rockford, IL). The Quick-Change mutagenesis kit was obtained from Stratagene (Cedar Creek, TX)
QBP expression and isolation
The procedure for the expression, release, and purification of the S179C mutant is similar to that described previously [24] except for a few modifications. First, 20 mL of LB medium in a 50-mL tube was inoculated with a single colony on the plate and incubated at 37 °C with shaking at 260 rpm for 8–10 h. The seed culture obtained above was then used to inoculate 500 mL of LB medium supplemented with 100mg/l ampicillin in a 1000-mL shake flask. The culture was then incubated at 37 °C with shaking at 260 rpm for 8 h. To release the periplasmic proteins, the cells in the above culture were first harvested by spinning for 5 min at 13000g and then washed twice with 40 mL of 10 mM Tris-HCl, 30 mM NaCl, pH 7.5. The cells were collected by centrifugation at 13000g for 5 min and resuspended in 40 mL of 33 mM Tris-HCl, pH 7.5. After mixing with 40 mL of 40% sucrose, 0.1 mM EDTA, 33 mM Tris-HCl, pH 7.5, the suspension is then left at room temperature for 10 min with very slow shaking, followed by centrifugation at 13000g for 5 min. The periplasmic proteins were released by adding 10 mL of ice-cold 0.5 mM MgCl2 and shaking vigorously in an ice bath for 10 min. Finally, the suspension was centrifuged at 13000g for 10 min. The total concentration of the periplasmic proteins was determined using Micro Protein Determination Kit (Sigma Diagnostics, Inc., Louis, MO). A 10-fold excess of TCEP was added to the protein solutions to prevent the oxidation of the thiol groups. The QBP content in the supernatant was estimated by SDS PAGE to be >80%. The crude protein products were then purified on a DEAE Sephadex A-50 column.
Fluorophore coupling
The S179C QBP mutant contains a single cysteine mutation at position 179 that is used to label the protein specifically with acrylodan. For this purpose a 10-fold excess of this fluorophore dissolved in DMSO is added drop wise into the protein solution, and the coupling reaction is allowed to take place at room temperature for 4 hours. The excess dye is removed by gel-permeation chromatography on a Sephadex G-25 column eluted with phosphate-buffered saline, pH 7.5.
For the coupling of eu(tdap) with the protein glutaraldehyde is used as the coupling agent. This process is carried out in two steps (Figure 2). In the first step eu(tdap) is coupled with glutaraldehyde, in the second step the fluorophore-imine molecule is coupled with the protein via the remaining carbonyl group of glutaraldehyde. In the first reaction a 100-fold excess of the crosslinker is used to ensure that only one glutaraldehyde molecule is bound to one fluorophore molecule. The first reaction step is carried out as follows. 2µmol eu(tdap) is dissolved in 1mL tetrahydrofuran to which 0.20 mL of a 50%-glutaraldehyde aqueous solution is added. The mixture is allowed to react for 3 hours. Afterwards 2mL deionized water is added to the solution which causes the fluorophore/glutaraldehyde conjugate to precipitate. This suspension is filtered and repeatedly washed with deionized water to remove the unreacted glutaraldehyde. The modified fluorophore is re-dissolved in 0.2 mL THF and is ready to use for the protein coupling process. For this purpose a 10-fold excess of the eu(tdap)/glutaraldehyde conjugate is added to the buffered protein solution at pH 7.5 to ensure that only the N-terminal amino group is labeled. The coupling reaction is allowed to take place for 5 hours. The unreacted fluorophore is removed by dialyzing overnight. The final dual-labeled protein solution is filter-sterilized using a 0.2 µm filter and stored at 4°C.
Figure 2.

Two-step process to couple the eu(tdap) complex to the QBP protein. Two separate steps are required in order to prevent glutaraldehyde from crosslinking two proteins which may deactivate the proteins.
Fluorescence measurement
For the fluorescence measurements based on LARS the experimental setup is depicted in Figure 3. It comprises of an UV-LED with an emission peak at 400nm (Superbrightleds, St Louis, MO, USA) serving as the excitation light source, a photo-multiplier R7400 (Hamamatsu, Bridgewater, NJ, USA), an excitation (FB400-10, Thorlabs, Newton, NJ, USA) and an emission filter (03 LWP 404, Melles Griot, Rochester, NY, USA), lockin amplifier (7265 DSP, Signal Recovery, Oak Ridge, TN, USA). The transimpedance and amplification circuit is made in our laboratory. It consists of the operational amplifiers, the OPA129 and OPA177 (Digikey, Thief River Falls, MN, USA) which are serially connected. A Carey Eclipse spectrofluorimeter (Varian, Walnut Creek, CA, USA) served as the reference for the fluorescence measurement and for excitation and emission spectral analysis.
Figure 3.

Experimental setup for the glutamine measurement based on LARS. The LED is driven and modulated by the lockin amplifier which also recovers the signal from the noise. The fluorescence is measured in 90° angle to excitation light path. The sample is held in a standard cuvette for fluorescence measurement.
The LED and the transimpedance amplification circuit are connected to the lockin amplifier which has a double function. It drives and modulates the LED at two alternating modulation frequencies, 320 Hz and 10 kHz. Additionally, it recovers the modulated fluorescence signals from unwanted noise and unmodulated light all of which are measured by the PMT and converted by the transimpedance amplifier.
For the measurement with the spectrofluorimeter and the LARS based setup 4mL disposable cuvettes are used. They are filled with 3ml of the same phosphate buffered QBP solution. The QBP concentration is 1.8µM and the phosphate buffer strength is 20mM. These protein solutions are then titrated with the same 12.2µM glutamine solution and measured all at room temperature. In case of the LARS setup the fluorescence is measured alternately at 320 Hz and 7 kHz.
Theory of LARS
Mathematically the LARS technique can be ascribed as follows. For a mixture of fluorophores, the phase and modulation can be calculated using the following equations [27]:
| (eq. 1) |
| (eq. 2) |
Where Nω and Dω are the sine and cosine transforms of the intensity decays, fi is the fractional steady-state intensity, Φi is the phase, and mi is the modulation. At any given frequency, the modulation for a multi-exponential decay is given by
| (eq. 3) |
In this study, the QBP is labeled with short-lived acrylodan (Ac) and long-lived eu(tdap) fluorophores. Because these two fluorophores have widely different decay lifetimes, an excitation frequency can be identified where the modulation of acrylodan is close to 1.0 and the modulation of eu(tdap) is close to 0. At this frequency,
| (eq. 4) |
| (eq. 5) |
Substituting these to Eq. (3), we arrive at
This indicates that the modulated emission signal of a mixture of short- and long-lived fluorophores is the fractional intensity of the short-lived fluorophore. The dependency of the steady state fluorescence intensity f to the lifetime of the fluorophore and the modulation frequency of the excitation light is described as
| (eq. 6) |
A = amplitude, ω = angular modulation frequency, τ = lifetime [28].
Results
Figure 4 shows the excitation and emission spectra of acrylodan and eu(tdap) attached to QBP. The excitation maximum of acrylodan is found to be at 388nm while the excitation peak of eu(tdap) is located at 361nm. Although the peaks are not identical, the curves mostly overlap. This means a single UV-LED, such as the commercially available 370nm LED or the 400nm LED can be used to excite both dyes. In the previous study [23] the excitation spectrum of ru(bpp) and acrylodan overlap more modestly, thus, this is an important advantage of eu(tdap) over ru(bpp). More importantly, the use of a single LED simplifies the instrumental setup and reduces the material cost while allowing greater miniaturization.
Figure 4.
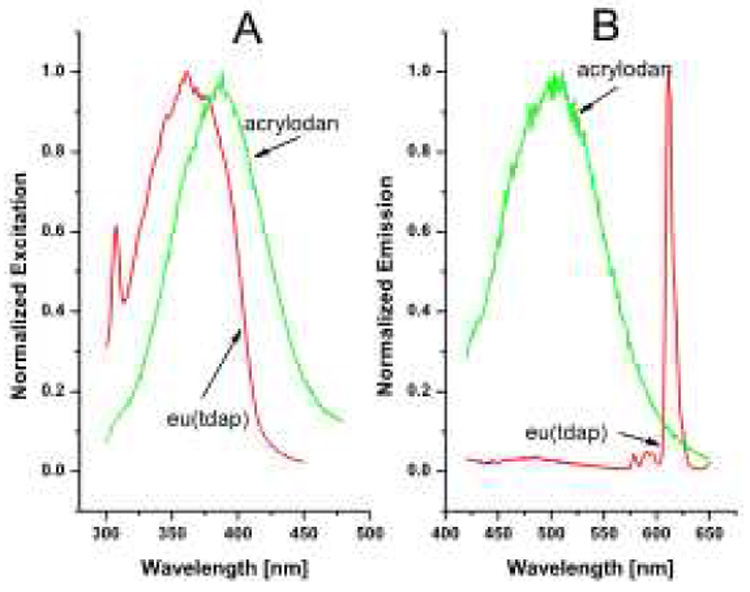
Excitation and emission spectra of acrylodan and eu(tdap) dissolved in tetrahydrofuran (THF). The concentrations of the solutions are 1.2 and 1.4 µM respectively. The emission spectrum of acrylodan is obtained by exciting the solution at 390nm and the eu(tdap) - at 370nm. The spectra are taken with the Carey Eclipse spectrofluorimeter at room temperature. The control voltage of the spectrofluorimeter is set at 700.
Eu(tdap) has a main emission peak at 612nm and two minor peaks at 580 and 590nm. They are the result of the transitions 5D0 -- 7F0, 5D0 -- 7F1, and 5D0 -- 7F2, respectively [26]. Like other lanthanides, the valence electrons of the europium atom are the 4f electrons whose orbitals are closer to the center than the main larger 5s, 5p, 5d and 6s orbitals. Hence, they are well shielded and are not easily affected by the surrounding environment. Additionally, the excitation of the europium complex is a two step process. First, the ligands absorb the energy from the light source, and then transfer this energy to the central ion. Fluorescence occurs when the europium ion in the excited state returns to the ground state. Since the fluorescence is based on the 4f-4f transition solely within the central ion, the fluorescence is unaffected by external factors and no wavelength shift or quenching is expected despite changes in the polarity of the environment. This is important in its role as the reference emission and for discrimination against acrylodan fluorescence which provides the indirect signal for glutamine sensing. A further advantage of eu(tdap) is the large Stokes shift of more than 200nm as shown in Figure 4. This allows for easier and more efficient separation of excitation and emission. Figure 5 shows the fluorescence response of the 1.8 µM dual-labeled QBP solution to increasing glutamine. Consistent with previous results, the fluorescence intensity of acrylodan decreases with higher glutamine concentrations. As mentioned above, this is due to the changes in the polarity of microenvironment surrounding the acrylodan molecule as the QBP is transformed from the “open” to the “close” conformation by complexation with glutamine. In contrast, the fluorescence intensity of eu(tdap) itself at 612nm is not affected. As expected from the excitation and emission spectra in Figure 5, eu(tdap) shows no quenching or resonance energy transfer effects on the acrylodan molecule. However, Figure 5B shows that the fluorescence at 612nm changes about 3% which is difficult to see in Figure 5A although present. This change is due to the partial overlapping by the acrylodan fluorescence as shown in Figure 4. With conventional optical filters or optical gratings these two fluorescence signals cannot be completely isolated from one another. In this case the LARS method is more efficient since it is wavelength independent. Hence, the spectral overlapping won’t matter. Still, in any case the sensitivity to glutamine remains high; the fluorescence change in response to the glutamine from zero glutamine to saturation is 50%. The calculation of the glutamine dissociation constant KD delivers a result of 0.9 µM which is in the same order of magnitude as the wild type with a KD of 0.1–0.3µM [29]. The calculation is carried out according to method used by Ge et al. [30]. Thus, considering these aspects, eu(tdap) is an excellent reference.
Figure 5.
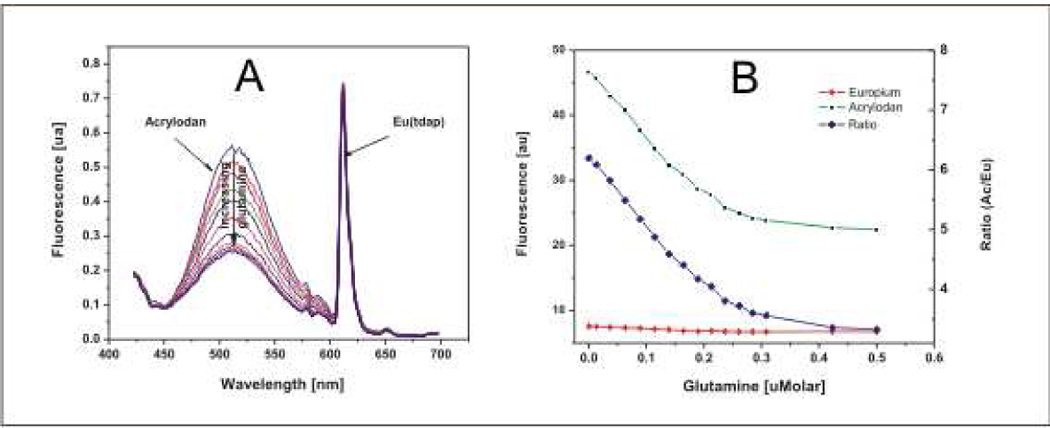
a) Titration of the 1.8 µM dual labeled QBP solution (PBS buffer, 20mmolar, pH7.5) with a buffered glutamine solution (PBS buffer, 20mmolar, pH7.5). As shown, the fluorescence intensity of acrylodan decreases with increasing glutamine concentration. In contrast, the fluorescence of the eu(tdap) complex is not affected. b) Response of the protein attached acrylodan and eu(tdap) on the glutamine concentration. Each data point on the fluorescence curve of acrylodan and eu(tdap) represents the integral of the emission curve in figure 5a. The integration interval of the acrylodan peak and the eu(tdap) peak is set from 450 to 575nm and 600 to 640nm respectively.
To determine the suitable modulation frequencies for the lifetime assisted ratiometric method the dual-labeled protein solution is exposed to a modulation frequency scan starting from 100Hz to 20 kHz (Figure 6). The experimental setup of this scan is described in figure 3. The experimental data matches very well with the theoretical data for whose calculation eq.6 has been used. The difference at the beginning of the curve is due to destructive interference with the net power frequency. As the result, the measured signals near the 120 Hz are much lower than expected and the minimum at 120 Hz is the direct result of the interference. At around 320Hz the fluorescence reaches a maximum. At this frequency the fluorescence of both dyes is least affected by the net power and the demodulation. Further increase in LED modulation frequency result in a drop of the fluorescence signal until it is leveled at about 7 kHz. At this cut-off frequency the fluorescence signal of the europium complex practically vanished and the remaining fluorescence represents the fluorescence of acrylodan only. Compared to the acrylodan/ru(bpp) system with a cut-off frequency of 2.8MHz it is a reduction factor of 400 which is the result of the approximately 400-fold longer lifetime of eu(tdap) (300µs compared to 0.7µs). This low demodulation frequency obtained with the europium complex provides immense benefits for the design of low-cost sensor electronics since slower but more precise and inexpensive electronic components can be employed. Considering the Nyquist rate, even ICs with a bandwidth as small as 14 kHz are fully able to process the modulated signal whereas 5.6 MHz bandwidth is required from ICs to recover the ru(bpp) fluorescence signal. Moreover, as we have measured there is less electronic noise at this low modulation frequency of the LED, which means the signal to noise ratio is improved. Based on the information obtained from this measurement the two frequencies of 320 Hz and 7 kHz are chosen for glutamine measurement based on LARS. The optoelectronic setup is shown in figure 3. The results of these measurements are shown in figure 7. The fluorescence measured at 320 Hz is about a value of 2 higher than the signal measured at 7 kHz. The difference of these two measurements represents the demodulated fluorescence signal of eu(tdap) which remains constant at all glutamine concentrations. All three curves can be mathematically described by an exponential decay function. The correlation between the ratio of the measured fluorescence of acrylodan and eu(tdap) and the glutamine concentration is comparable to the data obtained by the spectrofluorimeter (figure 5B). This is more obvious when comparing the results of the linear analysis of the two measurements shown in table 1. However, the advantage of the LARS based sensor is that it measures the integral of the luminescence peak automatically. Furthermore, the complete analysis can be automated when using a microcontroller. In contrast the spectral of a fluorimeter has to be analyzed offline by the user. It is noteworthy that this result is obtained using relatively slow operational amplifiers and just one optical long pass filter for both fluorophores. Hence, it proves that the separation of the fluorescence of acrylodan and eu(tdap) by LARS is efficient and the measurement based on this method is a considerably good alternative to the conventional ratiometric method.
Figure 6.

Modulation frequency scan of dual-labeled QBP solution between 100Hz and 20 kHz. The setup for this experiment is depicted in figure 4. The theoretical curve is calculated with the eq.6. The difference between the two curves at the start results from the interference with the 60 Hz.
Figure 7.

LARS based measurement of glutamine with the 1.8 µM dual-labeled QBP dissolved in 20mM phosphate buffer. The measurement is carried out by using the experimental setup (figure 3) at room temperature.
Table 1.
Data of the linear regression analysis of the signals ratio→glutamine curves. The linear range is between 0 and 0.24µM.
| Spectrofluorimeter | LARS | |||
|---|---|---|---|---|
| A, Error | 6.16891 | ±0.04116 | 5.43585 | ±0.06656 |
| B, Error | −10.59796 | ±0.33152 | −10.44925 | ±0.53938 |
| R, SD | −0.99611 | ±0.07387 | −0.98951 | ±0.12024 |
Conclusion
We have shown that eu(tdap) is a vast improvement to ru(bpp) as the reference dye for acrylodan in LARS. Its fluorescence is not affected by the substrate and remains constant at all glutamine concentrations. Its presence does not have an impact on the fluorescence properties of acrylodan nor the complexation ability of glutamine to the protein. Due to the significant overlapping of the excitation spectra of eu(tdap) and acrylodan a single LED can be used as the excitation light source. Most importantly, since the eu(tdap) lifetime is about 400 times longer than ru(bpp), the modulation frequency for the LARS based measurement is dramatically reduced to 7 kHz. This makes the development of low-cost opto-electronic sensing devices feasible as suggested by measurements with our homemade preliminary experimental setup. Considering the fact that the LARS optical system setup requires only one long pass filter for both fluorophores, demonstrates further that the LARS based sensing is a superior technique than the conventional method of signal separation by optical band pass filtering. All these advantages cut not only cost, but have a significant positive impact on the instrumental design of a future sensor. Firstly, the low modulation frequency allows huge signal amplification since it is practically not limited by the bandwidth of the op-amps. Combined with lower noise at this frequency an inexpensive photodiode rather than a PMT can be used as the photo detector which would lower the sensor cost and shrink the sensor size dramatically. Further down-scaling measure is the replacement of the currently used cuvette as the sample holder by a smaller and flatter microfluidic chip which would make a design of portable sensor with the size of a PDA possible.
Figure 1.

Principle of glutamine sensing. QBP is labeled with the polarity sensitive dye acrylodan and the insensitive reference dye. The complexation of glutamine causes the transition from the open to the close conformation which changes the microenvironment of the acrylodan molecule. This results in a fluorescence decrease.
Acknowledgement
This work was supported by grants from the US Army (W81XWH-04-1-0781) and the National Institutes of Health (DK062990 and DK072465) to L. Tolosa and Becton Dickinson Technologies to H. Lam.
Footnotes
Publisher's Disclaimer: This is a PDF file of an unedited manuscript that has been accepted for publication. As a service to our customers we are providing this early version of the manuscript. The manuscript will undergo copyediting, typesetting, and review of the resulting proof before it is published in its final citable form. Please note that during the production process errors may be discovered which could affect the content, and all legal disclaimers that apply to the journal pertain.
References
- 1.Labow BI, Souba WW. Glutamine. World J. Surg. 2000;24:1503–1513. doi: 10.1007/s002680010269. [DOI] [PubMed] [Google Scholar]
- 2.Curi R, Lagranha CJ, Doi SQ, Sellitti DF, Procopio J, Pithon-Curi TC, Corless M, Newsholme P. Molecular mechanisms of glutamine action. J. Cell. Physiol. 2005;204:392–401. doi: 10.1002/jcp.20339. [DOI] [PubMed] [Google Scholar]
- 3.Lieth E, LaNoue KF, Berkich DA, Xu B, Ratz M, Taylor C, Hutson SM. Nitrogen shuttling between neurons and glial cells during glutamate synthesis. J. Neurochem. 2001;76:1712–1723. doi: 10.1046/j.1471-4159.2001.00156.x. [DOI] [PubMed] [Google Scholar]
- 4.Dumaswala UJ, Zhuo L, Mahajan S, Nair PN, Shertzer HG, Dibello P, Jacobsen DW. Glutathione protects chemokine scavenging and antioxidative defense functions in human RBCs. Am J Physiol Cell Physiol. 2001;280:C867–C873. doi: 10.1152/ajpcell.2001.280.4.C867. [DOI] [PubMed] [Google Scholar]
- 5.Matés JM, Pérez-Gómez C, Núñez de Castro I, Asenjo M, Márquez J. Glutamine and its relationship with intracellular redox status, oxidative stress and cell proliferation/death. Int. J. Biochem. Cell. Biol. 2002;34:439–458. doi: 10.1016/s1357-2725(01)00143-1. [DOI] [PubMed] [Google Scholar]
- 6.Mora Lde O, Antunes LM, Francescato HD, Bianchi Med L. The effects of oral glutamine on cisplatin-induced nephrotoxicity in rats. Pharmacol. Res. 2003;47:517–522. doi: 10.1016/s1043-6618(03)00040-9. [DOI] [PubMed] [Google Scholar]
- 7.Page Lisa A, Daly Eileen, Schmitz Nicole, Simmons Andrew, Toal Fiona, Deeley Quinton, Ambery Fiona, McAlonan Grainne M, Murphy Kieran C, Murphy Declan GM. In Vivo 1H-Magnetic Resonance Spectroscopy Study of Amygdala-Hippocampal and Parietal Regions in Autism. Am. J. Psychiatry. 2006;163:2189–2192. doi: 10.1176/appi.ajp.163.12.2189. [DOI] [PubMed] [Google Scholar]
- 8.Penet Marie-France, `le Viola Ange, Confort-Gouny Sylviane, LeFur Yann, Duhamel Guillaume, Kober Frank, barrola Danielle I, Izquierdo Marguerite, Coltel Nicolas, Gharib Bouchra, Grau Georges E, Cozzone Patrick J. Imaging Experimental Cerebral Malaria In Vivo: Significant Role of Ischemic Brain Edema. The Journal of Neuroscience. 2005 August 10;25(32):7352–7358. doi: 10.1523/JNEUROSCI.1002-05.2005. [DOI] [PMC free article] [PubMed] [Google Scholar]
- 9.Schmitz RA. Internal glutamine and glutamate pools in Kliebsiella pneumonia grown under different conditions of nitrogen availability. Curr. Microbiol. 2000;41:357–362. doi: 10.1007/s002840010149. [DOI] [PubMed] [Google Scholar]
- 10.Haggstrom L, Ljunggren J, Ohman L. Metabolic engineering of animal cells. Ann. N. Y. Acad. Sci. 1996;782:40–52. doi: 10.1111/j.1749-6632.1996.tb40545.x. [DOI] [PubMed] [Google Scholar]
- 11.Wang MY, Kwong S, Bentley WE. Effects of oxygen /glucose/ glutamine feeding on insect cell baculovirus protein expression: A study on epoxide hydrolase production. Biotechnol. Prog. 1993;9:355–361. doi: 10.1021/bp00022a002. [DOI] [PubMed] [Google Scholar]
- 12.Reitzer Lawrence J, Wice Burton M, Kennel David. Evidence That Glutamine, Not Sugar, Is the Major Energy Source for Cultured HeLa Cells. J. Biol. Chem. 1979 April 25;Vol. 254(No 8):2669–2676. [PubMed] [Google Scholar]
- 13.Madaras MB, Spokane RB, Johnson JM, Woodward JR. Glutamine biosensors for biotechnology applications with suppression of the endogenous glutamate signal. Anal. Chem. 1997;69:3674–3678. doi: 10.1021/ac970173f. [DOI] [PubMed] [Google Scholar]
- 14.Botre R, Botre C, Lorenti G, Mazzei F, Procelli F, Scibona G. Determination of L-glutamate and L-glutamine in pharmaceutical formulations by amperometric L-glutamate oxidase based enzyme sensors. J. Pharm. Biomed. Anal. 1993;11:679–686. doi: 10.1016/0731-7085(93)80174-y. [DOI] [PubMed] [Google Scholar]
- 15.Cattaneo MV, Male KB, Luong JH. A chemiluminescence fiber-optic biosensor system for the determination of glutamine in mammalian cell cultures. Biosens. Bioelectron. 1992;7:569–574. doi: 10.1016/0956-5663(92)85008-x. [DOI] [PubMed] [Google Scholar]
- 16.Mayer C, Frauer A, Schalkhammer T, Pittner F. Enzyme-based flow injection analysis system for glutamine and glutamate in mammalian cell culture media. Anal. Biochem. 1999;268:110–116. doi: 10.1006/abio.1998.3044. [DOI] [PubMed] [Google Scholar]
- 17.Larson TM, Gawlitzek M, Evans H, Albers U, Cacia J. Chemometric evaluation of on-line high-pressure liquid chromatography in mammalian cell cultures: Analysis of amino acids and glucose. Biotechnol. Bioeng. 2002;77:553–563. doi: 10.1002/bit.10116. [DOI] [PubMed] [Google Scholar]
- 18.Qu J, Chen W, Luo G, Wang Y, Xiao S, Ling Z, Chen G. Rapid determination of underivatized pyroglutamic acid, glutamic acid, glutamine and other relevant amino acids in fermentation media by LC-MS-MS. Analyst. 2002;127:66–69. doi: 10.1039/b108422b. [DOI] [PubMed] [Google Scholar]
- 19.Rhiel M, Cohen MB, Murhammer DW, Arnold MA. Nondestructive near-infrared spectroscopic measurement of multiple analytes in undiluted samples of serum-based cell culture media. Biotechnol. Bioeng. 2002;77:73–82. doi: 10.1002/bit.10093. [DOI] [PubMed] [Google Scholar]
- 20.Riley MR, Okeson CD, Frazier BL. Rapid calibration of near infrared spectroscopic measurements of mammalian cell cultivations. Biotechnol. Prog. 1999;15:1133–1141. doi: 10.1021/bp990117v. [DOI] [PubMed] [Google Scholar]
- 21.Riley MR, Arnold MA, Murhammer DW, Walls EL, DelaCruz N. Adaptive calibration scheme for quantification of nutrients and byproducts in insect cell bioreactors by near infrared spectroscopy. Biotechnol. Prog. 1998;14:527–533. doi: 10.1021/bp980022d. [DOI] [PubMed] [Google Scholar]
- 22.Felder Christian B, Graul Richard C, Lee Alan Y, Merkle Hans-Peter, Sadee Wolfgang. The Venus Flytrap of Periplasmic Binding Proteins: An Ancient Protein Module Present in Multiple Drug Receptors. AAPS PharmSci. 1999;1 doi: 10.1208/ps010202. (2) article 2. [DOI] [PMC free article] [PubMed] [Google Scholar]
- 23.Tolosa Leah, Ge Xudong, Rao Govind. Reagentless optical sensing of glutamine using a dual-emitting glutamine-binding protein. Analytical Biochemistry. 2003;314:199–205. doi: 10.1016/s0003-2697(02)00586-9. [DOI] [PubMed] [Google Scholar]
- 24.Dattelbaulm JD, Lakowicz JR. Optical determination of glutamine using a genetically engineered protein. Anal. Biochem. 2001;291:89–95. doi: 10.1006/abio.2001.4998. [DOI] [PMC free article] [PubMed] [Google Scholar]
- 25.Bartolome Amelita, Bardliving Cameron, Rao Govind, Tolosa Leah. Fatty acid sensor for low-cost lifetime-assisted ratiometric sensing using a fluorescent fatty acid binding protein. Analytical Biochemistry. 2005;345:133–139. doi: 10.1016/j.ab.2005.07.030. [DOI] [PubMed] [Google Scholar]
- 26.Duan Jiun-Pey, Sun Pei-Pei, Cheng Chien-Hong. Europium complexes having an aminophenanthroline ligand as red dopants in electroluminescent devices. AZojomo. 2005 October;Vol.1:1–11. [Google Scholar]
- 27.Lakowicz Joseph R. Principles of Fluorescence Spectroscopy. 3rd> Edition. Springer; 2006. [Google Scholar]
- 28.Kostov Yordan, Harms Peter, Pilato Robert S, Rao Govind. Ratiometric oxygen sensing: detection of dual-emission ratio through a single emission filter. Analyst. 2000;125:1175–1178. doi: 10.1039/b002348p. [DOI] [PubMed] [Google Scholar]
- 29.Sohanpal K, Watsuji T, Zhou LQ, Cass AEG. Reagentless fluorescence sensors based upon specific binding proteins. Sens. Actuators B. 1993;11:547–552. [Google Scholar]
- 30.Ge Xudong, Tolosa Leah, Rao Govind. Dual-Labeled Glucose Binding Protein for Ratiometric Measurements of Glucose. Anal. Chem. 2004;76:1403–1410. doi: 10.1021/ac035063p. [DOI] [PubMed] [Google Scholar]