Abstract
Surface patterned platinum microelectrodes (PtEs) insulated with 300 nm thick fused silica were fabricated using contact photolithography. These electrodes exhibit low noise and were used for monitoring single vesicle exocytosis from chromaffin cells by constant potential amperometry as well as fast scan cyclic voltammetry. Amperometric spike parameters were consistent with those obtained with conventional carbon fiber electrodes (CFEs). Catecholamine voltammograms acquired with PtEs exhibited redox peaks with full width at half maximum of ~45 mV, much sharper than those of CFE recordings. The time course of voltammetrically measured release events was similar for PtEs and CFEs. The fused silica insulated PtEs allowed incorporation of micrometer precision surface patterned poly-D-lysine (PDL). PDL-functionalized devices were applied to stimulate mast cells and record single release events without serotonin pre-loading. Microfabricated PtEs are thus able to record single exocytotic events with high resolution and should be suitable for highly parallel electrode arrays allowing simultaneous measurements of single events from multiple cells.
Keywords: Exocytosis, Amperometry, Chromaffin cells, Mast Cells, Voltammetry, Microelectrodes, stimulus-secretion coupling
INTRODUCTION
Exocytosis is a fundamental cellular mechanism by which cells extrude the contents of membrane bound vesicles into the extracellular space. Many techniques have been employed to investigate single exocytotic events including whole cell patch clamp capacitance measurements 1-4, cell attached capacitance measurements 5-8, carbon fiber amperometry 9-11, patch amperometry 12-14, and total internal reflection fluorescence microcopy 15-19.
The probably most widely used method for the study of single exocytotic events utilizes CFEs 20, which record the release of oxidizable compounds, such as catecholamine release from chromaffin cells 9-11 or even dopamine release from dopaminergic neurons 21-24 at extraordinary resolution. Low noise and high temporal resolution has been achieved, due to the CFE's small size and fast response time.
There are, however, two limitations to the CFE technique: (i) In order to obtain statistical significance, experiments need to be performed on a large number of cells 25, 26, which is time consuming for single cell experiments under a microscope, and (ii) the simultaneous electrochemical detection of release and fluorescence imaging of the same vesicle is not readily possible. Fluorescence imaging can often provide important complementary information on vesicle motion 17 or molecular events associated with vesicle exocytosis 27.
To overcome this limitation, surface patterned electrochemical microelectrodes have recently been fabricated using platinum (Pt) 28, 29 or indium-tin-oxide (ITO) 30, 31 as the working electrode material. Here, we describe an improved design of reusable surface-patterned, glass insulated PtEs and characterize their properties in amperometric as well as fast-scan cyclic voltammetric modes for their use in the study of single exocytotic events.
MATERIALS AND METHODS
Cell preparation, reagents and solutions
Bovine chromaffin cells were cultured on 8 mm glass coverslips as described 32. Mast cells were isolated from the peritoneum of adult Sprague-Dawley rats as described 33. The solution used for all electrochemical recordings contained (in mM) 140 NaCl, 5 KCl, 5 CaCl2, 1 MgCl2, 10 HEPES/NaOH, 20 glucose (pH 7.3). Dopamine hydrochloride, (±)-Epinephrine hydrochloride, DL-Norepinephrine hydrochloride, and Poly-D-Lysine (PDL) were all purchased from Sigma (Milwaukee, WI) and used without further purification. Experiments were performed at room temperature, at day 1 after isolation for chromaffin cells and at the day of isolation for mast cells.
CFE fabrication
Carbon fiber electrodes were fabricated as described 11. Briefly, a single carbon fiber (5 μm diameter) was inserted in a borosilicate glass capillary (1.8 mm outer diameter, Hilgenberg GmbH, Germany). The capillary was then pulled using a pipette puller (Model P-97, Sutter instrument, USA) producing two CFEs, which were separated with scissors. CFE tips were dipped in melting wax (Sticky Wax, Kerr Corporation, USA) for 2 min and subsequently cut using a blade (No 10, Feather Safety Razor Co, Japan). Prior to experiments, CFEs were backfilled with 3M KCL solution.
PtE microfabrication
Single or triple PtEs were surface patterned on 4” diameter borosilicate glass wafers of 160-190 μm thickness (ThermoFisher Scientific, Portsmouth, NH) using contact photolithography techniques and metal lift-off.
Briefly, the fabrication procedure was as follows. The glass wafers were cleaned with acetone and baked for ~3 min on a hotplate at 115°C. The wafers were then vapor primed with hexamethyldisilazane (HMDS) in a YES LP-III (Yield Engineering Systems, Inc., Livermore, CA) oven. Following vapor priming, the wafers were spin-coated (4,000 rpm for 30 s) with Shipley S1813 photoresist, and baked on a hotplate at 115°C for 1 min to remove excess solvent. A mask containing the electrode design was used to selectively expose the wafers to UV light using a contact aligner (EV620, EV Group, Scharding, Austria). Wafers were then baked for 2.5 min on a hotplate at 115°C (post-exposure bake) to harden the resist. Subsequently, wafers were ammonia-baked in an image reversal oven (YES oven) and exposed to UV light for 60 s using the contact aligner (flood expose). Following UV exposure, the photoresist was developed in a positive developer (AZ© 300MIF, which contains 2.38% by weight tetramethyl ammonium hydroxide) for 1 min. Residual photoresist (<10 nm) was removed using O2 plasma clean for 30 s with a PT 72 (PlasmaTherm Inc., Kresson, NJ) tool, such that the wafers were coated with photoresist everywhere except where the metal electrodes would be deposited.
The wafers were then placed in an evaporator, and 5 nm of adhesion layer metal (chrome) was deposited at a ~1 A/s deposition rate. After depositing the adhesion layer, 150 nm of Pt was deposited on the wafers at a ~5 A/s deposition rate. The wafers were then placed upside down in a beaker containing Microposit remover 1165 (Shipley Co Inc, Austin, TX) and were set aside overnight for the photoresist to come off (metal lift-off). The wafers were removed from the beaker and thoroughly rinsed with isopropanol to remove residual metal sheets from the wafer surface. The metal electrodes were then coated with 300 nm of SiO2 using a plasma-enhanced chemical vapor deposition (PECVD) system (IPE 1000). Silane (SiH4) and nitrous oxide (N2O) were flowed in the PECVD chamber, which was maintained at a constant temperature of 240°C. These conditions typically result in a SiO2 deposition rate of ~40 nm/min although rates may vary for different PECVD tools. The wafers were then vapor primed using HMDS, spin-coated with S1813 photoresist, and baked on a hotplate at 115°C for 1 min. A second photo-mask was used in the contact aligner (EV620 as above) to selectively expose UV light and define the insulation layer on the wafers. The wafers were then baked for 2.5 min on a hotplate at 115°C, the photoresist was developed using positive developer, and residual photoresist was removed using O2 plasma clean. In order to harden the photoresist, wafers were baked for 5 min on a hotplate at 115°C. The SiO2 was then etched using trifluoromethane (CHF3) and oxygen (O2) at a ratio of 50 sccm/2 sccm. An Oxford 80 (PlasmaLab 80+, Oxford Instruments, Oxfordshire, UK) tool was used for this step. To remove any residual photoresist, wafers were placed in a beaker containing sulfuric acid (H2SO4) and hydrogen peroxide (H2O2). Wafers were then cut into 2.5×2.5 cm2 pieces using a wafer saw.
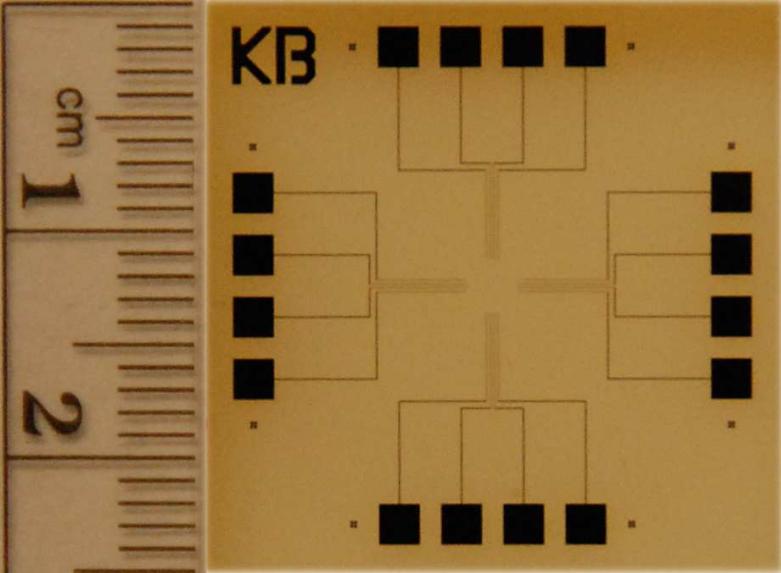
The microfabrication protocol described above routinely resulted in well defined PtE arrays with uniform SiO2 insulation layer thickness throughout the wafer. Fig. 1 shows a photograph of a coverslip containing four PtE arrays.
Figure 1.
A photograph of a coverslip containing sixteen PtEs, spatially separated in four groups of four electrodes. Each group contains a single PtE as well as a tri-electrode array. Photo: courtesy of O.D. Escanilla.
Chemical functionalization
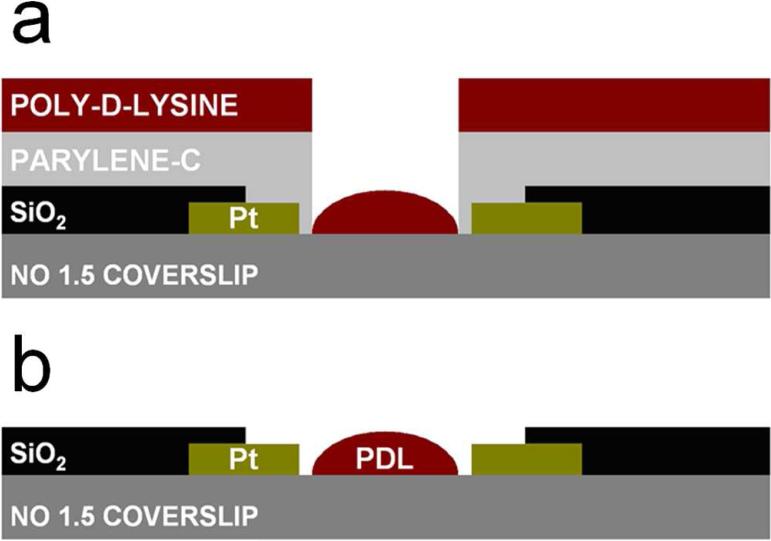
For mast cell recordings, coverslips with microfabricated PtE arrays were coated with ~1 μm thick Parylene-C using a Model PDS 2010 Labcoter (Specialty Coating Systems, Indianapolis, IN, USA), followed by spin coating of ~1.3 μm thick S1813 photoresist. A 5 μm diameter circular region of the photoresist at the center of the PtE array or next to a single PtE was removed using standard photolithography techniques, and the exposed Parylene was etched with a reactive ion etcher (PlasmaTherm 72). 10 μL of 0.1% PDL in distilled water was applied to the surface (Fig. 2A), after allowing 1h for surface coating the unbound PDL was washed off with distilled water. The coverslips were dried at room temperature for 15 min and stored overnight at 4°C after which the Parylene was carefully removed using tweezers. Thus, the PtE array center was selectively coated with PDL (Fig. 2B). Prior to the electrochemical recordings ~100 μL of freshly isolated mast cell suspension was added via a pipette onto the coverslips.
Figure 2.
Schematic of the surface patterning of poly-D-lysine (PDL) on the platinum (Pt) electrode arrays before (a) and after (b) dry lift-off.
Amperometry
Coverslips containing the PtE arrays were mounted on a custom built stage for a Zeiss 135TV microscope, and the individual PtEs were connected to individual amplifiers via spring loaded gold contact pins. A small amount (~100 μL) of buffer solution was added on the PtE array, a coverslip containing chromaffin cells was placed on top of the coverslip containing the PtE array, and individual cells were placed on the electrodes using a glass micropipette as described 28, 29. A chlorinated silver wire (Ag|AgCl) was immersed into the buffer solution and served as the reference electrode. Amperometry was performed with a four-channel amplifier (VA-10, NPI Electronic, Tamm, Germany). The measured current was low pass filtered at 100 Hz using the built-in analog low pass filter of the VA-10 amplifier. The electrodes were held at +700 mV versus the reference Ag|AgCl. Amperometric data was digitized at 2 kHz sampling rate using a 16-bit resolution analog-to-digital (A/D) converter (BNC-2090, NIDAQ, National Instruments, Austin, TX, USA). If necessary, line frequency noise was removed by fitting a sine wave (baseline, amplitude, frequency and phase) to portions of the recordings without any amperometric spikes and subsequently subtracting the resulting sine wave from the data 28. Amperometric spike parameters were extracted as described 25 using procedures written in Igor Pro (WaveMetrics, Lake Oswego, OR, USA). The criteria used for identifying amperometric spikes were 10 pA minimum amplitude and 100 ms maximum half-width. The thresholds used for identifying foot signals were 1 pA amplitude and 5 ms duration. Following measurements from single cells, the functionality of individual electrodes was verified applying buffer solutions containing catecholamines of ~10 μM concentration. When a particular electrode consistently measured low signals compared with the rest of the electrodes in the PtE array, then experiments with that PtE array were not included in the data analysis.
Fast-scan cyclic voltammetry
Fast-scan cyclic voltammetry was performed with an EPC-8 patch-clamp amplifier (HEKA-Elektronik, Lambrecht, Germany). The amplifier's built-in analog low pass filter was set to 5 kHz. The standard voltage waveform applied to the working PtE versus the reference Ag|AgCl wire consisted of a 10 ms triangular segment, during which the electrode voltage was scanned from −500 mV to +1,000 mV and back to −500 mV at a rate of ±300 V/s. The triangular segment was followed by a 90 ms resting period during which the electrode potential was held constant at −500 mV. For experiments at increased time resolution (see Results) the duration of the resting period was reduced to 15 ms and the ramp speed was doubled to ±600 V/s, while the resting and peak potentials remained unaltered. Voltammetric currents were digitized at a rate of 25 kHz using a 16-bit A/D converter (ITC-18, Instrutech Corp, Bellmore, NY, USA), and analyzed using procedures written in Igor Pro 34.
RESULTS
Chromaffin cell amperometry
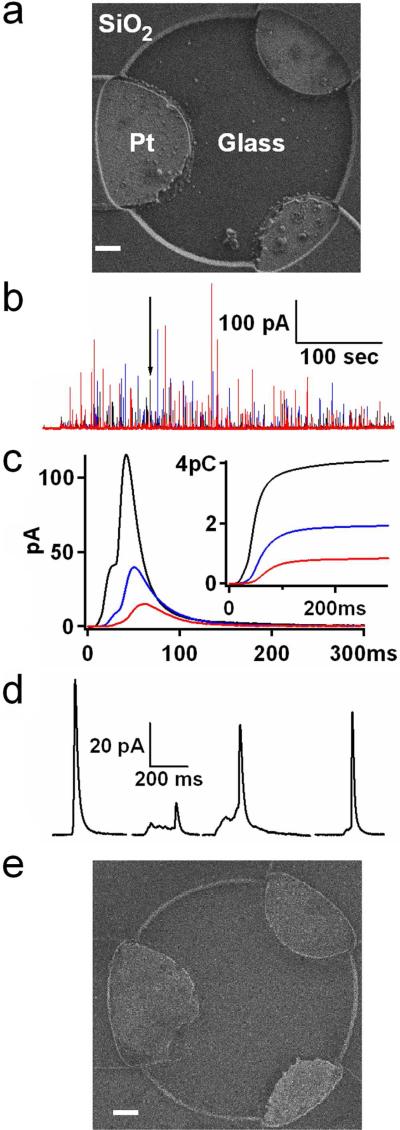
Fig. 3A shows an electron microscope (Zeiss Supra 55VP) image of a 3-electrode PtE array insulated with SiO2. The oxide layer is highly uniform and homogenous. The PtEs are arranged in a circle with ~12 μm diameter. This size was chosen because it approximately matches the diameter of a typical chromaffin or mast cell. Therefore during experiments when bovine chromaffin cells are placed on top of PtE arrays using patch pipettes as described 28, 29, the detector fits the cell dimensions.
Figure 3.
(a) Electron microscope image of a platinum electrode (PtE) array immediately after fabrication. Scale bar: 1 μm. (b) A characteristic amperometric recording from the 3-electrode Pt array of (a). Different colors represent signals measured by different electrodes in the array. (c) The exocytotic event indicated by the arrow in (b) is shown on an expanded time scale. The inset shows the integrated traces which correspond to the charges measured by each electrode. (d) Four different exocytotic events from the recording in (b). (e) Electron microscope image of the same PtE as in (a) after multiple single cell experiments and alcohol cleanings. Scale bar: 1 μm.
The placement procedure stimulated exocytotic catecholamine release, which was recorded by the PtE array. Fig. 3B shows an amperometric recording obtained with this 3-electrode array from a chromaffin cell that produced more than 100 exocytotic events, many of which were detected by multiple electrodes. From the total of 138 identified events of this recording, 102 were detected by at least two electrodes and 55 by all three electrodes. We have chosen PtE arrays with 3 electrodes because it has been demonstrated that employing multiple electrodes allows for spatial localization of the individual exocytotic events provided that amperometric signals are detected by at least three electrodes 29. The spacing between the electrodes allows fluorescence monitoring of exocytotic events 29. The electrodes are arranged in a triangle to maximize the fraction of events detected by all three electrodes.
Fig. 3C shows on an expanded time scale the single amperometric event indicated by the arrow in Fig. 3B. The inset of Fig. 3C shows the running integrals of the current traces, which indicate the time course of measured charge by each electrode. The sum of the final values of the three integrated traces corresponds to the vesicle quantal size, which for this particular event is 6.9 pC or ~21.6 million molecules.
Four distinct events from the recording of Fig. 3B are shown on an expanded time scale in Fig. 3D. These events have short half widths and significantly different foot signal time courses, demonstrating that PtEs can closely follow the time course of catecholamine release from individual chromaffin granules. To quantify the performance of microfabricated PtEs, the amperometric spikes were analyzed as described 25 for quantal size, half width, foot signal duration and foot signal mean amplitude. Quantal size was measured as the sum of charges detected by all electrodes. The three other parameters were derived from the amperometric spike measured by the electrode located closest to the release site (shortest half-width).
The averaged quantal size was 1.82 ± 0.15 pC and the averaged half-width 13.8 ± 0.6 ms (mean ± SEM, n = 138 events, where SEM is the standard error of the mean). Out of the total of 138 individual spikes, 90 had detectable foot signals (65%), with average foot signal duration 11.1 ± 3.7 ms and foot signal mean amplitude of 4.0 ± 0.4 pA (mean ± SEM, n = 90 events). These averaged values of the four amperometric spike parameters came from three PtEs and are similar to those reported for CFEs 9, 35.
To determine the PtE electrical noise, the stored current traces for three individual electrodes were examined in segments of 1 s duration that did not contain any amperometric spikes. For each of the electrodes the root mean square (rms) noise was determined. Subsequently the noise values of the three different electrodes were averaged yielding an average electrode noise of 75 ± 15 fA (mean ± sd, n = 3 electrodes, △f = 100 Hz). This noise level is indistinguishable from the amplifier's feedback resistor (500 MΩ) Johnson noise (~65 fA with the head stage in the open circuit configuration). The measured noise did not differ significantly from the theoretically expected noise level σI, which can be calculated as , where k is the Boltzmann constant, T the temperature in degrees K, △f the low-pass filter's cutoff frequency, and R the feedback resistor's resistance value.
In addition to low current noise, the SiO2-insulated PtEs were mechanically and chemically robust. Multiple single cell experiments followed by ethanol cleaning of the PtE coverslips did not damage the electrode shape (compare Figs. 3A & E) and cleaned PtEs gave amperometric spikes consistent with those measured by carbon fiber electrodes.
Mast cell amperometry
In contrast to excitable cells, exocytosis of mast cells is not mediated by ion channel activation, but by chemical signaling 36. To determine if PtEs can be utilized to record exocytosis from rat peritoneal mast (RPM) cells, PtEs were functionalized with PDL, an established activator of RPM cell exocytosis 37.
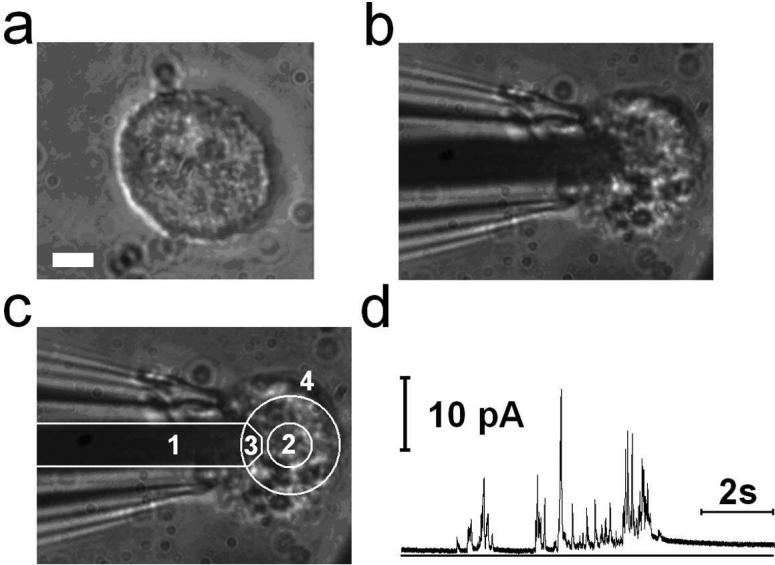
A 5 μm diameter circular region at the center of the PtE array was selectively coated with PDL using the dry lift-off technique 38 (see Materials and Methods). A single RPM cell (Fig. 4A) was lifted with a glass micropipette and manipulated on top of a single Pt electrode (Fig. 4B), the area in front of which was previously coated with PDL (Fig. 4C). Shortly after placement on top of the electrode, the cell degranulated and a series of amperometric events was recorded by the PtE (Fig. 4D). Amperometric events with quantal size as low as ~9.5 fC were resolved, corresponding to the measurement of ~14,800 serotonin molecules, since electrochemical oxidation of serotonin results in the donation of four electrons per molecule 39. PtE arrays can thus measure very small amounts of electroactive compounds.
Figure 4.
(a) A peritoneal mast cell. Scale bar: 5 μm. (b) The mast cell of (a) on top of a single platinum electrode (PtE). (c) Different regions indicated by numbers. 1: SiO2 insulated part of Pt conductor, 2: PDL coated area, 3: exposed area forming the active PtE, 4: All the area outside the large circle including area 1 is covered with the SiO2 insulation layer. (d) The corresponding amperometric recording from the cell shown in B.
From twelve mast cells placed on top of two different PtE arrays that were not functionalized with PDL, only two amperometric spikes were recorded. The functionality of the PtE arrays was subsequently verified using catecholamine solutions. This indicated that unlike chromaffin cells, mast cells were not stimulated by the mechanical placement procedure.
Fast-scan cyclic voltammetry
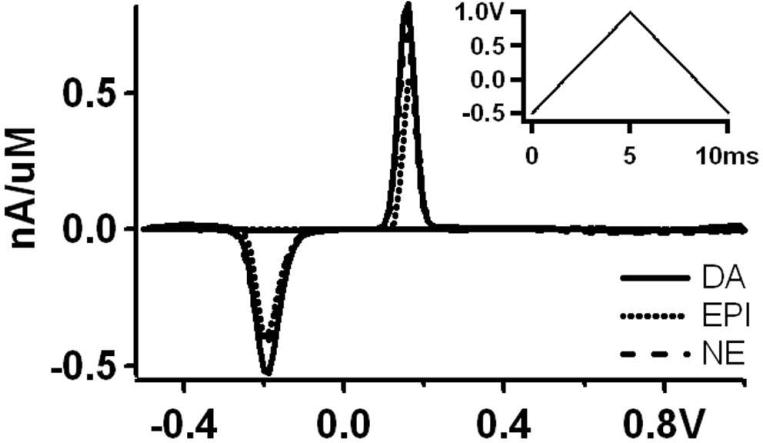
While constant potential amperometry can measure single vesicle release with high resolution, it does not allow identification of the detected compound. Such identification is, however, possible using fast scan cyclic voltammetry (FSCV), as demonstrated for CFE detection of catecholamines 11, 40, 41. To determine if microfabricated PtEs can also be utilized as the working electrodes for FSCV, the potential waveform shown in the inset of Fig. 5 was applied to the PtEs. In physiological saline the resulting current during the voltage ramps is largely due to charging of the double layer capacitance, and is known as the background current. In the presence of electrochemically active compounds in the buffer solution, the resulting current consists of the background current plus a faradaic current due to the redox reactions at the electrode surface 42. Subtraction of the background current recorded with the same electrode results in the difference current, which when plotted versus the applied potential gives the background-subtracted voltammogram. The background-subtracted voltammograms for the catecholamines dopamine (DA), norepinephrine (NE) and epinephrine (EPI) contain two peaks, one at positive potential due to oxidation of the catecholamine to its quinone form, and a second at negative voltage due to reduction of the quinone back to the original catecholamine 43.
Figure 5.
In vitro background subtracted voltammograms obtained from PtEs after addition of 1 μM dopamine (DA), norepinephrine (NE) or epinephrine (EPI) respectively. The inset shows the applied potential waveform.
For the background-subtracted voltammogram it is essential that the background current is stable between successive measurements. For three electrodes of ~10 μm2 active area the current at +160 mV applied potential of the anodic ramp was monitored for 10 sec segments and the measured standard deviation was 8 ± 2 pA (mean ± sd, n = 3 electrodes, △f = 5 kHz), which does not exceed the Johnson noise of the amplifier's feedback resistor and the A/D converter quantization error (~6 pA). The background current of SiO2-insulated PtEs was thus very stable between successive voltammetric measurements.
In vitro calibrations of the PtEs using 1 μM concentrations of the catecholamines DA, NE and EPI resulted in similar background-subtracted voltammograms for all three compounds (Fig. 5). The voltage waveform of Fig. 5 (inset) was chosen because the negative resting potential promoted adsorption of catecholamines onto the Pt surface, in a fashion similar to that for CFEs 44.
In several cases it was not possible to remove the catecholamines from the PtE surfaces such that catecholamine voltammograms remained detectable in plain buffer even after washing the PtEs with alcohol, distilled water, or oxygen plasma clean. This is presumably due to adsorption of catecholamines on the PtEs 45. The adsorbed catecholamines were only removed from the electrode surfaces when 0.18M H2SO4 was added onto the PtEs and the electrode potential was scanned at a rate of 100mV/s between −500mV and +975mV. In some cases it was necessary to perform this electrochemical cleaning for up to 1hour, until the cyclic voltammogram of a pure Pt surface was detected 42.
In addition to this difficulty of removing the catecholamines from the PtE surfaces, some PtEs did not produce a catecholamine voltammogram as shown in Fig. 5, although their functionality was verified via amperometric detection of catecholamines. The reasons for this malfunction remain elusive.
Chromaffin cell voltammetry
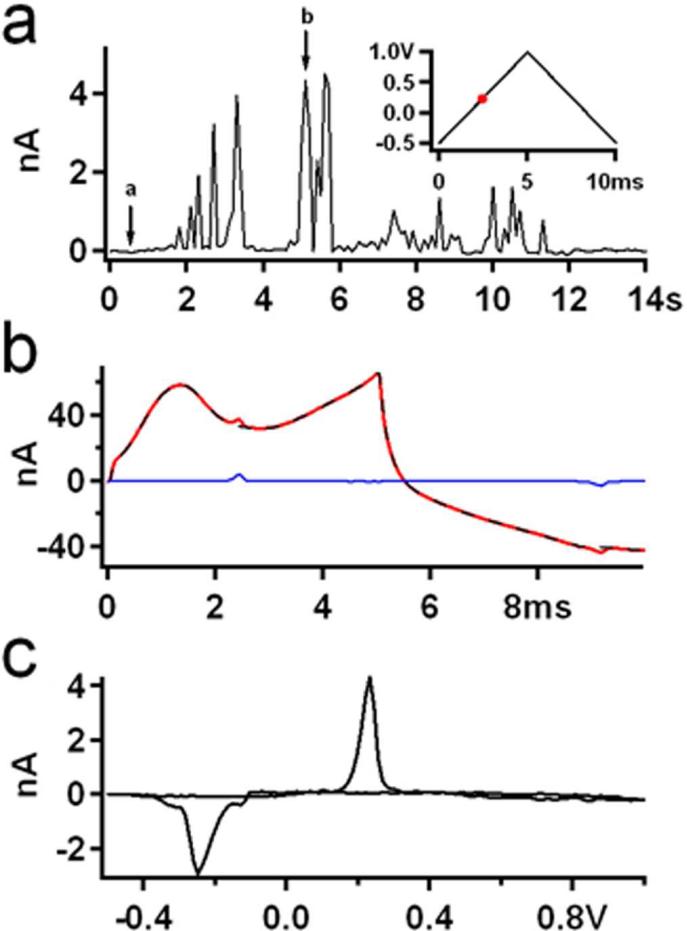
To test if PtEs could detect cellular release events in FSCV mode, individual chromaffin cells were placed on top of single PtEs while the voltage waveform of Fig. 6A (inset) was applied to the PtE. As in amperometry, the placement procedure stimulated the cells and voltammetric spikes indicating chromaffin vesicle exocytosis 11 were observed. The time course of the current sampled at the +230 mV applied potential of the anodic ramp is shown in Fig. 6A for successive sweeps. The averaged value of the first 10 cycles was subtracted from the current trace.
Figure 6.
(a) Catecholamine release indicated as current spikes recorded by a platinum electrode (PtE). The current was sampled at the +230 mV applied potential of the anodic ramp. The average value of the first 10 cycles was subtracted from the current trace. The inset shows the applied potential waveform. The red dot indicates the voltage at which the current was sampled (+230 mV of the anodic ramp). (b) Background (dashed black trace, corresponding to the vertical arrow marked a in panel (a)), background plus faradaic (solid red trace, corresponding to the vertical arrow marked b in panel (a)), and their difference (blue trance). (c) The difference current plotted versus the applied potential revealing the voltammogram for catecholamine molecules with an oxidation peak at +230 mV and a reduction peak at −260 mV.
Fig. 6B shows the background current (dashed black trace, corresponding in time to the arrow marked a in Fig. 6A), the background plus faradaic current (solid red trace, corresponding in time to the arrow marked b in Fig. 6A), as well as their difference (solid blue trace). The difference current was plotted versus the applied potential and revealed the signature voltammogram of catecholamine molecules (Fig. 6C), with two peaks, the first at +230 mV of the anodic ramp and the second at −260 mV of the cathodic ramp. As is the case with CFEs 34, the redox peaks of Pt difference voltammograms consistently occurred at slightly different potentials in single cell experiments (Fig. 6C) compared to in vitro calibrations (Fig. 5).
The background current of the PtE was very stable, such that no sweep averaging was necessary to obtain the voltammograms. We conclude that SiO2-insulated PtEs are suitable for low-noise FSCV applications to measure exocytotic release of oxidizable transmitter molecules.
PtE versus CFE voltammetry
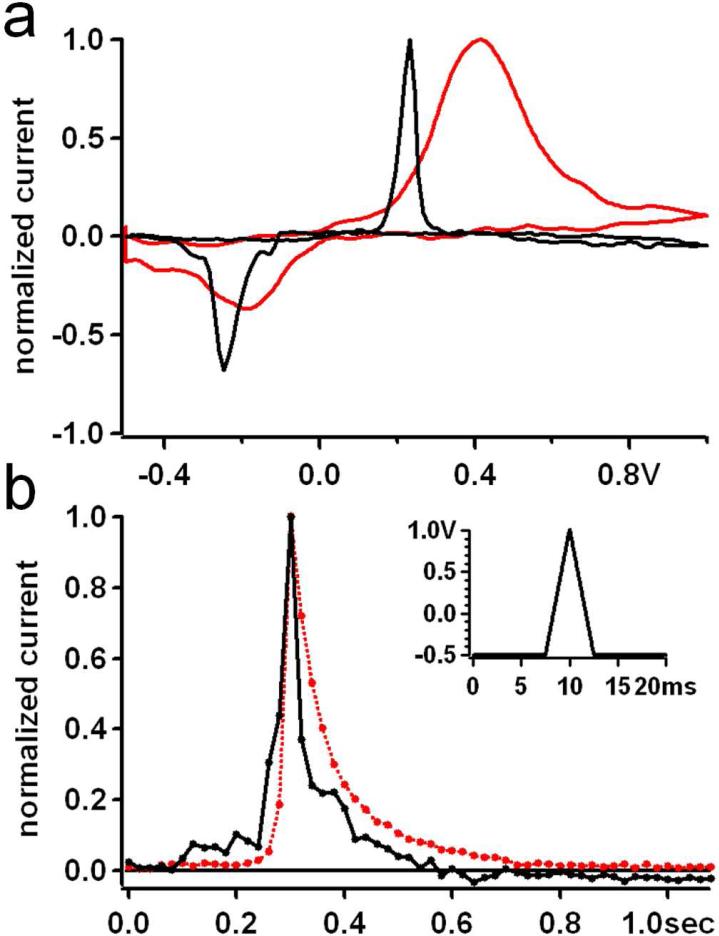
Fig. 7A compares catecholamine voltammograms measured during release from single chromaffin cells with a PtE (black) and a CFE (red) after normalizing to their respective peak oxidation currents. The voltammograms obtained with CFEs are in good agreement with those previously reported 34, 46, with oxidation/reduction peaks at +435 mV and −350 mV respectively.
Figure 7.
(a) Typical cyclic voltammograms normalized to their peak oxidation values, obtained from chromaffin cells using either Pt microelectrodes (black) or CFEs (red). (b) Time course of voltammetric spikes for Pt (black) and CFE (red). Curves are the average of 20 individual spikes measured with 20 ms time resolution using the voltage waveform shown in the inset.
In contrast, the peaks for the Pt voltammogram are shifted to approximately +230 mV and −260 mV for oxidation and reduction respectively. Interestingly, the full width at half maximum (FWHM) of the oxidation peaks of voltammograms obtained with PtEs was ~ 45 mV, which corresponds to the Nernstian limit for a 2-electron transfer reaction 42, indicating very rapid catecholamine oxidation. The FWHM for the CFE oxidation peak was ~ 310 mV, ~7-fold larger than the corresponding value for Pt.
Another interesting characteristic of catecholamine voltammograms is that the reduction peak is usually significantly smaller than the oxidation peak, presumably due to diffusion of the oxidized quinone away from the electrode surface. For the voltammograms of Fig. 7A, the reduction peak measured with PtEs was ~73% of the oxidation peak, while the reduction peak was decreased to ~55% of the oxidation peak for the CFE.
The higher reduction to oxidation ratio suggests stronger adsorption of catecholamines onto PtEs 45 compared to CFEs. To determine if this affects the time course of voltammetric spikes we compared single events measured with CFEs and PtEs. For increased time resolution the resting period of the applied potential waveform was reduced to 15 ms and the ramp speed was increased to ±600 V/s resulting in a voltage waveform of 20 ms total duration and thus a higher temporal resolution for the FSCV measurements (Fig. 7B inset). Using this waveform, single exocytotic events were recorded using PtEs and CFEs. The half widths of voltammetrically measured spikes are determined not only by the granule secretion time course, but also by the diffusion of the catecholamine molecules away from the electrode surface and the low temporal resolution of the measurements (20ms). Fig. 7B shows the average time course of the 20 largest voltammetric spikes recorded with PtEs or CFEs. For this purpose, spikes were normalized to their peak amplitude, aligned in time at the point of their maximum value and averaged. The average time course appears to be slightly faster for PtEs. However, the measured mean half width of voltammetric spikes from chromaffin cells was 56 ± 5 ms (mean ± SEM, n = 59 spikes) for PtEs and 71 ± 11 ms (mean ± SEM, n = 31 spikes) for CFEs was not significantly different (p=0.17). The value obtained with CFEs is in excellent agreement with data reported in the literature 47.
DISCUSSION
The electrode of choice for electrochemical recordings of catecholamine release from single cells has traditionally been the carbon fiber electrode 48. Recently, however, Au was utilized as the working electrode in catecholamine measurements in vitro 49, and recordings of transmitter release from single chromaffin vesicles were performed using Pt working electrodes 28, 29.
Microfabricated PtE arrays 28 can correlate amperometric and fluorescence measurements corresponding to the same single exocytotic event 29. Here, we described an improved design of PtE arrays and their application in FSCV recordings and stimulus-secretion coupling. Insulating the PtE arrays with fused silica (SiO2) instead of photoresist increases the robustness of the devices (compare Fig. 3A & E) allowing cleaning and multiple use, thus reducing electrode fabrication time and cost. Photoresist-insulated PtEs 29 detect single catecholamine release events from chromaffin cells with properties that are indistinguishable form obtained with the “gold standard” carbon fiber electrodes. We show here that amperometric spike parameters from recordings with glass-insulated PtEs are also in good agreement with data obtained using carbon fiber electrodes. PtE arrays worked reliably in amperometry mode even after multiple use and cleaning cycles. PtE arrays could be fabricated reliably. A small fraction that was not fabricated properly (e.g. damaged electrodes, misaligned insulation, cracked connections) could be easily identified by inspection under an optical microscope. Overall we had the impression that reliability of PtE fabrication and functionality for amperometric recordings were similar those of CFEs. For PtEs, however, fabrication failure was more easily identified by visual inspection under an optical microscope. We conclude that these results validate the PtE arrays as reproducible and reliable amperometric sensors for monitoring catecholamine release from single chromaffin granules.
In fast-scan cyclic voltammetry mode, some electrodes did record the time course of release from single vesicles and in this case the time course was again very similar to that recorded by carbon fiber electrodes in this mode. The FWHM of the oxidation peaks of catecholamine voltammograms obtained with PtEs was ~ 45 mV, approaching the Nernstian limit for a 2-electron transfer reaction 42, indicating very rapid catecholamine oxidation. To the best of our knowledge there is no previous report describing the application of Pt microelectrodes for fast-scan cyclic voltammetry measurements of catecholamines.
In contrast to amperometry, during fast-scan cyclic voltammetric detection of catecholamines the PtE arrays exhibited some problems with reliable functionality. The most plausible cause for these problems is adsorption of catecholamines onto the PtE surface 45. So far this could only be reversed when the electrode potential was scanned at a rate of 100mV/s between −500mV and +975mV in the presence of 0.18 M H2SO4. It is thus recommended that FSCV recordings of catecholamines with PtEs should be treated with caution.
In contrast to photoresist 50, the SiO2 insulation is not fluorescent, thus improving sensitive fluorescence measurements. Furthermore, the sensor's low electrical noise, as demonstrated in the present study, makes it suitable for electrochemical monitoring of exocytosis in cell systems that release small numbers of electroactive molecules per vesicle, such as mast cells or dopaminergic neurons. The SiO2 insulation makes it furthermore possible to incorporate surface patterned stimuli for the study of stimulus-secretion coupling. RPM cells can be stimulated by a chemical cue patterned with micrometer spatial resolution 51. Here, we show that this can be combined with secretion measurements using SiO2 insulated PtEs.
PtE arrays may also be used for parallel recording from multiple cells at the single cell level, particularly utilizing newly developed low-noise amplifiers 52 which can be integrated with the PtE arrays. The FSCV experiments indicate that SiO2-insulated Pt microelectrodes exhibit stable background currents and the catecholamine cyclic voltammograms are much sharper than those measured with CFEs. They are thus suitable for analytical electrochemistry in cell cultures and possibly in vivo 53, after fabrication of appropriately shaped Pt microelectrodes 54.
Acknowledgements
We thank D. Sulzer, E. Mosharov, H. Abruna, S. Nad and N. Da Mota for assistance with voltammetry, J. Lenz for excellent technical support, D. Woodie, M. Guillorn, and R. Ilic for assistance with the microfabrications, and R. Molloy for many helpful discussions. We also thank Owasco Meat Co. for providing bovine adrenal glands. We are indebted to R.M. Wightman and K. Gillis for critically reading the manuscript and providing advice on FSCV. Microfabrications were performed at the Cornell NanoScale Facility (a member of the National Nanotechnology Infrastructure Network) which is supported by NSF under Grant ECS-0335765. This work has been supported by NIH grant R01 NS048826 and the Nanobiotechnology Center (An STC program of NSF Agreement No. ECS-9876771).
REFERENCES
- 1.Breckenridge LJ, Almers W. Nature. 1987;328:814–817. doi: 10.1038/328814a0. [DOI] [PubMed] [Google Scholar]
- 2.Lindau M. Quarterly Reviews of Biophysics. 1991;24:75–101. doi: 10.1017/s0033583500003279. [DOI] [PubMed] [Google Scholar]
- 3.Zimmerberg J, Curran M, Cohen FS, Brodwick M. PNAS. 1987;84:1585–1589. doi: 10.1073/pnas.84.6.1585. [DOI] [PMC free article] [PubMed] [Google Scholar]
- 4.Fernandez JM, Neher E, Gomperts BD. Nature. 1984;312:453–455. doi: 10.1038/312453a0. [DOI] [PubMed] [Google Scholar]
- 5.Lollike K, Borregaard N, Lindau M. Journal of Cell Biology. 1995;129:99–104. doi: 10.1083/jcb.129.1.99. [DOI] [PMC free article] [PubMed] [Google Scholar]
- 6.He L, Wu XS, Mohan R, Wu LG. Nature. 2006;444:102–105. doi: 10.1038/nature05250. [DOI] [PubMed] [Google Scholar]
- 7.Han X, Wang CT, Bai J, Chapman ER, Jackson MB. Science. 2004;304:289–292. doi: 10.1126/science.1095801. [DOI] [PubMed] [Google Scholar]
- 8.Debus K, Lindau M. Biophysical Journal. 2000;78:2983–2997. doi: 10.1016/S0006-3495(00)76837-8. [DOI] [PMC free article] [PubMed] [Google Scholar]
- 9.Chow RH, Rüden L. v., Neher E. Nature. 1992;356:60–63. doi: 10.1038/356060a0. [DOI] [PubMed] [Google Scholar]
- 10.Wightman RM. Science. 2006;311:1570–1574. doi: 10.1126/science.1120027. [DOI] [PubMed] [Google Scholar]
- 11.Wightman RM, Jankowski JA, Kennedy RT, Kawagoe DT, Schroeder TJ, Leszczyszyn DJ, Near JA, Diliberto EJ, jr., Viveros OH. Proceedings of the National Academy of Sciences of the United States of America. 1991;88:10754–10758. doi: 10.1073/pnas.88.23.10754. [DOI] [PMC free article] [PubMed] [Google Scholar]
- 12.Dernick G, Alvarez De Toledo G, Lindau M. In: Electrochemical Methods for Neuroscience. Michael AC, Borland LM, editors. CRC Press; Boca Raton, FL: 2006. pp. 315–336. [Google Scholar]
- 13.Dernick G, Gong LW, Tabares L, Alvarez de Toledo G, Lindau M. Nat Methods. 2005;2:699–708. doi: 10.1038/nmeth0905-699. [DOI] [PubMed] [Google Scholar]
- 14.Albillos A, Dernick G, Horstmann H, Almers W, Alvarez de Toledo G, Lindau M. Nature. 1997;389:509–512. doi: 10.1038/39081. [DOI] [PubMed] [Google Scholar]
- 15.Steyer JA, Horstmann H, Almers W. Nature. 1997;388:474–478. doi: 10.1038/41329. [DOI] [PubMed] [Google Scholar]
- 16.Axelrod D. J Biomed Opt. 2001;6:6–13. doi: 10.1117/1.1335689. [DOI] [PubMed] [Google Scholar]
- 17.Allersma MW, Bittner MA, Axelrod D, Holz RW. Mol Biol Cell. 2006;17:2424–2438. doi: 10.1091/mbc.E05-10-0938. [DOI] [PMC free article] [PubMed] [Google Scholar]
- 18.Wang MD, Axelrod D. Dev Dyn. 1994;201:29–40. doi: 10.1002/aja.1002010104. [DOI] [PubMed] [Google Scholar]
- 19.Axelrod D, Thompson NL, Burghardt TP. J Microsc. 1983;129:19–28. doi: 10.1111/j.1365-2818.1983.tb04158.x. [DOI] [PubMed] [Google Scholar]
- 20.Gonon F, Cespuglio R, Ponchon JL, Buda M, Jouvet M, Adams RN, Pujol JF. C R Acad Sci Hebd Seances Acad Sci D. 1978;286:1203–1206. [PubMed] [Google Scholar]
- 21.Jaffe EH, Marty A, Schulte A, Chow RH. J Neurosci. 1998;18:3548–3553. doi: 10.1523/JNEUROSCI.18-10-03548.1998. [DOI] [PMC free article] [PubMed] [Google Scholar]
- 22.Pothos EN, Davila V, Sulzer D. Journal of Neuroscience. 1998;18:4106–4118. doi: 10.1523/JNEUROSCI.18-11-04106.1998. [DOI] [PMC free article] [PubMed] [Google Scholar]
- 23.Staal RG, Mosharov EV, Sulzer D. Nat Neurosci. 2004;7:341–346. doi: 10.1038/nn1205. [DOI] [PubMed] [Google Scholar]
- 24.Pothos E, Desmond M, Sulzer D. Journal of Neurochemistry. 1996;66:629–636. doi: 10.1046/j.1471-4159.1996.66020629.x. [DOI] [PubMed] [Google Scholar]
- 25.Mosharov EV, Sulzer D. Nat Methods. 2005;2:651–658. doi: 10.1038/nmeth782. [DOI] [PubMed] [Google Scholar]
- 26.Colliver TL, Hess EJ, Pothos EN, Sulzer D, Ewing AG. J Neurochem. 2000;74:1086–1097. doi: 10.1046/j.1471-4159.2000.741086.x. [DOI] [PubMed] [Google Scholar]
- 27.An SJ, Almers W. Science. 2004;306:1042–1046. doi: 10.1126/science.1102559. [DOI] [PubMed] [Google Scholar]
- 28.Dias AF, Dernick G, Valero V, Yong MG, James CD, Craighead HG, Lindau M. Nanotechnology. 2002;13:285–289. [Google Scholar]
- 29.Hafez I, Kisler K, Berberian K, Dernick G, Valero V, Yong MG, Craighead HG, Lindau M. Proc Natl Acad Sci U S A. 2005;102:13879–13884. doi: 10.1073/pnas.0504098102. [DOI] [PMC free article] [PubMed] [Google Scholar]
- 30.Sun X, Gillis KD. Anal Chem. 2006;78:2521–2525. doi: 10.1021/ac052037d. [DOI] [PubMed] [Google Scholar]
- 31.Chen X, Gao Y, Hossain M, Gangopadhyay S, Gillis KD. Lab Chip. 2008;8:161–169. doi: 10.1039/b715308m. [DOI] [PMC free article] [PubMed] [Google Scholar]
- 32.Parsons TD, Coorssen JR, Horstmann H, Almers W. Neuron. 1995;15:1085–1096. doi: 10.1016/0896-6273(95)90097-7. [DOI] [PubMed] [Google Scholar]
- 33.Lindau M, Nüße O. FEBS Letters. 1987;222:317–321. doi: 10.1016/0014-5793(87)80393-9. [DOI] [PubMed] [Google Scholar]
- 34.Mosharov EV, Gong LW, Khanna B, Sulzer D, Lindau M. J Neurosci. 2003;23:5835–5845. doi: 10.1523/JNEUROSCI.23-13-05835.2003. [DOI] [PMC free article] [PubMed] [Google Scholar]
- 35.Wightman RM, Schroeder TJ, Finnegan JM, Ciolkowski EL, Pihel K. Biophysical Journal. 1995;68:383–390. doi: 10.1016/S0006-3495(95)80199-2. [DOI] [PMC free article] [PubMed] [Google Scholar]
- 36.Lindau M, Fernandez JM. Nature. 1986;319:150–153. doi: 10.1038/319150a0. [DOI] [PubMed] [Google Scholar]
- 37.Coleman JW, Holgate ST, Church MK, Godfrey RC. Biochem J. 1981;198:615–619. doi: 10.1042/bj1980615. [DOI] [PMC free article] [PubMed] [Google Scholar]
- 38.Ilic B, Craighead HG. Biomedical Microdevices. Vol. 2. 2000. pp. 317–322. [Google Scholar]
- 39.Bruns D, Jahn R. Nature. 1995;377:62–65. doi: 10.1038/377062a0. [DOI] [PubMed] [Google Scholar]
- 40.Wipf DO, Kristensen EW, Deakin MR, Wightman RM. Analytical Chemistry. 1988;60:306–310. [Google Scholar]
- 41.Millar J, O'Connor JJ, Trout SJ, Kruk ZL. J Neurosci Methods. 1992;43:109–118. doi: 10.1016/0165-0270(92)90020-e. [DOI] [PubMed] [Google Scholar]
- 42.Bard AJ, Faulkner LR. Electrochemical methods: fundamentals and applications. Wiley; New York: 1980. [Google Scholar]
- 43.Deakin MR, Kovach PM, Stutts KJ, Wightman RM. Anal Chem. 1986;58:1474–1480. doi: 10.1021/ac00298a046. [DOI] [PubMed] [Google Scholar]
- 44.Heien ML, Phillips PE, Stuber GD, Seipel AT, Wightman RM. Analyst. 2003;128:1413–1419. doi: 10.1039/b307024g. [DOI] [PubMed] [Google Scholar]
- 45.Lee H, Dellatore SM, Miller WM, Messersmith PB. Science. 2007;318:426–430. doi: 10.1126/science.1147241. [DOI] [PMC free article] [PubMed] [Google Scholar]
- 46.Leszczyszyn DJ, Jankowski JA, Viveros OH, Diliberto EJ, jr., Near JA, Wightman RM. J. Biol. Chem. 1990;265:14736–14737. [PubMed] [Google Scholar]
- 47.Pihel K, Schroeder TJ, Wightman RM. Analytical Chemistry. 1994;66:4532–4537. [Google Scholar]
- 48.Buda M, Gonon F, Cespuglio R, Jouvet M, Pujol JF. Eur J Pharmacol. 1981;73:61–68. doi: 10.1016/0014-2999(81)90145-x. [DOI] [PubMed] [Google Scholar]
- 49.Zachek MK, Hermans A, Wightman RM, McCarty GS. Journal of Electroanalytical Chemistry. 2008;614:113–120. doi: 10.1016/j.jelechem.2007.11.007. [DOI] [PMC free article] [PubMed] [Google Scholar]
- 50.Hess. H, Matzke CM, Doot RK, Clemmens J, Bachand GD, Bunker BC, Vogel V. Nano Letters. 2003;3:1651–1655. [Google Scholar]
- 51.Wu M, Holowka D, Craighead HG, Baird B. Proc Natl Acad Sci U S A. 2004;101:13798–13803. doi: 10.1073/pnas.0403835101. [DOI] [PMC free article] [PubMed] [Google Scholar]
- 52.Ayers S, Gillis KD, Lindau M, Minch BA. IEEE Transactions on Circuits and Systems I-Regular Papers. 2007;54:736–744. doi: 10.1109/TCSI.2006.888777. [DOI] [PMC free article] [PubMed] [Google Scholar]
- 53.Garris PA, Christensen JR, Rebec GV, Wightman RM. J Neurochem. 1997;68:152–161. doi: 10.1046/j.1471-4159.1997.68010152.x. [DOI] [PubMed] [Google Scholar]
- 54.Burmeister JJ, Coates TD, Gerhardt GA. Conf Proc IEEE Eng Med Biol Soc. 2004;7:5348–5351. doi: 10.1109/IEMBS.2004.1404493. [DOI] [PubMed] [Google Scholar]


