
Figure 3.
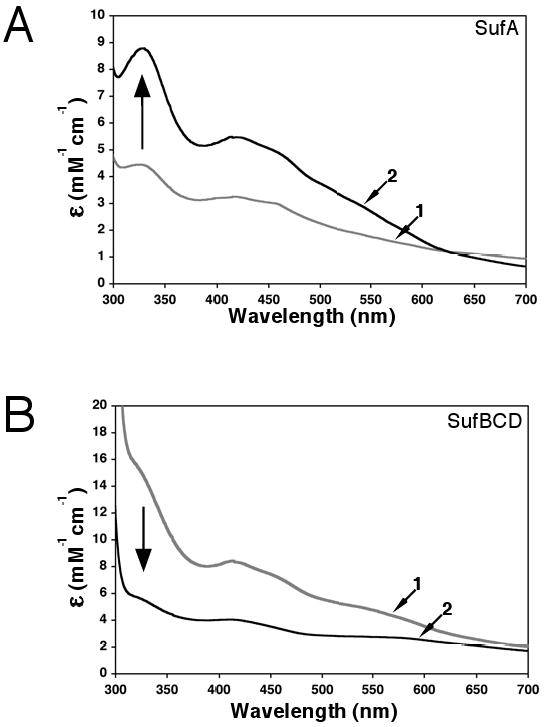
Fe-S cluster reconstitution using the entire Suf pathway. SufA and the SufBCD complex (500 μM each) were incubated anaerobically with 2 μM SufSE, L-cys, and FAS for 1.5 hours. SufA and SufBCD were separated by anaerobic gel filtration and analyzed for Fe-S cluster content. Control reconstitutions using only SufA or SufBCD were carried out under the same conditions. Arrows indicate direction of change for spectra of SufA or SufBCD reconstituted alone compared to spectra from samples reconstituted together. (A) UV-visible absorption spectra of SufA reconstituted alone (trace 1, ε456 =3 mM-1cm-1) or SufA reconstituted with SufBCD (trace 2, ε456 = 4.95 mM-1cm-1) or. (B) UV-visible absorption spectra of SufBCD reconstituted alone (trace 1, ε456 = 7.2 mM-1cm-1) or SufBCD reconstituted with SufA (trace 2, ε456 = 3.4 mM-1cm-1).