

Abstract
The relationship between selenium and cancer is complex because individuals with low serum selenium levels benefit from selenium supplementation, but those with high serum selenium levels are at increased risk for other diseases. This suggests that the use of selenocompounds might be limited to particular circumstances, such as adjuvant therapy. A contributor to this dichotomy may be the activity of certain selenium containing enzymes like the cytosolic thioredoxin reductase (TR1). We evaluated the cellular response to select selenocompounds that have anticancer activity when TR1 was attenuated by siRNA in RKO colon cancer cells. Methylseleninic acid (MSA), which is a substrate for TR1, enhanced cytotoxicity to colon cancer cells when TR1 was attenuated. MSA induced stress in the endoplasmic reticulum, as measured by GRP78 protein levels. However, this pathway did not appear to account for the change in cytotoxicity when TR1 was attenuated. Instead, knockdown of the cytosolic TR plus incubation with MSA increased autophagy, as measured by LC3B cleavage, and apoptosis, as measured by Annexin V and mitochondrial dysfunction. Therefore, the use of selenocompounds with anticancer activity, like MSA, might be utilized most effectively with agents that targets TR1 in chemotherapeutic applications.
Introduction
Historically, selenium levels in forage crops have inversely correlated with mortality from several types of cancer in the United States (Shamberger and Willis, 1971; Clark et al., 1991); however, translating selenium-mediated cancer prevention to the clinical remains a challenge. Indeed, the relationship between selenium supplementation and cancer susceptibility has been the focus of two cancer prevention trials; a smaller scale trial (Nutritional Prevention of Cancer trial, NPC) suggested supplementation reduced cancer mortality as well as certain cancer risk (Clark et al., 1996) while a recent large scale Selenium and Vitamin E Cancer Prevention Trial (SELECT) did not confirm the reduction in prostate cancer risk expected, based on the NPC trial with selenomethionine supplementation (Lippman et al., 2009). Indeed, these supplementation trials suggest that high levels of serum selenium correlate with increased risk of type II diabetes (Stranges et al., 2007), and serum selenium levels have a non-linear relationship with all-cause mortality, reducing mortality when supplemented at low levels but perhaps increasing mortality at the highest selenium levels (Bleys et al., 2008). At a minimum, these studies have raised questions regarding the utility of selenomethionine supplementation as a long term prevention agent. Whether selenomethionine is the most appropriate or efficacious selenocompound for anticancer therapy or preventions is still a matter of debate (Hatfield and Gladyshev, 2009). Therefore, selenium compounds might be better utilized for anti-cancer activity in conjunction with other therapeutics (Hu et al., 2008; Li et al., 2008) rather than long term supplementation for cancer prevention.
In spite of the results in the clinical trials, serum selenium levels continue to be inversely correlated with colon cancer in epidemiology studies (Peters et al., 2006; Marshall, 2008; Peters and Takata, 2008; Connelly-Frost et al., 2009). One potential mechanism of selenium-mediated cancer modulation is its utilization in the synthesis of selenoproteins (Lobanov et al., 2009). The role of certain selenoenzymes, like cytosolic thioredoxin reductase (TR1), is complex as it can display both anticancer and pro-carcinogenesis functions (Hatfield et al., 2009). On the genomic level, a human single nucleotide polymorphism has been identified within the TXNRD1 sequence that reduces the risk of distal colon adenocarcinoma; however, this polymorphism may not only affect the TXNRD1 gene (Peters et al., 2008).
One additional complication is that there may be interactions between selenocompounds and TR1 in anti-cancer activities. Initially, certain selenocompounds were thought to be inhibitors of TR1, but instead, some selenocompounds are substrates of TR1 (Gromer and Gross, 2002; Zhao and Holmgren, 2002; Zhao et al., 2002). Therefore, our aim was to evaluate the TR1 dependence of the cytotoxicity of selenomethionine, 1,4-phenylenebis(methylene)selenocyanate (p-XSC), or methylseleninic acid (MSA) in RKO colon cancer cells where we attenuated the endogenous TR1 with siRNA. These compounds were chosen because they represent distinct selenocompound classes. Selenomethionine is a selenium-containing amino acid that can provide selenium to multiple cellular pools (Suzuki et al., 2006a), p-XSC is an organic selenocompound that reacts with glutathione but does not release selenium to cellular pools (Sohn et al., 2005), and MSA is readily converted to methylselenol, the selenocompound thought to be responsible for selenium-mediated anticancer activity (Ip et al., 2000). Selenomethionine has been used in clinical studies while p-XSC and MSA have displayed promising anticancer activity in preclinical studies. Since MSA is a substrate for reduction to methylselenol by TR1 (Gromer and Gross, 2002), we anticipated that this selenocompound might demonstrate TR1-dependence in its cytotoxic anticancer activities. Indeed, we found that MSA was the only selenocompound of this group that displayed differential activity dependent on TR1 status. In addition, the targeting of TR1 with siRNA plus MSA accelerated autophagy and the pro-apoptotic activity of this selenocompound.
Materials and Methods
Materials
Advanced DMEM, Glutamax, MitoProbe JC-1 Assay Kit, and Hank's balanced salt solution (HBSS) were purchased from Invitrogen (Carlsbad, CA). Fetal bovine serum was purchased from Hyclone (Logan, UT). The RKO cell line was purchased from American Tissue Type Culture Collection (Manassas, VA). CellTiter-Glo Luminescent Cell Viability Assay was purchased from Promega (Madison WI). Selenocompounds used included L-selenomethionine from Acros Organics (Morris Plains, NJ), p-XSC was from LKT Laboratories, Inc (St. Paul, MN) and methylseleninic acid (MSA) was from PharmaSe, Inc. (Lubbock, TX). Antibodies directed at BiP/GRP78 and LC3B were purchased from Becton Dickinson and Company (Franklin Lakes, NJ) and Sigma-Aldrich (St. Louis, MO), respectively. TR1 polycolonal antibodies and secondary, donkey polyclonal anti-mouse and anti-rabbit antibodies conjugated with horseradish peroxidase, were purchased from Santa Cruz Biotechnology (Santa Cruz, CA). Western Lighting chemiluminescence reagents were from PerkinElmer Life Sciences (Boston, MA). Dithiothreitol and 3-methyladenine are purchased from Sigma-Aldrich.
Cell culture
RKO colon cancer cells were used as a representative colon cell line and were maintained in Advanced DMEM supplemented with 1% Glutamax and 2% fetal bovine serum. Advanced DMEM is a medium with a low serum requirement that is supplemented with 5 μg/l sodium selenite, and the serum used contained 37 ng/ml selenium, resulting in a selenium media containing ∼37 nM selenium. This selenium content is similar to standard media supplemented with 10% serum, and the selenite content alone is sufficient to support maximal glutathione peroxidase 1 activity (a measure of selenoenzyme synthesis), and is ∼10× above the levels of selenium required to abrogate selenium-deficient cell death (Leist et al., 1996; Baker et al., 1998; Saito et al., 2003). RKO cells were used in this study since serum selenium levels and colon cancer have been previously linked and the knockdown of thioredoxin reductase 1 was accomplished with siRNA as previously described in this same cell line (Cassidy et al., 2006).
ATP content analysis
Cellular viability was determined using the CellTiter-Glo Luminescent Cell Viability assay which measures ATP content in cells (Crouch et al., 1993). ATP-dependent luciferase activity was measured using a Perkin-Elmer VictorV3 Multimode Microplate Reader.
Cytometric Assay for Free Thiols
Cells were seeded into 6-well plates at a density of ∼ 2 × 10⁵ cells/well and allowed to grow overnight. Culture medium was refreshed at the time of treatment. Cells were trypsinized, centrifuged at 250×g for 5 minutes, and resuspended in 1 ml phosphate buffered saline (PBS). Cells were then centrifuged at 250×g for 5 minutes and resuspended in a fresh 1 ml of 1× PBS. 40 μM monobromobimane (mBBr) was added and samples were incubated at room temperature in the dark for 5 minutes. mBBr fluorescence concentration was then determined. Cellular fluorescence concentrations were determined 24 hrs after treatment using a Beckman Cell Lab Quanta SC flow cytometer by dividing the fluorescence for each cell by its measured electronic volume. For each assay, a minimum of 10,000 events per sample were recorded.
Immunochemical analysis
Cells in 6-well plates were placed on ice. Media was aspirated and cells were then washed with 1ml of cold 1× PBS, the PBS aspirated, and protein lysates were prepared as previously described (Cassidy et al., 2006). Protein concentrations were determined using Bradford reagents. Absorbance at 595 nm was measured using a Perkin-Elmer VictorV3. Proteins were separated by NuPAGE 10% or 4-12% Bis-Tris gels, and transferred to a polyvinyl difluoride membrane. Membranes were blocked with 5% nonfat dry milk in TBS-T and then probed for TR1 (1:300), BiP/GRP78 (1:1000) or GAPDH (1:500) with specific antibodies. Peroxidase conjugated secondary antibodies (1:5000) were used in conjunction with chemiluminescence detection to evaluate protein expression. Protein was detected using Western Lightning Western Blot Chemiluminescence reagent, visualized, and quantified using a Kodak Image Station 440.
Apoptotic assays
Two cytometric assays were used to evaluate markers of apoptosis and mitochondrial status using a CellLab Quanta SC flow cytometer.
Mitochondrial potential evaluation
Mitochondrial potential was measured using the MitoProbe JC-1 Assay Kit where 1 μM JC-1 was added to medium of cells attached to 6-well plates after MSA treatment. Cells were incubated at 37°C with 5% CO2 and 95% air for 30 minutes and then trypsinized, washed and resuspended in HBSS. JC-1 fluorescence at 525 nm (JC-1 “green”) and 575 nm (JC-1 “red” or “J-aggregates”) was determined for each sample. JC-1 fluoresces green when the mitochondrial potential has been depolarized and forms aggregates that fluoresce red when the mitochondrion is polarized (Salvioli et al., 1997). Carbonyl cyanide 3-chlorophenylhydrazone (CCCP) was used at 25 μM to disrupt the mitochondrial membrane potential as a control. Cellular fluorescence was determined 24 hrs after treatment by flow cytometry and for each sample, a minimum of 10,000 events per sample was recorded.
Annexin V/PI staining
The Vybrant Apoptotic Assay Kit #2 was used in a dual color cytometric assay to evaluate Annexin V as an early marker of cell death along with PI exclusion using a CellLab Quanta SC flow cytometer. Cells were trypsinized, washed, and resuspended in 100 μl annexin-binding buffer, 5 μl Alexa-488 conjugated Annexin V and 1 μl of 100 μg/ml PI was for a 15 min incubation, and then the cells were diluted to 500 μl prior to cytometric evaluation. Cellular fluorescence was determined following 16 or 24 hrs of MSA exposure and a minimum of 20,000 events per sample was recorded. The percentage of the cells that were not stained, representing viable cells; Annexin V positive, representing early apoptotic cells; and Annexin V plus PI double positive, representing late apoptotic cells, were quantified by flow cytometry.
Statistical Analysis
GraphPad Instat, version 3.06, was used to evaluate the statistical significance of the results. Statistical significance was determined by one-way ANOVA with Bonferroni multiple comparison post hoc tests and differences were considered significant for p<0.05.
Results
The role of TR1 in the cytotoxic response of these selenocompounds was examined in RKO cells with endogenous levels of TR1 or with TR1 knocked-down by siRNA. We evaluated the cytotoxic response following a 24 hr incubation of SEM, p-XSC, and MSA by measuring cellular ATP content (figure 1). The attenuation of TR1 did not markedly alter SEM- and p-XSC-mediated responses. SEM was only minimally toxic within 24 hr over the highest concentration range used (figure 1A), while p-XSC's toxicity was independent of TR1-status (figure 1B). However, the toxicity of MSA was TR1-dependent (figure 1C). Cells with reduced TR1 levels due to siRNA treatment displayed a significant reduction in ATP levels at MSA concentrations of ∼5 μM. The effect on TR1 protein expression following selenocompound incubation was evaluated when the cells had ∼80% of ATP content of the control. The level of TR1 protein was evaluated by immunochemical analysis as shown in figure 1D. The TR1 protein remaining, following the knockdown of TR1 compared to the scrambled siRNA control, was 8 ± 4%. In cells treated with SEM, the remaining TR1 protein following knockdown was 26 ± 7% compared to the control siRNA. In cells treated with p-XSC the remaining TR1 protein following knockdown was 25 ± 5% compared to the control siRNA. In the cells treated with MSA, the remaining TR1 protein following knockdown was 11 ± 4% compared to the control siRNA.
Figure 1.
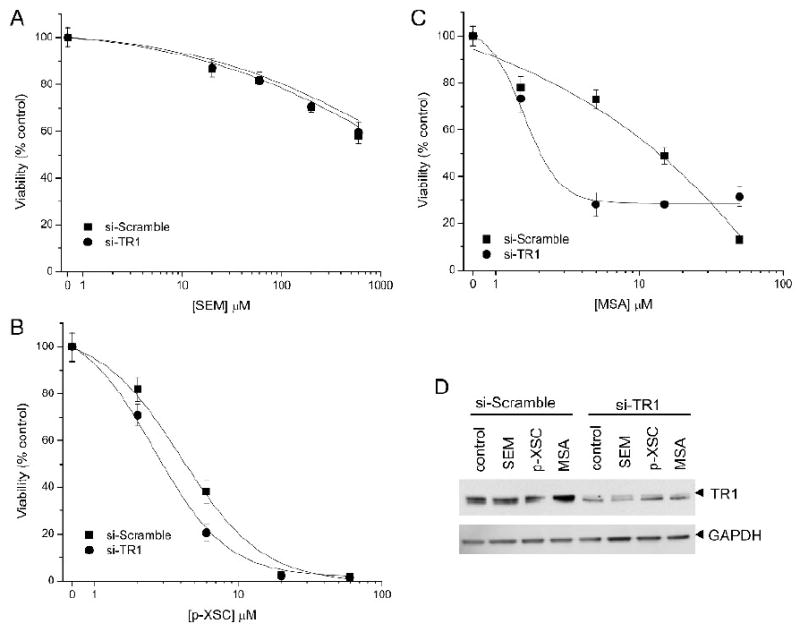
Cell viability as measured by ATP content of RKO cells treated with siRNA directed at TR1 (si-TR1, filled circle) or a control siRNA (si-Scramble, filled square) and then incubated with increasing doses of A) SEM, B) p-XSC, and C) MSA. (D) Immunochemical analysis of TR1 protein levels in cells incubated with 60 μM SEM, 2 μM p-XSC, or 1.5 μM MSA.
To determine if the mechanism of enhanced cytotoxicity following MSA treatment in RKO cells with reduced TR1 was related to endoplasmic reticulum (ER) stress (Wu et al., 2005; Zu et al., 2006), ER chaperonins and cellular thiol status were evaluated and compared to cells treated with the known ER disrupter dithiothreitol (DTT). The rationale for using DTT as a positive control was from studies where DTT was shown to produce an ER stress response (Thomas et al., 2007). It has also been demonstrated in yeast that DTT-mediated cytotoxicity is dependent on the thioredoxin system (Trotter and Grant, 2002). The protein expression of BiP/GRP78, a marker of ER stress, was increased significantly (p<0.003) when cells were incubated with MSA and DTT. MSA at either 15 or 25 μM increased Bip/GRP78 expression by ∼80% over the control (p<0.01). No significant differences were observed between the doses of 15 and 25 μM MSA. DTT increased Bip/GRP78 expression by ∼60% over the control (p<0.05). The difference between MSA and DTT treatment was not found to be statistically significant. Examples of the immunoblot data are displayed in figure 2A. Since we have previously demonstrated that MSA alters free thiol status in other cancer cell lines as measured by monobromobimane (mBBr) fluorescence (Poerschke et al., 2008), we compared cells with endogenous TR1 or those where TR1 was attenuated, due to siRNA knockdown, to cell populations also treated with MSA. TR1 knockdown decreased cellular free thiols as measured by mBBr fluorescence however MSA increased mBBr fluorescence to comparable levels, regardless of TR1 status (figure 2B). Incubation of the RKO cells with DTT at concentrations that demonstrate ER stress showed a similar increase in mBBr fluorescence to that observed in MSA-treated RKO cells (figure 2C). However, when we evaluated cellular ATP content following TR1-knockdown, we observed no significant difference in viability that was dependent on TR1 status (figure 2D). Therefore, it appears that the enhanced cytotoxicity observed following MSA treatment of TR1-knockdown cells was due to other factors besides enhanced ER stress.
Figure 2.
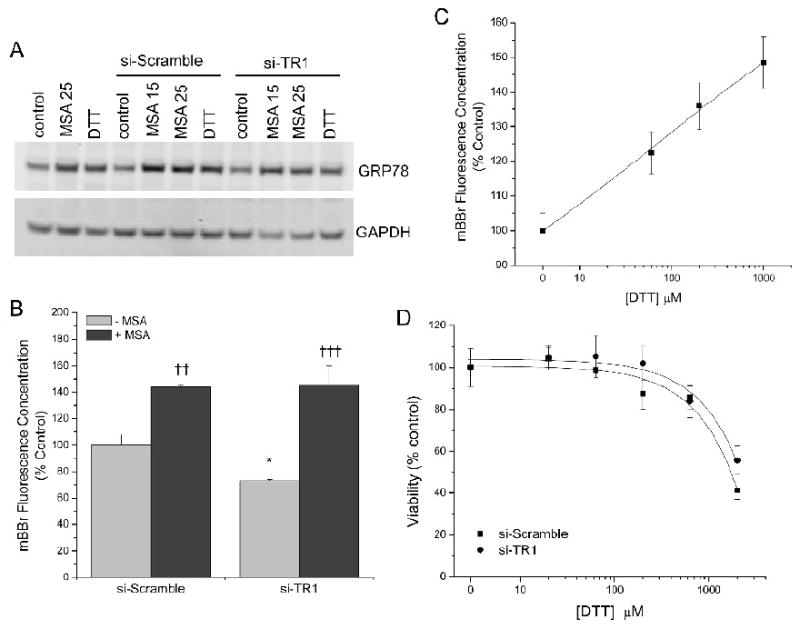
Evaluation of ER stress and cellular free thiol status following treatment of RKO cells with MSA or DTT along with TR1 attenuation via siRNA. (A) Immunochemical analysis of the ER chaperone BiP/GRP78 following DTT or MSA incubation. (B) mBBr evaluation of cellular free thiols following 15 μM MSA treated RKO cells. Cells with attenuated TR1 display decreased free thiols compared to the control si-Scramble (*, p<0.05). When cells are incubated with MSA, significant increases mBBr fluorescence were observed compared to the samples without MSA incubation (††, p<0.01; †††, p<0.001). (C) DTT treatments result in similar levels of free thiols as measured by mBBr. (D) Cell viability as measured by ATP content of RKO cells treated with siRNA directed at TR1 (si-TR1, filled circle) or a control siRNA (si-Scramble, filled square) and incubated with increasing amounts of DTT.
Cells treated with si-TR1 and MSA seemed to round or appear smaller, so we measured the autophagic response. Since autophagy is a mechanism activated in many stress situations, we evaluated the cleavage of the LC3B protein as a robust biochemical marker of this process, and there was a clear increase in the LC3B protein cleavage product, LC3B II, in cells with reduced TR1 and treated with MSA compared to treatments with MSA or the siRNA alone (figure 3A). The compound 3-methyladenine is commonly used to inhibit autophagy (Seglen and Gordon, 1982). We measured the dose-dependent cytotoxicity of 3-methyladenine in RKO cells and found that 1 mM was the highest dose we could use with minimal toxicity (∼80% viable as measured by ATP content). This dose was insufficient to inhibit LC3B cleavage or alter cell viability when the cells were treated with MSA and TR1-knockdown (data not shown). However, the observed increase in autophagy appears distinct from the ER stress as DTT does not promote LC3B cleavage (figure 3B), and therefore, this process may contribute to the enhanced cytotoxicity we have observed with MSA and TR1 attenuation.
Figure 3.
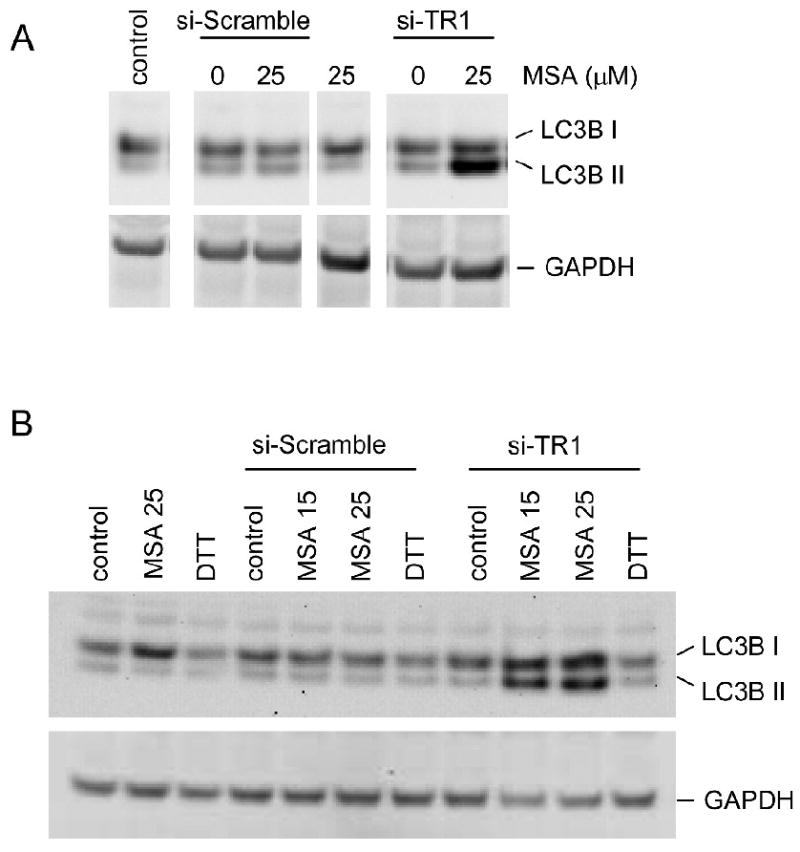
Biochemical assessment of autophagic response to MSA and TR1 knockdown. (A) Immunochemical analysis of LC3B demonstrates increased cleavage to the LC3B II form with the MSA treatment and TR1 knockdown compared to the control siRNA condition. (B) Increased LC3B cleavage is observed in TR1 knockdown cells treated with MSA but not DTT.
Since our measure of cellular viability was ATP production, we next examined the mitochondrial membrane potential as a common marker of apoptosis in the primary organelle that generates ATP. Cytometric evaluation of JC-1 stained cells show that TR1-knockdown and MSA treatment resulted in mitochondrial dysfunction, as measured by a decrease in mitochondrial potential, but that either MSA treatment or TR1-knockdown alone did not alter the mitochondrial potential (figure 4). Since mitochondrial dysfunction can be a consequence of autophagy or apoptosis, we next determined that the TR1-knockdown also promotes apoptosis. We examined the Annexin V and PI double staining as a measure of apoptosis progression. Annexin V positivity is a marker of early apoptosis when PI is excluded, but both stain late apoptotic cells. Therefore, we measured the population of cells that were positive for Annexin V conjugated to Alexa-488 and PI at 16 and 24 hrs after treating with 15 μM MSA (a representative dataset is shown in figure 5, and triplicate datasets are combined in table 1). There were low levels of Annexin V staining in the MSA and siRNA control samples but there was an increase in Annexin V positive and increasing double positive cells over time (figure 5E & F) that show statistically significant changes with MSA concentration and time (table 1).
Figure 4.
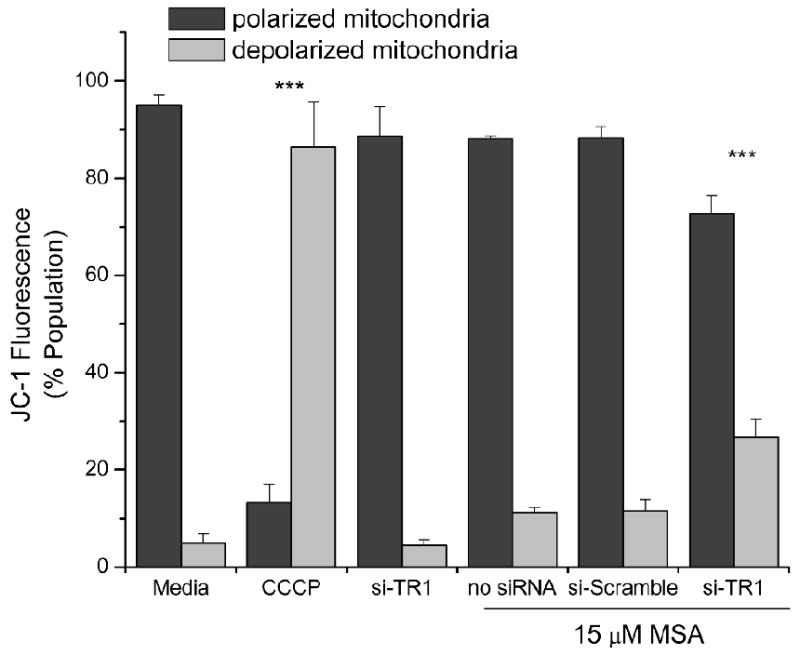
Mitochondrial dysfunction as a measure of apoptosis. Cytometric analysis of RKO cells incubated with MSA (15 μM) and TR1 knockdown using the mitochondrial fluorophore JC-1 to cytometrically measure the mitochondrial membrane potential. CCCP (25 μM), a recognized mitochondrial membrane potential disrupter, was utilized as a control. Bars represent the percentage of the cellular population with polarized mitochondria as indicated by red fluorescence (JC-1 red, 525 nm) or depolarized mitochondria as indicated by green fluorescence (JC-1 green, 575 nm) with standard deviations. An ANOVA indicated significance (p<0.0001) and the CCCP and si-TR1 MSA treated samples were significantly different from the other samples (***, p<0.001).
Figure 5.
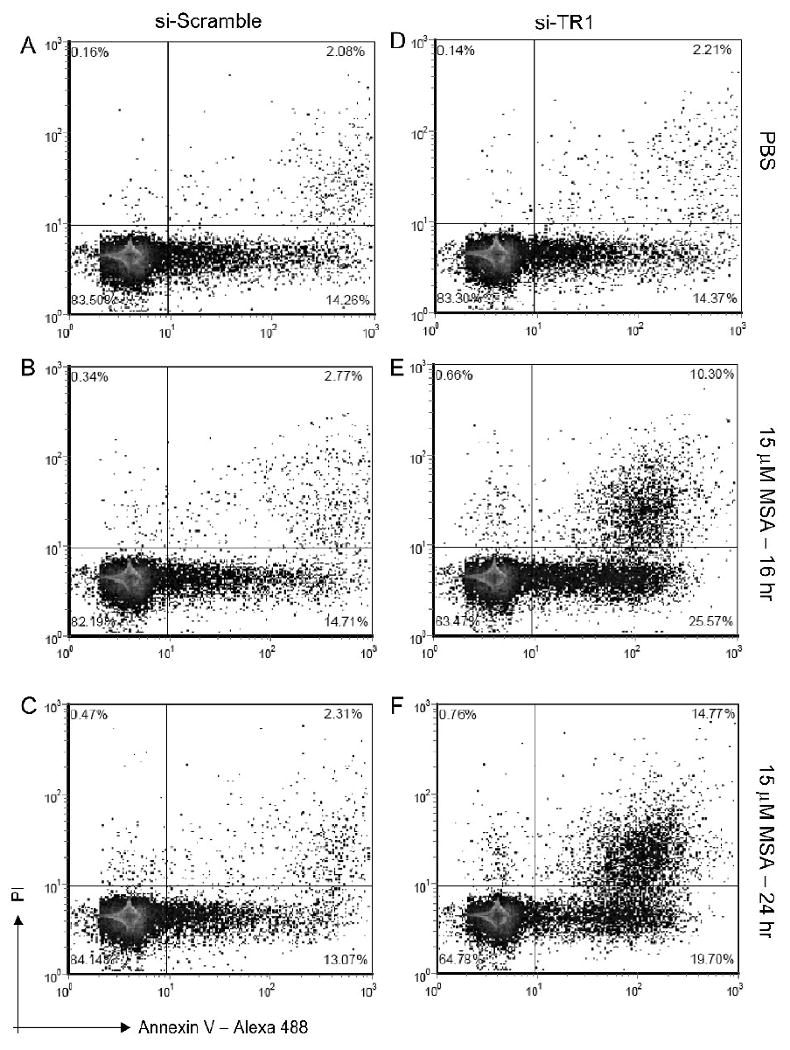
Annexin V and PI cytometric analysis as a measure of apoptosis. Panels A-C and D-F display control, and MSA treated cells for 16 and 24 hrs, for cells with endogenous TR1 and with TR1 knockdown, respectively. The lower left quadrant displays the percentage of cells that are intact (PI negative) and Annexin V negative. The lower right quadrant displays the cells that are Annexin V positive, or are undergoing early phases of apoptosis. The upper right quadrant displays cells that are both positive for PI and Annexin V and represents late apoptotic cells.
Table 1. Apoptosis Measured by Annexin V and PI Staining.
| si-Scramble | si-TR1 | ||
|---|---|---|---|
| PBS | Intact Cells | 84±4.8% | 86±5.4% |
| Early Apoptotic | 14±3.6% | 12±4.7% | |
| Late Apoptotic | 2.1±1% | 2.4±1.1% | |
| 16 hr, 15 μM MSA | Intact Cells | 82±8.9% | 67±3.3% |
| Early Apoptotic | 15±8.3% | 23±3% | |
| Late Apoptotic | 2.7±0.9% | 9.3±1% | |
| 16 hr, 25 μM MSA | Intact Cells | 81±4.5% | 56±3% ** |
| Early Apoptotic | 16±4% | 29±3.5% | |
| Late Apoptotic | 3.2±1% | 15±1% *** | |
| 24 hr, 15 μM MSA | Intact Cells | 85±3.4% | 60±11% ** |
| Early Apoptotic | 12±3.6% | 25±8% | |
| Late Apoptotic | 2.2±1% | 15±3.4% *** | |
| 24 hr, 25 μM MSA | Intact Cells | 81±3.3% | 36±8.8% *** |
| Early Apoptotic | 15±6.3% | 34±3% ** | |
| Late Apoptotic | 4.3±3% | 29±6.4% *** | |
Values represent percent of the population that represent intact cells (Annexin V and PI negative), early apoptotic (Annexin V positive), or late apoptotic (Annexin V and PI positive). An ANOVA suggested a significant change (p<0.0001) in the cellular populations and Bonferroni multiple comparisons tests indicate that statistically significant changes from the vehicle control samples in the Annexin V positive and double positive populations occur in the si-TR1, 16 hr, 25 μM MSA (**, p<0.01) as well as in the si-TR1, 24 hr, 15 and 25 MSA treatment samples (**, p<0.01, and ***, p<0.001, respectively).
Discussion
Several selenocompounds have demonstrated anticancer activity in preclinical experiments. In particular, MSA and p-XSC induce cell cycle arrest and apoptosis (Ip et al., 2002; Swede et al., 2003; El-Bayoumy et al., 2006). However, the interaction of selenocompounds and selenoproteins in cell growth and apoptotic related activities is less clear. Some selenocompounds likely contribute to selenoprotein expression. For example, TR protein expression and activity has been demonstrated to be dependent on selenium availability (Berggren et al., 1997; Gallegos et al., 1997; Berggren et al., 1999). However, the selenium available for selenoprotein synthesis is dependent on the metabolism of the particular selenocompounds (Suzuki et al., 2006a; Suzuki et al., 2006b; Suzuki et al., 2006c; Suzuki et al., 2006d). Small molecule selenocompounds have been hypothesized to be required for the anti-cancer activities of selenium (Ip et al., 2000), and therefore, the requirement for selenoproteins has been questioned. Experimental systems have been generated that can address these concerns more directly. For example, in mice with disrupted selenocysteine tRNA have reduced selenoprotein synthesis, but increased colon cancer susceptibility following induction with the carcinogen, azoxymethane, as measured by increased tumor incidence and pre-malignant lesions compared to wild-type mice (Irons et al., 2006). However, selenium supplementation resulted in accumulation of non-proteinacious selenium and protection in both groups of mice. Therefore, the authors interpreted these results as indicating that both selenoproteins and low molecular weight selenocompounds protect against cancer. In another study, bigenic mice were engineered to be selenoprotein deficient, again due to disruption of the selenocysteine tRNA, but also contained targeted expression of SV40 tumor antigens to promote the development of prostate cancer. These mice were maintained on selenium sufficient diets but the mice without selenoprotein synthesis demonstrated accelerated lesion development with enhanced disease progression compared to transgenic mice with only the SV40 tumor antigens (Diwadkar-Navsariwala et al., 2006). Therefore, these studies strongly support the hypothesis that selenoproteins, and not just small molecule selenocompounds, have roles in the cancer prevention activities of selenium. However, TR1 may be unique among selenoproteins in that attenuation of TR1 expression also mitigates tumor phenotypes in transformed cells (Yoo et al., 2006; Yoo et al., 2007).
MSA functions by increasing stress to the ER and activating the unfolded protein response (Wu et al., 2005; Zu et al., 2006). Moreover, the TR-Trx system was required to protect against reductive stress (i.e. by treatment of these cells with DTT) mediated through the ER in yeast (Trotter and Grant, 2002), so we anticipated that without TR1, we may have even a more dramatic ER stress following incubation with MSA. However, functional differences may exist between the mammalian and yeast thioredoxin system. Indeed, the yeast TR is not a selenoprotein but it nevertheless provides many of the same reducing functions within the yeast cell. Still, we observed increased free thiols with cells treated with MSA, and we observed increases in expression of the ER chaperon protein, BiP/GRP78, which we interpret as consistent with ER stress (figure 2). However, MSA certainly has a broader spectrum of activity than simply inducing ER stress since DTT gave comparable results but in the context of the TR1 knocked-down, MSA displays enhanced cytotoxicity while DTT does not.
The autophagic response observed with MSA appears to be novel for an organoselenocompound; however, autophagy has been associated with inorganic selenium-mediated cell death (Kim et al., 2007; Kim and Choi, 2008). Autophagy is generally associated with promoting survival by recycling cellular components under nutrient limiting conditions (Levine and Kroemer, 2008), and can have a pro-survival activity in cancer. However, the same ability to remove damaged cellular components may mitigate tumor promotion (White and DiPaola, 2009). Therefore, the autophagic response to MSA and TR1 knockdown is suggestive of increased metabolic stress, but may not be the proximal mechanism of the enhanced cytotoxicity.
Perhaps the best use for selenocompounds in cancer prevention and treatment could be their utilization during cancer therapy along with other anticancer agents. Even selenomethionine, which has not demonstrated efficacy in the SELECT clinical studies, has demonstrated enhancement of cell killing when lung cancer cell lines, but not normal lung cancer cells, were subject to ionizing radiation (Shin et al., 2007). Selenomethionine may not be the most appropriate selenocompounds for cancer prevention or neoadjuvant therapy since it can be incorporated in cellular proteins in the place of methionine rather than generate functional small molecule selenocompounds (Reid et al., 2002) and we did not observe any alterations in cytotoxicity when TR1 was knocked-down. However, MSA has demonstrated improved efficacy of conventional therapeutics in model systems (Hu et al., 2008; Li et al., 2008) and we clearly observe multiple activities when TR1 is targeted simultaneously.
In this study, we demonstrate that MSA displays increased cytotoxicity when TR1 levels are reduced using siRNA. Our data confirm that MSA induces ER stress; however, ER stress by DTT did not result in cell death when TR1 was knocked-down. The combination of MSA and the TR1 knockdown generate additional cellular stress as demonstrated by LC3B cleavage as a biochemical marker of autophagy that was not observed by either treatment alone within the time frame of the experiment. In addition, the knockdown of TR1 and treatment MSA promoted apoptosis. In sum, these data suggest that MSA might be particularly effective in cancer therapeutics in combination with agents that target TR1.
Acknowledgments
This project was supported by a USPHS Grants CA115616 (PJM) We also acknowledge the use of core facilities supported by P30 CA042014 awarded to the Huntsman Cancer Institute.
Footnotes
Publisher's Disclaimer: This is a PDF file of an unedited manuscript that has been accepted for publication. As a service to our customers we are providing this early version of the manuscript. The manuscript will undergo copyediting, typesetting, and review of the resulting proof before it is published in its final citable form. Please note that during the production process errors may be discovered which could affect the content, and all legal disclaimers that apply to the journal pertain.
References
- Baker RD, Jr, Baker SS, Rao R. Selenium deficiency in tissue culture: implications for oxidative metabolism. J Pediatr Gastroenterol Nutr. 1998;27:387–392. doi: 10.1097/00005176-199810000-00003. [DOI] [PubMed] [Google Scholar]
- Berggren M, Gallegos A, Gasdaska J, Powis G. Cellular thioredoxin reductase activity is regulated by selenium. Anticancer Res. 1997;17:3377–3380. [PubMed] [Google Scholar]
- Berggren MM, Mangin JF, Gasdaka JR, Powis G. Effect of selenium on rat thioredoxin reductase activity: increase by supranutritional selenium and decrease by selenium deficiency. Biochem Pharmacol. 1999;57:187–193. doi: 10.1016/s0006-2952(98)00283-4. [DOI] [PubMed] [Google Scholar]
- Bleys J, Navas-Acien A, Guallar E. Serum selenium levels and all-cause, cancer, and cardiovascular mortality among US adults. Arch Intern Med. 2008;168:404–410. doi: 10.1001/archinternmed.2007.74. [DOI] [PubMed] [Google Scholar]
- Cassidy PB, Edes K, Nelson CC, Parsawar K, Fitzpatrick FA, Moos PJ. Thioredoxin reductase is required for the inactivation of tumor suppressor p53 and for apoptosis induced by endogenous electrophiles. Carcinogenesis. 2006;27:2538–2549. doi: 10.1093/carcin/bgl111. [DOI] [PubMed] [Google Scholar]
- Clark LC, Cantor KP, Allaway WH. Selenium in forage crops and cancer mortality in U.S. counties. Arch Environ Health. 1991;46:37–42. doi: 10.1080/00039896.1991.9937427. [DOI] [PubMed] [Google Scholar]
- Clark LC, Combs GF, Jr, Turnbull BW, Slate EH, Chalker DK, Chow J, Davis LS, Glover RA, Graham GF, Gross EG, Krongrad A, Lesher JL, Jr, Park HK, Sanders BB, Jr, Smith CL, Taylor JR. Effects of selenium supplementation for cancer prevention in patients with carcinoma of the skin. A randomized controlled trial. Nutritional Prevention of Cancer Study Group. Jama. 1996;276:1957–1963. [PubMed] [Google Scholar]
- Connelly-Frost A, Poole C, Satia JA, Kupper LL, Millikan RC, Sandler RS. Selenium, folate, and colon cancer. Nutr Cancer. 2009;61:165–178. doi: 10.1080/01635580802404188. [DOI] [PMC free article] [PubMed] [Google Scholar]
- Crouch SP, Kozlowski R, Slater KJ, Fletcher J. The use of ATP bioluminescence as a measure of cell proliferation and cytotoxicity. J Immunol Methods. 1993;160:81–88. doi: 10.1016/0022-1759(93)90011-u. [DOI] [PubMed] [Google Scholar]
- Diwadkar-Navsariwala V, Prins GS, Swanson SM, Birch LA, Ray VH, Hedayat S, Lantvit DL, Diamond AM. Selenoprotein deficiency accelerates prostate carcinogenesis in a transgenic model. Proc Natl Acad Sci U S A. 2006;103:8179–8184. doi: 10.1073/pnas.0508218103. [DOI] [PMC free article] [PubMed] [Google Scholar]
- El-Bayoumy K, Das A, Narayanan B, Narayanan N, Fiala ES, Desai D, Rao CV, Amin S, Sinha R. Molecular targets of the chemopreventive agent 1,4-phenylenebis (methylene)-selenocyanate in human non-small cell lung cancer. Carcinogenesis. 2006;27:1369–1376. doi: 10.1093/carcin/bgi328. [DOI] [PubMed] [Google Scholar]
- Gallegos A, Berggren M, Gasdaska JR, Powis G. Mechanisms of the regulation of thioredoxin reductase activity in cancer cells by the chemopreventive agent selenium. Cancer Res. 1997;57:4965–4970. [PubMed] [Google Scholar]
- Gromer S, Gross JH. Methylseleninate is a substrate rather than an inhibitor of mammalian thioredoxin reductase. Implications for the antitumor effects of selenium. J Biol Chem. 2002;277:9701–9706. doi: 10.1074/jbc.M109234200. [DOI] [PubMed] [Google Scholar]
- Hatfield DL, Gladyshev VN. The Outcome of Selenium and Vitamin E Cancer Prevention Trial (SELECT) reveals the need for better understanding of selenium biology. Mol Interv. 2009;9:18–21. doi: 10.1124/mi.9.1.6. [DOI] [PMC free article] [PubMed] [Google Scholar]
- Hatfield DL, Yoo MH, Carlson BA, Gladyshev VN. Selenoproteins that function in cancer prevention and promotion. Biochim Biophys Acta. 2009 doi: 10.1016/j.bbagen.2009.03.001. [DOI] [PMC free article] [PubMed] [Google Scholar]
- Hu H, Li GX, Wang L, Watts J, Combs GF, Jr, Lu J. Methylseleninic acid enhances taxane drug efficacy against human prostate cancer and down-regulates antiapoptotic proteins Bcl-XL and survivin. Clin Cancer Res. 2008;14:1150–1158. doi: 10.1158/1078-0432.CCR-07-4037. [DOI] [PubMed] [Google Scholar]
- Ip C, Dong Y, Ganther HE. New concepts in selenium chemoprevention. Cancer Metastasis Rev. 2002;21:281–289. doi: 10.1023/a:1021263027659. [DOI] [PubMed] [Google Scholar]
- Ip C, Thompson HJ, Zhu Z, Ganther HE. In vitro and in vivo studies of methylseleninic acid: evidence that a monomethylated selenium metabolite is critical for cancer chemoprevention. Cancer Res. 2000;60:2882–2886. [PubMed] [Google Scholar]
- Irons R, Carlson BA, Hatfield DL, Davis CD. Both selenoproteins and low molecular weight selenocompounds reduce colon cancer risk in mice with genetically impaired selenoprotein expression. J Nutr. 2006;136:1311–1317. doi: 10.1093/jn/136.5.1311. [DOI] [PubMed] [Google Scholar]
- Leist M, Raab B, Maurer S, Rosick U, Brigelius-Flohe R. Conventional cell culture media do not adequately supply cells with antioxidants and thus facilitate peroxide-induced genotoxicity. Free Radic Biol Med. 1996;21:297–306. doi: 10.1016/0891-5849(96)00045-7. [DOI] [PubMed] [Google Scholar]
- Levine B, Kroemer G. Autophagy in the pathogenesis of disease. Cell. 2008;132:27–42. doi: 10.1016/j.cell.2007.12.018. [DOI] [PMC free article] [PubMed] [Google Scholar]
- Li GX, Lee HJ, Wang Z, Hu H, Liao JD, Watts J, Combs GF, Jr, Lu J. Superior in vivo inhibitory efficacy of methylseleninic acid against human prostate cancer over selenomethionine or selenite. Carcinogenesis. 2008 doi: 10.1093/carcin/bgn007. [DOI] [PMC free article] [PubMed] [Google Scholar]
- Lippman SM, Klein EA, Goodman PJ, Lucia MS, Thompson IM, Ford LG, Parnes HL, Minasian LM, Gaziano JM, Hartline JA, Parsons JK, Bearden JD, 3rd, Crawford ED, Goodman GE, Claudio J, Winquist E, Cook ED, Karp DD, Walther P, Lieber MM, Kristal AR, Darke AK, Arnold KB, Ganz PA, Santella RM, Albanes D, Taylor PR, Probstfield JL, Jagpal TJ, Crowley JJ, Meyskens FL, Jr, Baker LH, Coltman CA., Jr Effect of selenium and vitamin E on risk of prostate cancer and other cancers: the Selenium and Vitamin E Cancer Prevention Trial (SELECT) Jama. 2009;301:39–51. doi: 10.1001/jama.2008.864. [DOI] [PMC free article] [PubMed] [Google Scholar]
- Lobanov AV, Hatfield DL, Gladyshev VN. Eukaryotic Selenoproteins and Selenoproteomes. Biochim Biophys Acta. 2009 doi: 10.1016/j.bbagen.2009.05.014. [DOI] [PMC free article] [PubMed] [Google Scholar]
- Marshall JR. Prevention of colorectal cancer: diet, chemoprevention, and lifestyle. Gastroenterol Clin North Am. 2008;37:73–82. vi. doi: 10.1016/j.gtc.2007.12.008. [DOI] [PMC free article] [PubMed] [Google Scholar]
- Peters U, Chatterjee N, Church TR, Mayo C, Sturup S, Foster CB, Schatzkin A, Hayes RB. High serum selenium and reduced risk of advanced colorectal adenoma in a colorectal cancer early detection program. Cancer Epidemiol Biomarkers Prev. 2006;15:315–320. doi: 10.1158/1055-9965.EPI-05-0471. [DOI] [PubMed] [Google Scholar]
- Peters U, Chatterjee N, Hayes RB, Schoen RE, Wang Y, Chanock SJ, Foster CB. Variation in the selenoenzyme genes and risk of advanced distal colorectal adenoma. Cancer Epidemiol Biomarkers Prev. 2008;17:1144–1154. doi: 10.1158/1055-9965.EPI-07-2947. [DOI] [PubMed] [Google Scholar]
- Peters U, Takata Y. Selenium and the prevention of prostate and colorectal cancer. Mol Nutr Food Res. 2008;52:1261–1272. doi: 10.1002/mnfr.200800103. [DOI] [PMC free article] [PubMed] [Google Scholar]
- Reid ME, Duffield-Lillico AJ, Garland L, Turnbull BW, Clark LC, Marshall JR. Selenium supplementation and lung cancer incidence: an update of the nutritional prevention of cancer trial. Cancer Epidemiol Biomarkers Prev. 2002;11:1285–1291. [PubMed] [Google Scholar]
- Saito Y, Yoshida Y, Akazawa T, Takahashi K, Niki E. Cell death caused by selenium deficiency and protective effect of antioxidants. J Biol Chem. 2003;278:39428–39434. doi: 10.1074/jbc.M305542200. [DOI] [PubMed] [Google Scholar]
- Salvioli S, Ardizzoni A, Franceschi C, Cossarizza A. JC-1, but not DiOC6(3) or rhodamine 123, is a reliable fluorescent probe to assess delta psi changes in intact cells: implications for studies on mitochondrial functionality during apoptosis. FEBS Lett. 1997;411:77–82. doi: 10.1016/s0014-5793(97)00669-8. [DOI] [PubMed] [Google Scholar]
- Shamberger RJ, Willis CE. Selenium distribution and human cancer mortality. CRC Crit Rev Clin Lab Sci. 1971;2:211–221. doi: 10.3109/10408367109151308. [DOI] [PubMed] [Google Scholar]
- Shin SH, Yoon MJ, Kim M, Kim JI, Lee SJ, Lee YS, Bae S. Enhanced lung cancer cell killing by the combination of selenium and ionizing radiation. Oncol Rep. 2007;17:209–216. [PubMed] [Google Scholar]
- Sohn OS, Desai DH, Das A, Rodriguez JG, Amin SG, El-Bayoumy K. Comparative excretion and tissue distribution of selenium in mice and rats following treatment with the chemopreventive agent 1,4-phenylenebis(methylene)selenocyanate. Chem Biol Interact. 2005;151:193–202. doi: 10.1016/j.cbi.2004.10.007. [DOI] [PubMed] [Google Scholar]
- Stranges S, Marshall JR, Natarajan R, Donahue RP, Trevisan M, Combs GF, Cappuccio FP, Ceriello A, Reid ME. Effects of long-term selenium supplementation on the incidence of type 2 diabetes: a randomized trial. Ann Intern Med. 2007;147:217–223. doi: 10.7326/0003-4819-147-4-200708210-00175. [DOI] [PubMed] [Google Scholar]
- Suzuki KT, Doi C, Suzuki N. Metabolism of 76Semethylselenocysteine compared with that of 77Se-selenomethionine and 82Seselenite. Toxicol Appl Pharmacol. 2006a;217:185–195. doi: 10.1016/j.taap.2006.09.006. [DOI] [PubMed] [Google Scholar]
- Suzuki KT, Kurasaki K, Ogawa S, Suzuki N. Metabolic transformation of methylseleninic acid through key selenium intermediate selenide. Toxicol Appl Pharmacol. 2006b;215:189–197. doi: 10.1016/j.taap.2006.02.011. [DOI] [PubMed] [Google Scholar]
- Suzuki KT, Ohta Y, Suzuki N. Availability and metabolism of 77Semethylseleninic acid compared simultaneously with those of three related selenocompounds. Toxicol Appl Pharmacol. 2006c;217:51–62. doi: 10.1016/j.taap.2006.07.005. [DOI] [PubMed] [Google Scholar]
- Suzuki KT, Somekawa L, Kurasaki K, Suzuki N. Simultaneous tracing of 76Se-selenite and 77Se-selenomethionine by absolute labeling and speciation. Toxicol Appl Pharmacol. 2006d;217:43–50. doi: 10.1016/j.taap.2006.07.006. [DOI] [PubMed] [Google Scholar]
- Swede H, Dong Y, Reid M, Marshall J, Ip C. Cell cycle arrest biomarkers in human lung cancer cells after treatment with selenium in culture. Cancer Epidemiol Biomarkers Prev. 2003;12:1248–1252. [PubMed] [Google Scholar]
- Trotter EW, Grant CM. Thioredoxins are required for protection against a reductive stress in the yeast Saccharomyces cerevisiae. Mol Microbiol. 2002;46:869–878. doi: 10.1046/j.1365-2958.2002.03216.x. [DOI] [PubMed] [Google Scholar]
- White E, DiPaola RS. The double-edged sword of autophagy modulation in cancer. Clin Cancer Res. 2009;15:5308–5316. doi: 10.1158/1078-0432.CCR-07-5023. [DOI] [PMC free article] [PubMed] [Google Scholar]
- Wu Y, Zhang H, Dong Y, Park YM, Ip C. Endoplasmic reticulum stress signal mediators are targets of selenium action. Cancer Res. 2005;65:9073–9079. doi: 10.1158/0008-5472.CAN-05-2016. [DOI] [PubMed] [Google Scholar]
- Yoo MH, Xu XM, Carlson BA, Gladyshev VN, Hatfield DL. Thioredoxin reductase 1 deficiency reverses tumor phenotype and tumorigenicity of lung carcinoma cells. J Biol Chem. 2006;281:13005–13008. doi: 10.1074/jbc.C600012200. [DOI] [PubMed] [Google Scholar]
- Yoo MH, Xu XM, Carlson BA, Patterson AD, Gladyshev VN, Hatfield DL. Targeting thioredoxin reductase 1 reduction in cancer cells inhibits self-sufficient growth and DNA replication. PLoS One. 2007;2:e1112. doi: 10.1371/journal.pone.0001112. [DOI] [PMC free article] [PubMed] [Google Scholar]
- Zhao R, Holmgren A. A novel antioxidant mechanism of ebselen involving ebselen diselenide, a substrate of mammalian thioredoxin and thioredoxin reductase. J Biol Chem. 2002;277:39456–39462. doi: 10.1074/jbc.M206452200. [DOI] [PubMed] [Google Scholar]
- Zhao R, Masayasu H, Holmgren A. Ebselen: a substrate for human thioredoxin reductase strongly stimulating its hydroperoxide reductase activity and a superfast thioredoxin oxidant. Proc Natl Acad Sci U S A. 2002;99:8579–8584. doi: 10.1073/pnas.122061399. [DOI] [PMC free article] [PubMed] [Google Scholar]
- Zu K, Bihani T, Lin A, Park YM, Mori K, Ip C. Enhanced selenium effect on growth arrest by BiP/GRP78 knockdown in p53-null human prostate cancer cells. Oncogene. 2006;25:546–554. doi: 10.1038/sj.onc.1209071. [DOI] [PMC free article] [PubMed] [Google Scholar]