

Abstract
In this study we report an improved protocol that combines simplified sample preparation and micro-scale separation for mass spectrometric analysis of neuropeptides from individual neuroendocrine organs of crab Cancer borealis. A simple, one-step extraction method with commonly used matrix-assisted laser desorption/ionization (MALDI) matrix, 2,5-dihydroxybenzoic acid (DHB), in saturated aqueous solution, is employed for improved extraction of neuropeptides. Furthermore, a novel use of DHB as background electrolyte for capillary electrophoresis (CE) separation in the off-line coupling of CE to MALDI-Fourier transform mass spectrometric (FT-MS) detection is also explored. The new CE electrolyte exhibits full compatibility with MALDI-MS analysis of neuropeptides in that both the peptide extraction process and MALDI detection utilize DHB. In addition, enhanced resolving power and improved sensitivity are also observed for CE-MALDI-MS of peptide mixture analysis. Collectively, the use of DHB has simplified the extraction and reduced the sample loss by elimination of homogenizing, drying, and desalting processes. In the mean time, the concurrent use of DHB as CE separation buffer and subsequent MALDI-MS detection offers improved spectral quality by eliminating the interferences from typical CE electrolyte in MALDI detection.
1. Introduction
Mass spectrometry (MS)-based neuropeptidomics has become an increasingly intensive research area due to the importance of neuropeptides as signaling molecules and the rapid development of MS methodologies [1-5]. Because neuropeptides often exist in complex biological matrices at low concentrations, highly specific and sensitive strategies are needed to visualize and characterize the entire complement of endogenous peptides [6]. Additionally, it is often desirable to measure the changes of neuropeptides qualitatively and quantitatively in individual animals upon physiological and environmental perturbations [7, 8].
Matrix-assisted laser desorption/ionization (MALDI) facilitates mass spectrometric investigation of single cells [9] and freshly-dissected neuronal tissues [10-12]. This MALDI-based in situ methodology has evolved into several popular variants such as direct tissue imaging mass spectrometry (IMS) [13-19] and direct tissue peptide profiling [11, 12, 20, 21]. The direct tissue peptide profiling technique can generate a quick snapshot of the peptide profiles of each tissue sample. However, interferences from high salt and lipid content in the tissue and analyte suppression often lead to incomplete and reduced peptidome coverage of a tissue sample.
Alternatively, neuropeptide tissue extraction techniques have the ability to yield peptide rich samples for MS experiments. Currently, the most common extraction approaches are based on the use of cold acids in combination with mechanical homogenization of the tissue. Numerous enrichment or fractionation techniques [22-25] as well as several modified extraction approaches such as microwave-assisted irradiation or heat denaturation of protease techniques [26-31] have been developed to improve the neuropeptide analysis of different animal models. However, since most extraction experiments require pooling of multiple organs or neurons, many animals have to be sacrificed in order to obtain a sufficient coverage of the neuropeptidome. At the same time, the multiple steps associated with extraction may cause dilution, sample loss, contamination or chemically-induced artifacts. These steps have, to a certain degree, masked the information of neuropeptide changes in an individual neuronal tissue.
Previously, researchers in our lab and others observed that the common MALDI matrix, 2,5-dihydroxybenzoic acid (DHB) could facilitate direct MALDI-MS analysis when it was used for tissue rinsing [11, 20, 32]. Recently, Romanova et al. [33] reported that the use of saturated DHB in aqueous solution could provide direct extraction of neuropeptides from neuronal tissues ranging from cellular clusters to intact brain. This one-step protocol is effective and can also be used for a long-term preservation of the neuropeptide extracts.
Once peptides have been extracted from tissue samples, the high complexity of an extract does not immediately lend itself to MS analysis. Often further separation steps are required [e.g., one-dimensional (1D) or two-dimensional (2D) HPLC] to achieve maximum neuropeptidome coverage in MS studies. Capillary electrophoresis (CE) has gained increasing attention for the analysis of a variety of signaling molecules, from small amines and amino acids to neuropeptides and larger proteins, due to its high resolving power and low sample consumption [34-40]. CE-MS has now become an established technique for bioanalysis of a wide variety of biological samples including neuronal tissue extracts [41, 42]. We have recently demonstrated that CE fractionation is promising for global analysis of neuropeptides from complex biological samples [43]. The off-line coupling of CE to MALDI-MS analysis is not only easy to implement but also allows for independent optimization of the separation, deposition, and subsequent MS detection events. Here, we further explore the use of DHB as a multi-functional reagent for neuropeptide analysis in crab Cancer borealis. Specifically, DHB is utilized simultaneously as a neuropeptide extraction solvent, a novel background electrolyte for CE separation, and as MALDI matrix for MS detection. The combined use of DHB in three distinct procedures has simplified sample preparation and minimized interference from typical background electrolytes such as phosphate buffer for CE-MS experiments. This new methodology offers excellent analytical sensitivity and spectral quality for the MALDI detection of individual neuronal samples.
2. Experimental
2.1. Materials
Methanol, acetonitrile (ACN), ammonium hydroxide, trifluoroacetic acid (TFA), and acetic acid were purchased from Fisher Scientific (Pittsburgh, PA, USA). Cellulose acetate, 39.7% (w/w), average Mr 50 000, was purchased from Sigma-Aldrich (St. Louis, MO, USA). DHB was obtained from ICN Biomedicals (Costa Mesa, CA, USA). Parafilm “M” was obtained from Pechiney Plastic Packaging (Menasha, WI, USA). C18 Ziptip column was manufactured by Millipore and all water used in this study was doubly distilled on a Millipore filtration system (Bedford, MA, USA). The physiological saline consisted of (in mM): NaCl, 440; KCl, 11; MgCl2, 26; CaCl2, 13; Tris (tris-hydroxymethylaminomethane), 11; maleic acid, 5; pH 7.45. The sequences and concentrations of nine neuropeptide standards are: PFCNAFTGCamide (crustacean cardioactive peptide, m/z 956.37), 2.0 μM; SGGFAFSPRLamide (m/z 1037.55), 2.5 μM; CYFQNCPRGamide ([Arg8] vasopressin, m/z 1084.45), 2.5 μM; GAHKNYLRF (m/z 1105.59), 3.0 μM; IARRHPYFL (kinetensin, m/z 1172.67), 10.0 μM; DRVYVHPFHL ([Val5] angiotensin-I, m/z 1282.67), 7.5 μM; RPKPQQFFGLMamide (Substance P, m/z 1347.74), 7.5 μM; NFDEIDRSGFGFA (m/z 1474.66), 1.5 μM; and AGCKNFFWKTFTSC (somatostatin, m/z 1637.72), 5.0 μM.
2.2. Animal dissection and neuropeptide extraction
Jonah crabs, Cancer borealis, were purchased from the Fresh Lobster Company (Gloucester, MA, USA) and maintained without food in an artificial seawater tank at 10-12 °C. Details of the animal dissection were described previously [11, 44]. Animals were cold-anesthetized by packing in ice for 15-30 min prior to dissection and the pericardial organs (POs) were dissected in chilled physiological saline.
For the conventional method, neuropeptides were extracted as described previously [21]. The isolated organs were combined, homogenized, and peptides extracted using ice-cold acidified methanol (methanol: glacial acetic acid: water/90:9:1, v/v). The extract was dried down and resuspended in 10 μL of 0.1% (v/v) formic acid (aq). To extract neuropeptides from neural tissue with saturated aqueous DHB (saDHB) solution, the tissues were dissected, placed into a vial containing 5 to 40 μL saDHB solutions, and stored at 4 °C for several hours up to 30 days. Following incubation, the saDHB extracted samples were ready for both direct MALDI and CE-MALDI analysis without the need for further treatment. In contrast, the acidified methanol extracts were desalted by ZipTipC18 and eluted in 5 μL of 50% ACN: 50% of 0.1% (v/v) TFA aqueous solution prior to analysis. The sample application for direct MALDI-MS with Parafilm was described previously [45]. Briefly, Parafilm coating was placed on the sample plate and 150 mg/mL DHB (in methanol: water, 50:50, v/v) was deposited onto its surface. For CE fractions, eluate was collected onto the DHB spots. For direct MALDI analysis, an aliquot of 0.5 μL of sample was applied onto the DHB spots.
2.3. Apparatus
2.3.1 CE
The laboratory-built CE apparatus was previously described [43]. Capillaries (50 μm i.d. × 360 μm o.d.) with varying lengths of 70-80 cm were from Polymicro Technologies (Phoenix, AZ, USA). The CE operated by a high voltage power supply (HV30KVD, dual-polarity, 0 to ±30 kV, Unimicro Technologies, Pleasanton, CA, USA), was off-line coupled to MALDI-FT-MS with an on-capillary porous ionic joint interface. A pressure-initiated capillary siphoning phenomenon was employed to manipulate the stream of CE runs under a reversed polarity (negative) mode[43]. Subsequent fraction collection was performed on a series of pre-deposited nanoliter volume DHB spots on a Parafilm-coated MALDI sample plate. Prior to use, the new capillary was rinsed with (1) 75:25/NaOH (1.0 M): MeOH v/v, (2) H2O, (3) 0.1 M NaOH, (4) air, (5) water again, and (6) running buffer under∼0.5 psi (∼3447 Pa) in sequence for 5 min in each step, followed by electrophoretic equilibration with the separation buffer for 10 min prior to injection of the sample. Steps 3 to 6 were repeated between CE runs to remove any residual peptides adsorbed onto the capillary wall. The sample was injected onto the CE column using a pressure of 0.5 psi for 3s (∼50 nL). Reversed polarity mode CE was then initiated by applying a voltage (-18kV) between the inlet and the on-column porous ionic joint.
Three background electrolytes were compared for the CE-MALDI-MS in this study: (i) A cocktail of ammonium formate (100 mM): H2O: ACN with a ratio of 5:4:1 v/v, at pH 2.75. (ii) Ammonium phosphate monobasic at 50 mM, adjusted to pH 2.5 with hydrochloric acid, and (iii) A background electrolyte was prepared using saturated DHB (∼100 mg DHB in 5 mL water showing excess DHB falling out of solution, initial pH was approximately 2.05 by measurement) as starting material adjusted by adding NH4OH to a final pH of 2.5-3.0. The resulting solution was then filtered by 0.22 μm Millex syringe driven filter (Millipore). Afterwards ACN was added to the filtrate to form a 95% of saDHB: 5% ACN v/v solution. This solution was then stored in dark and cool (4 °C refrigerator) conditions for less than one week.
2.3.2 MALDI-FT-MS
Mass spectra of the CE fractions were acquired on a Varian/IonSpec Fourier transform mass spectrometer (Lake Forest, CA, USA) equipped with a 7.0 T actively shielded superconducting magnet. The FT-MS instrument consisted of an external high-pressure MALDI source. A 355 nm Nd: YAG laser (Laser Science, Franklin, MA, USA) was used to create ions followed by accumulation in the external hexapole storage trap before being transferred through a quadrupole ion guide to the ICR cell. All mass spectra were collected in positive ion mode. The ions were excited prior to detection with a radio frequency (RF) sweep beginning at 7050 ms with a width of 4 ms and amplitude of 150 V base to peak. The filament and quadrupole trapping plates were initialized to 15 V, and both were ramped to 1 V from 6500 to 7000 ms to reduce baseline distortion of peaks. Detection was performed in broadband mode from m/z 108.00 to 2500.00.
3. Results and discussion
3.1 Simplified DHB extraction protocol improves analytical sensitivity
In our conventional ice-cold acidified methanol extraction method, the neuronal tissues of four pericardial organs (POs) from a minimum of two animals (often times more than ten animals were used; each crab has a pair of POs) were pooled to make an extract. The preparation of analytical sample involved sequential steps of homogenizing, centrifugation, high molecular weight cut-off, drying, reconstituting and desalting processes (Fig. 1A). The sample loss could be significant after these many steps, which leads to decreased neuropeptide abundance in the extract available for subsequent MS analysis.
Fig. 1.
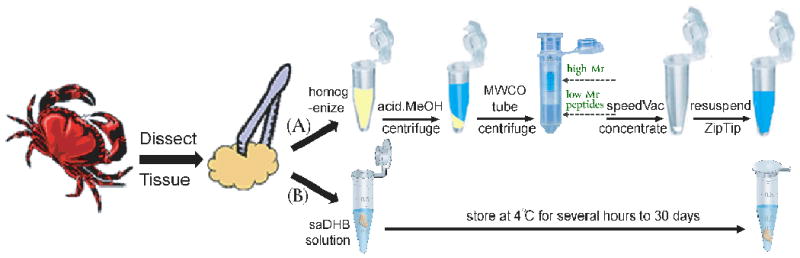
Two protocols for neuropeptide extraction from tissues. (A) Conventional ice-cold acidified methanol protocol (methanol: acetic acid: water/90:9:1, v/v) involves sequential steps of homogenizing, drying, reconstituting and desalting processes. (B) The saDHB protocol offers simplified one-step extraction.
Previous studies demonstrated that rinsing tissue with saturated aqueous DHB (saDHB) solution can aid in neuropeptide extraction from neurons by stabilizing cell membranes and deactivating endogenous proteolytic enzymes due to its acidic pH [11, 20, 32]. As developed by Romanova et al. [33], the one-step protocol using saDHB solution was easy to perform (Fig. 1B). With this novel extraction method, one to several hours' incubation is enough to obtain satisfactory intensity and coverage of peptides, but a longer (overnight or a few days) extraction has shown a slightly improved sensitivity and greater coverage. Fig. 2 compares the MALDI-FT-MS analysis of a single PO extract prepared and stored at 4 °C for 12 hours with saDHB and a four-PO extract prepared using the conventional extraction approach. Comparable signals are observed in terms of MS spectral quality, peak intensity and the number of identified neuropeptides in both methods. The inset in Fig. 2 shows the identified peptide numbers via the different extraction procedure of A and B. In total, 25 known peptides were identified with mass error less than 10 ppm by the high resolution FT-MS. Nineteen of which are overlapped while three are uniquely observed in each method. This result indicates that the two methods are complementary and the combined use of the two protocols can increase the coverage of neuropeptide. The detailed list of neuropeptides is given in Supplementary Table S1. It is also notable that the volume used for the saDHB extraction (40 μL for one PO) was much larger than that for conventional extraction (10 μL for four POs). This great difference in extract volume still resulted in comparable MS signals, indicating a significant improvement in extraction efficiency of the novel protocol. Our study also demonstrated that reducing saDHB solution volume to 10 μL yielded much lower extraction efficiency (data not shown). This observation is consistent with the initial study that claimed a 5 to10-fold excess saDHB in volume [33].
Fig.2.

MALDI-FT-MS mass spectra of neuropeptides extracted from the pericardial organs (POs) from crab Cancer borealis. Comparable MALDIMS analytical results obtained by: (A) acidified MeOH extraction with 4 POs and (B) saDHB extraction with single PO. The inset shows the number of unique and overlapped peptide identification via method (A) or (B). Asterisks (*) indicate unknown peptides.
3.2 Evaluation of the DHB buffer for CE separation
For CE-MALDI-MS, many common CE buffers are not compatible with mass spectrometric detection due to their ion suppression and interference to MS analysis. Acidic sample solvents are preferable due to better ionization in positive ion mode of MALDI. Furthermore, acidic conditions (pH around 2.5) are helpful for reducing the adsorption of protein and peptides onto the bare capillary wall. Supplementary Table S2 compares three buffer systems used in our CE-MALDI-MS experiments. Phosphate buffer (PBS) is a widely used background electrolyte in CE due to its high resolving power; however, the PBS could deteriorate MALDI-MS signals by introducing interfering noise even at a low concentration. Other common volatile buffers such as formate or acetate yield poor resolution and compromised buffering capability. This complication has limited the background electrolyte choice in CE-MALDI-MS experiments.
The 2,5-DHB was occasionally used as a (fluorescent) electrolyte for indirect UV detection of organic acid with CE separation [46,47]. We consider DHB as a potent electrolyte for CE because it contains one carboxylic and two phenyl hydroxyl groups, making this weak acid a fine organic buffer agent. The pKa of DHB in aqueous solution (saturated at ∼16-18 mg/mL, 0.117 M) is ∼3.0 (http://www.zirchrom.com/organic.htm). Thus, the optimal buffer range should be from ∼2.0 to 4.0 (pKa ± 1). The initial pH of saDHB is approximately 2.05 by our measurement. To optimize the buffer capacity and to keep its acidity for suppressing adsorption of analyte to capillary wall, we adjusted the solution to pH range of 2.5-3.0 with the ammonium hydroxide (NH4OH) in the presence of excess DHB. In this course we observed that a relatively high pH value such as 2.85 needed a large amount of NH4OH, and resulted in dissolvation of additional DHB. As a result, when used as CE buffer, the DHB forms crystals at the outlet of capillary and thus blocks the column for CE run. Therefore, we selected pH 2.60 to 2.75 DHB buffers in the following experiments.
Fig. 3A and 3B show comparisons between the offline CE-MALDI-MS analysis of a nine-peptide mixture using formate buffer and DHB buffer, respectively. Typically, sample overloading in CE experiments should be avoided because it significantly decreases the separation efficiency. However, the down-stream MS detection often requires more samples to detect minor components in a mixture. Here, we explored the injection of a large volume sample for CE separation using two buffers. Approximately, 50 nL of a peptide mixture containing peptides ranging from 1.0 to 10 μM level (see section 2.1) were injected for the analyses. As shown in Fig. 3A, with formate buffer the nine model peptides were eluted in six fractions collected in one minute intervals. With saDHB as a separation buffer, the electrophoretic migration time was extended (Fig. 3B). Different degrees of signal overlapping were observed in both cases, i.e., multiple peptides in one fraction or the splitting of single peptide into multiple fractions. However, with DHB as separation buffer, the peptides' migration order were clearly distinguished, and more importantly, the MALDI signal intensities of most peptides were found to increase by 2 to 7-fold as shown with dash lines for the comparison of individual peptides in stacking of spectra. Figs. 3C-E shows the blank baseline of the MALDI spectra (from m/z 600 to 2000) deposited with only the buffers from CE column. As illustrated, the MALDI mass spectra of the ammonium-DHB and ammonium formate CE buffers demonstrate their compatibility with MS studies. For these buffers, the background noise peaks are restrained to the electronic noise peaks generated by the FT-MS system itself. In contrast, the ammonium phosphate buffer's mass spectrum shows that it is not suitable for MS studies because of the increased and broad distribution of noise peaks. Overall, the saDHB buffer has offered greater resolving capacity for CE and enhanced signal-to-noise ratios for individual peptides. We have found that with DHB buffer the analytes showed a considerably lower electrophoretic mobility than using formate buffer. This is due to the different mobilities of analyte ions in the two separation buffers caused by their different physical properties (e.g., molecular weight, size, ionic strength and viscosity) or different potential ionic pair formation of the analytes and the buffer matrices. The higher ionic strength and larger size of DHB (see Supplementary Table S2) are likely the major contributing factors for the lower mobilities of the peptide ions in this buffer. Furthermore, the 2,5-DHB is reported to bear a mobility of 26.2 × 10⁻⁵ (m2 V-1 s-1) [48], which is only a half of that of the formic acid 53 × 10-5 (m2 V-1 s-1) [49]. This electrophoretic mobility difference allow us to further use them as a novel discontinuous (isotachophoretic) electrolyte system [50] for on-capillary sample preconcentration by focusing a large volume of low-level analytes into a narrow band [51] in our future study.
Fig.3.

Offline CE-MALDI-MS analysis of a 9-peptide mixture: (A) using formate buffer and (B) using DHB buffer. Running buffers: ammonium formate 50 mM, pH 2.75; DHB buffer, saturated at ∼117 mM, pH 2.75, 5% (v/v) ACN added. Sample injection: ∼ 50 nL. Voltage: -18 kV. Capillary: 50 μm ID, uncoated, 65 cm in total, membrane joint for anode is at 5 cm from the end. Peptides' concentrations are listed in the Materials section. (C-E) Blank baseline of the MALDI spectra (from m/z 600 to 2000) of the three buffers for CE. The asterisks (*) labels the noises present in all spectra generated by this FT-MS instrument. Open circles (○) label other unknown noise peaks in using phosphate buffer for CE.
3.3 CE-MALDI-MS of single PO extract
The off-line CE-MALDI-FT-MS coupling exhibited high sensitivity for neuropeptide analysis of complex tissue extract in the low femtomole to high attomole range [43]. In the present study, we further explore the analytical sensitivity and the MS spectral quality by using saDHB as both a CE background electrolyte and as a solvent for peptide extraction. Utilizing saDHB in this manner not only minimizes the potential sample loss associated with changing solvents by means of drying/reconstituting processes, but also minimizes any adverse interactions and signal suppression effects that can occur when common CE buffers are used. The DHB acts multifunctionally as the neuropeptide extraction solvent, the CE separation buffer, and the MALDI-MS detection matrix.
Following saDHB extraction of single PO, approximately 50 nL of the extract, as one-tenth of the amount used in direct MALDI analysis, was injected for CE separation using DHB buffer (pH 2.66) followed by MALDI-FT-MS detection. Fig.4 compares the analysis of neuropeptides from a single PO extract by direct MALDI-MS analysis and by CE-MALDI-MS. The latter consumed 10-fold less sample (50 nL for CE-MALDI versus 500 nL for direct MALDI-MS) while exhibiting 5- to 10-fold enhancement in S/N ratio. For example, the most abundant peptide pEGFYSQRYamide (m/z 1030.5) in CE-MALDI detection schemes showed a 5.2-fold signal improvement. The improvement is hypothesized to be much greater for many lower abundance peptides, because their ionizations may be suppressed by abundant components in the direct MALDI analysis. Accordingly, the total coverage of detected peptides (also included unknown peaks) increased by 28.9% (97 to 125) with CE separation. This improvement in analytical performance is largely due to effective preconcentration, and separation provided by CE fractionation, therefore decreasing the ionization suppression of high-abundance peptides prior to MALDI-MS analysis. In addition, the utility of a MALDI compatible CE background electrolyte increases the coverage of CE-MALDI studies. Repeating the analysis of the extract preserved in saDHB at 4 °C for up to four weeks gave similar results in both spectral pattern and peptide intensity, which provides the evidence to the proteolytic inhibition properties of saDHB.
Fig.4.

Bubble mapped 2D plot of the MALDI-MS data comparing the neuropeptide signals obtained from: (A) 500 nL of single PO extract without CE separation, and (B) 50 nL sample after CE separation. Larger bubbles indicate more intense peptide signals (see the color scale). Y axis in panel B) shows the migration time in CE. CE conditions are different from Fig. 3 in DHB buffer pH (2.66), voltage (-16 kV) and capillary total length (77 cm).
4. Conclusions
A new method using DHB for direct tissue extraction and as background electrolyte for off-line CE-MALDI-MS experiments is developed. The combined use of MALDI matrix for enhanced neuropeptide extraction, CE fractionation followed by high resolution MALDI-FT-MS detection offers a simplified and improved protocol for the global analysis of neuropeptides directly from minute quantities of biological tissues.
Supplementary Material
Acknowledgments
We wish to thank the UW School of Pharmacy Analytical Instrumentation Center for access to the MALDI-FT-MS instrument. This work was supported in part by the School of Pharmacy and Wisconsin Alumni Research Foundation at the University of Wisconsin-Madison, a National Science Foundation CAREER Award (CHE-0449991), and National Institutes of Health through Grant 1R01DK071801. R.M.S. acknowledges the NIH-supported Clinical Neuroengineering Training Program Predoctoral Fellowship (NIH T90 DK070079). L.L. acknowledges an Alfred P. Sloan Research Fellowship.
Footnotes
Publisher's Disclaimer: This is a PDF file of an unedited manuscript that has been accepted for publication. As a service to our customers we are providing this early version of the manuscript. The manuscript will undergo copyediting, typesetting, and review of the resulting proof before it is published in its final citable form. Please note that during the production process errors may be discovered which could affect the content, and all legal disclaimers that apply to the journal pertain.
References
- 1.Li L, Sweedler JV. Ann Rev Analy Chem. 2008;1:451. doi: 10.1146/annurev.anchem.1.031207.113053. [DOI] [PubMed] [Google Scholar]
- 2.Baggerman G, Verleyen P, Clynen E, Huybrechts J, De Loof A, Schoofs L. J Chromatogr B. 2004;803:3. doi: 10.1016/j.jchromb.2003.07.019. [DOI] [PubMed] [Google Scholar]
- 3.Fricker LD, Lim J, Pan H, Che FY. Mass Spectrom Rev. 2006;25:327. doi: 10.1002/mas.20079. [DOI] [PubMed] [Google Scholar]
- 4.Hummon AB, Amare A, Sweedler JV. Mass Spectrom Rev. 2006;25:77. doi: 10.1002/mas.20055. [DOI] [PubMed] [Google Scholar]
- 5.Svensson M, Skold K, Nilsson A, Falth M, Svenningsson P, Andren PE. Biochem Soc Trans. 2007;35:588. doi: 10.1042/BST0350588. [DOI] [PubMed] [Google Scholar]
- 6.Falth M, Skold K, Svensson M, Nilsson A, Fenyo D, Andren PE. Mol Cell Proteomics. 2007;6:1188. doi: 10.1074/mcp.M700016-MCP200. [DOI] [PubMed] [Google Scholar]
- 7.Chung JS, Zmora N. FEBS J. 2008;275:693. doi: 10.1111/j.1742-4658.2007.06231.x. [DOI] [PubMed] [Google Scholar]
- 8.Matias I, Vergoni AV, Petrosino S, Ottani A, Pocai A, Bertolini A, Di Marzo V. Neuropharmacology. 2008;54:206. doi: 10.1016/j.neuropharm.2007.06.011. [DOI] [PubMed] [Google Scholar]
- 9.Li LJ, Garden RW, Sweedler JV. Trends Biotech. 2000;18:151. doi: 10.1016/s0167-7799(00)01427-x. [DOI] [PubMed] [Google Scholar]
- 10.Fournier I, Day R, Salzet M. Neuroendocrinol Lett. 2003;24:9. [PubMed] [Google Scholar]
- 11.Kutz KK, Schmidt JJ, Li L. Anal Chem. 2004;76:5630. doi: 10.1021/ac049255b. [DOI] [PubMed] [Google Scholar]
- 12.Stemmler EA, Hsu YWA, Cashman CR, Messinger DI, de la Iglesia HO, Dickinson PS, Christie AE. Gen Comp Endocrinol. 2007;154:184. doi: 10.1016/j.ygcen.2007.06.025. [DOI] [PubMed] [Google Scholar]
- 13.Caprioli RM, Farmer TB, Gile J. Anal Chem. 1997;69:4751. doi: 10.1021/ac970888i. [DOI] [PubMed] [Google Scholar]
- 14.Kruse R, Sweedler JV. J Am Soc Mass Spectrom. 2003;14:752. doi: 10.1016/S1044-0305(03)00288-5. [DOI] [PubMed] [Google Scholar]
- 15.Caldwell RL, Caprioli RM. Mol Cell Proteomics. 2005;4:394. doi: 10.1074/mcp.R500006-MCP200. [DOI] [PubMed] [Google Scholar]
- 16.Altelaar AFM, van Minnen J, Jimenez CR, Heeren RMA, Piersma SR. Anal Chem. 2005;77:735. doi: 10.1021/ac048329g. [DOI] [PubMed] [Google Scholar]
- 17.James A, Willetts M, Abdi F, Gostick D. Mol Cell Proteomics. 2006;5:S306. [Google Scholar]
- 18.DeKeyser SS, Kutz-Naber KK, Schmidt JJ, Barrett-Wilt GA, Li L. J Proteome Res. 2007;6:1782. doi: 10.1021/pr060603v. [DOI] [PMC free article] [PubMed] [Google Scholar]
- 19.Burnum KE, Frappier SL, Caprioli RM. Ann Rev Anal Chem. 2008;1:689. doi: 10.1146/annurev.anchem.1.031207.112841. [DOI] [PubMed] [Google Scholar]
- 20.Li LJ, Garden RW, Romanova EV, Sweedler JV. Anal Chem. 1999;71:5451. doi: 10.1021/ac9907181. [DOI] [PubMed] [Google Scholar]
- 21.DeKeyser SS, Li L. Analyst. 2006;131:281. doi: 10.1039/b510831d. [DOI] [PubMed] [Google Scholar]
- 22.Skold K, Svensson M, Kaplan A, Bjorkesten L, Astrom J, Andren PE. Proteomics. 2002;2:447. doi: 10.1002/1615-9861(200204)2:4<447::AID-PROT447>3.0.CO;2-A. [DOI] [PubMed] [Google Scholar]
- 23.Babu CVS, Lee J, Lho DS, Yoo YS. J Chromatogr B. 2004;807:307. doi: 10.1016/j.jchromb.2004.04.026. [DOI] [PubMed] [Google Scholar]
- 24.Parkin MC, Wei H, O'Callaghan JP, Kennedy RT. Anal Chem. 2005;77:6331. doi: 10.1021/ac050712d. [DOI] [PubMed] [Google Scholar]
- 25.Holm A, Storbraten E, Mihailova A, Karaszewski B, Lundanes E, Greibrokk T. Anal Bioanal Chem. 2005;382:751. doi: 10.1007/s00216-005-3146-z. [DOI] [PubMed] [Google Scholar]
- 26.Mathe AA, Stenfors C, Brodin E, Theodorsson E. Life Sci. 1990;46:287. doi: 10.1016/0024-3205(90)90035-p. [DOI] [PubMed] [Google Scholar]
- 27.Che FY, Lim J, Pan H, Biswas R, Fricker LD. Mol Cell Proteomics. 2005;4:1391. doi: 10.1074/mcp.T500010-MCP200. [DOI] [PubMed] [Google Scholar]
- 28.Parkin MC, Wei H, O'Callaghan JP, Kennedy RT. Anal Chem. 2005;77 doi: 10.1021/ac050712d. [DOI] [PubMed] [Google Scholar]
- 29.Dowell JA, Vander Heyden W, Li L. J Proteome Res. 2006;5:3368. doi: 10.1021/pr0603452. [DOI] [PubMed] [Google Scholar]
- 30.Che FY, Zhang X, Berezniuk I, Callaway M, Lim J, Fricker LD. J Proteome Res. 2007;6:4667. doi: 10.1021/pr060690r. [DOI] [PubMed] [Google Scholar]
- 31.Svensson M, Boren M, Skold K, Falth M, Sjogren B, Andersson M, Svenningsson P, Andren PE. J Proteome Res. 2009;8:974. doi: 10.1021/pr8006446. [DOI] [PubMed] [Google Scholar]
- 32.Garden RW, Moroz LL, Moroz TP, Shippy SA, Sweedler JV. J Mass Spectrom. 1996;31:1126. doi: 10.1002/(SICI)1096-9888(199610)31:10<1126::AID-JMS403>3.0.CO;2-7. [DOI] [PubMed] [Google Scholar]
- 33.Romanova EV, Rubakhin SS, Sweedler JV. Anal Chem. 2008;80:3379. doi: 10.1021/ac7026047. [DOI] [PubMed] [Google Scholar]
- 34.Poinsot V, Rodat A, Gavard P, Feurer B, Couderc F. Electrophoresis. 2008;29:207. doi: 10.1002/elps.200700482. [DOI] [PubMed] [Google Scholar]
- 35.Kasicka V. Electrophoresis. 2008;29:179. doi: 10.1002/elps.200700550. [DOI] [PMC free article] [PubMed] [Google Scholar]
- 36.Dolnik V. Electrophoresis. 2008;29:143. doi: 10.1002/elps.200700584. [DOI] [PubMed] [Google Scholar]
- 37.Okerberg E, Shear JB. Anal Biochem. 2001;292:311. doi: 10.1006/abio.2001.5090. [DOI] [PubMed] [Google Scholar]
- 38.Rubakhin SS, Page JS, Monroe BR, Sweedler JV. Electrophoresis. 2001;22:3752. doi: 10.1002/1522-2683(200109)22:17<3752::AID-ELPS3752>3.0.CO;2-H. [DOI] [PubMed] [Google Scholar]
- 39.Boonen K, Landuyt B, Baggerman G, Husson SJ, Huybrechts J, Schoofs L. J Sep Sci. 2008;31:427. doi: 10.1002/jssc.200700450. [DOI] [PubMed] [Google Scholar]
- 40.Lapainis T, Sweedler JV. J Chromatogr A. 2008;1184:144. doi: 10.1016/j.chroma.2007.10.098. [DOI] [PubMed] [Google Scholar]
- 41.Moini M. Anal Bioanal Chem. 2002;373:466. doi: 10.1007/s00216-002-1283-1. [DOI] [PubMed] [Google Scholar]
- 42.Kostal V, Katzenmeyer J, Arriaga EA. Anal Chem. 2008;80:4533. doi: 10.1021/ac8007384. [DOI] [PMC free article] [PubMed] [Google Scholar]
- 43.Wang J, Ma M, Chen R, Li L. Anal Chem. 2008;80:6168. doi: 10.1021/ac800382t. [DOI] [PMC free article] [PubMed] [Google Scholar]
- 44.Fu Q, Kutz KK, Schmidt JJ, Hsu YWA, Messinger DI, Cain SD, Lglesia HODL, Christie AE, Li L. J Comp Neurol. 2005;493:607. doi: 10.1002/cne.20773. [DOI] [PubMed] [Google Scholar]
- 45.Wang J, Chen R, Ma M, Li L. Anal Chem. 2008;80:491. doi: 10.1021/ac701614f. [DOI] [PubMed] [Google Scholar]
- 46.Bachmann K, Steeg KH, Groh T, Haumann I, Boden J, Holthues H. J Microcol Sep. 1992;4:431. [Google Scholar]
- 47.Groh T, Bachmann K. Electrophoresis. 1992;13:458. doi: 10.1002/elps.1150130196. [DOI] [PubMed] [Google Scholar]
- 48.Coolen SAJ, Huf FA, Reijenga JC. J Chromatogr B. 1998;717:119. doi: 10.1016/s0378-4347(98)00289-8. [DOI] [PubMed] [Google Scholar]
- 49.Foret F, Thompson TJ, Vouros P, Karger BL, Gebauer P, Bocek P. Anal Chem. 1994;66:4450. [Google Scholar]
- 50.Nesbitt CA, Lo JTM, Yeung KKC. J Chromatogr A. 2005;1073:175. doi: 10.1016/j.chroma.2004.09.081. [DOI] [PubMed] [Google Scholar]
- 51.Soo EC, Aubry AJ, Logan SM, Guerry P, Kelly JF, Young NM, Thibault P. Anal Chem. 2004;76:619. doi: 10.1021/ac034875i. [DOI] [PubMed] [Google Scholar]
Associated Data
This section collects any data citations, data availability statements, or supplementary materials included in this article.