

Abstract
The Adames strain of Punta Toro virus (PTV-A, Bunyaviridae, Phlebovirus) causes an acute lethal disease in hamsters and mice. The Balliet strain of the virus (PTV-B) is generally considered to be avirulent. The difference in hamster susceptibility is likely due to the ability of PTV-A to suppress interferon (IFN)-β similarly to that described for Rift Valley fever virus. Here we investigated strain differences in PTV pathogenesis and the IFN response in mice. Although PTV-B infection in mice did not induce systemic IFN-β release, primary macrophages produced dramatically higher levels when exposed to the virus in culture. The importance of IFN in resistance to PTV infection was borne out in studies employing STAT-1 knock-out mice. Also, a number of genes specific to IFN response pathways were upregulated in PTV-B-infected macrophages. Our findings provide new insights into the type I IFN response during PTV infection in the mouse model of phleboviral disease.
Keywords: Punta Toro virus, interferon, phlebovirus, Rift Valley fever virus, Rift Valley fever, hemorrhagic fever
INTRODUCTION
A member of a group of RNA viruses that cause hemorrhagic fever, Rift Valley fever virus (RVFV) primarily affects domesticated livestock and humans. It has been the cause of several recent epidemics in Africa and the Middle East (CDC, 2000a, 2000b, 2007). Evidence of its capacity to cause disease in geographical areas outside of endemic sub-Saharan Africa, along with its ease of transmission and lack of effective countermeasures are the basis of its classification as a category A pathogen by the National Institute of Allergy and Infectious Disease (NIAID, 2002).
RVFV’s virulence is at least partially attributed to its NSs protein, which suppresses the host antiviral immune response by hindering production of type I interferons (Billecocq et al., 2004; Bouloy et al., 2001; Muller et al., 1995). Interferons (IFNs) are produced in response to viral infection and initiate a signaling cascade that results in the production of a number of antiviral gene products (Haller et al., 2006). The RVFV NSs protein functions via general inhibition of cellular transcription (Billecocq et al., 2004; Le May et al., 2004) and specific repression of the IFN-β promoter region (Le May et al., 2008) to provide a means for the virus to evade the immune response and thereby establish infection.
Due to the enhanced biosafety level 3 (BSL-3+) facilities required to work with RVFV, a closely related BSL-2 phlebovirus, Punta Toro virus (PTV), has been used in rodent systems to model RVF disease. The eastern Panamanian Adames strain of PTV (PTV-A) causes disease in hamsters and mice similar to that seen in natural RVFV infections, and therefore serves as a safer and more cost effective alternative to study disease pathogenesis (Anderson et al., 1990; Fisher et al., 2003; Gowen et al., 2006a; Perrone et al., 2007; Pifat and Smith, 1987) and pre-clinical antiviral drug development (Gowen et al., 2006b, 2007a, 2007b; 2009; Sidwell et al., 1988b). Though previous studies indicated PTV-A was only able to induce disease in weanling age mice (Pifat and Smith, 1987), recent work in our lab has established PTV-A’s ability to produce lethal disease in 7–8-week-old mice (Gowen et al., 2006a); however, the disease histopathology has not been examined in these older mice.
A second strain of PTV isolated from western Panama, the Balliet strain (PTV-B), is of low virulence in hamsters, as reflected by survival of animals challenge doses up to 106 PFU (Anderson et al., 1990). In a recent report studying genetic determinants of pathogenicity, PTV-A was found to antagonize the β interferon (IFN-β) response in hamsters, while PTV-B lacked that capacity (Perrone et al., 2007). Similar to findings with RVFV and the attenuated clone 13, which indicate that the NSs gene on the S RNA segment is critical to virulence (Muller et al., 1995), the work by Perrone and colleagues suggests that the PTV-A NSs gene product is the element that inhibits IFN-β gene induction. Previous studies have indicated that PTV-B is also avirulent in mice unless inoculated directly into the brain (Sidwell et al., 1988a, 1988b). We hypothesized that the strategy employed to evade the host IFN response in hamsters may also be utilized by PTV-A during infection in mice, ultimately conferring lethality from infection with the Adames, but not the Balliet strain of the virus.
During viral infections, the IFN signaling pathway can regulate transcription of hundreds of factors that function to induce an antiviral state. The first type I IFN produced is IFN-β, which triggers the production of multiple IFN-α subtypes (Marie et al., 1998). These type I IFNs induce the transcription of many genes coding for proteins with various antiviral activities. Thus, PTV-A NSs suppression of the IFN-β promoter can abrogate this critical antiviral signaling chain of events at the outset, arresting much of the IFN pathway and its effectors. Although IFN-β plays a central role in driving the host IFN response pathway, its regulation and that of downstream effector molecules has not been explored in relation to PTV infection in mice.
RESULTS
Susceptibility and disease pathology in adult C57BL/6J mice infected with PTV
A virus titration experiment was initially performed to determine the most appropriate dose for evaluating PTV disease in adult mice (Fig. 1). The LD50s based on the titrations were ~630 and > 2× 10⁴ fifty percent cell culture infectious doses (CCID50) for PTV-A and PTV-B, respectively. The highest dose of PTV-A resulted in lower lethality, possibly due to a defective interfering particle effect or perhaps stimulating the immune system more effectively than the lower dose that was uniformly lethal. The mean day of death for animals infected with PTV-A was 5.2 days, with a range from 4–7 days. On day 3 post-infection (p.i.), mice infected with PTV-A presented with clear signs of illness including weight loss, ruffled fur, hunching, and inactivity. By day 5, surviving mice presented with milder signs of illness, ultimately recovering by day 7. None of the animals challenged with PTV-B showed any signs of illness by visual examination or lost weight following challenge (data not shown).
Figure 1.
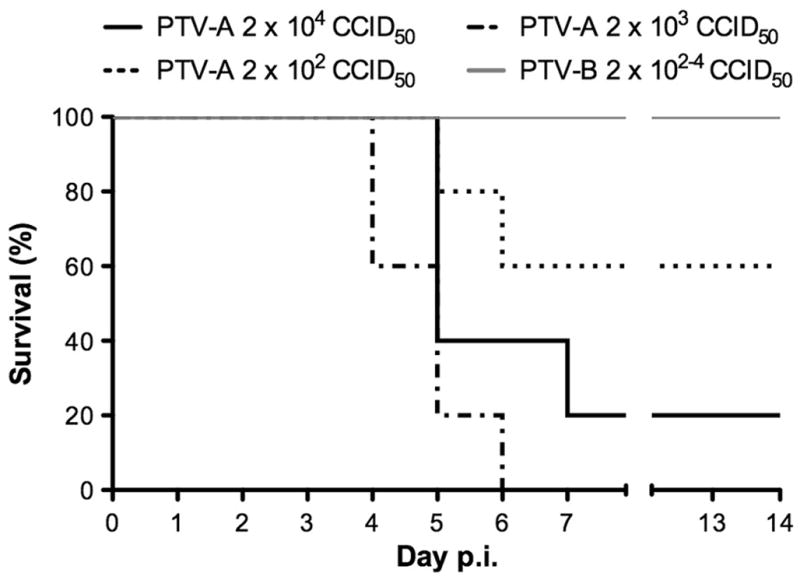
Survival of C57BL/6J mice infected with PTV-A or PTV-B. C57BL/6J mice were challenged subcutaneously with multiple doses of PTV-A or PTV-B (5 animals per group) and observed daily for mortality over a duration of 14 days.
We next longitudinally evaluated histopathology, and virologic and clinical disease parameters in mice challenged with the 2× 10³ CCID50 of PTV-A or PTV-B by sequential sacrificing of groups of animals daily during the period of acute infection. Histologically, the livers of PTV-A-infected mice appeared normal until day 3 of the infection, at which time coalescing areas of severe, acute hepatocellular necrosis were apparent, and on day 4, necrosis became diffuse (Fig. 2A & C). Hepatocellular necrosis was not present in mice infected with PTV-B, as liver sections appeared similar to those from sham-infected animals (Fig. 2B & D), though there was evidence of hypoxia in centrilobular hepatocytes on day 4 p.i. and mild hydropic degeneration on day 5 p.i. (data not shown).
Figure 2.

Histopathology of PTV infection in mice. Livers from (A, C) PTV-A-infected, (B) PTV-B-infected, and (D) sham-infected mice on day 3 p.i. Day 4 spleens from (E) PTV-A-infected and (F) PTV-B-infected mice. Tissues were stained with hematoxylin and eosin. All images are 40X magnification, with the exception of (C), which is 80X.
Similarly, spleens of PTV-A-infected mice were histologically normal until day 3, when lympholysis was present, characterized by cellular fragmentation and nuclear pyknosis, within periarteriolar sheaths (Fig. 2E). Degenerate cells and macrophages containing hemosiderin and cellular debris were also scattered throughout the splenic interstitium. Spleens of PTV-B-infected mice were histologically normal (Fig. 2F). Duodenums, adrenal glands, and brains of PTV-infected mice all appeared normal histologically, regardless of challenge virus strain.
We quantified systemic and tissue virus burden by determining CCID50/ml of serum or g of tissue (Fig. 3A–E). In all cases, infectious virus was detectable in PTV-A infected C57BL/6J mouse serum and tissues 1–3 days before PTV-B-infected animals, with no evidence of serum or brain virus burden at any time following PTV-B challenge. There was no detectable infectious virus in the duodenum of animals infected with either PTV-A or PTV-B (data not shown).
Figure 3.
Mean virus titers, ALT, and IFN-β in serum or tissue samples from PTV-infected C57BL/6J mice. Mice were challenged subcutaneously with PTV-A or PTV-B and groups of mice (n=3 per strain) were sacrificed daily on days 1–5 p.i. for collection of sera, livers, spleens, adrenal glands, and brains. (A–E) Tissue viral burden in log10 CCID50 /ml, g or tissue was determined in Vero 76 cells. The intersection of the x-axis with the y-axis reflects the assay limit of detection. (F) Serum ALT was quantified using a kinetic enzyme activity assay. (G) Serum IFN-β was determined by ELISA. Values represent the mean and standard deviation from groups of animals. Due to mortality prior to day of sacrifice, data for the Adames strain on days 4 and 5 were from two mice.
To assess liver damage, we also quantified serum ALT concentrations in PTV-infected animals (Fig. 3F). On day 3, Animals challenged with PTV-A had a pronounced spike in ALT, peaking at a mean concentration of ~7000 IU/ml. Levels decreased substantially by day 4 (~3400 IU/ml), and returned to near baseline levels by day 5. There was no remarkable increase in ALT concentrations in PTV-B-infected animals throughout the 5-day sampling period.
PTV-B infection in mice does not induce systemic IFN-β
Serum IFN-β levels were determined during the course of PTV infection by ELISA (Fig. 3G). In mice infected with PTV-A, systemic IFN-β was first detectable day 2, with high levels detected in 2 out of 3 animals. On day 3 of infection, all three animals had high levels of serum IFN-β, averaging 7240 pg/ml, with diminishing levels 4 and 5 days p.i. (1990 and 2045 pg/ml, respectively). Serum IFN-β was only detected at very low levels (~190 pg/ml) on day 4 in two of three animals infected with PTV-B. A similar experiment measuring viremia and IFN-β levels was performed with animals challenged by the intraperitoneal (i.p.) route in attempt to achieve greater viral loads and type I IFN induction in PTV-B-infected mice; however, results were similar to what was seen with s.c. virus inoculation (data not shown).
The above results argued against more rapid and higher-level systemic induction of IFN by PTV-B playing a role in resistance to PTV-B infection in mice, as suggested for hamsters (Perrone et al., 2007). Although hamsters do not succumb to lethal disease upon infection with PTV-B, they present earlier with elevated levels of circulating IFN-β compared to PTV-A-infected animals, which is thought to be a factor in resistance to PTV-B. Since we observed very little to no IFN production by mice infected with the Balliet strain, we sought to investigate whether the IFN system was important for mouse survival of PTV-B infection. We used STAT-1 knock-out (KO) mice to determine whether the IFN signaling pathway plays an important role in murine resistance to PTV-B.
IFN STAT-1 signaling pathway is required for protection against PTV-B infection
Mice challenged with PTV-B do not present with viremia or physical signs of disease. However, when mice deficient in STAT-1 were infected with PTV-B, 100% lethality was achieved (Fig. 4). Moribund PTV-B-infected STAT-1 KO mice had modest to high infectious virus titers systemically and in the liver and spleen (Table 1). No samples were examined from 129S6 WT mice infected with PTV-B as none of the animals became moribund and readily cleared the infection. Because disease signs were absent, it is likely that virus titers would be very low or undetectable in these animals, as was the case in C57BL/6J mice. PTV-B-infected STAT-1 KO mice also had high serum ALT, indicating that they were plagued with liver disease characteristic of PTV-A infection in WT mice.
Figure 4.
Survival of PTV-infected STAT-1 KO mice. Mice were challenged subcutaneously with either virus strain and observed daily for mortality for a duration of 14 days. KO vs. WT survival data were compared for each virus strain by log-rank analysis; p=0.0058 for PTV-A, p=0.0006 for PTV-B. Survival of PTV-A-infected KO mice differed significantly from that of PTV-B infected KO mice (p=0.0026).
Table 1.
Disease parameter analysis in moribund STAT-1 KO vs. WT micea
| Virus Strain | WT/KO | Day p.i. | Tissue Virus Titers |
ALT (IU/ml) | |||
|---|---|---|---|---|---|---|---|
| Serum (log10 CCID50/ml) | Liver (log10 CCID50/g) | Spleen (log10 CCID50/g) | Brain (log10 CCID50/g) | ||||
| Adames | WT | 3 | -b | 6.5 | 7.0 | <2.8c | -b |
| Adames | WT | 3 | 5.8 | <2.8c | 6.5 | <2.8c | 6659 |
| Adames | WT | 3 | 6.3 | 6.2 | 6.5 | <2.8c | 6339 |
| Adames | KO | 3 | -b | 7.7 | 9.0 | 6.7 | -b |
| Adames | KO | 3 | 8.5 | 8.7 | 8.8 | 5.7 | 6659 |
| Adames | KO | 3 | 9.5 | 9.2 | 9.5 | 6.7 | 6179 |
| Balliet | KO | 3 | 8.8 | 7.2 | 7.8 | 5.2 | 5539 |
| Balliet | KO | 5 | 6.8 | 6.7 | 7.0 | 3.5 | 1941 |
| Balliet | KO | 5 | 7.3 | 6.7 | 6.5 | 3.5 | 2306 |
| Balliet | KO | 8 | <2.8c | <2.8c | 5.0 | 5.2 | 18 |
Animals were sacrificed when moribund. Serum and tissues (liver, spleen, and brain) were collected for virus and ALT analysis.
Animal died before serum could be obtained.
Infectious virus is below the limit of detection.
In moribund PTV-A-infected animals, the WT mice showed modest disease signs (ruffled fur and decreased movement), with more severe manifestations observed in KO mice. WT mice had modest serum, liver, and spleen virus titers, while KO mice had viral loads of 2–3 log10 higher (Table 1). Interestingly, KO animals infected with PTV-A also had relatively high brain virus titers compared to the WT animals wherein virus was undetectable. Similar high levels of serum ALT were observed at the time of death in PTV-A-infected WT and KO mice, though the comparable concentrations may have been due to saturation of the ALT assay limiting its resolution at such high levels.
PTV-B has a slight growth advantage in Vero 76 cells but not primary mouse macrophages
In comparing growth rates of the two PTV strains, we found that PTV-A is slower to produce cytopathic effect (CPE) in interferon-incompetent Vero 76 cells (Emeny and Morgan, 1979; Mosca and Pitha, 1986) relative to PTV-B (data not shown). To determine growth efficiency of the PTV strains, we infected Vero 76 monolayers with a low MOI of 0.0005 and collected supernatants each day out to 6 days p.i. Consistent with the observation that CPE development was delayed in PTV-A-infected cells, there was a slight but significant growth advantage with PTV-B, despite both viruses growing to approximately the same peak burden (Fig. 5A). Having been passed once through hamsters, our PTV-A stock was thought to be less adapted for growth in vitro compared to PTV-B. However, we found no significant growth difference between the current stock and a PTV-A stock passaged strictly in cell culture (data not shown). Previous work by Perrone and colleagues did not report a strain difference in growth in Vero cells (Perrone et al., 2007); however, differences in passage history and the MOI used in the present study may have contributed to the slight PTV-B growth advantage we observed in Vero 76 cells.
Figure 5.
PTV growth in (A) Vero 76 and (B) primary macrophage cultures. Cells were infected with PTV-A or PTV-B at an MOI of 0.0005. Virus titers on the indicated days p.i. were resolved by CCID50 determination in Vero 76 cells. Growth curves in Vero 76 cells differed significantly by two-way ANOVA (p<0.0001). Data are representative of three independent experiments with Vero 76 or macrophages. * p<0.05.
In primary macrophages exposed to the same low infectious dose (MOI 0.0005) of PTV strains, viral replication was only evident during the first 2 days of infection, reaching ~3.7 log10 CCID50/ml on day 1 and peaking at ~4.6 log10 CCID50/ml on day 2 (Fig. 5B). Titers ranging from 4.0 to 4.5 log10 CCID50/ml were sustained through the rest of the 5-day sampling period. Statistical analyses revealed no significant differences in growth efficiencies between the two virus strains in these IFN-competent cells.
PTV-B evokes a potent IFN-β response in mouse primary macrophages
We next investigated PTV induction of IFN-β in primary macrophages. The experiments were conducted similarly to the growth curve studies, but using a higher infectious virus dose (MOI of 0.05). Although a similar pattern of IFN-β expression was observed in the first 48 h of infection, concentrations were significantly (p<0.001) higher in PTV-B samples (Fig. 6). We first saw IFN-β in supernatants beginning at 24 h p.i., at which time PTV-B-infected cells produced ~14-fold more IFN-β than PTV-A-infected cells (374 vs. 27 pg/ml, respectively). IFN-β concentrations peaked at 36 h, reaching 700 pg/ml in PTV-B samples and 133 in PTV-A samples (5.3-fold difference). At 48 h, IFN-β levels in PTV-A samples had diminished and continued to decrease through the remainder of the experiment.
Figure 6.
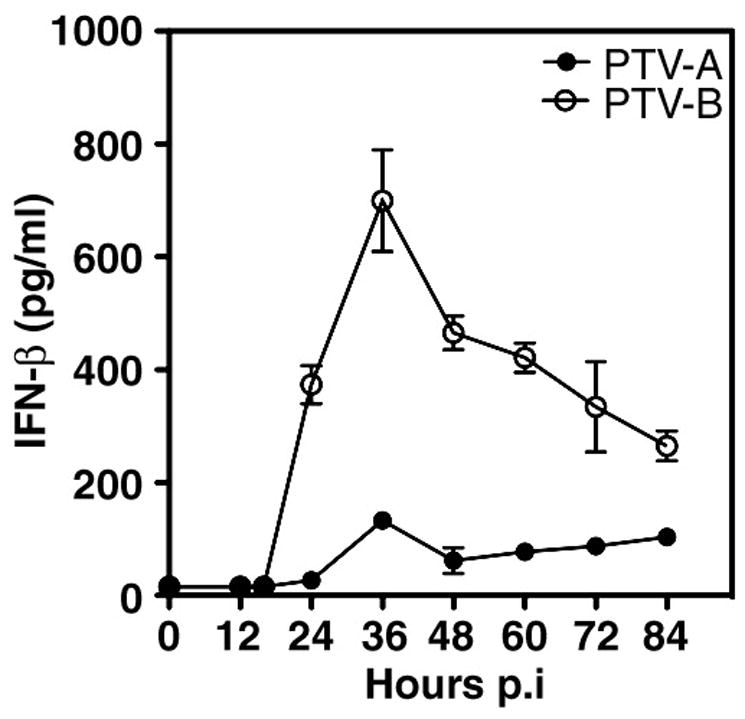
IFN-β release by PTV-infected macrophages. Cells were infected with PTV-A or PTV-B at an MOI of 0.05. At the indicated time points, IFN-β concentration in cell culture supernatants was analyzed by ELISA. IFN-β induction curves differed significantly by two-way ANOVA (p<0.0001). Data are representative of results obtained in two independent experiments. * p<0.001.
PTV strain differences in stimulation of host IFN signaling and response pathways
Although IFN-β production did not significantly impact growth in macrophages, STAT-1 KO mice are unable to control PTV-B infection. This led us to examine the genes involved in the IFN pathways that contribute to host defense and their regulation in response to PTV infections. We harvested total RNA from infected primary mouse macrophages and measured IFN and related genes by quantitative RT-PCR arrays to determine differences in expression. There were a large number of gene expression changes comparing the 0 h time point, to the other respective time points for each of the PTV infections (Supplementary data); however, the focus of our effort was to investigate differences between PTV-A- and PTV-B-infected cells. Although several genes in the IFN signaling and response pathways were induced when macrophages were infected with either PTV, Ifnb1 was the only one that differed significantly (p=0.019) between the two infections at 16 h, with PTV-B-infected macrophages having a 4.7-fold increase in expression relative to PTV-A-infected cells (Fig. 7). Complete information regarding the overall gene expression profiles during infection with a particular virus at each time point can be found in the supplementary data tables and figures.
Figure 7.

Expression patterns over time of genes with significant differences between PTV-A and PTV-B-infected peritoneal macrophages at one or more time points. Cells were infected at an MOI of 0.05 and total RNA was collected at the indicated time points. Samples were analyzed by qRT-PCR gene expression arrays. Fold-change represents the change in gene expression from time 0 to the indicated time point. *p<0.05. Ifnb: interferon-β; Ifna: interferon-α; Isg: interferon-stimulated gene; Iigp: interferon-inducible GTPase; Cxcl: chemokine (C-X-C motif) ligand; Il: interleukin; Vcam: vascular cell adhesion molecule; Socs: suppressor of cytokine stimulation; Tnfsf: tumor necrosis factor super family; Ifngr: interferon-γ receptor; D430028G21Rik: Riken cDNA D430028G21 gene (or Visa: virus-induced signaling adaptor); Myc: myelocytomatosis gene; Rb: retinoblastoma gene; Ifi: interferon inducible gene.
By 24 h p.i., 16 genes varied significantly (p<0.05) between samples infected with PTV-A and PTV-B (Fig. 7). Ifnb1 expression continued to be significantly greater in cells exposed to PTV-B (4.4-fold higher) compared to PTV-A infection. Other genes that were induced at higher levels by PTV-B included multiple IFN-α subtypes, Ifna1 (4.3-fold), Ifna2 (3.8-fold), Ifna5 (4.7-fold), and Ifnab (8.6-fold), interferon-inducible proteins, Isg20 (1.9-fold) and Iigp1 (2.7-fold), and inflammatory molecules such as Cxcl10 (5.3-fold), Cxcl11 (6.8-fold), Il6 (5.4-fold), Vcam1 (3.2-fold), and Socs1 (2.5-fold). Expression of Tnfsf10 (2.1-fold), a gene product that induces apoptosis, is also significantly higher in PTV-B infection. Genes whose expression was comparatively lower in PTV-B samples included Ifngr (−2.1-fold), Rb1 (−1.7-fold), and D430028G21Rik (VISA) (−1.8-fold). At 36 h p.i., six of the aforementioned genes continued to exhibit increased expression in PTV-B-infected cells (Fig. 7). These included Cxcl10 (3.4-fold), Iigp1 (2.5-fold), Socs1 (2.4-fold), Cxcl11 (5.3-fold), Il6 (8.4-fold), and Vcam1 (3.2-fold). Cxcl9 also demonstrated increased expression in PTV-B infected cells at 36 h with a fold-change of 2.8 relative to PTV-A. At 48 h p.i., Cxcl11 was the only gene that continued to be significantly upregulated (4.4-fold) in PTV-B samples compared to PTV-A (Fig. 7). However, Ifi203 and Myc both demonstrated decreased levels of expression of −2.2- and −2.9-fold, respectively.
DISCUSSION
Pathological findings in 8-week-old mice were consistent with those reported previously in PTV-A-infected weanling mice (Pifat and Smith, 1987), as we observed severe hepatocellular necrosis in the liver and lympholysis in the spleen as the most pronounced lesions. PTV-A-induced disease in hamsters is also associated with severe liver and spleen pathology, but other organs are significantly affected as well (Fisher et al., 2003). Notably, the duodenum is targeted during infection in hamsters resulting in severe enteritis that is thought to be a central factor contributing to death (Anderson et al., 1990). No pathological changes were observed in the duodenum of infected mice in the current study, although mild necrosis was observed in the small intestines of 4-week-old animals (Pifat and Smith, 1987). The splenic lesions in hamsters are localized to the red pulp (Anderson et al., 1990), while we observed lympholysis in the white pulp of mice, consistent with previous findings in 4-week-old animals (Pifat and Smith, 1987). Nevertheless, the disease pathology in mice models that seen in natural RVFV infections of domestic livestock and humans (Swanepoel and Coetzer, 1994), with the liver being the principally affected organ.
The difference in virulence between the Adames and Balliet strains of PTV is thought to be at least partially attributed to the suppression of the host IFN response by PTV-A. Similar to RVFV (Billecocq et al., 2004; Bouloy et al., 2001), PTV-A contains an NS protein coded on its S segment that exhibits IFN-antagonistic activity in the hamster system by repressing activation of the IFN-β promoter (Perrone et al., 2007). Mouse macrophages demonstrate a subdued IFN-β response to infection with PTV-A when compared to PTV-B-infected macrophages. Whether the reduced levels are due to direct antagonism or reduced capacity to induce IFN-β in mouse macrophages remains to be determined. However, robust induction of IFN-β in these cells at the site of PTV-B challenge is likely the principal reason the virus is unable to cause disease.
One key difference that we found between the mouse and hamster models is that PTV-B does not induce detectable systemic IFN-β in mice. This is likely due to the lack of productive PTV-B dissemination into the blood. In PTV-infected hamsters, PTV-B induces type I IFN earlier during infection than PTV-A, with similar titers reached by 72 h p.i. (Perrone et al., 2007). In contrast to mice, PTV-B infection in hamsters does reach detectable viral loads in the blood. Thus, it is not surprising that animals that have little to no systemic virus would not elicit high levels of circulating IFN. In an attempt to produce a systemic infection to evoke a better IFN response, we also tried i.p. inoculation, but still detected no circulating virus. We speculate that due to a more effective IFN response to PTV-B at the site of inoculation, animals are able to control the virus locally before extensive dissemination is achieved.
STAT-1 is a key component in the IFN signaling pathway (Akira, 1999; Haller et al., 2006), and therefore, eliminating its function effectively knocks out the IFN response circuit. To this end, our findings rendering mice that are lacking in this pathway susceptible to PTV-B infection indicate that the virus is controlled principally by the IFN response since WT mice do not develop disease. However, pathogenic differences between PTV-A and PTV-B are not completely attributable to regulation within the IFN response, as STAT-1 deficient animals challenged with PTV-A succumbed to infection on average >2 days earlier than those challenged with PTV-B (p=0.0026). In fact, even WT mice challenged with PTV-A succumbed earlier than did KO mice challenged with PTV-B (p=0.0058). Moreover, KO mice infected with PTV-A succumbed to infection in less time and developed higher viral burdens compared their WT counterparts. Interestingly, the lack of STAT-1 resulted in PTV-A infection in the brain, which is not normally seen in WT mice. The lower viral burden in the WT animals likely limits inflammation and permeability of the blood-brain barrier, as previously seen in studies of West Nile virus infection in mice (Wang et al., 2004). Collectively, these data suggest that in addition to the IFN response, other mechanisms contribute to PTV-A’s increased pathogenicity in mice.
In previous work by Perrone and coworkers, neither strain of PTV had a growth advantage in interferon-incompetent Vero cells, but PTV-A had an obvious advantage in primary hamster embryonic fibroblasts (Perrone et al., 2007). Though we anticipated that PTV-A would have a growth advantage in primary mouse macrophages, as it did in hamster embryonic fibroblasts (Perrone et al., 2007), this was not the case. PTV-B stimulates early IFN-β induction in hamster embryonic fibroblasts, approximately two-fold higher than PTV-A (Perrone et al., 2007), consequently leading to reduced viral replication. It would seem probable that since PTV-B is a better inducer of IFN in macrophages that its growth would be inhibited compared to PTV-A. The loss of the PTV-B growth advantage in IFN-incompetent Vero 76 cells may be due to the effect of higher IFN induction in PTV-B-infected macrophages. The more restricted viral replication observed in macrophages suggests that these cells are not as accommodating to PTV growth as the hamster fibroblasts. The fact that macrophages and fibroblasts are such vastly different cell types could also help explain the observed differences.
To more fully understand the mechanisms involved in resistance to PTV-B, we examined expression of a variety of IFN and related genes in mouse macrophages. We found that regulatory mechanisms of IFN-β production likely occur at the gene transcription level, as there is a significant >4 fold increase the amount of IFN-β RNA in macrophages infected with PTV-B compared to PTV-A at 16 h p.i. This is consistent with previous findings by Perrone and colleagues that showed a ~3-fold increase in the IFN-β promoter by PTV-B (Perrone et al., 2007). By comparison, IFN signaling pathways are down-regulated at later time points in PTV-A-infected macrophages, particularly 24 and 36 h p.i. Multiple genes encoding IFN-α subtypes were induced 3–9-fold higher in PTV-B-infected cells at 24 h.
PTV-B-infected macrophages also demonstrated increased transcription of a number of proinflammatory cytokines and chemokines compared to PTV-A-infected cells. In vivo, these molecules could lead to early and localized control of the virus, preventing dissemination. Il6, Cxcl9, Cxcl10, Cxcl11, Vcam1 code for inflammatory proteins that can contribute to temperature modulation and leukocyte migration to the site of infection. We found that these molecules were expressed at higher levels in macrophages infected with PTV-B compared to those infected with PTV-A, which indicates a stronger proinflammatory response elicited by PTV-B.
We did not see significant transcriptional changes in the most commonly known IFN response genes, such as Eif2ak2 (PKR), Oas, or Mx genes, as a result of increased levels of type I IFNs early in infection with PTV-B. However, Isg20 was expressed ~2-fold higher in PTV-B-infected macrophages than PTV-A at 24 h p.i. (p<0.05). Isg20 is the second known RNase, along with RNaseL, to be regulated by interferon (Nguyen et al., 2001) and its expression can be regulated by IFNs in PKR-, RNase L- and Mx-deficient fibroblasts, demonstrating an independent regulatory mechanism from these common IFN-induced molecules (Espert et al., 2003). Isg20 possesses antiviral properties against RNA viruses, specifically vesicular stomatitis virus (VSV), influenza, and encephalomyocarditis viruses, but not the DNA genomic adenovirus (Espert et al., 2003). As Isg20 does not require functional PKR, RNase L, or Mx proteins, it is assumed to serve as an alternative antiviral pathway to those already well-described.
Also of interest, Iigp1 (interferon-inducible GTPase 1) transcription was found to be upregulated ~2.7-fold at 24 h p.i and ~2.4-fold at 36 h (p<0.05) in response to infection of macrophages with PTV-B relative to PTV-A. Iigp1 codes for a protein belonging to a family of 47-kDa GTPases whose members are present at low basal levels in mouse cells but are induced by IFNs and are implicated in resistance to intracellular pathogens (Carlow et al., 1998; Uthaiah et al., 2003; Zerrahn et al., 2002). The function of IIGP1 in host antiviral defense has not yet been assessed, but IIGP1 shares several similar biochemical properties to other known GTPases with antiviral activities against ssRNA viruses, such as the Mx proteins (Uthaiah et al., 2003). The human protein MxA interferes with RVFV replication, allegedly through association with the viral RNA polymerase (Carlow et al., 1998).
As elucidated in these studies, IFN plays a critical role in survival of mice infected with PTV-B. These results further support the use of type I IFN as a potential treatment for phleboviral disease. A recombinant IFN-α, Interferon alfacon-1, demonstrates appreciable efficacy against PTV infection in hamsters when given up to 72 h after infection (Gowen et al., 2008). Further, recombinant IFNs have proven effective against RVFV in rhesus monkeys when administered 24 h prior to, or 6 h after infection (Morrill et al., 1989). Although these results suggest that therapeutic IFN intervention would be useful in treating phleboviral disease, efficacy appears to require early intervention, and cost associated with recombinant IFN treatments would likely be prohibitive for use in remote underdeveloped areas the world where RVF is endemic. Nevertheless, treatments targeting the stimulation of the IFN pathway could prove to be particularly effective against phleboviral infection, and should continue to be explored.
MATERIALS AND METHODS
Animals
C57BL/6J mice were from Jackson Laboratories (Bar Harbor, ME) and 129S6/SvEv and STAT-1 knockout (KO) mice (129S6 background) were from Taconic (Hudson, NY). Animals were quarantined for 6 days prior to beginning studies in the animal facility at Utah State University under specific pathogen-free conditions. All animal procedures used in these studies complied with guidelines set by the U.S. Department of Agriculture and the Utah State University Animal Care and Use Committee.
Cells and viruses
Vero 76 (African green monkey kidney) and LLC-MK2 (rhesus monkey kidney) cells were from American Type Culture Collection (ATCC, Manassas, VA). Cells were maintained in Minimal Essential Medium (MEM) supplemented with 10% Fetal Bovine Serum (FBS) or 5% FBS for Vero 76 and LLC-MK2 cells, respectively. The Adames strain of PTV was provided by Dominique Pifat of the U.S. Army Medical Research Institute for Infectious Diseases (USAMRIID, Frederick MD). It was passaged 4 times in LLC-MK2 cells and once in hamsters. The virus was originally isolated from the serum of a patient in eastern Panama in 1972. The Balliet strain of PTV was from ATCC. It was passaged twice in LLC-MK2 cells. The Balliet virus was originally isolated from a patient in western Panama in 1966. Both virus strains were further passaged twice in Vero 76 cells. Strains were verified by quantitative RT-PCR (data not shown). All media, serum, supplements, and buffers were from Hyclone Laboratories (Logan, UT).
Virus stocks were initially titrated in mice to determine the most appropriate infectious dose. Based on these titrations, the 90–100% lethal doses (LD90-100) were chosen for subsequent challenge experiments discussed below. All virus inoculations were by subcutaneous (s.c.) injection, unless otherwise indicated.
Experimental design
For pathology and IFN analysis studies, C57BL/6J mice were challenged with 2,000 CCID50 of PTV. Groups of 7 mice were sacrificed daily, 3 PTV-A-infected, 3 PTV-B-infected and 1 sham-infected. Serum, liver, spleen, adrenal gland, and brain were collected from each. A section of each tissue was fixed in formalin for 24 h. The remaining portions of each tissue were stored at −80° until time of use for virus titer analysis. Tissues were diluted and homogenized in MEM. Due to the small size of the adrenal gland, accurate gram weights were unobtainable. Therefore, we added a set volume per tissue of 0.5 ml/adrenal gland for homogenization.
For challenge studies in STAT-1-deficient mice, 129S6 WT and STAT-1 KO mice were challenged with 3.2 × 10⁴ CCID50 of PTV and monitored for signs of illness and death. Serum, liver, spleen, and brain were harvested from moribund animals for virus load and ALT quantification.
Virus, ALT, and IFN-β quantification
Serum and homogenized tissue samples were serially log10 diluted and plated on LLC-MK2 cells in 96-well microplates for quantification of virus by an infectious cell culture assay, as previously described (Gowen et al., 2007a). Viral cytopathic effect (CPE) was determined 7 days post-virus inoculation, and the 50% endpoints were calculated as described (Reed and Muench, 1938). The limit of detection for most tissues was 2.8 log10 CCID50/g. The detection limit for adrenal gland was 0.45 log10 CCID50/tissue. Serum virus was detectable to 1.8 log10 CCID50/ml. In samples presenting with undetectable tissue or serum virus, a value equal to the lowest limit of detection was assigned, and therefore, mean values for groups of animals wherein undetectable virus levels were present are likely an overestimation of the actual average.
To assess liver damage, serum ALT concentration was used as a marker (Amacher, 1998). Levels were measured in serum samples using the ALT (SGPT) Reagent Set (Pointe Scientific, Lincoln Park, MI). The reagent volumes were adjusted for analysis on 96-well microplates.
IFN-β concentration in the serum samples was determined by ELISA (PBL Interferon Source, Piscataway, NJ) according to the manufacturer’s instructions. All serum samples were diluted 1:5 or 1:10 and tested in duplicate wells.
PTV Growth in Vero 76 and PECs
Mouse peritoneal exudate cells were harvested by peritoneal lavage from C57BL/6J mice 4 days after i.p. injection with 1 ml sterile aged thioglycollate broth. Cells were plated in 96-well plates in RPMI containing antibiotics. Two h after plating, the nonadherent cells were removed by splashing off media and replacing with RPMI with 10% FBS and antibiotics. The resulting cell population was >90 macrophages, as previously described (Gowen et al., 2000).
Virus growth was determined in Vero 76 cells and peritoneal macrophages. A multiplicity of infection (MOI) of ~0.0005 of PTV strains was used to infect cell monolayers. Supernatants were collected from triplicate wells on each day from 0–6 days p.i. Samples were frozen and stored at −80°C until time of use. Samples were plated on Vero 76 cells in serial log10 dilutions and virus CCID50s were determined.
IFN induction and related gene expression in primary macrophages
For IFN induction and gene expression studies, primary macrophages were plated in 96-well plates and infected with ~3× 10³ CCID50 of each PTV strain (MOI of 0.05). Supernatants were collected from triplicate wells at 0, 12, 16, 24, 36, 48, 60, 72, and 84 h p.i. IFN-β in supernatants was measured by ELISA.
At 0, 16, 24, 36, and 48 h p.i., total RNA was collected for use in gene expression studies with Qiagen’s (Valencia, CA) RNeasy Mini Kit following the manufacturer’s instructions. One μl Superase-In (Ambion, Austin, TX) was added to each 50 μl RNA sample to protect RNA from degradation. Genomic DNA was eliminated using Ambion’s DNA free system. Quality of RNA samples was determined using Experion’s Automated Electrophoresis (Bio-Rad, Hercules, CA) at the Center for Integrated BioSystems (Utah State University, Logan, UT). cDNA was synthesized from RNA samples using the Superscript III First-Strand Synthesis System (Invitrogen, Carlsbad, CA). Both oligo-dT primers and random hexamers were used in each synthesis reaction. cDNA samples were diluted 1:20. Interferon signaling and response StellARrays from Bar Harbor Biotechnology (Trenton, ME) were used to detect expression changes of multiple IFN-related genes simultaneously. SYBR GreenER qPCR Supermix Universal (Invitrogen) was used in conjunction with StellARray plates for quantitative real time PCR. Quantitative PCR was performed using an Opticon 2 (Bio-Rad, Hercules, CA) thermal cycler using the following conditions: 95°C for 10 min, 40 cycles of 95°C, 60°C, followed by a dissociation curve reading every 1° C from 30°C to 95°C.
Statistics
Survival curves were evaluated using log-rank analysis. Two-way analysis of variance (ANOVA) was used to detect significance in overall difference between virus strains in growth curves and IFN-induction experiments and Bonferroni post-tests were performed to determine significance at individual time points. Global Pattern Recognition (GPR) software (Bar Harbor Biotechnology) was used to analyze changes in gene expression levels.
Supplementary Material
Figure S1: Expression of IFN and related genes at 16 h p.i. Fold change is relative to gene expression at time 0. * p < 0.05 comparing gene expression in cells infected with PTV-A vs. PTV-B.
Figure S2: Expression of IFN and related genes at 24 h p.i. Fold change is relative to gene expression at time 0. * p < 0.05 comparing gene expression in cells infected with PTV-A vs. PTV-B.
Figure S3: Expression of IFN and related genes at 36 h p.i. Fold change is relative to gene expression at time 0. * p < 0.05 comparing gene expression in cells infected with PTV-A vs. PTV-B.
Figure S4: Expression of IFN and related genes at 48 h p.i. Fold change is relative to gene expression at time 0. * p < 0.05 comparing gene expression in cells infected with PTV-A vs. PTV-B.
Acknowledgments
We thank Heather Greenstone and Peter Silvera for critical review of the manuscript. We also thank Kie-Hoon Jung, Lee Audd, Ariane Audd, Cameron Werner, Devin Jones, and John Woolcott for technical support.
This work was supported by contract grant NO1-AI-15435 and NO1-AI-30063 (awarded to Southern Research Institute) from the Virology Branch, National Institute of Allergy and Infectious Diseases, National Institutes of Health, and by the Utah State University Center for Integrated BioSystems Graduate Support Program.
References
- Akira S. Functional roles of STAT family proteins: Lessons from knockout mice. Stem Cells. 1999;17 (3):138–46. doi: 10.1002/stem.170138. [DOI] [PubMed] [Google Scholar]
- Amacher DE. Serum transaminase elevations as indicators of hepatic injury following the administration of drugs. Regul Toxicol Pharmacol. 1998;27 (2):119–30. doi: 10.1006/rtph.1998.1201. [DOI] [PubMed] [Google Scholar]
- Anderson GW, Jr, Slayter MV, Hall W, Peters CJ. Pathogenesis of a phleboviral infection (Punta Toro virus) in golden Syrian hamsters. Arch Virol. 1990;114 (3–4):203–12. doi: 10.1007/BF01310749. [DOI] [PubMed] [Google Scholar]
- Billecocq A, Spiegel M, Vialat P, Kohl A, Weber F, Bouloy M, Haller O. NSs protein of Rift Valley fever virus blocks interferon production by inhibiting host gene transcription. J Virol. 2004;78 (18):9798–806. doi: 10.1128/JVI.78.18.9798-9806.2004. [DOI] [PMC free article] [PubMed] [Google Scholar]
- Bouloy M, Janzen C, Vialat P, Khun H, Pavlovic J, Huerre M, Haller O. Genetic evidence for an interferon-antagonistic function of rift valley fever virus nonstructural protein NSs. J Virol. 2001;75 (3):1371–7. doi: 10.1128/JVI.75.3.1371-1377.2001. [DOI] [PMC free article] [PubMed] [Google Scholar]
- Carlow DA, Teh SJ, Teh HS. Specific antiviral activity demonstrated by TGTP, a member of a new family of interferon-induced GTPases. J Immunol. 1998;161 (5):2348–55. [PubMed] [Google Scholar]
- CDC. Outbreak of Rift Valley fever--Saudi Arabia, August-October, 2000. MMWR Morb Mortal Wkly Rep. 2000a;49 (40):905–8. [PubMed] [Google Scholar]
- CDC. Outbreak of Rift Valley fever--Yemen, August-October 2000. MMWR Morb Mortal Wkly Rep. 2000b;49 (47):1065–6. [PubMed] [Google Scholar]
- CDC. Rift Valley fever outbreak--Kenya, November 2006-January 2007. MMWR Morb Mortal Wkly Rep. 2007;56 (4):73–6. [PubMed] [Google Scholar]
- Emeny JM, Morgan MJ. Regulation of the interferon system: Evidence that Vero cells have a genetic defect in interferon production. J Gen Virol. 1979;43 (1):247–52. doi: 10.1099/0022-1317-43-1-247. [DOI] [PubMed] [Google Scholar]
- Espert L, Degols G, Gongora C, Blondel D, Williams BR, Silverman RH, Mechti N. ISG20, a new interferon-induced RNase specific for single-stranded RNA, defines an alternative antiviral pathway against RNA genomic viruses. J Biol Chem. 2003;278 (18):16151–8. doi: 10.1074/jbc.M209628200. [DOI] [PubMed] [Google Scholar]
- Fisher AF, Tesh RB, Tonry J, Guzman H, Liu D, Xiao SY. Induction of severe disease in hamsters by two sandfly fever group viruses, Punta toro and Gabek Forest (Phlebovirus, Bunyaviridae), similar to that caused by Rift Valley fever virus. Am J Trop Med Hyg. 2003;69 (3):269–76. [PubMed] [Google Scholar]
- Gowen BB, Borg TK, Ghaffar A, Mayer EP. Selective adhesion of macrophages to denatured forms of type I collagen is mediated by scavenger receptors. Matrix Biol. 2000;19 (1):61–71. doi: 10.1016/s0945-053x(99)00052-9. [DOI] [PubMed] [Google Scholar]
- Gowen BB, Fairman J, Dow S, Troyer R, Wong MH, Jung KH, Melby PC, Morrey JD. Prophylaxis with cationic liposome-DNA complexes protects hamsters from phleboviral disease: Importance of liposomal delivery and CpG motifs. Antiviral Res. 2009;81 (1):37–46. doi: 10.1016/j.antiviral.2008.09.001. [DOI] [PMC free article] [PubMed] [Google Scholar]
- Gowen BB, Hoopes JD, Wong MH, Jung KH, Isakson KC, Alexopoulou L, Flavell RA, Sidwell RW. TLR3 deletion limits mortality and disease severity due to Phlebovirus infection. J Immunol. 2006a;177 (9):6301–7. doi: 10.4049/jimmunol.177.9.6301. [DOI] [PubMed] [Google Scholar]
- Gowen BB, Smee DF, Wong MH, Judge JW, Jung KH, Bailey KW, Pace AM, Rosenberg B, Sidwell RW. Recombinant Eimeria protozoan protein elicits resistance to acute phlebovirus infection in mice but not hamsters. Antimicrob Agents Chemother. 2006b;50 (6):2023–9. doi: 10.1128/AAC.01473-05. [DOI] [PMC free article] [PubMed] [Google Scholar]
- Gowen BB, Wong MH, Jung KH, Blatt LM, Sidwell RW. Prophylactic and therapeutic intervention of Punta Toro virus (Phlebovirus, Bunyaviridae) infection in hamsters with interferon alfacon-1. Antiviral Res. 2008;77 (3):215–24. doi: 10.1016/j.antiviral.2007.12.002. [DOI] [PMC free article] [PubMed] [Google Scholar]
- Gowen BB, Wong MH, Jung KH, Sanders AB, Mendenhall M, Bailey KW, Furuta Y, Sidwell RW. In vitro and in vivo activities of T-705 against arenavirus and bunyavirus infections. Antimicrob Agents Chemother. 2007a;51 (9):3168–76. doi: 10.1128/AAC.00356-07. [DOI] [PMC free article] [PubMed] [Google Scholar]
- Gowen BB, Wong MH, Jung KH, Sanders AB, Mitchell WM, Alexopoulou L, Flavell RA, Sidwell RW. TLR3 is essential for the induction of protective immunity against Punta Toro Virus infection by the double-stranded RNA (dsRNA), poly(I:C12U), but not Poly(I:C): differential recognition of synthetic dsRNA molecules. J Immunol. 2007b;178 (8):5200–8. doi: 10.4049/jimmunol.178.8.5200. [DOI] [PubMed] [Google Scholar]
- Haller O, Kochs G, Weber F. The interferon response circuit: Induction and suppression by pathogenic viruses. Virology. 2006;344 (1):119–30. doi: 10.1016/j.virol.2005.09.024. [DOI] [PMC free article] [PubMed] [Google Scholar]
- Le May N, Dubaele S, Proietti De Santis L, Billecocq A, Bouloy M, Egly JM. TFIIH transcription factor, a target for the Rift Valley hemorrhagic fever virus. Cell. 2004;116 (4):541–50. doi: 10.1016/s0092-8674(04)00132-1. [DOI] [PubMed] [Google Scholar]
- Le May N, Mansuroglu Z, Leger P, Josse T, Blot G, Billecocq A, Flick R, Jacob Y, Bonnefoy E, Bouloy M. A SAP30 complex inhibits IFN-beta expression in Rift Valley fever virus infected cells. PLoS Pathog. 2008;4 (1):e13. doi: 10.1371/journal.ppat.0040013. [DOI] [PMC free article] [PubMed] [Google Scholar]
- Marie I, Durbin JE, Levy DE. Differential viral induction of distinct interferon-alpha genes by positive feedback through interferon regulatory factor-7. EMBO J. 1998;17 (22):6660–9. doi: 10.1093/emboj/17.22.6660. [DOI] [PMC free article] [PubMed] [Google Scholar]
- Morrill JC, Jennings GB, Cosgriff TM, Gibbs PH, Peters CJ. Prevention of Rift Valley fever in rhesus monkeys with interferon-alpha. Rev Infect Dis. 1989;11(Suppl 4):S815–25. doi: 10.1093/clinids/11.supplement_4.s815. [DOI] [PubMed] [Google Scholar]
- Mosca JD, Pitha PM. Transcriptional and posttranscriptional regulation of exogenous human beta interferon gene in simian cells defective in interferon synthesis. Mol Cell Biol. 1986;6 (6):2279–83. doi: 10.1128/mcb.6.6.2279. [DOI] [PMC free article] [PubMed] [Google Scholar]
- Muller R, Saluzzo JF, Lopez N, Dreier T, Turell M, Smith J, Bouloy M. Characterization of clone 13, a naturally attenuated avirulent isolate of Rift Valley fever virus, which is altered in the small segment. Am J Trop Med Hyg. 1995;53 (4):405–11. doi: 10.4269/ajtmh.1995.53.405. [DOI] [PubMed] [Google Scholar]
- Nguyen LH, Espert L, Mechti N, Wilson DM., 3rd The human interferon- and estrogen-regulated ISG20/HEM45 gene product degrades single-stranded RNA and DNA in vitro. Biochemistry. 2001;40 (24):7174–9. doi: 10.1021/bi010141t. [DOI] [PubMed] [Google Scholar]
- NIAID. The Counter-Bioterroroism Research Agenda of the National Institute of Allergy and Infectious Diseases (NIAID) for CDC Category A Agents. Bethesda: 2002. [Google Scholar]
- Perrone LA, Narayanan K, Worthy M, Peters CJ. The S segment of Punta Toro virus (Bunyaviridae, Phlebovirus) is a major determinant of lethality in the Syrian hamster and codes for a type I interferon antagonist. J Virol. 2007;81 (2):884–92. doi: 10.1128/JVI.01074-06. [DOI] [PMC free article] [PubMed] [Google Scholar]
- Pifat DY, Smith JF. Punta Toro virus infection of C57BL/6J mice: A model for phlebovirus-induced disease. Microb Pathog. 1987;3 (6):409–22. doi: 10.1016/0882-4010(87)90011-8. [DOI] [PubMed] [Google Scholar]
- Reed LJ, Muench H. A simple method of estimating fifty percent endpoints. American Journal of Hygiene. 1938;27 (3):493–7. [Google Scholar]
- Sidwell RW, Huffman JH, Barnard DL, Pifat DY. Effects of ribamidine, a 3-carboxamidine derivative of ribavirin, on experimentally induced Phlebovirus infections. Antiviral Res. 1988a;10 (4–5):193–207. doi: 10.1016/0166-3542(88)90031-9. [DOI] [PubMed] [Google Scholar]
- Sidwell RW, Huffman JH, Barnett BB, Pifat DY. In vitro and in vivo Phlebovirus inhibition by ribavirin. Antimicrob Agents Chemother. 1988b;32 (3):331–6. doi: 10.1128/aac.32.3.331. [DOI] [PMC free article] [PubMed] [Google Scholar]
- Swanepoel R, Coetzer JAW. Rift Valley Fever. In: Coetzer JAW, Thomson GR, Tustin RC, editors. Infectious Diseases of Livestock : With Special Reference to Southern Africa. Vol. 1. Cape Town; New York: Oxford University Press; 1994. pp. 443–459. 2 vols. [Google Scholar]
- Uthaiah RC, Praefcke GJ, Howard JC, Herrmann C. IIGP1, an interferon-gamma-inducible 47-kDa GTPase of the mouse, showing cooperative enzymatic activity and GTP-dependent multimerization. J Biol Chem. 2003;278 (31):29336–43. doi: 10.1074/jbc.M211973200. [DOI] [PubMed] [Google Scholar]
- Wang T, Town T, Alexopoulou L, Anderson JF, Fikrig E, Flavell RA. Toll-like receptor 3 mediates West Nile virus entry into the brain causing lethal encephalitis. Nat Med. 2004;10 (12):1366–73. doi: 10.1038/nm1140. [DOI] [PubMed] [Google Scholar]
- Zerrahn J, Schaible UE, Brinkmann V, Guhlich U, Kaufmann SH. The IFN-inducible Golgi- and endoplasmic reticulum- associated 47-kDa GTPase IIGP is transiently expressed during listeriosis. J Immunol. 2002;168 (7):3428–36. doi: 10.4049/jimmunol.168.7.3428. [DOI] [PubMed] [Google Scholar]
Associated Data
This section collects any data citations, data availability statements, or supplementary materials included in this article.
Supplementary Materials
Figure S1: Expression of IFN and related genes at 16 h p.i. Fold change is relative to gene expression at time 0. * p < 0.05 comparing gene expression in cells infected with PTV-A vs. PTV-B.
Figure S2: Expression of IFN and related genes at 24 h p.i. Fold change is relative to gene expression at time 0. * p < 0.05 comparing gene expression in cells infected with PTV-A vs. PTV-B.
Figure S3: Expression of IFN and related genes at 36 h p.i. Fold change is relative to gene expression at time 0. * p < 0.05 comparing gene expression in cells infected with PTV-A vs. PTV-B.
Figure S4: Expression of IFN and related genes at 48 h p.i. Fold change is relative to gene expression at time 0. * p < 0.05 comparing gene expression in cells infected with PTV-A vs. PTV-B.