

Abstract
Alzheimer’s disease (AD) brains are characterized by accumulation of amyloid-ß protein (Aβ) and neuroinflammation. Increased blood-to-brain influx and decreased brain-to-blood efflux across the blood-brain barrier (BBB) have been proposed as mechanisms for Aß accumulation. Epidemiological studies suggest that the nonsteroidal anti-inflammatory drug (NSAID) indomethacin slows the progression of AD. We hypothesized that inflammation alters BBB handling of Aß. Mice treated with lipopolysaccharide (LPS) had increased brain influx and decreased brain efflux of Aβ, recapitulating the findings in AD. Neither influx nor efflux was mediated by LPS acting directly on BBB cells. Increased influx was mediated by a blood-borne factor, indomethacin-independent, blocked by the triglyceride triolein, and not related to expression of the blood-to-brain transporter of Aß, RAGE. Serum levels of IL-6, IL-10, IL-13, and MCP-1 mirrored changes in Aß influx. Decreased efflux was blocked by indomethacin and accompanied by decreased protein expression of the brain-to-blood transporter of Aß, LRP-1. LPS paradoxically increased expression of neuronal LRP-1, a major source of Aß. Thus, inflammation potentially increases brain levels of Aß by three mechanisms: increased influx, decreased efflux, and increased neuronal production.
Keywords: Alzheimer’s disease, Inflammation, Blood-brain barrier, Lipopolysaccharide, Cytokine, Amyloid beta protein
INTRODUCTION
Alzheimer’s disease (AD) is characterized by elevated levels of amyloid beta protein (Aß) in brain (Hardy & Selkoe, 2002). However, the increased level of Aß in AD in rarely caused by an overexpression of amyloid precursor protein (APP), but rather by an impaired clearance of Aß from the brain. Most work has focused on altered enzymatic activities as causing this impaired clearance (Selkoe & Wolfe, 2007), but the blood-brain barrier (BBB) has also been proposed to play a role (Deane et al., 2004b). Aß is transported by RAGE (receptor for advanced glycation end products) into (Martel et al., 1996; Bell et al., 2006; Deane et al., 2003; Maness et al., 1994) and by LRP-1 (low density lipoprotein receptor-related protein-1) out of (Banks et al., 2003; Deane et al., 2004a; Shibata et al., 2000; Ghersi-Egea et al., 1996) the brain. Both increased blood-to-brain transport (LaRue et al., 2004) and impaired brain-to-blood transport of Aß (Deane et al., 2004b) across the blood-brain barrier (BBB) have been proposed to occur in AD. Evidence is particularly strong for the neurovascular hypothesis, which states that decreased Aß clearance by the BBB contributes to Aβ accumulation and the progression of AD (Deane et al., 2008). For example, AD patients as well as animal models of AD have a decreased rate of Aß clearance across the BBB (Banks et al., 2003; Bell et al., 2006; Zlokovic, 2004) and knockdown of LRP-1 expression results in decreased clearance of Aß, increased brain levels of Aß, and cognitive impairments (Jaeger et al., 2009).
The underlying cause of altered handling of Aß by the BBB, however, is unknown. One possible cause could be inflammation. Brains from AD patients are characterized by neuroinflammation, including marked astrocytosis, elevated levels of proinflammatory cytokines, and microglial activation (Butterfield et al., 2001; Morley et al., 2002). Systemic inflammatory events can induce neuroinflammation in the central nervous system (CNS). For example, intraperitoneal administration of lipopolysaccharide (LPS) results in neuronal death in the ME7 mouse model of prion disease (Combrinck et al., 2002), increased APP processing and intracellular accumulation of Aβ (Sheng et al., 2003), and altered BBB transport activity (Banks et al., 1999; Xaio et al., 2001). Epidemiologic studies indicate that AD risk positively correlates with proinflammatory cardiovascular risk factors such as diabetes mellitus, hypertension, hypercholesterolemia, and atherosclerosis (Rosendorff et al., 2007), suggesting that chronic systemic inflammation may play a role in the development of AD (Butterfield et al., 2001; Morley et al., 2002). Epidemiologic studies also associate long-term use of nonsteroidal anti-inflammatory drugs (NSAIDs) such as indomethacin with a reduced risk of developing AD and with a later onset, slower progression, and reduced severity of dementia (Townsend & Pratico, 2005).
Here, we tested the hypothesis that inflammation induced by lipopolysaccharide could contribute to the development of AD pathology by altering Aβ transport at the BBB. We used a subacute model of inflammation that injected multiple doses of LPS over 24 h that has been previously used to study BBB function (Marks & Eastman, 1990; Banks et al., 2008b; Nonaka et al., 2004; Nonaka et al., 2005; Xaio et al., 2001). We determined whether influx into brain or efflux out of brain was altered and whether such alterations were mediated directly by LPS on the brain endothelial cells that compose the BBB, sensitive to indomethacin, or mediated through altered expression of the BBB transporters for Aß, RAGE and LRP-1. We also examined possible roles for serum cytokines and triglycerides, two classes of circulating factors affected by LPS treatment and known to affect BBB transport systems.
MATERIALS AND METHODS
Animals
Male CD-1 mice (6 weeks old) were used in all experiments (Charles River, Wilmington, MA). Food and water were available ad libitum. The mice were maintained in a temperature-controlled (19-23 °C) room with a 12:12 h light-dark cycle (lights on at 0600 h). All procedures were in accordance with NIH Guidelines for the Care and Use of Laboratory Animals and were approved by the animal care committee at the Veterans Affairs Medical Center.
Iodination of Amyloid Beta42 and Albumin
Murine Aß42 (Bachem) was radioactively labeled with 131I (I-Aß) and albumin with 125I (I-Albumin) using the chloramine-T method. Labeled compounds were purified on a Sephadex G-10 column (Sigma-Aldrich, St. Louis, MO).
In vivo methods
Preparation and administration of LPS
LPS from Salmonella typhimurium (Sigma) was dissolved in 0.2 ml of 0.9 % NaCl and administered by intraperitoneal (ip) injection at t = 0, 6, and 24h at doses of 3, 30, 300, or 3,000 microg/kg (Xaio et al., 2001). Four hours after the third LPS injection (t = 28 h), mice were anesthetized with 0.2 ml ip urethane and either I-Aß and I-Albumin [5(105) CPM each] were co-injected intravenously (iv) into the jugular vein (for brain uptake analysis) or I-Aß [5(103) CPM] was injected into the lateral ventricle (for brain efflux analysis).
Preparation and administration of indomethacin
Indomethacin (Sigma) was dissolved in warm saline supplemented with 7 % NaHCO3 (“indomethacin solution”) and administered by ip injection at a dose of 20 mg/kg in a volume of 0.2 ml as a pretreatment 30 min before the administration of 3 mg/kg of LPS as previously described (Xaio et al., 2001). The LPS was given at t = 0, 6 and 24 h and brain of I-Aß studied as outlined above.
Preparation and administration of triolean
Glyceryl trioleate (triolein, Sigma) was prepared as previously described (Banks et al., 2004) and stored overnight at -20 °C. Mice treated with either LPS or saline as described above were anesthetized and 0.2 ml of LR-BSA containing I-Aß + I-Albumin (5 × 10⁵ CPM each) with or without 7.2 mg of triolein injected into the jugular vein. Whole brains and serum were collected 10 min after iv injection and the level of radioactivity was determined with a gamma counter. Results (expressed as brain/serum ratios) were plotted against time (min).
Determination of I-Aß Brain Influx
The blood-to-brain uptake rate for I-Aß was determined using multiple-time regression analysis (Blasberg et al., 1983; Patlak et al., 1983). Briefly, brain/serum ratios were plotted against their exposure times (Expt) and the slope of the linear portion of the relations taken to be the unidirectional influx rate. Experimental clock time was re-expressed as Expt to correct for clearance of I-Aβ from the blood. Expt was calculated from the formula:
where t equals experimental clock time, Cp represents the level of radioactivity in the serum over time and Cpt is the level of radioactivity in the serum at time t. Brain/Serum ratios were calculated from the following formula:
In a separate study, brain uptake at 30 min after bolus iv co-injection of I-Aβ and I-Albumin was assessed. Mice were treated with the three-injection regimen of LPS. Results were expressed as mean brain/serum ratios for I-Aβ corrected for I-Albumin (brain/serum ratios for I-Albumin were subtracted out to correct for any non-specific leakage).
I-Aß clearance from serum
Results (cpm in serum) from the brain influx study above were expressed as the percent of the injected dose in each milliliter of serum (% Inj/ml). These values were plotted on a graph against their respective time points (min). The % Inj/ml was calculated from the following formula:
Brain Perfusion
As described previously (Banks et al., 2000), mice were anesthetized with urethane, the chest cavity opened, the heart exposed, and the descending thoracic aorta clamped. After we severed the left and right jugular veins, a 21-gauge needle connected to a 20 ml syringe was inserted into the left ventricle of the heart and perfusion fluid [7.19 g/L NaCl, 0.3 g/L KCl, 0.28 g/L CaCl2, 2.1 g/L NaHCO3, 0.16 g/L KH2PO4, 0.17 g/L MgCl2, 0.99 g/L d-glucose and 10 g/L bovine serum albumin (BSA; Sigma), pH = 7.4] containing 2.5(104) CPM/ml each of I-Aß and I-Albumin administered at a rate of 2 ml/min for 5 min. After the brain perfusion was completed, the mouse was decapitated, the brain removed, weighed, and the total level of radioactivity in the brain measured in the gamma counter. To determine the exact amount of radioactivity perfused, three 2 ml samples of the buffer solution were collected from the perfusion apparatus before needle insertion into the heart and counted in the gamma counter.
The brain/perfusion ratio (μl/g) was calculated as:
Results were expressed as mean brain/perfusion ratios for I-Aβ corrected for I-Albumin.
Determination of I-Aß Brain Efflux
As described previously (Banks & Kastin, 1989; Banks et al., 1997), mice were anesthetized, the scalp reflected, and a hole made into the cranium (1.0 mm lateral and 0.5 mm posterior to bregma). One microliter of LR-BSA containing 5 × 10³ CPM of I-Aß was injected into the lateral ventricle of the brain (icv) with a 1.0 μl Hamilton syringe. Mice were decapitated at various time points from 2-20 min after icv injection. The brain was removed and the amount of radioactivity quantified with a gamma counter. The mean of triplicate determinations were expressed as the log of the % of the injected dose per gram of brain (% Inj Dose) and plotted against time (min), where
Results were analyzed by linear regression analysis.
Western Blotting for LRP and RAGE in Microvessels
Brains were collected from mice treated with either saline, LPS, indomethacin or LPS + indomethacin (n = 20/22/group) and microvessels harvested (Gerhart, D. Z. et al. 1988). In brief, microvessels were homogenized on ice in 200-300 μl membrane protein lysis buffer (20 mM Tris HCl, 0 .15 M NaCl, 2 mM EDTA, 1 mM EGTA, 0.5% Triton X-100 and Protease Inhibitor Cocktail no. P8340; all from Sigma-Aldrich) in a 1.5 mL centrifuge tube. Samples were agitated on ice for 30 min, sonicated for 1 min (four 15 s intervals at 25% amplitude), and centrifuged at 14,000 rpm for 5 min at 4 °C. The supernatant was removed and protein levels were quantified with a BCA Protein Assay Kit (Pierce, Rockford, IL). Protein samples (25 μg) were electrophoresed in NuPAGE Novex 3-8 % Tris-Acetate or 4-12 % Bis-Tris precast gels (for LRP and RAGE respectively) with the aid of an XCell SureLock Mini-Cell gel running apparatus (Invitrogen, Carlsbad, CA). Proteins were transferred from the gel onto nitrocellulose membranes (0.45 μm pore size). The membranes were washed in TBS-T (Tris-buffered saline, 10 mM Tris•HCl, 150 mM NaCl, pH = 8.0) supplemented with 0.05 % Tween 20, and blocked with 5 % Blotto non-fat dry milk (Santa Cruz Biotechnology, Santa Cruz, CA) dissolved in TBS-T. To probe the membrane with anti-LRP antibody (Ab), the 5 % milk solution was removed and the membrane was incubated with the Ab, diluted in TBS-T, overnight at 4°C. The anti-RAGE and anti-actin Abs were diluted in TBS-T, 5 % milk. The membranes were washed with TBS-T and the secondary Ab, diluted in TBS-T, was applied for 1 h at room temperature. The membranes were washed with TBS-T and a 1:1 mixture of Supersignal West Pico Stable Peroxide Solution and Supersignal West Pico Luminol/Enhancer Solution (Pierce, Rockford, IL) was added. Bands were visualized by exposure to BioMax XAR Scientific Imaging Film (Kodak) and optical density was quantified using Image J analysis software (National Institute of Health, USA). Polyclonal primary Abs purchased from Santa Cruz Biotechnology were: rabbit anti-LRP-1 Ab for the 515 kDa subunit (H-80, 1:200), rabbit anti-RAGE Ab (H-300: sc-5563, 1:200) and rabbit anti-actin antibody (sc-1616R, 1:5,000). The secondary Abs: goat anti-rabbit (sc-2004, 1:10,000) and goat anti-mouse (sc-2005; 1:10,000) IgGs conjugated to horseradish peroxidase (HRP) were also from Santa Cruz Biotechnologies. A mouse monoclonal anti-LRP-1 Ab for the 85 kDa subunit of LRP was from Calbiochem (5A6, 1:1,000).
Whole Brain Preparation for LRP and Oxidative Stress Measures
Mice were treated with LPS (n =7) or saline (n =6) as described above and the brains homogenized in lysis buffer (pH 7.4) containing 10 mM HEPES buffer, 137 mM NaCl, 4.6 mM KCl, 1.1 mM KH2PO4 and 0.6 mM MgSO4, as well as protease inhibitors leupeptin (0.5 mg/ml), pepstatin (0.7 mg/ml), type II S soybean trypsin inhibitor (0.5 mg/ml) and PMSF (40 mg/ml). After homogenization, samples were sonicated and the protein concentration was determined by the Pierce BCA method (Pierce, Rockford, IL, USA).
For protein carbonyl slot blot analysis (Farr et al., 2003), sample aliquots of 5 μL from control and LPS treated samples were derivatized with 5 μL of 12% sodium dodecyl sulfate (SDS) and 10 μL of 20 mM 2,4-dinitrophenylhydrazine (DNPH) solution for 20 minutes. The samples were neutralized with a 7.5 μL of neutralization solution. 250 ng of the derivatized samples were loaded onto the slot blot apparatus and applied to a nitrocellulose membrane under vacuum pressure.
For HNE/3-NT slot blot analysis (Poon et al., 2004b), sample aliquots of 5 μL from control and LPS treated samples were derivatized with Laemmli buffer (0.125 M Tris base pH 6.8, 4% (v/v) SDS, and 20% (v/v) glycerol, 10 μL) for 20 minutes. 250 ng of the derivatized samples were loaded onto the slot blot apparatus and applied to a nitrocellulose membrane under vacuum pressure. The blots were probed and developed as described in western blotting section.
For immunoprecipitation experiments (Poon et al., 2005), 300 μg of samples were resuspended in a final volume of 500 μl RIPA buffer (10 mM Tris, pH 7.6;140 mM NaCl;0.5% NP40 including protease inhibitors) and then 50 μl of proteinA/G were added. The sample mixture was incubated at 4°C for 1h to remove any inherent immunoglobulin from the samples. Samples were centrifuges at 1,000 × g and supernatant was transferred to a fresh tube and 15 μl of anti-LRP1 antibody were added and the samples and incubated at 4°C overnight. Immunocomplexes were collected using a protein A/G suspension, followed by washing the immunocomplex with immunoprecipitation buffer five times. The final pellet was suspended in 20 μl of deionized water and denatured by adding loading buffer. The HNE-bound to LRP1 protein were detected by Western blotting with rabbit antibody against HNE (1:2000) after protein transfer (see western blot analysis below for details).
For Western blot analysis (Poon et al., 2004a), membranes were incubated for 3 hrs at room temperature with primary antibodies: anti-LRP1 polyclonal antibody (1:1000), anti-HNE (1:5000), anti-3 nitrotyrosine (1:2500), and anti-DNPH antibody (1:200). After washing the blots three times in PBST for 5 min each, blots were incubated with anti-rabbit IgG alkaline phosphatase secondary antibody (1:2000) in PBST for 1 hr at room temperature.
Quantitative RT-PCR of Whole Brain LRP-1 mRNA
RNA was isolated from hemibrains using the Qiagen RNeasy Lipid tissue mini kit protocol from mice treated with LPS (n=6) or NS (n=6) as described above. Total cDNA was produced by reverse transcription (RT) using the Taqman RT system (Applied Biosystems, Foster City, CA) of 0.2 μl of purified RNA, 3 μl 10X RT buffer, 6.6 μl MgCl2, 6 μl 2.5 mM dNTPs, 1.5 μl random hexamers, 0.6 μl Rnase inhibitor, and 0.75 μl Multiscribe RT. Samples were incubated for 10 minutes at 25° C, 30 minutes at 48° C, and 5 minutes at 95°C. Quantitative real-time PCR was performed in an Applied Biosystems 7300 Real-Time PCR System. Amplification was carried out in 25 μl reaction mixtures containing 1 μl of template cDNA, 0.5 μl of each 5 mm primer 12.5 μl 2X SYBR green master mix, and 10.5 μl PCR water. Cycling conditions were one cycle at 95°C for 10 minutes, followed by 50 cycles of 95°C for 15 sec, and 60° for 1 minute followed by one cycle at 95° for 15 seconds, 60° for 15 seconds and 95° for 15 seconds. Primers for quantitative real-time PCR were made using Primer 3 software (Whitehead Institute for Biomedical Research, Cambridge, MA) and primer efficiency was between 95-105%. Sequences were as follows: LRP forward 5’-agtccacatgttccctaccg, reverse 5’-agagccaaggaaggaaagc and Beta Actin forward 5’-ttcctccctggagaagag, reverse 5’- tgccacaggattccatac. The relative amount of gene copies was extrapolated using the comparative Ct method with beta actin as a normalizer and stratagene mouse standard RNA as a calibrator (Stratagene, La Jolla, CA).
Cytokine Detection in Serum
Serum was isolated from mice treated with IP saline, LPS, indomethacin or LPS with indomethacin pretreatment using the three injection protocol described above. Each treatment group contained 4-5 mice and 50 μl of serum was collected from each mouse and tested for cytokine levels with a murine Mass Cytokine/Chemokine Lincoplex Kit (Linco Research; St. Charles, MO) as per manufacturer’s instructions. Results obtained for the 22 cytokines measured by this kit were expressed as the mean level of cytokine (in pg) in each mL of serum.
In vitro methods
Primary culture of mouse brain microvascular endothelial cells (BMECs)
BMECs were isolated and prepared by a modified method of Szabo (Szabo et al., 1997). In brief, cerebral cortices (8-week-old CD-1 mice) were cleaned of meninges, minced, and the homogenate digested with collagenase type II (1 mg/mL; Sigma) and DNase I (30 U/mL; Sigma) in DMEM (Sigma) containing 100 units/mL penicillin, 100 μg/mL streptomycin, 50 μg/mL gentamicin and 2 mM GlutaMAX™-I (Invitrogen, Carlsbad, CA) at 37 °C for 40 min. Neurons and glial cells were removed by centrifugation and the microvessel pellet were further digested. The pellet was reconstituted in DMEM, seeded on 60 mm culture dishes (BD FALCON™, BD Biosciences, Franklin Lakes, NJ) coated with 0.05 mg/mL fibronectin (Sigma), 0.05 mg/mL collagen I (Sigma), and 0.1 mg/mL collagen IV (Sigma) and incubated in DMEM/F-12 (Sigma) supplemented with 20 % plasma derived bovine serum (PDS; Quad Five, Ryegate, MT), 100 units/mL penicillin, 100 μg/mL streptomycin, 50 μg/mL gentamicin, 2 mM GlutaMAX™-I, and 1 ng/mL basic fibroblast growth factor (bFGF; Sigma) at 37 °C with a humidified atmosphere of 5 % CO2/95 % air. To eliminate pericytes, BMECs were treated with 4 μg/mL puromycin (Sigma) for the first 2 days (Perriere et al., 2005). Culture medium was changed every other day. After 7 days in culture, BMECs typically reached 80-90 % confluency.
BMECs (4 × 10⁴ cells/well) were seeded on the inside of the fibronectin-collagen IV (0.1 and 0.5 mg/mL, respectively)-coated polyester membrane (0.33 cm2, 0.4 μm pore size) of a Transwell®-Clear insert (Costar, Corning, NY) placed in the well of a 24-well culture plate (Costar). Cells were cultured in DMEM/F-12 supplemented with 20 % PDS, 100 units/mL penicillin, 100 μg/mL streptomycin, 50 μg/mL gentamicin, 2 mM GlutaMAX™-I, 1 ng/mL bFGF and 500 nM hydrocortisone (Sigma) at 37 °C with a humidified atmosphere of 5 % CO2/95 % air until the BMEC monolayers reached confluency (3 days). To check the integrity of the BMEC monolayers, transendothelial electrical resistance (TEER in Ω × cm2) was measured before the experiments and after an exposure of LPS using an EVOM voltohmmeter equipped with STX-2 electrode (World Precision Instruments, Sarasota, FL). The TEER of cell-free Transwell®-Clear inserts were subtracted from the obtained values.
Pretreatment protocol
LPS (Sigma) was dissolved in serum-free DMEM/F-12. The confluent BMEC monolayers were washed with serum-free DMEM/F-12. LPS (1-100 μg/mL) was added to the luminal side of BMEC monolayers on the Transwell®-Clear inserts, and then BMECs were incubated for 4 h at 37 °C.
Transendothelial transport of I-Aß and I-Albumin
For the transport experiments, the medium was removed and BMECs were washed with physiological buffer containing 1 % BSA (141 mM NaCl, 4.0 mM KCl, 2.8 mM CaCl2, 1.0 mM MgSO4, 1.0 mM NaH2PO4, 10 mM HEPES, 10 mM D-glucose, and 1 % BSA, pH 7.4). The physiological buffer containing 1 % BSA was added to the outside (abluminal chamber; 0.6 mL) of the Transwell® insert. To initiate the transport experiments, 131I-Aß1-42 (1 × 10⁶ cpm/mL) and 125I-albumin (1 × 10⁷ cpm/mL) were loaded on the luminal (100 μL) or abluminal (600 μL) chamber. The side opposite to that to which the radioactive materials were loaded is the collecting chamber. Samples were removed from the collecting chamber at 10, 20, 40, and 60 min and immediately replaced with an equal volume of fresh 1 % BSA/physiological buffer. The permeability coefficient and clearance of TCA-precipitable I-Aß or I-Albumin was calculated according to the method described by Dehouck et al (Dehouck et al., 1992):
Where [C]L is the initial radioactivity in a microliter of loading chamber (in cpm/μL), [C]C is the radioactivity in a microliter of collecting chamber (in cpm/μL), and VC is the volume of collecting chamber (in μL). The volume cleared was plotted versus time, and the slope was estimated by linear regression analysis. The slope of clearance curves for the BMEC monolayer plus Transwell® membrane was denoted by PSapp, where PS is the permeability × surface area product (in μL/min). The slope of the clearance curve with a Transwell® membrane without BMECs was denoted by PSmembrane. The real PS value for the BMEC monolayer (PSe) was calculated from the equation:
The PSe values were divided by the surface area of the Transwell® inserts (0.33 cm2) to generate the endothelial permeability coefficient (Pe, in cm/min).
Statistics
Results were analyzed for statistical significance with Student’s unpaired two-tailed t-test when two means were compared or one-way analysis of variance (ANOVA) followed by Newman-Keuls multiple comparsion post-hoc test when more than two means were compared. Slopes of lines were calculated and compared statistically with the Prism 4.0 package (GraphPad Inc, San Diego, CA).
RESULTS
As a model for systemic inflammation, mice were treated with repeated intraperitoneal (IP) injections of LPS. Figure 1 shows the effects of various concentrations of IP LPS on brain uptake (1A). LPS at 300 μg/kg and 3 mg/kg caused BBB disruption as evidenced by increased uptake of I-Albumin of 1.3 μl/g and 4.3 μl/g, respectively. Analysis by one-way ANOVA showed that LPS treatment resulted in a significant increase in brain uptake of I-Aβ corrected for I-Albumin (F4,30 = 16.45, p < 0.001). The 3 mg/kg dose produced the most significant effect on both influx of I-Aß; therefore, subsequent studies used this dose of LPS.
Figure 1. LPS Increases BBB Transport of I-Aβ in the Blood-to-brain Direction (Influx).
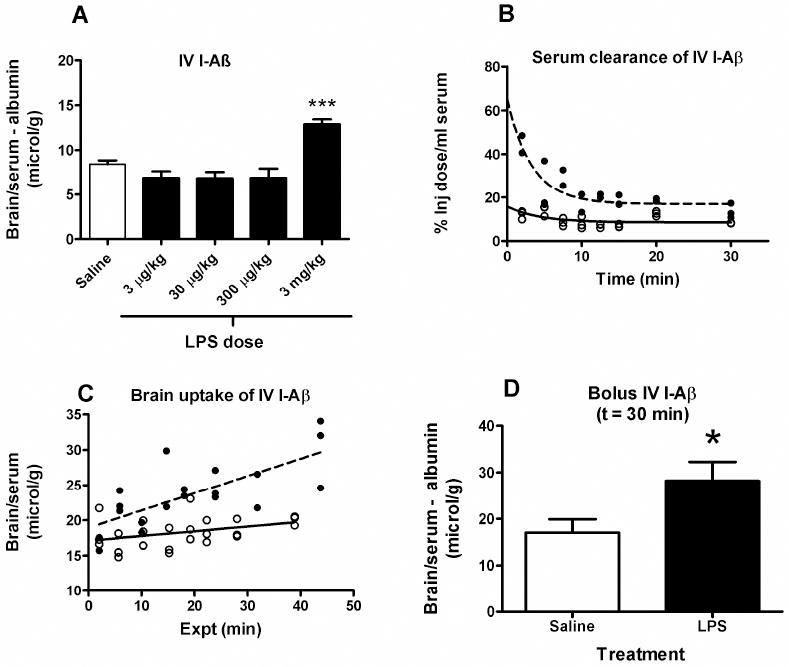
(a) Dose response curve of the effect of LPS on the brain uptake of intravenously injected I-Aβ. ANOVA showed means were significantly different (p < 0.001). Newman-Keuls post analysis showed that only the 3 mg/kg dose was associated with significantly increased brain uptake of I-Aβ (*** = p < 0.001 vs. all other treatment groups). (b) Serum clearance of intravenously injected I-Aβ. LPS pretreatment (solid circles) increased serum concentrations of I-Aβ in comparison to saline injected mice (open circles), possibly because of volume contraction (n = 24 control and n = 19 LPS). (c) Multiple-time regression analysis for brain uptake of intravenously injected I-Aβ. LPS treatment (closed circles) was associated with an increase in brain uptake of I-Aβ. (n = 24 control and n = 10 LPS). Data is from the same mice as in panel b. (d) LPS treatment significantly increased brain uptake of intravenous I-Aβ 30 min after iv injection (n = 6-7/group, * = p < 0.05). The brain/serum ratio for simultaneously injected radioactive albumin was subtracted, thus correcting for any disruption of the BBB induced by LPS.
Figure 1B shows the effect of subacute LPS on clearance of I-Aβ from serum. Results were fit to a one phase exponential decay equation. The greater value for the Y-intercept in LPS-treated mice reflects volume contraction.
Figure 1C shows the effects of subacute LPS on the brain uptake of intravenous (IV) I-Aβ as measured by multiple-time regression analysis. The slope of the line measures Ki, the unidirectional influx rate, for brain which were 0.0669 ± 0.0357 (saline) and 0.245 ± 0.0559 μl/g-min (LPS): [F(1,39) = 7.46, p < 0.01); intercepts were not different. Thus, LPS treatment significantly increased I-Aβ influx into brain by over 3 fold.
A significant effect for subacute LPS treatment remained for brain/serum ratios after being corrected for albumin (Fig 1D; df = 11, t = 2.28, p<0.05), showing that disruption of the BBB does not explain the increased uptake by brain.
LPS also affected the brain-to-blood, or efflux, of I-Aß (Figure 2A). ANOVA showed a significant decrease in brain clearance of I-Aβ (F4,28 = 8.26, p < 0.001) and Newman-Keuls post-test showed that only the 3 mg/kg dose was statistically significant. Figure 2B shows the efflux of I-Aβ from brain to blood after its icv injection into the lateral ventricle of the brain. The slope of the lines were 0.0156 ± 0.003 % Inj Dose/min (saline) and 0.00576 ± 0.002 % Inj Dose/min (LPS) which yielded half-time clearance rates of 19.1 min (saline) min and 52 min (LPS). These slopes differed [F(1,16) = 9.39,p < 0.01], demonstrating that LPS treatment decreased clearance of I-Aβ from the brain.
Figure 2. LPS Decreases the BBB Transport of I-Aβ in the Brain-to-blood Direction (Efflux).
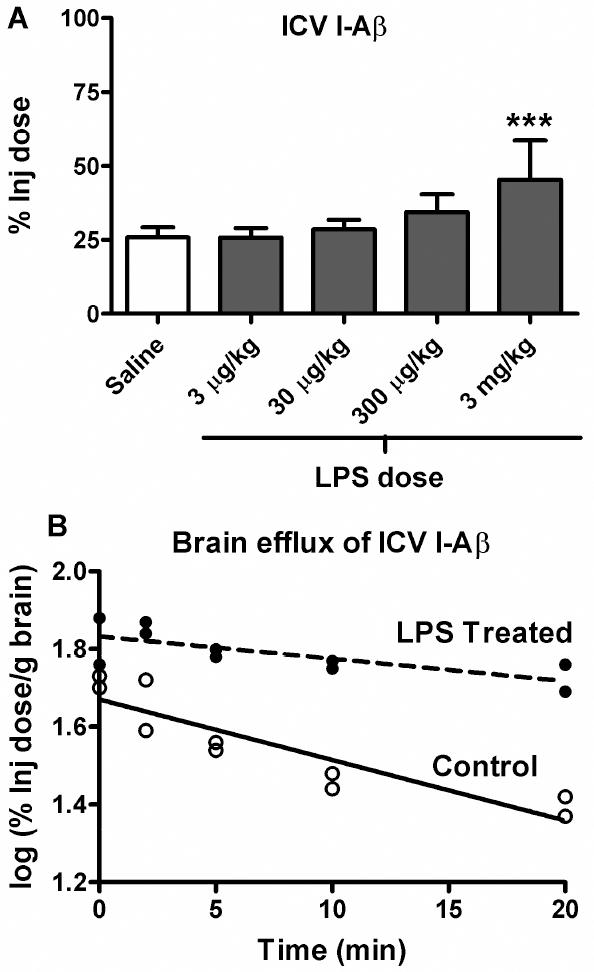
(a) Dose response curve of the effects of LPS on brain clearance of I-Aβ given by brain intraventricular (ICV) administration. One-way ANOVA showed means are significantly different (p < 0.01) and Newman-Keuls post analysis showed that only the 3 mg/kg dose produced a significant reduction in brain clearance of I-Aβ (*** = p < 0.01 vs. all other treatment groups). For all experiments, n = 4-8 mice/group. (b) Time curve of brain clearance of I-Aβ after its ICV administration(n = 2-4/time point). Statistical comparison of the lines showed them to be significantly different: [F(1,16) = 9.39,p < 0.01]. LPS increased the half-time clearance of I-Aβ from brain from 19.1 min to 52 min.
The above set of studies established that LPS increased influx and decreased efflux of I-Aß from brain. The remaining studies investigated possible mechanisms for these effects. We first investigated influx. The effect of subacute LPS was not seen when I-Aß uptake was studied by brain perfusion (Fig 3A; n = 5-6/group). This suggests that serum factors contributed to the effect of LPS on I-Aß uptake by brain. One such factor could be LPS itself. However, we found that incubating LPS in vitro directly with BMEC did not affect the luminal-to-abluminal influx of I-Aß across these monolayers (3C). In contrast, LPS had a significant effect on TEER as shown by ANOVA: F(3,36) = 25.6, p<0.001, n = 10/group). Newman-Keuls post-test showed that only the 100 microg/ml dose of LPS significantly decreased TEER measurements in these cells, indicating disruption of the monolayers.
Figure 3. Effect of LPS on I-Aβ Transport is Indirect.
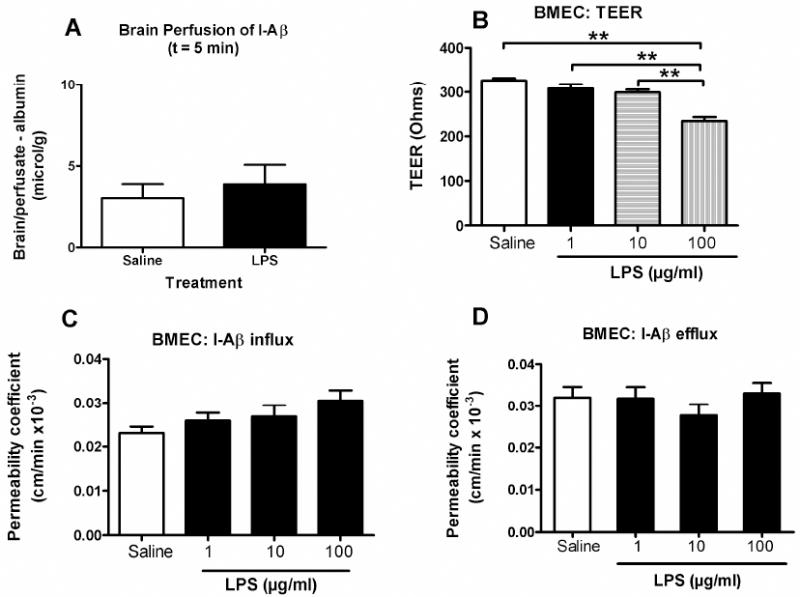
(a) LPS treatment did not alter brain uptake of I-Aβ perfused in buffer for 5 min through the left ventricle of the heart (n = 5-6/group). This method perfuses the I-Aβ directly through the vasculature of the brain in buffer, eliminating the influence of serum factors on BBB transport. Lack of effect in LPS-treated mice demonstrates that a serum factor is an immediate mediator of the LPS effect on efflux. Panels B-D: LPS effects on monolayer cultures of brain microvascular endothelial cell(BMEC) cultures. The TEER measures were taken at the end of the influx and efflux experiments shown in panels c-d. (b) LPS had a dose-dependent effect on transendothelial electrical resistance (TEER), demonstrating that LPS disrupted the BBB through a paracellular pathway. (c) LPS did not have an effect on I-Aβ influx in the BMEC model (n = 13-14 wells/group). (d) LPS did not have an effect on I-Aß efflux in the BMEC model (n = 14-15 wells/group).
Another serum factor could be triglycerides, which are elevated in LPS-treated mice and affect the transport of insulin, ghrelin, and leptin (Banks et al., 2008a; Banks et al., 2004; Urayama & Banks, 2008). Fig 4 shows the effect of the triglyceride triolien on transport of I-Aß. A one-way ANOVA again showed that IP LPS treatment was associated with increased brain uptake of I-Aβ (F3,24 = 3.84, p < 0.05). Administration of triolean alone or I-Aβ with triolean did not significantly affect brain uptake of I-Aβ after LPS treatement. LPS + triolean was significantly different (p<0.05) from LPS alone. This shows that the effects of LPS on I-Aβ influx are not mediated by serum triglycerides. In fact, it appears that triolean can counter the effect of LPS on I-Aβ uptake by brain.
Figure 4. Role of the Triglyceride Triolein on Aß Blood-to-brain Transport.
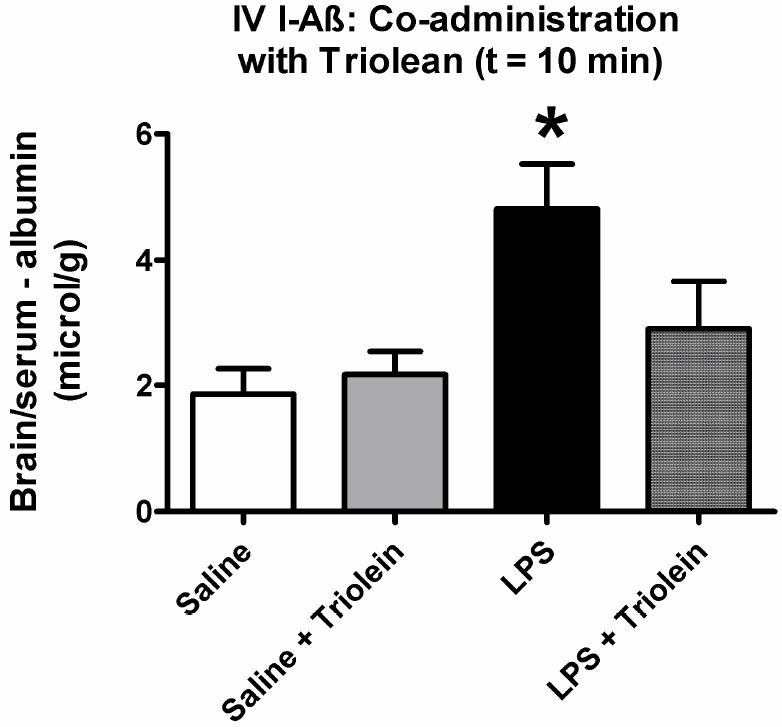
Injection of triolein with I-Aß had no effect on BBB transport in control mice, but significantly blocked the effect of LPS (n = 5-9/group, * = p < 0.05 for LPS treated vs. all other groups).
We then tested whether the effect of LPS was indomethacin sensitive (Fig 5A). Indomethacin did not reverse the effect of LPS on brain uptake of I-Aβ [Fig. 4A; F(3,23) = 7.38, p < 0.01]. LPS did not affect the level of RAGE as measured by Western blotting in brain microvessels (Fig 6A).
Figure 5. Effects of Indomethacin on LPS-mediated changes in Aβ transport.
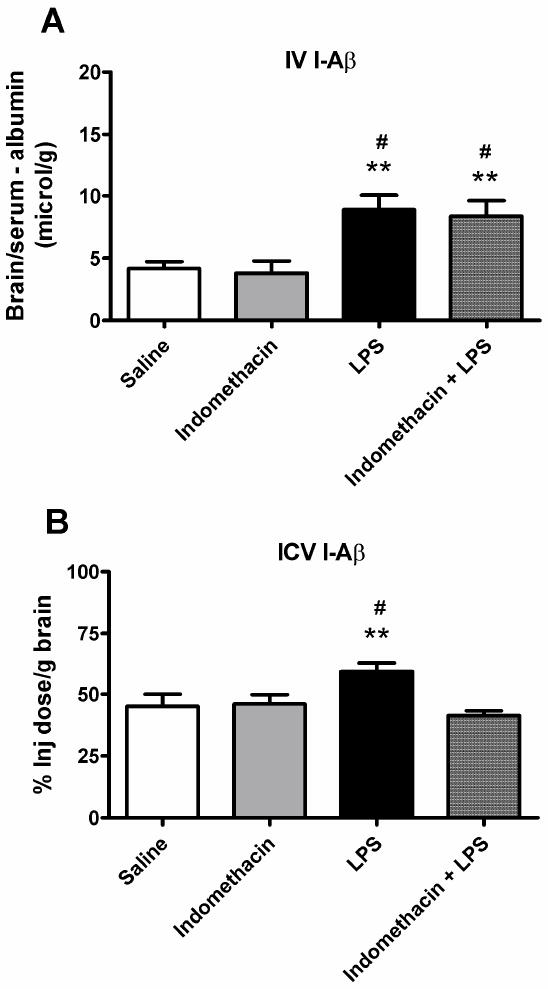
Mice were pretreated with indomethacin (20 mg/kg) 30 min before administration of LPS (a) Pretreatment with indomethacin did not significantly affect brain influx of I-Aβ (n = 6-8/group, # = p < 0.05 vs. Indomethcain and ** = p < 0.01 vs. Saline). (b) Indomethacin pretreatment inhibited the LPS-mediated effects on I-Aβ efflux (n = 6-10 mice/group, # = p < 0.05 vs. Saline and Indomethacin and ** = p < 0.01 vs. Indomethacin + LPS).
Figure 6. Effects of LPS on Expression of BBB RAGE, BBB LRP, and Neuronal LRP.
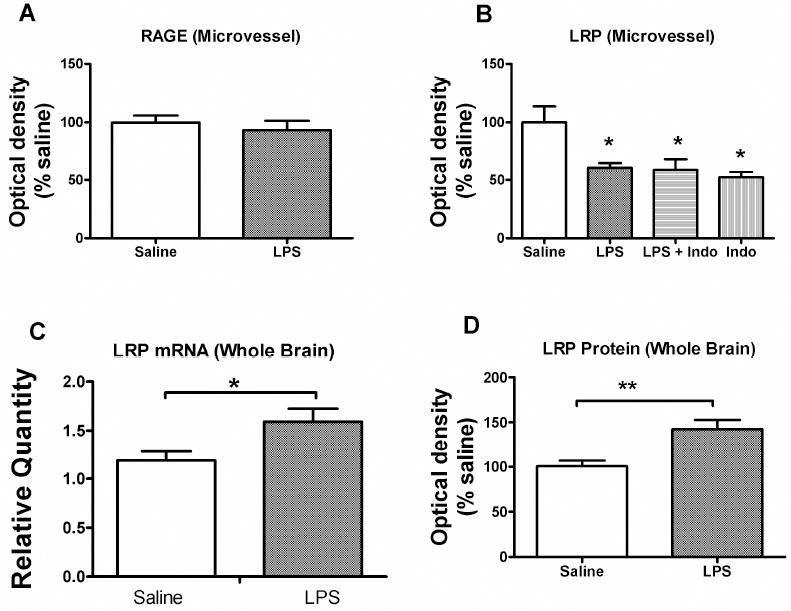
Brain microvessels (a-b) or brain homogenate (c-d) were obtained from mice trerated with subacute LPS. (a) Western blot analysis for RAGE showed no effect of LPS on the protein levels in brain microvessels of this blood-to-brain transporter of Aß. (b) Western blot analysis for 515 kDa subunit of the BBB Aβ clearance transporter, LRP-1, in isolated mouse brain microvessels from mice treated with saline, LPS and indomethacin as indicated (n = 20-22 cortices/microvessel isolation with 1 isolation/band, analyzed 5 times). LPS decreased LRP protein expression (*p<0.05) but indomethacin was without effect. (c) LRP mRNA and LRP protein (d) levels from whole brain in mice treated with saline (n = 6) or LPS (n = 6-7). LPS increased both mRNA (*p<0.05) and protein (**p<0.01) expression in whole brain, indicating upregulation of neuronal LRP.
Finally, we conducted a multiplex cytokine array for 22 murine cytokines on serum samples taken from mice treated with IP saline, LPS, indomethacin, or LPS + indomethacin (Table 1). One way ANOVAs were run on each cytokine with the 4 treatment groups being the independent variables followed by Newman-Keuls post-test. Twelve of the cytokines were unaffected at a statistically significant level by any of the treatments. Serum levels of eight cytokines were increased by LPS, and one (RANTES; regulated on activation, normal T-cell expressed and secreted protein) was decreased. For six of those cytokines, indomethacin +LPS was not different than LPS alone. For four cytokines, the combination of LPS + indomethacin produced higher serum levels than did LPS treatment alone. Serum levels of two cytokines were increased by indomethacin (no LPS) treatment. There were no cytokines whose levels were lower in the LPS + indomethacin group than in the LPS only group.
Table I.
| Cytokine | Treatment (mean +/- SE) | |||
|---|---|---|---|---|
| Saline (n = 4) | Indo (n = 5) | LPS (n = 5) | Indo + LPS (n = 4) | |
| G-CSF | 44.7 +/- 12.7 | 5786 +/- 1171* | > 10,000 +/- 0 *# | > 10,000 +/- 0*# |
| GM-CSF | 17.1 +/- 17.1 | 57.9 +/- 20.8 | 699 +/- 358 | 194 +/-21.5 |
| IFN | 0 +/- 0 | 0.9 +/- 0.9 | 0 +/- 0 | 7.2 +/- 3.0 |
| IL-10 | 9.9 +/- 6.5 | 48.3 +/- 13.3 | 240 +/- 46.6*# | 331 +/- 49.6*# |
| IL-12p70 | 59.2 +/- 21.8 | 107 +/- 30.8 | 22.1 +/- 17.4 | 31.7 +/- 4.2 |
| IL-13 | 95.6 +/- 6.2 | 104.5 +/- 9.5 | 22 +/- 7.6*# | 19.3 +/- 1.5*# |
| IL-15 | 4.3 +/- 4.3 | 21.1 +/- 12.0 | 28.1 +/- 24.4 | 0 +/- 0 |
| IL-17 | 0 +/- 0 | 0.8 +/- 0.8 | 0.7 +/- 0.4 | 14.8 +/- 9.3 |
| IL-1α | 16.2 +/- 4.2 | 433 +/- 129* | 670 +/- 224* | 1036.1 +/- 26.2*# |
| IL-1β | 0.5 +/- 0.5 | 4.9 +/- 1.5 | 34.7 +/- 17.8 | 20.1 +/-10.8 |
| IL-2 | 3.5 +/- 2.4 | 7.4 +/- 1.5 | 3.6 +/- 1.1 | 4.5 +/- 1.1 |
| IL-4 | 0 +/- 0 | 0 +/- 0 | 0 +/- 0 | 0 +/- 0 |
| IL-5 | 17.5 +/- 13.8 | 155 +/- 94.4 | 77.0 +/- 7.0 | 260 +/- 115 |
| IL-6 | 1.3 +/- 0.5 | 1914 +/- 1106 | 9431 +/- 3264*# | 12630 +/- 360*# |
| IL-7 | 3.8 +/- 2.2 | 11.2 +/- 2.7 | 6.3 +/- 2.8 | 5.3 +/- 0.5 |
| IL-9 | 209 +/- 40.9 | 119 +/- 60.0 | 109 +/- 63.3 | 609 +/- 415 |
| IP-10 | 85.0 +/- 46.3 | 492 +/- 135 | 1325 +/- 390*# | 2236 +/- 145*#@ |
| KC | 2.0 +/- 1.2 | 978 +/- 479 | 5006 +/- 1679*# | 8268 +/- 1162*#@ |
| MCP-1 | 15.6 +/- 6.4 | 1163 +/- 664 | 8381 +/- 2926*# | 10300 +/- 1573*# |
| MIP1-α | 45.3 +/- 14.3 | 112 +/- 29.2 | 168 +/- 64.4 | 422 +/- 44.4*#@ |
| RANTES | 0 +/- 0 | 2.9 +/- 1.8 | 76.8 +/- 17.7*# | 117 +/- 13.5*#@ |
| TNF-α | 1.7 +/- 0.7 | 116 +/- 87.2 | 88.4 +/- 64.2 | 104 +/- 19.5 |
any group compared to saline;
LPS or Indo+LPS compared to Indo;
LPS compared to Indo+LPS; all comparisons at p<0.05. The p values are from the Newman-Keuls multiple comparison test following ANOVA.
Abbreviations: G-CSF, granulocyte colony-stimulating factor ; GM-CSF, granulocyte-macrophage colony-stimulating factor; IFN, interferon; IL, interleukin; IP, interferon gamma inducible protein ; KC, keratinocyte derived chemokine; MCP, macrophage chemotactic peptide; MIP, macrophage inflammatory protein; RANTES, regulated on activation, normal T cell-expressed, and secreted protein; and TNF, tumor necrosis factor alpha.
We then examined mechanisms by which LPS could affect efflux of I-Aß. Treating BMEC monolayers with LPS did not affect I-Aβ efflux (Fig. 3D). This indicates that LPS does not act directly on brain endothelial cells to affect I-Aß efflux. Indomethacin blocked the LPS effect on efflux of I-Aβ (Fig. 5B): [(F(3,28) = 6.13, p < 0.01].
The large (515 kDa) subunit of LRP-1 was decreased by LPS treatment (Fig. 6B). Indomethacin did not reverse this LPS effect. These results suggest that LPS decreases LRP-1 protein expression in brain microvessels.
Figures 6C-D show the effects of LPS treatment on LRP mRNA and protein levels in whole brain. LPS increased levels of mRNA by 34% [t(10) = 2.49, p<0.05] and protein levels by 42% [t(10) = 3.44, p<0.01]. LPS did not increase protein carbonyl, HNE, or 3-nitrotyrosine levels for whole brain nor levels of HNE bound to LRP-1 (data not shown).
DISCUSSION
Previous work suggests that proinflammatory states increase the risk of developing AD. The results here provide three mechanisms by which inflammation can contribute to AD by elevating brain levels of Aß: increased blood-to-brain influx of Aß; decreased brain-to-blood efflux of Aß; increased processing of APP to Aß by neuronal APP. Specifically, the major findings in the current work are: Mice exposed to subacute inflammation by the repeated administration of peripheral LPS had 1) increased blood-to-brain uptake and 2) decreased brain-to-blood clearance of I-Aβ. 3) These effects on I-Aß transport were independent of effects of LPS on BBB disruption. The effect of LPS on 4) efflux was prostaglandin dependent, whereas the effect on 5) influx was prostaglandin independent. 6) The effects of LPS on BBB transport were mediated indirectly through serum and brain factors rather than by a direct action of LPS on brain endothelial cells. 7) Triglycerides, which are elevated in proinflammatory states and can modulate other BBB transporters, inhibited rather than mediated the effect of LPS on blood-to-brain transport of Aß. 8) Four cytokines (IL-6, IL-10, IL-13, MCP-1) show a pattern consistent with their mediating the effects of LPS on influx, but 9) no cytokines were identified that could account for the effect of LPS on efflux. Whereas LPS treatment had 10) no effect on the protein expression of the blood-to-brain transporter RAGE, 11) it decreased expression of LRP in brain endothelial cells. 12) LPS did not act through oxidation of LRP. 13) LPS increased expression of whole brain homogenate, or neuronal, LRP. As neuronal LRP processes APP to Aß, its increase provides another mechanism by which inflammation can increase brain levels of Aß. Overall, this work provides mechanisms by which inflammation can increase the risk of AD by altering the Aß burden in brain and by which NSAIDs could protect against AD. Below, we consider each of these findings in detail.
We first conducted a dose-response curve to determine whether a subacute inflammatory state induced by repeated injections of LPS would alter the blood-to-brain or brain-to-blood transport of I-Aß. This model of subacute LPS administration at the 3 mg/kg dose has been used to examine the effects of inflammation on the permeability of the BBB to other substances (Banks et al., 1999; Nonaka et al., 2004; Nonaka et al., 2005; Xaio et al., 2001). Those studies found that the BBB is often, but not always, disrupted by LPS. The CD-1 mice from our in-house colony lose weight and have increased sensitivity to anesthesia with this 3 injection regimen, but mortality is not usually increased. Susceptible transporters are increasingly affected by 1, 3, or 5 injections of LPS (Banks et al., 1999; Xaio et al., 2001), so that there is no evidence for LPS tolerance for these BBB effects. To correct for possible BBB disruption, we subtracted the brain/serum ratios of co-injected I-Albumin from those of I-Aß. The highest dose of 3 mg/kg of LPS increased the blood-to-brain transport by about 3 fold and greatly inhibited the brain-to-blood efflux of I-Aß. Each of these actions would independently act to increase brain levels of Aß by increasing the uptake by brain of circulating Aß and by decreasing clearance from brain of Aß already in the brain, respectively.
The above studies clearly established that both influx and efflux of Aß were affected by LPS. The rest of this work was aimed at determining the mechanisms underlying those effects on Aß transport. We first determined whether the effect on efflux was still detectable when blood-to-brain transport was studied by the brain perfusion technique. Brain perfusion replaces circulating blood with buffer and so displaces the immediate influence of circulating factors on transport (Smith et al., 1987). When I-Aß was so studied, the effect of LPS on transport was no seen. This loss of the LPS effect indicates that factors in the circulation are acting upon the Aß transporter or upon Aß itself so that removal of those factors allows an immediate return to normal rates of transport. If increased transport had been evident with brain perfusion, this would have indicated that LPS had induced changes in RAGE, the major blood-to-brain transporter for Aß. These results, then, indicate that some circulating factor is mediating an immediate effect on I-Aß transport. Complex interactions between RAGE and apoproteins or other circulating substances are known to modify Aß transport (Zlokovic, 1996) (Zlokovic et al., 1996) (Shayo et al., 1996)and may favor the uptake of non-amyloidogenic forms of Aß (Zlokovic, 1996).
One circulating factor that could be acting at the BBB to alter I-Aß transport is LPS itself. LPS can act directly on brain endothelial cells to induce release of cytokines and to increase lymphocyte adhesion (De Vries et al., 1994; Verma et al., 2006). We tested a series of concentrations of LPS in an in vitro monolayer model, with the highest dose of LPS disrupting the monolayer model as shown by an increase in TEER. However, even this high dose of LPS not affect I-Aß transport. This shows both that LPS 1) did not act directly on the BBB to affect Aß transport, 2) did act directly on the BBB to disrupt it, and 3) that the effects on I-Aß transport were independent of effects on BBB disruption.
We also examined the effect of the triglyceride triolein. LPS treatment increases serum triglycerides by about 44 % (Nonaka et al., 2004) and triglycerides affect the BBB transport of leptin, insulin, and ghrelin (Banks et al., 2004), (Urayama & Banks, 2008; Banks et al., 2008a). Here, the triglyceride triolein did indeed affect Abeta transport, but blocked rather than reproduced the LPS effect on I-Aß uptake.
We next examined the effects of LPS treatment on the brain-to-blood transport of I-Aβ. LPS induced a significant decrease in the rate of I-Aβ efflux in vivo but not in vitro, increasing half-time clearance almost 3 fold from 19.1 min to 52 min. The half-time clearance of 19.1 min is consistent with the known saturable transport of Aß in the brain-to-blood direction by LRP. A half-time clearance of 52 min is similar to that found for albumin, which is only cleared with the reabsorption of CSF back into the blood (Banks et al., 1988). Thus, these results suggest a total inhibition of the saturable component of I-Aß transport from brain.
Western blotting found a decrease in the 515 kDa component of LRP-1, the efflux transporter for Aß. Our results compare with those in which LRP-1 expression is decreased in macrophages and in microglia by LPS (LaMarre et al., 1993; Marzolo et al., 2000). However, the results for the endothelial measures of RAGE and LPS are based on multiple measures from a single pooled sample, and so need confirmation. The decrease was less than 30% and so would not completely explain the dramatic decrease in I-Aß transport. We ruled out oxidation of LRP-1 as a cause of decreased function. It could be that products released by LPS are acting in an allosteric manner to modify protein function.
In vitro incubation of brain endothelial cells with LPS did not show any inhibition in their efflux of I-Aß, indicating that LPS did not act directly on the brain endothelial cell to modify brain-to-blood transport. This, again, suggests that LPS is acting indirectly through substances released into brain or blood to modify transport.
One source of such substances is the neurovascular unit, which includes the pericytes, microglia, neurons, and astrocytes that are in close proximity to the brain endothelial cells (Neuwelt et al., 2008). Some of the actions exerted by LPS and cytokines on the BBB are mediated through prostaglandins released by brain endothelial cells or other components of the neurovascular unit. For example, LPS-induced fever is mediated by the release of prostaglandins from brain endothelial cells (Matsumura et al., 1998). Here, we found that the NSAID indomethacin, which acts to inhibit prostaglandin synthesis, abolished the effect of LPS on the brain-to-blood transport of I-Aß. Indomethacin, however, had no effect on blood-to-brain transport. Chronic indomethacin treatment (from 8-15 months of age) has been shown to significantly reduce the levels of soluble Aβ40 and Aβ42 in the hippocampus and cortex of Tg2576 mice. This effect was not caused by altered metabolism of the APP (Sheng et al., 2003) and so would be consistent with an effect on Aβ transport at the BBB. We found here that indomethacin did not reverse the effect of LPS on expression of the 515 kDa component of LRP-1, again indicating that the LPS effect is mediated on protein function rather than on protein expression. Epidemiologic studies associate long-term use of NSAIDs with a reduced risk of developing AD and a later onset, slower progression, and reduced severity of dementia (Townsend & Pratico, 2005). Such a role for NSAIDS reinforces the idea that inflammation is involved in AD. Our finding that NSAIDS would only reverse one component of the contribution of the BBB to Aß accumulation in the brain is consistent with a palliative role of NSAIDS in treatment of AD.
In contrast to the decrease in endothelial LRP function and protein levels, LPS increased both the mRNA and the protein levels of LRP in brain homogenate. Whereas LRP levels are low in the brain vasculature, it is abundant in astroglia, pericytes, and most especially in neurons (Lillis et al., 2008). Thus, brain homogenate reflects primarily neuronal LRP. In these cells, LRP is involved in APP processing so that mice which overexpress neuronal LRP have increased soluble brain Aß and develop cognitive deficits (Masliah et al., 1996). Thus, the LPS-induced increase in expression of neuronal LRP would increase brain levels of Aß. This Aß also would contribute to the measured decrease in brain-to-blood transport by competing with I-Aß for efflux.
Many effects of LPS on the central nervous system are mediated through cytokines. Examples include sickness behavior mediated through IL-1 release (Larson & Dunn, 2001) and toxicity to substantia nigra neurons through TNF release (Qin et al., 2007; Liu et al., 2008). These effects of LPS on the BBB transporters of Aß are likely mediated through cytokines released either into the blood or into the CNS. To explain the indomethacin-independent effect of LPS on the blood-to-brain uptake of I-Aß, we postulate that the level of the cytokine would be 1) affected by LPS treatment, 2) but not by indomethacin alone, and 3) that indomethacin would not alter the effect of LPS on the cytokine level. Four of the 22 cytokines we measured fit this characteristic: IL-6, IL-10, IL-13, and MCP-1. Similarly, we postulate that to explain the indomethacin-dependent effect of LPS on brain-to-blood efflux, the effect of LPS on the cytokine level would have been reversed by addition of indomethacin. None of the cytokines measured in blood fit this profile. It may be, however, that CNS levels of cytokines are more important than blood levels for LRP-1 regulation and that CNS levels may show a pattern different from that of blood. Alternatively, it may be that indomethacin works downstream of the cytokines.
In conclusion, our results show that peripheral inflammation as induced by repeated LPS administration can alter BBB transport of Aβ and neuronal expression of LRP-1 in a manner that would enhance retention, accumulation, and production by brain of Aß. These effects are not mediated directly by LPS acting at the BBB, but indirectly through other substances. The LPS-induced increase in influx is independent of indomethacin, independent of effects on RAGE expression, blocked by the triglyceride triolein, and mediated by serum factors, possibly IL-6, IL-10, IL-13, or MCP-1. The LPS-induced decrease in efflux is blocked by indomethacin and mediated in part by reduced protein levels of LRP-1, but not increased oxidation of LRP-1. LPS also stimulates expression of brain LRP which increases Aß levels in brain by enhancing APP processing. These results provide mechanisms whereby peripheral inflammation could enhance Aß accumulation and the progression of AD.
Acknowledgments
Supported by VA Merit Review, R01 NS051334, and R01 NS050547
Footnotes
Publisher's Disclaimer: This is a PDF file of an unedited manuscript that has been accepted for publication. As a service to our customers we are providing this early version of the manuscript. The manuscript will undergo copyediting, typesetting, and review of the resulting proof before it is published in its final citable form. Please note that during the production process errors may be discovered which could affect the content, and all legal disclaimers that apply to the journal pertain.
References
- Banks WA, Burney BO, Robinson SM. Effects of triglycerides, obesity, and starvation on ghrelin transport across the blood-brain barrier. Peptides. 2008a;29:2061–2065. doi: 10.1016/j.peptides.2008.07.001. [DOI] [PMC free article] [PubMed] [Google Scholar]
- Banks WA, Clever CM, Farrell CL. Partial saturation and regional variation in the blood to brain transport of leptin in normal weight mice. Am J Physiol. 2000;278:E1158–E1165. doi: 10.1152/ajpendo.2000.278.6.E1158. [DOI] [PubMed] [Google Scholar]
- Banks WA, Coon AB, Robinson SM, Moinuddin A, Shultz JM, Nakaoke R, Morley JE. Triglycerides induce leptin resistance at the blood-brain barrier. Diabetes. 2004;53:1253–1260. doi: 10.2337/diabetes.53.5.1253. [DOI] [PubMed] [Google Scholar]
- Banks WA, Dohgu S, Nakaoke R, Lynch JL, Fleegal-DeMotta MA, Erickson MA, Vo TQ. Nitric oxide isoenzymes regulate LPS-enhanced insulin transport across the blood-brain barrier. Endocrinology. 2008b;149:1514–1523. doi: 10.1210/en.2007-1091. [DOI] [PMC free article] [PubMed] [Google Scholar]
- Banks WA, Fasold MB, Kastin AJ. Measurement of efflux rate from brain to blood. In: Irvine GB, Williams CH, editors. Methods in Molecular Biology: Neuropeptides Protocols. Humana Press; Totowa, NJ: 1997. pp. 353–360. [DOI] [PubMed] [Google Scholar]
- Banks WA, Kastin AJ. Quantifying carrier-mediated transport of peptides from the brain to the blood. In: Conn PM, editor. Methods in Enzymology. Vol. 168. Academic Press; San Diego: 1989. pp. 652–660. [DOI] [PubMed] [Google Scholar]
- Banks WA, Kastin AJ, Brennan JM, Vallance KL. Adsorptive endocytosis of HIV-1gp120 by blood-brain barrier is enhanced by lipopolysaccharide. Exp Neurol. 1999;156:165–171. doi: 10.1006/exnr.1998.7011. [DOI] [PubMed] [Google Scholar]
- Banks WA, Kastin AJ, Fasold MB. Differential effect of aluminum on the blood-brain barrier transport of peptides, technetium and albumin. J Pharmacol Exp Ther. 1988;244:579–585. [PubMed] [Google Scholar]
- Banks WA, Robinson SM, Verma S, Morley JE. Efflux of human and mouse amyloid ß proteins 1-40 and 1-42 from brain: Impairment in a mouse model of Alzheimer’s disease. Neuroscience. 2003;121:487–492. doi: 10.1016/s0306-4522(03)00474-3. [DOI] [PMC free article] [PubMed] [Google Scholar]
- Bell RD, Sagare AP, Friedman AE, Bedi GS, Holtzman DM, Deane R, Zlokovic BV. Transport pathways for clearance of human Alzheimer’s amyloid ß-peptide and apolipoproteins E and J in the mouse central nervous system. J Cereb Blood Flow Metab. 2006:1–10. doi: 10.1038/sj.jcbfm.9600419. [DOI] [PMC free article] [PubMed] [Google Scholar]
- Blasberg RG, Fenstermacher JD, Patlak CS. Transport of α-aminoisobutyric acid across brain capillary and cellular membranes. J Cereb Blood Flow Metab. 1983;3:8–32. doi: 10.1038/jcbfm.1983.2. [DOI] [PubMed] [Google Scholar]
- Butterfield DA, Drake J, Pocernich C, Castegna A. Evidence of oxidative damage in Alzheimer’s disease brain: Central role for amyloid beta-peptide. Trends in Molecular Medicine. 2001;7:548–554. doi: 10.1016/s1471-4914(01)02173-6. [DOI] [PubMed] [Google Scholar]
- Combrinck M, Perry V, Cunningham C. Peripheral infection evokes exaggerated sickness behavior in pre-clinical murine prion disease. Neuroscience. 2002;112:7–11. doi: 10.1016/s0306-4522(02)00030-1. [DOI] [PubMed] [Google Scholar]
- De Vries HE, Moor AC, Blom-Roosemalen MC, De Boer AG, Breimer DD, van Berkel TJ, Kuiper J. Lymphocyte adhesion to brain capillary endothelial cells in vitro. J Neuroimmunol. 1994;52:1–8. doi: 10.1016/0165-5728(94)90155-4. [DOI] [PubMed] [Google Scholar]
- Deane R, Sagare A, Zlokovic B. The role of the cell surface LRP and soluble LRP in blood-brain barrier Aß clearance in Alzheimer’s disease. Current Pharmaceutical Design. 2008;14:1601–1605. doi: 10.2174/138161208784705487. [DOI] [PMC free article] [PubMed] [Google Scholar]
- Deane R, Wu Z, Sagare A, Davis J, Du Yan S, Hamm K, Xu F, Parisi M, LaRue B, Hu HW, Spijkers P, Guo H, Song X, Lenting PJ, Van Nostrand WE, Zlokovic B. LRP/amyloid beta-peptide interaction mediates differential brain efflux of Abeta isoforms. Neuron. 2004a;43:333–344. doi: 10.1016/j.neuron.2004.07.017. [DOI] [PubMed] [Google Scholar]
- Deane R, Wu Z, Zlokovic BV. RAGE (yin) versus LRP (yang) balance regulates Alzheimer amyloid beta-peptide clearance through transport across the blood-brain barrier. Stroke. 2004b;35:2628–2631. doi: 10.1161/01.STR.0000143452.85382.d1. [DOI] [PubMed] [Google Scholar]
- Deane R, Yan SD, Submamaryan RK, LaRue B, Jovanovic S, Hogg E, Welch D, Manness L, Lin C, Yu J, Zhu H, Ghiso J, Frangione B, Stern A, Schmidt AM, Armstrong DL, Arnold B, Liliensiek B, Nawroth P, Hofman F, Kindy M, Stern D, Zlokovic B. RAGE mediates amyloid-ß peptide transport across the blood-brain barrier and accumulation in brain. Nature Medicine. 2003;7:907–913. doi: 10.1038/nm890. [DOI] [PubMed] [Google Scholar]
- Dehouck MP, Jolliet-Riant P, Bree F, Fruchart JC, Cecchelli R, Tillement JP. Drug transfer across the blood-brain barrier: Correlation between in vitro and in vivo models. J Neurochem. 1992;58:1790–1797. doi: 10.1111/j.1471-4159.1992.tb10055.x. [DOI] [PubMed] [Google Scholar]
- Farr SA, Poon HF, Dogrukol-Ak D, Drake J, Banks WA, Eyerman E, Butterfield DA, Morley JE. The antioxidants alpha-lipoic acid and N-acetylcysteine reverse memory impairment and brain oxidative stress in aged SAMP8 mice. Journal of Neurochemisrty. 2003;84:1173–1183. doi: 10.1046/j.1471-4159.2003.01580.x. [DOI] [PubMed] [Google Scholar]
- Ghersi-Egea JF, Gorevic PD, Ghiso J, Frangione B, Patlak CS, Fenstermacher JD. Fate of cerebrospinal fluid-borne amyloid β-peptide: rapid clearance into blood and appreciable accumulation by cerebral arteries. J Neurochem. 1996;67:880–883. doi: 10.1046/j.1471-4159.1996.67020880.x. [DOI] [PubMed] [Google Scholar]
- Hardy J, Selkoe DJ. The amyloid hypothesis of Alzheimer’s disease: progress and problems on the road to therapeutics. Science. 2002;297:353–356. doi: 10.1126/science.1072994. [DOI] [PubMed] [Google Scholar]
- Jaeger JB, Dohgu S, Hwang MC, Farr SA, Murphy MP, Fleegal-DeMotta MA, Lynch JL, Robinson SM, Niehoff ML, Johnson SN, Kumar VB, Banks WA. Testing the neurovascular hypothesis of Alzheimer’s disease: LRP-1 antisense reduces blood-brain barrier clearance and increases brain levelsof amyloid beta protein and impairs cognition. 2009 doi: 10.3233/JAD-2009-1074. in press. [DOI] [PMC free article] [PubMed] [Google Scholar]
- LaMarre J, Wolf BB, Kittler EL, Quesenberry PJ, Gonias SL. Regulation of macrophage alpha 2-macroglobulin receptor/low density lipoprotein-related protein by lipopolysaccharide and interferon-gamma. J Clin Invest. 1993;91:1219–1224. doi: 10.1172/JCI116283. [DOI] [PMC free article] [PubMed] [Google Scholar]
- Larson SJ, Dunn AJ. Behavioral effects of cytokines. Brain,Behavior, and Immunity. 2001;15:371–387. doi: 10.1006/brbi.2001.0643. [DOI] [PubMed] [Google Scholar]
- LaRue B, Hogg E, Sagare A, Jovanovic S, Maness L, Maurer C, Deane R, Zlokovic BV. Method for measurement of the blood-brain barrier permeability in the perfused mouse brain: application to amyloid-beta peptide in wild type and Alzheimer’s Tg2576 mice. Journal of Neuroscience Methods. 2004;138:233–242. doi: 10.1016/j.jneumeth.2004.04.026. [DOI] [PubMed] [Google Scholar]
- Lillis AP, Van Duyn LB, Murphy-Ullrich JE, Strickland DK. LDL receptor-related protein 1: Unique tissue-specific functions revealed by selective gene knockout studies. Physiol Rev. 2008;88:887–918. doi: 10.1152/physrev.00033.2007. [DOI] [PMC free article] [PubMed] [Google Scholar]
- Liu Y, Qin L, Wilson B, Wu X, Qian L, Granholm AC, Crews FT, Hong JS. Endotoxin induces a delayed loss of TH-IR neurons in substantia nigra and motor behavioral deficits. Neurotoxicology. 2008;29:864–870. doi: 10.1016/j.neuro.2008.02.014. [DOI] [PMC free article] [PubMed] [Google Scholar]
- Maness LM, Banks WA, Podlisny MB, Selkoe DJ, Kastin AJ. Passage of human amyloid β-protein 1-40 across the murine blood-brain barrier. Life Sci. 1994;21:1643–1650. doi: 10.1016/0024-3205(94)00331-9. [DOI] [PubMed] [Google Scholar]
- Marks JL, Eastman CJ. Ontogeny of insulin binding in different regions of the rat brain. Developmental Neuroscience. 1990;12:349–358. doi: 10.1159/000111863. [DOI] [PubMed] [Google Scholar]
- Martel CL, Mackic JB, McComb JG, Ghiso J, Zlokovic BV. Blood-brain barrier uptake of the 40 and 42 amino acid sequences of circulating Alzheimer’s amyloid beta in guinea pigs. Neurosci Lett. 1996;206:157–160. doi: 10.1016/s0304-3940(96)12462-9. [DOI] [PubMed] [Google Scholar]
- Marzolo MP, von Bernhardi R, Bu G, Inestrosa NC. Expression of alpha(2)-macroglobulin receptor/low density lipoprotein receptor-related protein (LRP) in rat microglial cells. J Neurosci Res. 2000;60:401–411. doi: 10.1002/(SICI)1097-4547(20000501)60:3<401::AID-JNR15>3.0.CO;2-L. [DOI] [PubMed] [Google Scholar]
- Masliah E, Sisk A, Mallory M, Mucke L, Schenk D, Games D. Comparison of neurodegenerative pathology in transgeneic mice overexpressing V717F ß-amyloid precursor protein and Alzheimer’s disease. J Neurosci. 1996;16:5795–5811. doi: 10.1523/JNEUROSCI.16-18-05795.1996. [DOI] [PMC free article] [PubMed] [Google Scholar]
- Matsumura K, Cao C, Ozaki M, Morii H, Nakadate K, Watanabe Y. Brain endothelial cells express cyclooxygenase-2 during lipopolysaccharide-induced fever: light and electron microscopic immunocytochemical studies. J Neurosci. 1998;18:6279–6289. doi: 10.1523/JNEUROSCI.18-16-06279.1998. [DOI] [PMC free article] [PubMed] [Google Scholar]
- Morley JE, Farr SA, Kumar VB, Banks WA. Alzheimer’s disease through the eye of a mouse: Acceptance lecture for the 2001 Gayle A. Olson and Richard D Olson prize Peptides. 2002;23:589–599. doi: 10.1016/s0196-9781(01)00630-1. [DOI] [PubMed] [Google Scholar]
- Neuwelt E, Abbott NJ, Abrey L, Banks WA, Blakley B, Davis T, Engelhardt B, Grammas P, Nedergaard M, Nutt J, Pardgridge W, Rosenberg GA, Smith Q, Drewes LR. Strategies to advance translational research into brain barriers. Lancet Neurology. 2008;7:84–96. doi: 10.1016/S1474-4422(07)70326-5. [DOI] [PubMed] [Google Scholar]
- Nonaka N, Hileman SM, Shioda S, Vo P, Banks WA. Effects of lipopolysaccharide on leptin transport across the blood-brain barrier. Brain Res. 2004;1016:58–65. doi: 10.1016/j.brainres.2004.04.066. [DOI] [PubMed] [Google Scholar]
- Nonaka N, Shioda S, Banks WA. Effect of lipopolysaccharide on the transport of pituitary adenylate cyclase activating polypeptide across the blood-brain barrier. Exp Neurol. 2005;191:137–144. doi: 10.1016/j.expneurol.2004.09.013. [DOI] [PubMed] [Google Scholar]
- Patlak CS, Blasberg RG, Fenstermacher JD. Graphical evaluation of blood-to-brain transfer constants from multiple-time uptake data. J Cereb Blood Flow Metab. 1983;3:1–7. doi: 10.1038/jcbfm.1983.1. [DOI] [PubMed] [Google Scholar]
- Perriere N, Demeuse P, Garcia E, Regina A, Debray M, Andreux JP, Couvreur P, Scherrmann JM, Temsamani J, Couraud PO, Deli MA, Roux F. Puromycin-based purification of rat brain capillary endothelial cell cultures. J Neurochem. 2005;93:279–289. doi: 10.1111/j.1471-4159.2004.03020.x. [DOI] [PubMed] [Google Scholar]
- Poon HF, Castegna A, Farr SA, Thongboonkerd V, Lynn BC, Banks WA, Morley JE, Klein JB, Butterfield DA. Quantitative proteomics analysis of specific protein expression and oxidative modification in aged senescence-accelerated-prone 8 mice brain. Neuroscience. 2004a;126:915–926. doi: 10.1016/j.neuroscience.2004.04.046. [DOI] [PubMed] [Google Scholar]
- Poon HF, Farr SA, Banks WA, Pierce WM, Klein JB, Morley JE, Butterfield DA. Proteomic identification of less oxidized brain proteins in aged senescence-accelerated mice following administration of antisense oligonucleotide directed at the Abeta region of amyloid precursor protein. Mol Brain Res. 2005;138:8–13. doi: 10.1016/j.molbrainres.2005.02.020. [DOI] [PubMed] [Google Scholar]
- Poon HF, Joshi G, Sultana R, Farr SA, Banks WA, Morley JE, Calabrese V, Butterfield DA. Antisense directed at the A-beta region of APP decreases brain oxidative markers in aged senescence accelerated mice. Brain Res. 2004b;1018:86–96. doi: 10.1016/j.brainres.2004.05.048. [DOI] [PubMed] [Google Scholar]
- Qin L, Wu X, Block ML, Liu Y, Breese GR, Hong JS, Knapp DJ, Crews FT. Systemic LPS causes chronic neuroinflammation and progressive neurodegeneration. GLIA. 2007;55:453–462. doi: 10.1002/glia.20467. [DOI] [PMC free article] [PubMed] [Google Scholar]
- Rosendorff C, Beeri MS, Silverman JM. Cardiovascular risk factors for Alzheimer’s disease. American Journal of Geriatric Cardiology. 2007;16:143–149. doi: 10.1111/j.1076-7460.2007.06696.x. [DOI] [PubMed] [Google Scholar]
- Selkoe DJ, Wolfe MS. Presenilin: running with scissors in the membrane. Cell. 2007;13:215–221. doi: 10.1016/j.cell.2007.10.012. [DOI] [PubMed] [Google Scholar]
- Shayo M, McLay RN, Kastin AJ, Banks WA. The putative blood-brain barrier transporter for the β-amyloid binding protein apolipoprotein J is saturated at physiological concentrations. Life Sci. 1996;60:L115–L118. doi: 10.1016/s0024-3205(96)00685-6. [DOI] [PubMed] [Google Scholar]
- Sheng JG, Bora SH, Xu G, Borchelt DR, Price DL, Koliatsos VE. Lipopolysaccharide-induced-neuroinflammation increases intracellular accumulation of amyloid precursor protein and amyloid beta peptide in APPswe transgenic mice. Neurobiology of Disease. 2003;14:133–145. doi: 10.1016/s0969-9961(03)00069-x. [DOI] [PubMed] [Google Scholar]
- Shibata M, Yamada S, Kumar SR, Calero M, Bading J, Frangione B, Holtzman DM, Miller CA, Strickland DK, Ghiso J, Zlokovic BV. Clearance of Alzheimer’s amyloid-β1-40 peptide from brain by LDL receptor-related protein-1 at the blood-brain barrier. J Clin Invest. 2000;106:1489–1499. doi: 10.1172/JCI10498. [DOI] [PMC free article] [PubMed] [Google Scholar]
- Smith QR, Momma S, Aoyagi M, Rapoport SI. Kinetics of neutral amino acid transport across the blood-brain barrier. J Neurochem. 1987;49:1651–1658. doi: 10.1111/j.1471-4159.1987.tb01039.x. [DOI] [PubMed] [Google Scholar]
- Szabo CA, Deli MA, Ngo TKD, Joo F. Production of pure primary rat cerebral endothelial cell culture: a comparison of different methods. Neurobiology. 1997;5:1–16. [PubMed] [Google Scholar]
- Townsend KP, Pratico D. Novel therapeutic opportunities for Alzheimer’s disease: focus on nonsteroidal anti-inflammatory drugs. FASEB J. 2005;19:1592–1601. doi: 10.1096/fj.04-3620rev. [DOI] [PubMed] [Google Scholar]
- Urayama A, Banks WA. Starvation and triglycerides reverse the obesity-induced impairment of insulin transport at the blood-brain barrier. Endocrinology. 2008;149:3592–3597. doi: 10.1210/en.2008-0008. [DOI] [PMC free article] [PubMed] [Google Scholar]
- Verma S, Nakaoke R, Dohgu S, Banks WA. Release of cytokines by brain endothelial cells: a polarized response to lipopolysaccharide. Brain,Behavior, and Immunity. 2006;20:449–455. doi: 10.1016/j.bbi.2005.10.005. [DOI] [PubMed] [Google Scholar]
- Xaio H, Banks WA, Niehoff ML, Morley JE. Effect of LPS on the permeability of the blood-brain barrier to insulin. Brain Res. 2001;896:36–42. doi: 10.1016/s0006-8993(00)03247-9. [DOI] [PubMed] [Google Scholar]
- Zlokovic BV. Cerebrovascular transport of Alzheimer’s amyloid beta and apolipoproteins J and E: possible anti-amyloidogenic role of the blood-brain barrier. Life Sci. 1996;59:1483–1497. doi: 10.1016/0024-3205(96)00310-4. [DOI] [PubMed] [Google Scholar]
- Zlokovic BV. Clearing amyloid through the blood-brain barrier. J Neurochem. 2004;89:807–811. doi: 10.1111/j.1471-4159.2004.02385.x. [DOI] [PubMed] [Google Scholar]
- Zlokovic BV, Martel CL, Matsubara E, McComb JG, Zheng G, McCluskey RT, Frangione B, Ghiso J. Glycoprotein 330/megalin: probable role in receptor-mediated transport of apolipoprotein J alone and in a complex with Alzheimer disease amyloid β at the blood-brain and blood-cerebrospinal fluid barriers. Proc Natl Acad Sci USA. 1996;93:4229–4234. doi: 10.1073/pnas.93.9.4229. [DOI] [PMC free article] [PubMed] [Google Scholar]