

Abstract
The phenotypic association between fragile X syndrome (FXS) and autism is well established, but no studies have directly compared whole-brain anatomy between the two disorders. We performed voxel-based morphometry analyses of MRI scans on ten individuals with FXS, ten individuals with autism, and ten healthy comparison subjects to identify volumetric changes in each disorder. Regional gray matter volumes within frontal, parietal, temporal, and cingulate gyri, as well as in the caudate nuclei and cerebellum, were larger in the FXS group relative to the autism group. In addition, volume increases in FXS were observed in frontal gyri and caudate nuclei compared to controls. The autism group exhibited volume increases in frontal and temporal gyri relative to the FXS group, and no volume increases relative to controls. Volumetric deficits relative to controls were observed in regions of the cerebellum for both groups, with additional deficits in parietal and temporal gyri for the FXS group. Our caudate nuclei and frontal gyri results may implicate dysfunction of frontostriatal circuitry in FXS. Cerebellar deficits suggest atypical development of the cerebellum contributing to the phenotype of both disorders, but further imply that unique cerebellar regions contribute to the phenotype of each disorder.
Keywords: caudate nucleus, cerebellum, frontostriatal, inferior frontal gyrus, magnetic resonance imaging
1. Introduction
According to the Centers for Disease Control and Prevention, the prevalence of autism spectrum disorders (ASDs) (i.e. autistic disorder, Asperger's disorder, and pervasive developmental disorder, not otherwise specified) is estimated to be 1 in 152 children (Centers for Disease Control and Prevention, 2007). ASDs, generally referred to as autism, are defined clinically by impairments in communication, social interaction, and behavior development. Diagnosable medical conditions, cytogenetic abnormalities, and single-gene defects have been estimated to account for between 5-41% of cases, leaving the majority classified as idiopathic (Wassink et al., 2001; Kielinen et al., 2004; Reddy, 2005; Schaefer and Lutz, 2006). Twin studies have shown that idiopathic autism is highly heritable (Steffenburg et al., 1989; Bailey et al., 1995), with an estimated heritability as high as 90% for autism broadly defined. While it is clear there is a strong genetic component to the disorder, autism's etiology remains poorly understood. Between five and twenty genes are thought to contribute to autism, yet no widely replicated susceptibility loci or genes have been reported despite several genome-wide screens (Yang and Gill, 2007).
By contrast, fragile X syndrome (FXS), which is the most frequent form of inherited mental retardation, has a known single-gene etiology (Verkerk et al., 1991). The prevalence of FXS is estimated to be from 1 in 2500 to 1 in 3600, as recently reviewed by Hagerman, P.J. (2008). In addition to mild to severe mental retardation, a wide range of symptoms including cognitive and behavioral deficits, as well as distinct physical phenotypic features such as large prominent ears, characterize the majority of people with FXS. In almost all cases, the syndrome results from a trinucleotide (CGG) expansion mutation in the 5′-untranslated region of the fragile X mental retardation 1 (FMR1) gene located on the long arm of the X chromosome at Xq27.3. When the number of repeats exceeds 200, the gene is largely silenced due to promoter hypermethylation, which results in diminished or absent production of the associated fragile X mental retardation protein (FMRP). FMRP is known to play a role in neuronal maturation and its dysregulation results in aberrant brain development and function in affected individuals.
An association between FXS and autism was first reported in 1982 by several investigators (Brown et al., 1982a,b; Meryash et al., 1982). The prevalence of autism in FXS individuals was initially estimated to be 15%, with current estimates of 30-35%. Conversely, the prevalence of FXS in individuals with autism is estimated to be 2-6% (Hagerman, 2006). Despite a debate concerning the extent to which the autistic features seen in FXS individuals represent “true” autism, FXS is considered to be the most common known single-gene cause of autism, with 50-90% of individuals with FXS reported to display some autistic symptoms (Hagerman et al., 1986; Kerby and Dawson, 1994; Baumgardner et al., 1995; Bailey et al., 1998; Rogers et al., 2001).
To date, only one study has directly compared the brain anatomy of individuals with FXS to those with autism. Kaufmann et al. (2003) used MRI to compare FXS to autism, but limited their analyses to the cerebellar vermis and intracranial space. They reported greater reductions in vermal volume in a group of individuals with FXS than in a group with idiopathic autism and a group comorbid for FXS and autism relative to controls. For each disorder considered independently, a small number of findings appear to replicate across laboratories. For autism, the most consistent findings involve an overall enlarged brain volume (Piven et al., 1996; Courchesne et al., 2001; Aylward et al., 2002; Palmen et al., 2005), although possibly restricted to children with autism (Courchesne et al., 2001; Aylward et al., 2002; Herbert, 2005; Redcay and Courchesne, 2005), atypical cerebellar volume, particularly reduced vermal volume (Gaffney et al., 1987; Courchesne et al., 1988; Murakami et al., 1989; Hashimoto et al., 1993; Courchesne et al., 1994; Courchesne, 1997; Levitt et al., 1999; Palmen and van Engeland, 2004; Rojas et al., 2006), reductions in the size of the corpus callosum (Egaas et al., 1995; Piven et al., 1997a; Manes et al., 1999), and enlarged caudate nuclei (Sears et al., 1999; Hollander et al., 2005; Rojas et al., 2006; Voelbel et al., 2006; Langen et al., 2007), although this finding does not always survive correction for overall brain volume (Sears et al., 1999). There is also evidence for abnormal amygdala and hippocampus volumes in individuals with autism, however, the reported directionality of these differences has been inconsistent (for a review, see Palmen and van Engeland, 2004; and Penn, 2006). In structural studies of FXS, the most consistent findings have been a reduced cerebellar vermis (Reiss et al., 1988, 1991a, 1991b; Mostofsky et al., 1998; Gothelf et al., 2007), enlarged ventricular volumes (Reiss et al., 1988, 1991a, 1991b, 1995; Lee et al., 2007), and enlarged caudate nuclei (Reiss et al., 1995; Eliez et al., 2001; Gothelf et al., 2007; Lee et al., 2007). While there are interesting similarities even within these limited replicated findings, direct comparisons are difficult due to different methodologies used across different subject groups.
In the current study, we used voxel-based morphometry (VBM) to compare regional gray matter (GM) volumes across the whole brain between subjects with FXS, subjects with autism, and developmentally typical comparison subjects. In addition to being the first study to use structural imaging to directly compare whole-brain anatomy in FXS with autism, it is also only the second study employing VBM in a study of FXS (see Gothelf et al., 2007). Based on previous structural findings in each of the disorders, we hypothesized that similar regions, such as the caudate nucleus and cerebellum, would be found to be atypical in FXS and autism as compared to controls, but with larger effects for the FXS group compared to the autism group based on the results of Kaufmann et al. (2003). However, we expected that observed regions would not be limited to regions the disorders share in common, but would include cortical and subcortical areas unique to each disorder, possibly providing insight into some of the differentiating phenotypic aspects of each. Finally, since we expected that, on average, subjects with FXS would have more severe general cognitive impairment than subjects with autism, we proposed to examine the effect of controlling IQ on differences between the two groups.
2. Methods
2.1. Subjects
Ten individuals with FXS (seven men, three women, mean age 28.93 ± 7.80), ten individuals with autism (eight men, two women, mean age 30.10 ± 9.18), and a comparison group of ten individuals (seven men, three women, mean age 29.40 ± 7.91) participated in the study. All participants in the FXS group demonstrated a full mutation (i.e. expansion of greater than 200 CGG repeats) on FMR1 DNA testing (Tassone et al., 1999), and all individuals in the autism group met clinical criteria for DSM-IV autistic disorder (American Psychiatric Association, 1994), as well as criteria for autism on both the Autism Diagnostic Interview (ADI) (Lord et al., 1994) and the Autism Diagnostic Observation Schedule (ADOS) (Lord et al., 2000). Inclusion in the autism group also required that individuals tested negative for FXS (Tassone et al., 1999), were not comorbid for epilepsy, and had no personal history of seizures. Participants in the comparison group were recruited from the Denver metropolitan area, had no personal history of neurological or Axis I psychiatric illness, and met Research Diagnostic Criteria for never mentally-ill (Spitzer et al., 1978). In addition, comparison subjects had no reported family history of neurological or psychiatric illness among first-degree relatives. All participants in the three groups were administered either a full Wechsler Adult Intelligence Scale, 3rd edition (Wechsler, 1997) or Wechsler Adult Intelligence Scale, Revised (Wechsler, 1981). All subjects signed informed consent to participate in the experiment consistent with the guidelines of the Colorado Multiple Institution Review Board. Demographic and cognitive data on participants are shown in Table 1.
Table 1.
Demographic characteristics and whole-brain volume measures for the study groups.
| FXS n=10 |
Autism n=10 |
Comparison n=10 |
||||
|---|---|---|---|---|---|---|
| Mean (SD) | Range | Mean (SD) | Range | Mean (SD) | Range | |
| Age | 28.93 (7.80) | 22.3-44.2 | 30.10 (9.18) | 22.2-47.2 | 29.40 (7.91) | 21.8-43.8 |
| Full Scale IQ (FSIQ) | 65.20 (17.07) | 42-99 | 91.50 (19.67) | 62-116 | 127.20 (9.00) | 113-144 |
| Total Gray Matter (ml) | 774.88 (42.24) | 694.5-837.4 | 717.44 (116.87) | 513.8-870.6 | 748.14 (39.79) | 670.2-790.2 |
| Total White Matter (ml) | 507.96 (38.45) | 446.0-559.5 | 446.12 (83.97) | 291.7-557.5 | 474.24 (39.17) | 377.6-515.8 |
| Brain/Intracranial ratio | 0.71 (0.02) | 0.68-0.74 | 0.69 (0.04) | 0.60-0.73 | 0.70 (0.02) | 0.66-0.74 |
2.2. Image acquisition
Spoiled gradient recalled (SPGR) T1-weighted (TR = 40 ms, TE = 5 ms, 40 degree flip angle, NEX = 1) images were acquired on a 1.5 T General Electric Signa system (G.E. Medical Systems, Inc., Milwaukee, WI). One-hundred and twenty-four contiguous, 1.7-mm thick coronal slices with a 192 × 256 (reconstructed to 2562) matrix in a 240 mm field of view resulted in voxel dimensions of .9375 by .9375 by 1.7 mm.
2.3. Image processing
Image processing was conducted using the SPM2 software package (Wellcome Department of Imaging Neuroscience, London). To account for potential differences between our local sample and the SPM2 templates, an optimized VBM protocol with modulation was used as described in Good et al. (2001) and as we have previously described in Rojas et al. (2006). All modulated GM images were smoothed with a 12 mm FWHM Gaussian kernel for statistical analyses.
2.4. Statistical analysis
Statistical analyses of demographic and cognitive data were performed with SPSS version 11 (SPSS Inc., Chicago, IL) at P < 0.05. All further statistical analyses were conducted using SPM2. To examine differences in regional GM volume between groups, an ANCOVA model was employed. Analyses included total GM volume as a covariate in order to control for global volume differences between groups. All whole-brain analyses were conducted at a false discovery rate (FDR) corrected threshold of P < 0.05, with an extent threshold of 25 voxels. For regions of interest (ROI) that we had a priori hypotheses, we performed separate analyses at an uncorrected threshold of P < 0.001, with an extent threshold of 25 voxels. Based on the more extensive anatomical findings in autism and the more limited ones in FXS, we decided on a list of structures to be used as ROIs within these analyses, which included: 1) superior frontal gyrus, 2) inferior frontal gyrus, 3) middle and superior temporal gyrus (containing superior temporal sulcus), 4) fusiform gyrus, 5) cerebellum (hemispheres and vermis), 6) posterior cingulate gyrus, 7) precentral gyrus, 8) postcentral gyrus, 9) amygdala, 10) caudate nucleus, and 11) hippocampus. Only clusters whose peaks were within our a priori ROIs were considered if visible at the uncorrected threshold, and for these regions a small volume correction (SVC) (Worsley et al., 1996) at P < 0.05 on a 6 mm diameter sphere centered on the cluster maximum was applied.
To investigate partial correlations between IQ and regional GM volumes across groups, a multiple regression analysis with full scale IQ (FSIQ) and total GM was computed. For regions found to be both significant as described above and to correlate with FSIQ, an additional ANCOVA with FSIQ and total GM as covariates was performed at a FDR corrected threshold of P < 0.05 using an ROI mask of the identified regions. In addition, since our sample included both male and female subjects, a multiple regression analysis with gender and total GM was computed to investigate partial correlations between gender and regional GM volumes across groups.
In order to further examine areas of possible common abnormalities between our groups, conjunction contrasts were calculated on contrasts derived from the previously discussed analyses: 1) control > FXS and control > autism, 2) control < FXS and control < autism, 3) FXS > autism and FXS > control, 4) FXS < autism and FXS < control, 5) autism > FXS and autism > control, and 6) autism < FXS and autism < control. Conjunction analyses were evaluated against the conjunction null. As with the other analyses, these were both at the whole-brain level and using the ROIs discussed previously.
Anatomic localization of all reported clusters was established using the Automated Anatomical Labeling atlas (Tzourio-Mazoyer et al., 2002) supplemented with visual inspection and based on the labeled region containing the local maximum voxel of each cluster.
3. Results
3.1. Sample characteristics
Significant differences were found in FSIQ scores between the FXS, autism, and comparison groups (F(2, 27) = 38.27, P < 0.001), with the mean control FSIQ greater than the mean of both the autism and FXS groups, and the mean autism FSIQ greater than that of the FXS group (P < 0.001). The mean FSIQ level of the comparison group was also found to be higher than in the national standardization sample for Wechsler scales, consistent with a community-based study from the Denver metropolitan area (Willcutt et al., 2001). No significant differences in age, total GM, total white matter, brain (gray + white) to intracranial (gray + white + csf) volume ratio, or handedness were observed between groups (all P > 0.05; Table 1).
3.2. Regional gray matter results
Table 2 lists structures for which significant differences were observed in GM volume between the FXS and autism groups at a FDR corrected threshold of P < 0.05. Regional increases in GM volume in the FXS group relative to autism subjects were observed in the left middle and superior frontal gyri; the left postcentral gyrus; the left inferior, middle, and superior temporal gyri; the right superior temporal gyrus; the right parahippocampal gyrus; the left and right cingulate body; the left anterior cingulate gyrus; the left and right caudate nuclei; and the left and right cerebellum. Regional GM volume decreases in the FXS group relative to the autism group were observed in the left inferior frontal gyrus, the left middle frontal gyrus, and the right inferior temporal gyrus. Table 3 lists ROI regions that were found to be significant after SVC at P < 0.05 (note: all ROIs reaching significance at the whole-brain level are reported only under the whole-brain tables). Our ROI analyses revealed additional regional GM volume increases in the right superior frontal gyrus, the left middle temporal gyrus, and the right fusiform gyrus for individuals with autism relative to the FXS group.
Table 2.
Whole-brain analyses at FDR P < 0.05. Significant differences in GM volume between the FXS and autism groups, controlling for total GM volume.
| Brain region | T | Cluster Size | MNI Coordinates | ||
|---|---|---|---|---|---|
| FXS > Autism | |||||
| Frontal | |||||
| Left middle frontal gyrus | 5.00 | 4113 | -32 | 33 | 31 |
| Left superior frontal gyrus, medial part | 4.14 | 267 | -1 | 51 | 35 |
| Parietal | |||||
| Left postcentral gyrus | 3.64 | 478 | -28 | -34 | 59 |
| Temporal | |||||
| Left inferior temporal gyrus′ | 5.63 | 15741 | -48 | -40 | -17 |
| Left middle temporal gyrus* | 4.78 | 826 | -49 | -39 | -1 |
| Left superior temporal gyrus* | 4.75 | 193 | -40 | -23 | 1 |
| Right superior temporal gyrus | 3.57 | 588 | 44 | -34 | 19 |
| Right parahippocampal gyrus | 3.23 | 35 | 28 | -36 | -6 |
| Cingulate | |||||
| Left midcingulate gyrus′ | 5.45 | 10520 | -9 | -19 | 35 |
| Left anterior cingulate gyrus* | 3.87 | 248 | -6 | 27 | 15 |
| Right midcingulate gyrus′ | 6.54 | 10520 | 8 | -19 | 38 |
| Subcortical | |||||
| Left caudate nucleus′ | 6.55 | 8194 | -7 | 16 | 8 |
| Right caudate nucleus′ | 5.94 | 8194 | 10 | 22 | -1 |
| Cerebellum | |||||
| Left cerebellar lobule VI′ | 4.38 | 15741 | -31 | -54 | -20 |
| Right cerebellar lobule VI′ | 4.44 | 9925 | 32 | -62 | -26 |
| Right cerebellar crus I′ | 3.26 | 9925 | 51 | -58 | -36 |
| Right cerebellar crus II* | 3.81 | 161 | 43 | -77 | -46 |
| Autism > FXS | |||||
| Frontal | |||||
| Left inferior frontal gyrus, operculum | 5.80 | 656 | -64 | 8 | 14 |
| Left middle frontal gyrus, orbital part | 5.34 | 184 | -21 | 36 | -21 |
| Temporal | |||||
| Right inferior temporal gyrus | 5.20 | 242 | 41 | -2 | -37 |
Note. All labels are derived from the AAL atlas (see text).
For these clusters, the peak voxel does not lie within the AAL atlas. For these, the label is derived from the nearest AAL labeled voxel.
The following local maxima belong to clusters that are contiguous: 1) the left and right midcingulate gyri, 2) the left and right caudate, 3) the left inferior temporal gyrus and left cerebellar lobule VI, and 4) the right cerebellar lobule VI and right cerebellar crus I.
Table 3.
Region of interest analyses after small volume correction at P < 0.05. Significant differences in GM volume between the FXS and autism groups, controlling for total GM volume.
| Brain region | T | Cluster Size | MNI Coordinates | ||
|---|---|---|---|---|---|
| Autism > FXS | |||||
| Frontal | |||||
| Right superior frontal gyrus, orbital part | 4.13 | 209 | 20 | 37 | -15 |
| Temporal | |||||
| Left middle temporal gyrus | 4.52 | 485 | -45 | 1 | -28 |
| Right fusiform gyrus | 4.16 | 394 | 32 | 16 | -42 |
Note. All labels are derived from the AAL atlas (see text).
Table 4 lists structures for which significant GM volume differences were observed between the FXS and autism groups relative to controls at a FDR corrected threshold of P < 0.05. Regional GM volume increases in the FXS group relative to controls were observed in the left and right middle frontal gyri; the left superior frontal gyrus; and the left and right caudate nuclei. No significant differences between the autism and control groups were observed at the FDR corrected threshold. All remaining regional GM differences involving the control group were observed in our ROI analyses after SVC at P < 0.05 and are listed in Table 5. A regional GM increase in FXS individuals relative to controls was observed in the right superior frontal gyrus. Regional GM volume decreases in FXS individuals relative to controls were observed in the left postcentral gyrus; the left middle temporal gyrus; and the left and right cerebellum. Regional GM volume decreases in the autism group relative to controls were observed in the left and right cerebellum. No significant increases in GM volume for the autism group compared to controls were observed.
Table 4.
Whole-brain analyses at FDR P < 0.05. Significant differences in GM volume between the FXS, autism, and comparison groups, controlling for total GM volume.
| Brain region | T | Cluster Size | MNI Coordinates | ||
|---|---|---|---|---|---|
| FXS > Control | |||||
| Frontal | |||||
| Left middle frontal gyrus | 4.60 | 1328 | -39 | 40 | 34 |
| Left superior frontal gyrus, medial part | 4.70 | 580 | -2 | 53 | 34 |
| Right middle frontal gyrus | 3.99 | 82 | 36 | 36 | 33 |
| Subcortical | |||||
| Left caudate nucleus′ | 7.60 | 6373 | -9 | 22 | 4 |
| Right caudate nucleus*′ | 7.62 | 6373 | 8 | 22 | -2 |
Note. All labels are derived from the AAL atlas (see text).
For these clusters, the peak voxel does not lie within the AAL atlas. For these, the label is derived from the nearest AAL labeled voxel.
Left and right caudate maxima belong to clusters that are contiguous.
Table 5.
Region of interest analyses after small volume correction at P < 0.05. Significant differences in GM volume between the FXS, autism, and comparison groups, controlling for total GM volume.
| Brain region | T | Cluster Size | MNI Coordinates | ||
|---|---|---|---|---|---|
| FXS > Control | |||||
| Frontal | |||||
| Right superior frontal gyrus | 3.66 | 1413 | 20 | 43 | 36 |
| Control > FXS | |||||
| Parietal | |||||
| Left postcentral gyrus | 4.83 | 467 | -64 | 3 | 21 |
| Temporal | |||||
| Left middle temporal gyrus | 4.74 | 269 | -64 | -2 | -21 |
| Cerebellum | |||||
| Left cerebellar lobule VIII/IX*′ | 4.33 | 865 | -6 | -66 | -48 |
| Right cerebellar lobule VIII/IX*′ | 4.53 | 385 | 10 | -67 | -57 |
| Control > Autism | |||||
| Cerebellum | |||||
| Left cerebellar lobule VIIB′ | 4.36 | 711 | -44 | -52 | -47 |
| Left cerebellar lobule VIII′ | 3.90 | 82 | -30 | -40 | -52 |
| Right cerebellar crus I | 4.16 | 204 | 55 | -52 | -37 |
Note. All labels are derived from the AAL atlas (see text).
For these clusters, the peak voxel does not lie within the AAL atlas. For these, the label is derived from the nearest AAL labeled voxel.
The following local maxima belong to clusters that are contiguous: 1) the left and right cerebellar lobule VIII/IX (which cross the cerebellar vermis), and 2) the left cerebellar lobule VIIB and VIII.
A voxel-wise partial correlation analysis of FSIQ controlling for total GM volume revealed that significant correlations existed with some of the reported structures. Positive correlations were observed for the left inferior frontal gyrus; the left and right inferior temporal gyri; the left middle temporal gyrus; the right fusiform gyrus; and the left and right cerebellum. Negative correlations were observed for the left and right middle frontal gyri; the left and right superior frontal gyri; and the left and right caudate nuclei (Table 6). Table 7 lists regional GM volume differences between the groups that remained significant after ANCOVA analysis controlling for both total GM and FSIQ using a mask of the identified regions found to correlate with FSIQ. At a FDR corrected threshold of P < 0.05, regional GM volume increases in the FXS group relative to the autism group were observed in the left and right caudate nuclei.
Table 6.
Significant partial correlations between reported regional GM volumes and FSIQ, controlling for total GM volume.
| Brain region | T | Cluster Size | MNI Coordinates | ||
|---|---|---|---|---|---|
| Frontal | |||||
| Left inferior frontal gyrus, operculum | 3.53 | 75 | -64 | 7 | 16 |
| Left middle frontal gyrus | -4.91 | 2617 | -38 | 40 | 38 |
| Left superior frontal gyrus, medial part | -4.91 | 2206 | -2 | 46 | 39 |
| Right middle frontal gyrus′ | -5.59 | 5841 | 40 | 33 | 39 |
| Right superior frontal gyrus′ | -4.84 | 5841 | 20 | 42 | 34 |
| Temporal | |||||
| Left inferior temporal gyrus | 3.78 | 288 | -49 | -16 | -34 |
| Left middle temporal gyrus | 4.61 | 1448 | -64 | -2 | -22 |
| Right inferior temporal gyrus* | 3.79 | 626 | 51 | -1 | -44 |
| Right fusiform gyrus* | 4.12 | 421 | 24 | 8 | -47 |
| Subcortical | |||||
| Left caudate nucleus′ | -4.67 | 929 | -9 | 20 | 7 |
| Right caudate nucleus*′ | -5.05 | 929 | 6 | 22 | -4 |
| Cerebellum | |||||
| Left Cerebellar Lobule VIII/IX*′ | 5.99 | 28199 | -4 | -66 | -45 |
| Right Cerebellar Lobule VIII/IX*′ | 5.45 | 28199 | 14 | -66 | -58 |
Note. All regions are significant at whole-brain FDR, P < 0.05. The sign of the t-statistic indicates whether the correlation coefficients are positive or negative partial correlations. All labels are derived from the AAL atlas (see text).
For these clusters, the peak voxel does not lie within the AAL atlas. For these, the label is derived from the nearest AAL labeled voxel.
The following local maxima belong to clusters that are contiguous: 1) the right middle and superior frontal gyri, 2) the left and right caudate, and 3) the left and right cerebellar lobule VIII/IX (which cross the cerebellar vermis).
Table 7.
Significant differences at FDR P < 0.05 between the FXS and autism groups in GM volume regions with partial correlations to FSIQ, controlling for total GM volume and FSIQ.
| Brain region | T | Cluster Size | MNI Coordinates | ||
|---|---|---|---|---|---|
| FXS > Autism | |||||
| Subcortical | |||||
| Left caudate nucleus | 4.78 | 162 | -7 | 16 | 8 |
| Right caudate nucleus | 4.46 | 38 | 10 | 22 | -1 |
Note. All labels are derived from the AAL atlas (see text).
A voxel-wise partial correlation analysis of gender controlling for total GM volume revealed no significant correlations with any of the reported structures.
3.3. Conjunction analysis results
Conjunction analyses revealed no regions of common GM volume increase or decrease in the autism and FXS groups relative to the control group at either the whole-brain FDR corrected level or the ROI small-volume corrected level. However, common regional volume decreases in the autism and control group relative to the FXS group at the FDR corrected level were observed in the left middle frontal gyrus; and the left and right caudate nuclei (Table 8). All further conjunction analyses results were significant after SVC at P < 0.05 and are listed in Table 9. In addition to the above reported structures, a common regional decrease in the left superior frontal gyrus was observed in the autism and control groups relative to the FXS group. Common regional increases in the autism and control groups relative to the FXS group were observed in the left postcentral gyrus, the left middle temporal gyrus, and the right fusiform gyrus. The FXS and control groups exhibited no common areas of regional decreases relative to the autism group, but did exhibit regions of common increases relative to the autism group in the left and right cerebellum.
Table 8.
Conjunction analyses results of differences in GM volume between groups significant at FDR, P < 0.05.
| Brain region | T | Cluster Size | MNI Coordinates | ||
|---|---|---|---|---|---|
| FXS > Autism & FXS > Control | |||||
| Frontal | |||||
| Left middle frontal gyrus | 4.51 | 120 | -39 | 40 | 34 |
| Subcortical | |||||
| Left caudate nucleus | 6.55 | 1293 | -7 | 16 | 8 |
| Right caudate nucleus | 6.03 | 875 | 7 | 20 | 0 |
Note. All labels are derived from the AAL atlas (see text).
Table 9.
Conjunction analyses results of differences in GM volume between groups significant using region of interest approach, P < 0.05.
| Brain region | T | Cluster Size | MNI Coordinates | ||
|---|---|---|---|---|---|
| FXS > Autism & FXS > Control | |||||
| Frontal | |||||
| Left superior frontal gyrus, medial part | 4.14 | 133 | -1 | 51 | 35 |
| Autism > FXS & Control > FXS | |||||
| Parietal | |||||
| Left postcentral gyrus | 4.83 | 467 | -64 | 3 | 21 |
| Temporal | |||||
| Left middle temporal gyrus | 4.39 | 225 | -62 | 2 | -24 |
| Right fusiform gyrus | 3.82 | 65 | 27 | 11 | -45 |
| FXS > Autism & Control > Autism | |||||
| Cerebellum | |||||
| Left cerebellar crus 1 | 3.58 | 41 | -31 | -61 | -33 |
| Right cerebellar crus I | 4.00 | 556 | 36 | -64 | -34 |
Note. All labels are derived from the AAL atlas (see text).
4. Discussion
As hypothesized, multiple brain regions were found to have GM volume differences between the FXS and autism groups. Four regions were observed to be significantly larger in the FXS group relative to both the autism and control groups in our separate group analyses, as well as in our conjunction analyses: the left middle and superior frontal gyri; and the left and right caudate nuclei. An increased caudate nucleus is among the most consistent neuroanatomical findings for FXS. The caudate together with the putamen forms the striatum, which is involved in neural circuits linking the basal ganglia to the cortex, with the most numerous of these to frontal cortex. Frontostriatal circuits are important for executive functions such as selection and perception of pertinent information, behavioral control and adaptation, and manipulation of information held in working memory (Chudasama and Robbins, 2006). As a result, frontostriatal dysfunction is thought to contribute to the behavioral phenotype of FXS, which includes executive function impairments, perseveration in language and behavior, attention problems, hyperactivity, and deficits in impulse control (Hagerman, 1997; Hjalgrim et al., 1999; Barnea-Goraly et al., 2003; Cornish et al., 2004; Menon et al., 2004; Hoeft et al., 2007). Although increased caudate findings are well replicated in FXS, there is a note of caution regarding our findings. Neuroleptic medication treatments have been previously associated with caudate volume increases in schizophrenia (Chakos et al., 1994; Keshavan et al., 1994). Medication use was not recorded for four of our FXS subjects, but for the remaining six, as well as all individuals in our autism and comparison groups, there was no history of neuroleptic use. Neuroleptics are not commonly prescribed to individuals with FXS, but nevertheless we cannot be certain that medication use is not a factor influencing our caudate findings.
For the autism group, six areas were significantly larger than the FXS group: the left inferior and middle frontal gyri; the right superior frontal gyrus; the right inferior temporal gyrus; the left middle temporal gyrus; and the right fusiform gyrus. None of these regions were also found to differ between the autism and control groups in our individual analyses. However, the middle temporal and fusiform gyri were found to be increased in both the control and autism groups relative to the FXS group in our conjunction analyses suggesting that these regions are areas of possible deficits in FXS rather than increases in autism. While no areas of increases in the autism group relative to the FXS and control groups were observed in either our individual group analyses or conjunction analyses, both analyses did reveal cerebellar crus I deficits in the autism group. The cerebellar crus I has previously been reported as reduced in autism compared to controls (Rojas et al., 2006) and has also been implicated in language processing (Gizewski et al., 2004; Gizewski et al., 2005; Frings et al., 2006). There is also evidence that the cerebellum has projections to inferior prefrontal cortex (Leiner et al., 1993), which was identified well over a century ago as key for language function and which has been implicated in the autism phenotype in both anatomical and functional studies (e.g., Herbert et al., 2002; Just et al., 2004; Harris et al., 2006). Our findings regarding cerebellar deficits and left prefrontal cortex increases may be suggestive of regions and circuits involved in the language deficits in autism, but not FXS.
Cerebellar anomalies are one of the most replicated neuroanatomical findings for both disorders individually. In our sample, cerebellar deficits relative to controls were observed in both individuals with FXS and autism, with the autism group exhibiting cerebellar deficits relative to both other groups. While cerebellar anomalies are one of the most consistent findings in autism, both increases (Piven et al., 1997b; Abell et al., 1999; Hardan et al., 2001; Sparks et al., 2002; Herbert et al., 2003; Palmen et al., 2005; Salmond et al., 2005; Ke et al., 2008) and decreases (Murakami et al., 1989; McAlonan et al., 2002; Boddaert et al., 2004; McAlonan et al., 2005; Rojas et al., 2006; Hallahan et al., 2009) in the cerebellar hemispheres, as well as negative findings (Kwon et al., 2004; Waiter et al., 2004; Brieber et al., 2007; Salmond et al., 2007) have been reported. With the exception of Boddaert et al. (2004) and McAlonan et al. (2005), the cited studies reporting deficits in the cerebellar hemispheres included older adults similar to the present study. The two studies reporting deficits in younger subjects (ages 7-15 and 8-14 respectively) found deficits restricted to white matter with no differences in cerebellar gray matter, and the age ranges of these studies are similar to the cited studies reporting negative cerebellar findings. Studies reporting increases have also tended to include younger groups although Piven et al. (1997), Abell et al. (1999), and Hardan et al. (2001) did include adults. The range of cerebellar findings, including our findings of cerebellar deficits, may be consistent with the hypothesis that brain maturation in individuals with autism is marked by an atypical developmental trajectory with early brain overgrowth followed by decreases in adolescence and adulthood (Courchesne et al., 2001; Aylward et al., 2002; Courchesne et al., 2003). In addition to age, other factors that have been suggested to contribute to the inconsistent cerebellar findings in autism have included small sample sizes, as well as differences in IQ, presence of epilepsy, and subcategory of ASD. In Hallahan et al. (2009), the effect of subgroup and IQ were investigated in a sample including 80 individuals with Asperger's disorder, 28 with autistic disorder, and 6 with PDD-NOS between the ages of 18 and 58 years. Significantly smaller total cerebellar volumes relative to controls were found in the autism group as a whole before and after correcting for both intracranial volume and IQ, as well in each subgroup except for those with PDD-NOS. There were, however, no differences in cerebellar volume between the ASD subgroups. In general, we suggest that age may be an important factor to consider in comparing across anatomical studies of autism.
Only one other neuroimaging study has directly compared individuals with FXS and autism, so therefore warrants additional comment. Based on the findings of Kaufmann et al. (2003), we hypothesized that larger effects would be observed in the FXS group for regions found to be atypical in both FXS and autism. An enlarged caudate nucleus and a reduction in the cerebellar vermis are among the most consistent neuroanatomical findings for both FXS and autism. In our sample, an enlarged caudate was observed in the FXS group relative to both the autism and control groups suggestive of greater effect sizes for the FXS group. In addition, reductions in the vermis were only observed in the FXS group relative to the control group. In contrast, cerebellar crus I volume deficits were observed in the autism group relative to both the FXS and control groups suggesting greater effect sizes for the autism group in this particular region of the cerebellum. More informative comparisons, however, cannot be made since Kaufmann et al. (2003) limited their analyses to measurements of the cerebellar vermis and intracranial space.
In addition to examining regional GM volume differences between the three groups, we proposed to examine the effect of controlling IQ on our results. The groups were matched for age, total GM, total white matter, brain to intracranial volume ratio, and handedness, but not IQ. While it has been argued that controlling for IQ either by matching subject groups for IQ or using IQ as a covariate in the analysis is needed for neuroanatomical investigations, there is some controversy concerning this issue (Yeung-Courchesne and Courchesne, 1997). We agree with Yeung-Courchesne and Courchesne (1997) that using IQ as a covariate in the analysis of group differences involving subjects with developmental disorders may essentially result in removing the variance inherent to the disorder. The main reason to include a covariate in an analysis of variance is the existence of a known confounding effect on the dependent variable. While it is true that IQ may affect brain volumes over time, it is equally true that brain volumes may impact IQ, although there is scant evidence for either proposition in the imaging literature. Covarying for IQ in the latter case would result in removing anatomical differences that are not only impacting IQ, but are also important features of the disorder being studied. In Rojas et al. (2006), we reported that IQ did not reliably predict regional brain volumes in a sample of people with autism and healthy controls, consistent with findings from a cortical thickness study of autism (Hadjikhani et al., 2006). In our present sample, a correlation analysis revealed that significant correlations existed for some, but not all, of the reported structures. Of the reported regions found to correlate with FSIQ, all were reported in contrasts involving the FXS group, and only the GM volume excesses observed in the right and left caudate for the FXS group relative to the autism group remain significant after covarying for FSIQ and total GM. Therefore, a possible consideration is that the correlations are being driven by the significantly lower FSIQ in the FXS group. Caudate volumes have been found to positively correlate with IQ in healthy controls, but negatively correlate with IQ in individuals with FXS (Reiss et al., 1995). In our sample, caudate volumes were also found to negatively correlate with IQ. However, given our limited findings specific to the autism group relative to the control group, these results are hard to interpret. Nonetheless, we suggest that caution is warranted in covarying IQ in anatomical studies since the causal relationship between brain volumes and IQ remains unknown, as well as the underlying assumption in doing so that IQ is dissociable from the disorder being studied.
This is the first study to directly compare whole-brain anatomy in FXS and autism. As such, it clearly warrants replication. There are two further limitations to this study. First, while inclusion in the autism group required that subjects test negative for the fragile X mutation, we do not have consistent autism measures for our FXS sample. And second, the sample size of ten in each group is relatively small so caution on the generalization of these findings is warranted. Given that autism and FXS are both developmental disorders, the distributed nature of the brain regions identified in this study is not surprising. While the etiology of autism remains largely unknown, FXS is diagnosed on the basis of a mutation in a single gene, FMR1. It is widely accepted, however, that both disorders lead to abnormal neuronal growth patterns early in development, which then further impact the development of functional connections between and within brain regions. FXS is often called a single-gene disorder. However, since FMRP is an mRNA binding protein that negatively regulates the translation of many mRNAs, it is a disorder that involves many genes, which have been found to be important for dendritic maturation and synaptic plasticity (Irwin et al., 2000; Grossman et al., 2006; Hagerman R.J. et al., 2008). FMRP dysregulation therefore leads to abnormal neuronal morphology and growth. It has been suggested that a subset of the genes regulated by FMRP is responsible for autism in FXS and that by comparing the two disorders, a starting point for investigations into the genetics of autism could be gained. With the exception of cerebellar deficits, although in different regions, the present study failed to find areas of similar abnormalities in both disorders relative to controls. However, given the exploratory nature of this study and the lack of consistent measures for autism in our FXS group, further studies will be needed to judge the potential of this approach.
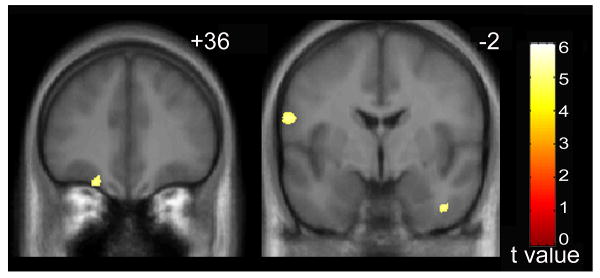
Fig. 1.

Increased gray matter volume in individuals with fragile X syndrome (n = 10) relative to individuals with autism (n = 10). Slice numbers (MNI y-coordinate) are shown in the upper right corner for each slice. From left to right, increases are observed in the left middle frontal gyrus; the left and right caudate nuclei; the left and right cingulate body; and the left and right cerebellum. Statistical maps are thresholded at a false discovery rate of P < 0.05 and overlaid onto the average T1-weighted image from the study (n = 30). Results presented in neurological convention (left hemisphere on the left).
Fig. 2.
Increased gray matter volume in individuals with autism (n = 10) relative to individuals with fragile X syndrome (n = 10). Slice numbers (MNI y-coordinate) are shown in the upper right corner for each slice. From left to right, increases are observed in the left middle frontal gyrus; and the right inferior temporal gyrus and the left inferior frontal gyrus. Statistical maps are thresholded at a false discovery rate of P < 0.05 and overlaid onto the average T1-weighted image from the study (n = 30). Results presented in neurological convention (left hemisphere on the left).
Acknowledgments
Funding for this study was provided by the National Institute of Child Health and Human Development (NICHHD) Grants HD041697, HD35468, and HD036071.
Footnotes
Publisher's Disclaimer: This is a PDF file of an unedited manuscript that has been accepted for publication. As a service to our customers we are providing this early version of the manuscript. The manuscript will undergo copyediting, typesetting, and review of the resulting proof before it is published in its final citable form. Please note that during the production process errors may be discovered which could affect the content, and all legal disclaimers that apply to the journal pertain.
References
- Abell F, Krams M, Ashburner J, Passingham R, Friston K, Frackowiak R, Happe F, Frith C, Frith U. The neuroanatomy of autism: a voxel-based whole brain analysis of structural scans. Neuroreport. 1999;10:1647–1651. doi: 10.1097/00001756-199906030-00005. [DOI] [PubMed] [Google Scholar]
- American Psychiatric Association. Diagnostic and Statistical Manual of Mental Disorders IV. APA; Washington, DC: 1994. [Google Scholar]
- Aylward EH, Minshew NJ, Field K, Sparks BF, Singh N. Effects of age on brain volume and head circumference in autism. Neurology. 2002;59:175–183. doi: 10.1212/wnl.59.2.175. [DOI] [PubMed] [Google Scholar]
- Bailey A, Le Couteur A, Gottesman I, Bolton P, Simonoff E, Yuzda E, Rutter M. Autism as a strongly genetic disorder: evidence from a British twin study. Psychological Medicine. 1995;25:63–77. doi: 10.1017/s0033291700028099. [DOI] [PubMed] [Google Scholar]
- Bailey DB, Jr, Mesibov GB, Hatton DD, Clark RD, Roberts JE, Mayhew L. Autistic behavior in young boys with fragile X syndrome. Journal of Autism and Developmental Disorders. 1998;28:499–508. doi: 10.1023/a:1026048027397. [DOI] [PubMed] [Google Scholar]
- Barnea-Goraly N, Eliez S, Hedeus M, Menon V, White CD, Moseley M, Reiss AL. White matter tract alterations in fragile X syndrome: preliminary evidence from diffusion tensor imaging. American Journal of Medical Genetics Part B: Neuropsychiatric Genetics. 2003;118:81–88. doi: 10.1002/ajmg.b.10035. [DOI] [PubMed] [Google Scholar]
- Baumgardner TL, Reiss AL, Freund LS, Abrams MT. Specification of the neurobehavioral phenotype in males with fragile X syndrome. Pediatrics. 1995;95:744–752. [PubMed] [Google Scholar]
- Boddaert N, Chabane N, Gervais H, Good CD, Bourgeois M, Plumet MH, Barthelemy C, Mouren MC, Artiges E, Samson Y, Brunelle F, Frackowiak RS, Zilbovicius M. Superior temporal sulcus anatomical abnormalities in childhood autism: a voxel-based morphometry MRI study. Neuroimage. 2004;23:364–369. doi: 10.1016/j.neuroimage.2004.06.016. [DOI] [PubMed] [Google Scholar]
- Brieber S, Neufang S, Bruning N, Kamp-Becker I, Remschmidt H, Herpertz-Dahlmann B, Fink GR, Konrad K. Structural brain abnormalities in adolescents with autism spectrum disorder and patients with attention deficit/hyperactivity disorder. Journal of Child Psychology and Psychiatry and Allied Disciplines. 2007;48:1251–1258. doi: 10.1111/j.1469-7610.2007.01799.x. [DOI] [PubMed] [Google Scholar]
- Brown WT, Friedman E, Jenkins EC, Brooks J, Wisniewski K, Raguthu S, French JH. Association of fragile X syndrome with autism. Lancet. 1982a;1:100. doi: 10.1016/s0140-6736(82)90231-8. [DOI] [PubMed] [Google Scholar]
- Brown WT, Jenkins EC, Friedman E, Brooks J, Wisniewski K, Raguthu S, French J. Autism is associated with the fragile-X syndrome. Journal of Autism and Developmental Disorders. 1982b;12:303–308. doi: 10.1007/BF01531375. [DOI] [PubMed] [Google Scholar]
- Centers for Disease Control and Prevention. Prevalence of Autism Spectrum Disorders -Autism and Developmental Disabilities Monitoring Network, 14 Sites, United States, 2002. Surveillance Summaries. 2007 February 9;56(1228) MMWR. [PubMed] [Google Scholar]
- Chakos MH, Lieberman JA, Bilder RM, Borenstein M, Lerner G, Bogerts B, Wu H, Kinon B, Ashtari M. Increase in caudate nuclei volumes of first-episode schizophrenic patients taking antipsychotic drugs. American Journal of Psychiatry. 1994;151:1430–1436. doi: 10.1176/ajp.151.10.1430. [DOI] [PubMed] [Google Scholar]
- Chudasama Y, Robbins TW. Functions of frontostriatal systems in cognition: comparative neuropsychopharmacological studies in rats, monkeys and humans. Biological Psychology. 2006;73:19–38. doi: 10.1016/j.biopsycho.2006.01.005. [DOI] [PubMed] [Google Scholar]
- Cornish K, Swainson R, Cunnington R, Wilding J, Morris P, Jackson G. Do women with fragile X syndrome have problems in switching attention: preliminary findings from ERP and fMRI. Brain and Cognition. 2004;54:235–239. doi: 10.1016/j.bandc.2004.02.017. [DOI] [PubMed] [Google Scholar]
- Courchesne E. Brainstem, cerebellar and limbic neuroanatomical abnormalities in autism. Current Opinion in Neurobiology. 1997;7:269–278. doi: 10.1016/s0959-4388(97)80016-5. [DOI] [PubMed] [Google Scholar]
- Courchesne E, Carper R, Akshoomoff N. Evidence of brain overgrowth in the first year of life in autism. Journal of the American Medical Association. 2003;290:337–344. doi: 10.1001/jama.290.3.337. [DOI] [PubMed] [Google Scholar]
- Courchesne E, Karns CM, Davis HR, Ziccardi R, Carper RA, Tigue ZD, Chisum HJ, Moses P, Pierce K, Lord C, Lincoln AJ, Pizzo S, Schreibman L, Haas RH, Akshoomoff NA, Courchesne RY. Unusual brain growth patterns in early life in patients with autistic disorder: an MRI study. Neurology. 2001;57:245–254. doi: 10.1212/wnl.57.2.245. [DOI] [PubMed] [Google Scholar]
- Courchesne E, Saitoh O, Yeung-Courchesne R, Press GA, Lincoln AJ, Haas RH, Schreibman L. Abnormality of cerebellar vermian lobules VI and VII in patients with infantile autism: identification of hypoplastic and hyperplastic subgroups with MR imaging. AJR. American Journal of Roentgenology. 1994;162:123–130. doi: 10.2214/ajr.162.1.8273650. [DOI] [PubMed] [Google Scholar]
- Courchesne E, Yeung-Courchesne R, Press GA, Hesselink JR, Jernigan TL. Hypoplasia of cerebellar vermal lobules VI and VII in autism. New England Journal of Medicine. 1988;318:1349–1354. doi: 10.1056/NEJM198805263182102. [DOI] [PubMed] [Google Scholar]
- Egaas B, Courchesne E, Saitoh O. Reduced size of corpus callosum in autism. Archives of Neurology. 1995;52:794–801. doi: 10.1001/archneur.1995.00540320070014. [DOI] [PubMed] [Google Scholar]
- Eliez S, Blasey CM, Freund LS, Hastie T, Reiss AL. Brain anatomy, gender and IQ in children and adolescents with fragile X syndrome. Brain. 2001;124:1610–1618. doi: 10.1093/brain/124.8.1610. [DOI] [PubMed] [Google Scholar]
- Frings M, Dimitrova A, Schorn CF, Elles HG, Hein-Kropp C, Gizewski ER, Diener HC, Timmann D. Cerebellar involvement in verb generation: an fMRI study. Neuroscience Letters. 2006;409:19–23. doi: 10.1016/j.neulet.2006.08.058. [DOI] [PubMed] [Google Scholar]
- Gaffney GR, Tsai LY, Kuperman S, Minchin S. Cerebellar structure in autism. American Journal of Diseases of Children. 1987;141:1330–1332. doi: 10.1001/archpedi.1987.04460120096044. [DOI] [PubMed] [Google Scholar]
- Gizewski ER, Lambertz N, Ladd ME, Timmann D, Forsting M. Cerebellar activation patterns in deaf participants for perception of sign language and written text. Neuroreport. 2005;16:1913–1917. doi: 10.1097/01.wnr.0000186592.41587.3e. [DOI] [PubMed] [Google Scholar]
- Gizewski ER, Timmann D, Forsting M. Specific cerebellar activation during Braille reading in blind subjects. Human Brain Mapping. 2004;22:229–235. doi: 10.1002/hbm.20031. [DOI] [PMC free article] [PubMed] [Google Scholar]
- Good CD, Johnsrude IS, Ashburner J, Henson RN, Friston KJ, Frackowiak RS. A voxel-based morphometric study of ageing in 465 normal adult human brains. Neuroimage. 2001;14:21–36. doi: 10.1006/nimg.2001.0786. [DOI] [PubMed] [Google Scholar]
- Gothelf D, Furfaro JA, Hoeft F, Eckert MA, Hall SS, O'Hara R, Erba HW, Ringel J, Hayashi KM, Patnaik S, Golianu B, Kraemer HC, Thompson PM, Piven J, Reiss AL. Neuroanatomy of fragile X syndrome is associated with aberrant behavior and the fragile X mental retardation protein (FMRP) Annals of Neurology. 2007;63:40–51. doi: 10.1002/ana.21243. [DOI] [PMC free article] [PubMed] [Google Scholar]
- Grossman AW, Aldridge GM, Weiler IJ, Greenough WT. Local protein synthesis and spine morphogenesis: fragile X syndrome and beyond. Journal of Neuroscience. 2006;26:7151–7155. doi: 10.1523/JNEUROSCI.1790-06.2006. [DOI] [PMC free article] [PubMed] [Google Scholar]
- Hadjikhani N, Joseph RM, Snyder J, Tager-Flusberg H. Anatomical differences in the mirror neuron system and social cognition network in autism. Cerebral Cortex. 2006;16:1276–1282. doi: 10.1093/cercor/bhj069. [DOI] [PubMed] [Google Scholar]
- Hagerman PJ. The fragile X prevalence paradox. Journal of Medical Genetics. 2008;45:498–499. doi: 10.1136/jmg.2008.059055. [DOI] [PMC free article] [PubMed] [Google Scholar]
- Hagerman RJ. Fragile X syndrome. Molecular and clinical insights and treatment issues. Western Journal of Medicine. 1997;166:129–137. [PMC free article] [PubMed] [Google Scholar]
- Hagerman RJ. Lessons from fragile X regarding neurobiology, autism, and neurodegeneration. Journal of Developmental and Behavioral Pediatrics. 2006;27:63–74. doi: 10.1097/00004703-200602000-00012. [DOI] [PubMed] [Google Scholar]
- Hagerman RJ, Jackson AW, 3rd, Levitas A, Rimland B, Braden M. An analysis of autism in fifty males with the fragile X syndrome. American Journal of Medical Genetics. 1986;23:359–374. doi: 10.1002/ajmg.1320230128. [DOI] [PubMed] [Google Scholar]
- Hagerman RJ, Rivera S, Hagerman PJ. The fragile X family of disorders: a model for autism and targeted treatments. Current Pediatric Reviews. 2008;4:40–52. [Google Scholar]
- Hallahan B, Daly EM, McAlonan G, Loth E, Toal F, O'Brien F, Robertson D, Hales S, Murphy C, Murphy KC, Murphy DG. Brain morphometry volume in autistic spectrum disorder: a magnetic resonance imaging study of adults. Psychological Medicine. 2009;39:337–346. doi: 10.1017/S0033291708003383. [DOI] [PubMed] [Google Scholar]
- Hardan AY, Minshew NJ, Harenski K, Keshavan MS. Posterior fossa magnetic resonance imaging in autism. Journal of the American Academy of Child and Adolescent Psychiatry. 2001;40:666–672. doi: 10.1097/00004583-200106000-00011. [DOI] [PubMed] [Google Scholar]
- Harris GJ, Chabris CF, Clark J, Urban T, Aharon I, Steele S, McGrath L, Condouris K, Tager-Flusberg H. Brain activation during semantic processing in autism spectrum disorders via functional magnetic resonance imaging. Brain and Cognition. 2006;61:54–68. doi: 10.1016/j.bandc.2005.12.015. [DOI] [PubMed] [Google Scholar]
- Hashimoto T, Tayama M, Miyazaki M, Murakawa K, Kuroda Y. Brainstem and cerebellar vermis involvement in autistic children. Journal of Child Neurology. 1993;8:149–153. doi: 10.1177/088307389300800207. [DOI] [PubMed] [Google Scholar]
- Herbert MR. Large brains in autism: the challenge of pervasive abnormality. Neuroscientist. 2005;11:417–440. doi: 10.1177/0091270005278866. [DOI] [PubMed] [Google Scholar]
- Herbert MR, Harris GJ, Adrien KT, Ziegler DA, Makris N, Kennedy DN, Lange NT, Chabris CF, Bakardjiev A, Hodgson J, Takeoka M, Tager-Flusberg H, Caviness VS., Jr Abnormal asymmetry in language association cortex in autism. Annals of Neurology. 2002;52:588–596. doi: 10.1002/ana.10349. [DOI] [PubMed] [Google Scholar]
- Herbert MR, Ziegler DA, Deutsch CK, O'Brien LM, Lange N, Bakardjiev A, Hodgson J, Adrien KT, Steele S, Makris N, Kennedy D, Harris GJ, Caviness VS., Jr Dissociations of cerebral cortex, subcortical and cerebral white matter volumes in autistic boys. Brain. 2003;126:1182–1192. doi: 10.1093/brain/awg110. [DOI] [PubMed] [Google Scholar]
- Hjalgrim H, Jacobsen TB, Norgaard K, Lou HC, Brondum-Nielsen K, Jonassen O. Frontal-subcortical hypofunction in the fragile X syndrome. American Journal of Medical Genetics. 1999;83:140–141. [PubMed] [Google Scholar]
- Hoeft F, Hernandez A, Parthasarathy S, Watson CL, Hall SS, Reiss AL. Fronto-striatal dysfunction and potential compensatory mechanisms in male adolescents with fragile X syndrome. Human Brain Mapping. 2007;28:543–554. doi: 10.1002/hbm.20406. [DOI] [PMC free article] [PubMed] [Google Scholar]
- Hollander E, Anagnostou E, Chaplin W, Esposito K, Haznedar MM, Licalzi E, Wasserman S, Soorya L, Buchsbaum M. Striatal volume on magnetic resonance imaging and repetitive behaviors in autism. Biological Psychiatry. 2005;58:226–232. doi: 10.1016/j.biopsych.2005.03.040. [DOI] [PubMed] [Google Scholar]
- Irwin SA, Galvez R, Greenough WT. Dendritic spine structural anomalies in fragile-X mental retardation syndrome. Cerebral Cortex. 2000;10:1038–1044. doi: 10.1093/cercor/10.10.1038. [DOI] [PubMed] [Google Scholar]
- Just MA, Cherkassky VL, Keller TA, Minshew NJ. Cortical activation and synchronization during sentence comprehension in high-functioning autism: evidence of underconnectivity. Brain. 2004;127:1811–1821. doi: 10.1093/brain/awh199. [DOI] [PubMed] [Google Scholar]
- Kaufmann WE, Cooper KL, Mostofsky SH, Capone GT, Kates WR, Newschaffer CJ, Bukelis I, Stump MH, Jann AE, Lanham DC. Specificity of cerebellar vermian abnormalities in autism: a quantitative magnetic resonance imaging study. Journal of Child Neurology. 2003;18:463–470. doi: 10.1177/08830738030180070501. [DOI] [PubMed] [Google Scholar]
- Ke X, Hong S, Tang T, Zou B, Li H, Hang Y, Zhou Z, Ruan Z, Lu Z, Tao G, Liu Y. Voxel-based morphometry study on brain structure in children with high-functioning autism. Neuroreport. 2008;19:921–925. doi: 10.1097/WNR.0b013e328300edf3. [DOI] [PubMed] [Google Scholar]
- Kerby DS, Dawson BL. Autistic features, personality, and adaptive behavior in males with the fragile X syndrome and no autism. American Journal of Mental Retardation. 1994;98:455–462. [PubMed] [Google Scholar]
- Keshavan MS, Bagwell WW, Haas GL, Sweeney JA, Schooler NR, Pettegrew JW. Changes in caudate volume with neuroleptic treatment. Lancet. 1994;344:1434. doi: 10.1016/s0140-6736(94)90599-1. [DOI] [PubMed] [Google Scholar]
- Kielinen M, Rantala H, Timonen E, Linna SL, Moilanen I. Associated medical disorders and disabilities in children with autistic disorder: a population-based study. Autism. 2004;8:49–60. doi: 10.1177/1362361304040638. [DOI] [PubMed] [Google Scholar]
- Kwon H, Ow AW, Pedatella KE, Lotspeich LJ, Reiss AL. Voxel-based morphometry elucidates structural neuroanatomy of high-functioning autism and Asperger syndrome. Developmental Medicine and Child Neurology. 2004;46:760–764. doi: 10.1017/s0012162204001306. [DOI] [PubMed] [Google Scholar]
- Langen M, Durston S, Staal WG, Palmen SJ, van Engeland H. Caudate nucleus is enlarged in high-functioning medication-naive subjects with autism. Biological Psychiatry. 2007;62:262–266. doi: 10.1016/j.biopsych.2006.09.040. [DOI] [PubMed] [Google Scholar]
- Lee AD, Leow AD, Lu A, Reiss AL, Hall S, Chiang MC, Toga AW, Thompson PM. 3D pattern of brain abnormalities in Fragile X syndrome visualized using tensor-based morphometry. Neuroimage. 2007;34:924–938. doi: 10.1016/j.neuroimage.2006.09.043. [DOI] [PMC free article] [PubMed] [Google Scholar]
- Leiner HC, Leiner AL, Dow RS. Cognitive and language functions of the human cerebellum. Trends in Neurosciences. 1993;16:444–447. doi: 10.1016/0166-2236(93)90072-t. [DOI] [PubMed] [Google Scholar]
- Levitt JG, Blanton R, Capetillo-Cunliffe L, Guthrie D, Toga A, McCracken JT. Cerebellar vermis lobules VIII-X in autism. Progress in Neuro-Psychopharmacology and Biological Psychiatry. 1999;23:625–633. doi: 10.1016/s0278-5846(99)00021-4. [DOI] [PubMed] [Google Scholar]
- Lord C, Risi S, Lambrecht L, Cook EH, Leventhal BL, DiLavore PC, Pickles A, Rutter M. The autism diagnostic observation schedule-generic: a standard measure of social and communication deficits associated with the spectrum of autism. Journal of Autism and Developmental Disorders. 2000;30:205–223. [PubMed] [Google Scholar]
- Lord C, Rutter M, Le Couteur A. Autism Diagnostic Interview-Revised: a revised version of a diagnostic interview for caregivers of individuals with possible pervasive developmental disorders. Journal of Autism and Developmental Disorders. 1994;24:659–685. doi: 10.1007/BF02172145. [DOI] [PubMed] [Google Scholar]
- Manes F, Piven J, Vrancic D, Nanclares V, Plebst C, Starkstein SE. An MRI study of the corpus callosum and cerebellum in mentally retarded autistic individuals. Journal of Neuropsychiatry and Clinical Neurosciences. 1999;11:470–474. doi: 10.1176/jnp.11.4.470. [DOI] [PubMed] [Google Scholar]
- McAlonan GM, Cheung V, Cheung C, Suckling J, Lam GY, Tai KS, Yip L, Murphy DG, Chua SE. Mapping the brain in autism. A voxel-based MRI study of volumetric differences and intercorrelations in autism. Brain. 2005;128:268–276. doi: 10.1093/brain/awh332. [DOI] [PubMed] [Google Scholar]
- McAlonan GM, Daly E, Kumari V, Critchley HD, van Amelsvoort T, Suckling J, Simmons A, Sigmundsson T, Greenwood K, Russell A, Schmitz N, Happe F, Howlin P, Murphy DG. Brain anatomy and sensorimotor gating in Asperger's syndrome. Brain. 2002;125:1594–1606. doi: 10.1093/brain/awf150. [DOI] [PubMed] [Google Scholar]
- Menon V, Leroux J, White CD, Reiss AL. Frontostriatal deficits in fragile X syndrome: relation to FMR1 gene expression. Proceedings of the National Academy of Sciences of the United States of America. 2004;101:3615–3620. doi: 10.1073/pnas.0304544101. [DOI] [PMC free article] [PubMed] [Google Scholar]
- Meryash DL, Szymanski LS, Gerald PS. Infantile autism associated with the fragile-X syndrome. Journal of Autism and Developmental Disorders. 1982;12:295–301. doi: 10.1007/BF01531374. [DOI] [PubMed] [Google Scholar]
- Mostofsky SH, Mazzocco MM, Aakalu G, Warsofsky IS, Denckla MB, Reiss AL. Decreased cerebellar posterior vermis size in fragile X syndrome: correlation with neurocognitive performance. Neurology. 1998;50:121–130. doi: 10.1212/wnl.50.1.121. [DOI] [PubMed] [Google Scholar]
- Murakami JW, Courchesne E, Press GA, Yeung-Courchesne R, Hesselink JR. Reduced cerebellar hemisphere size and its relationship to vermal hypoplasia in autism. Archives of Neurology. 1989;46:689–694. doi: 10.1001/archneur.1989.00520420111032. [DOI] [PubMed] [Google Scholar]
- Palmen SJ, Hulshoff Pol HE, Kemner C, Schnack HG, Durston S, Lahuis BE, Kahn RS, Van Engeland H. Increased gray-matter volume in medication-naive high-functioning children with autism spectrum disorder. Psychological Medicine. 2005;35:561–570. doi: 10.1017/s0033291704003496. [DOI] [PubMed] [Google Scholar]
- Palmen SJ, van Engeland H. Review on structural neuroimaging findings in autism. Journal of Neural Transmission. 2004;111:903–929. doi: 10.1007/s00702-003-0068-9. [DOI] [PubMed] [Google Scholar]
- Penn HE. Neurobiological correlates of autism: a review of recent research. Child Neuropsychology. 2006;12:57–79. doi: 10.1080/09297040500253546. [DOI] [PubMed] [Google Scholar]
- Piven J, Arndt S, Bailey J, Andreasen N. Regional brain enlargement in autism: a magnetic resonance imaging study. Journal of the American Academy of Child and Adolescent Psychiatry. 1996;35:530–536. doi: 10.1097/00004583-199604000-00020. [DOI] [PubMed] [Google Scholar]
- Piven J, Bailey J, Ranson BJ, Arndt S. An MRI study of the corpus callosum in autism. American Journal of Psychiatry. 1997a;154:1051–1056. doi: 10.1176/ajp.154.8.1051. [DOI] [PubMed] [Google Scholar]
- Piven J, Saliba K, Bailey J, Arndt S. An MRI study of autism: the cerebellum revisited. Neurology. 1997b;49:546–551. doi: 10.1212/wnl.49.2.546. [DOI] [PubMed] [Google Scholar]
- Redcay E, Courchesne E. When is the brain enlarged in autism? A meta-analysis of all brain size reports. Biological Psychiatry. 2005;58:1–9. doi: 10.1016/j.biopsych.2005.03.026. [DOI] [PubMed] [Google Scholar]
- Reddy KS. Cytogenetic abnormalities and fragile-X syndrome in Autism Spectrum Disorder. BMC Medical Genetics. 2005;6:3. doi: 10.1186/1471-2350-6-3. [DOI] [PMC free article] [PubMed] [Google Scholar]
- Reiss AL, Abrams MT, Greenlaw R, Freund L, Denckla MB. Neurodevelopmental effects of the FMR-1 full mutation in humans. Natural Medicines. 1995;1:159–167. doi: 10.1038/nm0295-159. [DOI] [PubMed] [Google Scholar]
- Reiss AL, Aylward E, Freund LS, Joshi PK, Bryan RN. Neuroanatomy of fragile X syndrome: the posterior fossa. Annals of Neurology. 1991a;29:26–32. doi: 10.1002/ana.410290107. [DOI] [PubMed] [Google Scholar]
- Reiss AL, Freund L, Tseng JE, Joshi PK. Neuroanatomy in fragile X females: the posterior fossa. American Journal of Human Genetics. 1991b;49:279–288. [PMC free article] [PubMed] [Google Scholar]
- Reiss AL, Patel S, Kumar AJ, Freund L. Preliminary communication: neuroanatomical variations of the posterior fossa in men with the fragile X (Martin-Bell) syndrome. American Journal of Medical Genetics. 1988;31:407–414. doi: 10.1002/ajmg.1320310220. [DOI] [PubMed] [Google Scholar]
- Rogers SJ, Wehner DE, Hagerman R. The behavioral phenotype in fragile X: symptoms of autism in very young children with fragile X syndrome, idiopathic autism, and other developmental disorders. Journal of Developmental and Behavioral Pediatrics. 2001;22:409–417. doi: 10.1097/00004703-200112000-00008. [DOI] [PubMed] [Google Scholar]
- Rojas DC, Peterson E, Winterrowd E, Reite ML, Rogers SJ, Tregellas JR. Regional gray matter volumetric changes in autism associated with social and repetitive behavior symptoms. BMC Psychiatry. 2006;6:56. doi: 10.1186/1471-244X-6-56. [DOI] [PMC free article] [PubMed] [Google Scholar]
- Salmond CH, Ashburner J, Connelly A, Friston KJ, Gadian DG, Vargha-Khadem F. The role of the medial temporal lobe in autistic spectrum disorders. European Journal of Neuroscience. 2005;22:764–772. doi: 10.1111/j.1460-9568.2005.04217.x. [DOI] [PubMed] [Google Scholar]
- Salmond CH, Vargha-Khadem F, Gadian DG, de Haan M, Baldeweg T. Heterogeneity in the patterns of neural abnormality in autistic spectrum disorders: evidence from ERP and MRI. Cortex. 2007;43:686–699. doi: 10.1016/s0010-9452(08)70498-2. [DOI] [PubMed] [Google Scholar]
- Schaefer GB, Lutz RE. Diagnostic yield in the clinical genetic evaluation of autism spectrum disorders. Genetics in Medicine. 2006;8:549–556. doi: 10.1097/01.gim.0000237789.98842.f1. [DOI] [PubMed] [Google Scholar]
- Sears LL, Vest C, Mohamed S, Bailey J, Ranson BJ, Piven J. An MRI study of the basal ganglia in autism. Progress in Neuro-Psychopharmacology and Biological Psychiatry. 1999;23:613–624. doi: 10.1016/s0278-5846(99)00020-2. [DOI] [PubMed] [Google Scholar]
- Sparks BF, Friedman SD, Shaw DW, Aylward EH, Echelard D, Artru AA, Maravilla KR, Giedd JN, Munson J, Dawson G, Dager SR. Brain structural abnormalities in young children with autism spectrum disorder. Neurology. 2002;59:184–192. doi: 10.1212/wnl.59.2.184. [DOI] [PubMed] [Google Scholar]
- Spitzer RL, Endicott J, Robins E. Research diagnostic criteria: rationale and reliability. Archives of General Psychiatry. 1978;35:773–782. doi: 10.1001/archpsyc.1978.01770300115013. [DOI] [PubMed] [Google Scholar]
- Steffenburg S, Gillberg C, Hellgren L, Andersson L, Gillberg IC, Jakobsson G, Bohman M. A twin study of autism in Denmark, Finland, Iceland, Norway and Sweden. Journal of Child Psychology and Psychiatry and Allied Disciplines. 1989;30:405–416. doi: 10.1111/j.1469-7610.1989.tb00254.x. [DOI] [PubMed] [Google Scholar]
- Tassone F, Hagerman RJ, Ikle DN, Dyer PN, Lampe M, Willemsen R, Oostra BA, Taylor AK. FMRP expression as a potential prognostic indicator in fragile X syndrome. American Journal of Medical Genetics. 1999;84:250–261. [PubMed] [Google Scholar]
- Tzourio-Mazoyer N, Landeau B, Papathanassiou D, Crivello F, Etard O, Delcroix N, Mazoyer B, Joliot M. Automated anatomical labeling of activations in SPM using a macroscopic anatomical parcellation of the MNI MRI single-subject brain. Neuroimage. 2002;15:273–289. doi: 10.1006/nimg.2001.0978. [DOI] [PubMed] [Google Scholar]
- Verkerk AJ, Pieretti M, Sutcliffe JS, Fu YH, Kuhl DP, Pizzuti A, Reiner O, Richards S, Victoria MF, Zhang FP, et al. Identification of a gene (FMR-1) containing a CGG repeat coincident with a breakpoint cluster region exhibiting length variation in fragile X syndrome. Cell. 1991;65:905–914. doi: 10.1016/0092-8674(91)90397-h. [DOI] [PubMed] [Google Scholar]
- Voelbel GT, Bates ME, Buckman JF, Pandina G, Hendren RL. Caudate nucleus volume and cognitive performance: Are they related in childhood psychopathology? Biological Psychiatry. 2006;60:942–950. doi: 10.1016/j.biopsych.2006.03.071. [DOI] [PMC free article] [PubMed] [Google Scholar]
- Waiter GD, Williams JH, Murray AD, Gilchrist A, Perrett DI, Whiten A. A voxel-based investigation of brain structure in male adolescents with autistic spectrum disorder. Neuroimage. 2004;22:619–625. doi: 10.1016/j.neuroimage.2004.02.029. [DOI] [PubMed] [Google Scholar]
- Wassink TH, Piven J, Patil SR. Chromosomal abnormalities in a clinic sample of individuals with autistic disorder. Psychiatric Genetics. 2001;11:57–63. doi: 10.1097/00041444-200106000-00001. [DOI] [PubMed] [Google Scholar]
- Wechsler D. Wechsler Adult Intelligence Scale-Revised Manual. Psychological Corporation; San Antonio, TX: 1981. [Google Scholar]
- Wechsler D. Wechsler Adult Intelligence Scale-III manual. Psychological Corporation; San Antonio, TX: 1997. [Google Scholar]
- Willcutt EG, Pennington BF, Boada R, Ogline JS, Tunick RA, Chhabildas NA, Olson RK. A comparison of the cognitive deficits in reading disability and attention-deficit/hyperactivity disorder. Journal of Abnormal Psychology. 2001;110:157–172. doi: 10.1037//0021-843x.110.1.157. [DOI] [PubMed] [Google Scholar]
- Worsley KJ, Marrett S, Neelin P, Vandal AC, Friston KJ, Evans AC. A unified statistical approach for determining significant voxels in images of cerebral activation. Human Brain Mapping. 1996;4:58–73. doi: 10.1002/(SICI)1097-0193(1996)4:1<58::AID-HBM4>3.0.CO;2-O. [DOI] [PubMed] [Google Scholar]
- Yang MS, Gill M. A review of gene linkage, association and expression studies in autism and an assessment of convergent evidence. International Journal of Developmental Neuroscience. 2007;25:69–85. doi: 10.1016/j.ijdevneu.2006.12.002. [DOI] [PubMed] [Google Scholar]
- Yeung-Courchesne R, Courchesne E. From impasse to insight in autism research: from behavioral symptoms to biological explanations. Development and Psychopathology. 1997;9:389–419. doi: 10.1017/s0954579497002101. [DOI] [PubMed] [Google Scholar]