Abstract
We developed high resolution L(Y)SO detectors for human and animal PET applications using Photomultiplier-quadrant-sharing (PQS) technology. The crystal sizes were 1.27 × 1.27 × 10 mm3 for the animal PQS-blocks and 3.25 × 3.25 × 20 mm3 for human ones. Polymer mirror film patterns (PMR) were placed between crystals as reflector. The blocks were assembled together using optical grease and wrapped by Teflon tape. The blocks were coupled to regular round PMT’s of 19/51 mm in PQS configuration. List-mode data of Ga-68 source (511 KeV) were acquired with our high yield pileup-event recovery (HYPER) electronics and data acquisition software. The high voltage bias was 1100V. Crystal decoding maps and individual crystal energy resolutions were extracted from the data. To investigate the potential imaging resolution of the PET cameras with these blocks, we used GATE (Geant4 Application for Tomographic Emission) simulation package. GATE is a GEANT4 based software toolkit for realistic simulation of PET and SPECT systems. The packing fractions of these blocks were found to be 95.6% and 98.2%. From the decoding maps, all 196 and 225 crystals were clearly identified. The average energy resolutions were 14.0% and 15.6%. For small animal PET systems, the detector ring diameter was 16.5 cm with an axial field of view (AFOV) of 11.8 cm. The simulation data suggests that a reconstructed radial (tangential) spatial resolution of 1.24 (1.25) mm near the center is potentially achievable. For the wholebody human PET systems, the detector ring diameter was 86 cm. The simulation data suggests that a reconstructed radial (tangential) spatial resolution of 3.09(3.38) mm near the center is potentially achievable. From this study we can conclude that PQS design could achieve high spatial resolutions and excellent energy resolutions on human and animal PET systems with substantially lower production costs and inexpensive readout devices.
Index Terms: PET, animal and human PET detectors, photomultiplier-quadrant-sharing, PQS, LSO, LYSO
I. INTRODUCTION
High-resolution detector blocks have been developed for human and animal PET systems using the Photomultiplier-quadrant-sharing (PQS) decoding technology and L(Y)SO crystals. Our goal is to develop high-resolution and high-sensitivity PET cameras with lower production costs, [1]. In previous work, we demonstrated the decoding capability of the PQS technology with BGO and GSO scintillation detectors [2] to [4]. Due to that LSO/LYSO have a high optical light yield (BGO: GSO: L(Y)SO = 1: 2.5: 5), a short attenuation length (10.4: 14.1: 11.4, in mm), and a short decay time (300: 60: 40, in ns) [5], it should be possible to develop L(Y)SO PQS-PET detectors with better performance than the previous ones. The aim of this study was to test the decoding limits of the lower cost PQS analog decoding technique, to develop high resolution PQS PET detectors with L(Y)SO crystals, to characterize the detector performance, and to estimate the potential PET imaging resolutions that can be achieved with such a detector design, using Monte Carlo simulations.
II. MATERIALS AND METHODS
A. Materials
LYSO crystals from Crystal Photonics, Inc. (Sanford, Florida, U.S.A.) and circular 19 mm PMT (XP1912) from Photonis Imaging Sensors (Beauregard, Bride Cedex, France) were used for the animal PET detector studies. LSO crystals from Siemens Molecular Imaging (Malvern, Pennsylvania, U.S.A.) and circular 51 mm PMT (XP52Y2) from Photonis Imaging Sensors were used for the human PET detector studies. The LYSO crystals were segmented with dimensions of 1.27 × 1.27 × 10 mm3. The surface was finished by polishing with lapping motion to 4 µm (lapped to 4 µm) on five crystal surfaces and polished smoothly (<1 µm) on one end. The LYSO individual crystals were assembled in a 14 × 14 array block detector for animal PET application. The dimensions of the LSO crystals were 3.25 × 3.25 × 20 mm3 and surface finishing was lapped in our lab, from 10 µm to 4 µm on five crystal surfaces and one end was polished (<1 µm). For human PET application, LSO individual crystals were used to develop a block detector with 15 × 15 array. For controlling light sharing we placed reflector patterns between adjacent crystals, [3] and [4]. For the reflectors patterns, we used 3M Vikuiti™ ESR (enhanced spectral reflector) film from 3M (St. Paul, Minnesota, U.S.A.); which is a multilayered polymer film with high reflectance of 98.5% across the visible light spectrum and a thickness of 0.065 mm, [6].
B. Methods
To achieve the 4 µm crystal surface finishing in the LSO scintillators, we polished with lapping motion, five surfaces of individual crystals samples with 10µm finishing. For the lapping process, aluminum oxide lapping film placed in a grinding-polishing machine (MultiPrep™ System) from Allied High Tech Products, Inc. (Rancho Dominguez, CA, U.S.A) [7], was used.
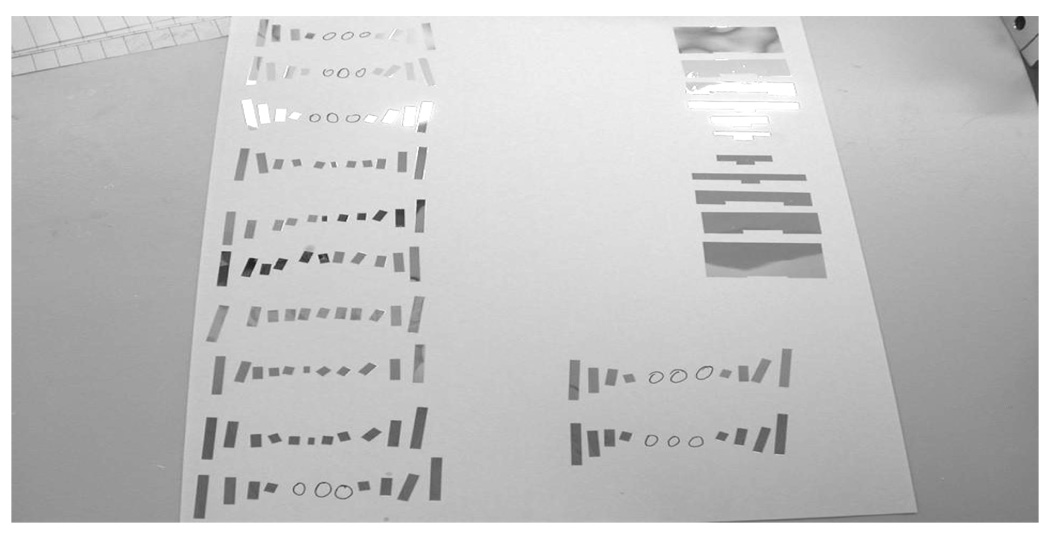
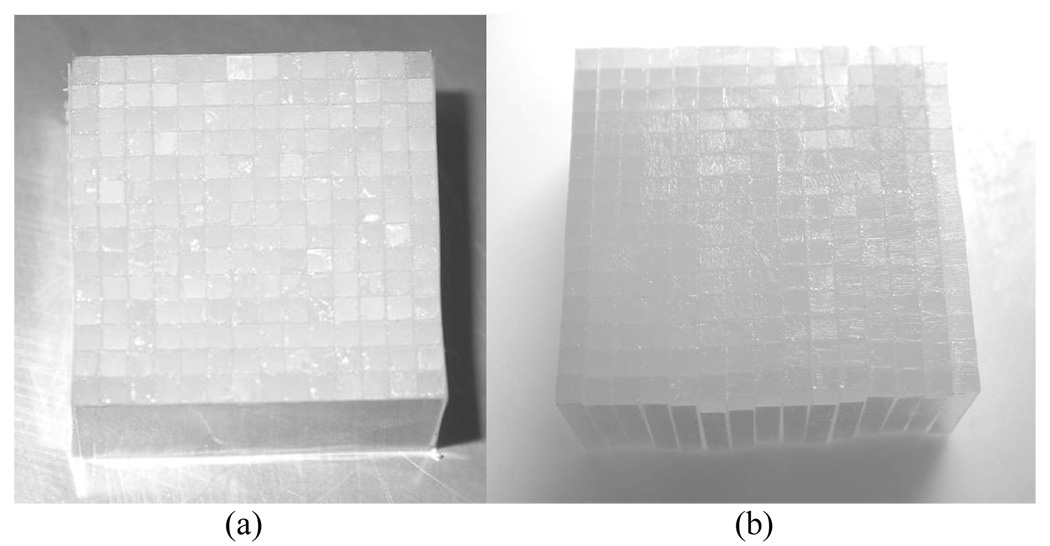
PQS-block detectors were assembled from the individual crystals with mirror-film reflector patterns inserted precisely between them. The crystals and reflector patterns were assembled together to build a PQS-detector blocks, using optical coupling grease (Rexon 688). The PQS detector blocks were covered by mirror film over five of the external surfaces and later, wrapped with >6 layers of Teflon tape. The average thickness of the mirror film and grease between two adjacent crystals was 0.08 mm. The initial patterns of the mirror-film reflectors were obtained from a simulator, a theoretical and statistical calculation tool for the light sharing in the PQS decoding method, which was developed in our laboratory, [8]. Thereafter, the patterns were literally refined by several trial-and-error experimental attempts. Fig. 1 shows a typical set of reflector patterns. Fig. 2 shows physical L(Y)SO PQS- blocks for two configurations: (a) 14 × 14 and (b) 15 × 15, for animal and human PQS-PET blocks, respectively.
Fig.1.
Experimental reflector patterns.
Fig.2.
Physical L(Y)SO PQS-blocks (a) 14 × 14 animal PET and (b) 15 × 15 human PET.
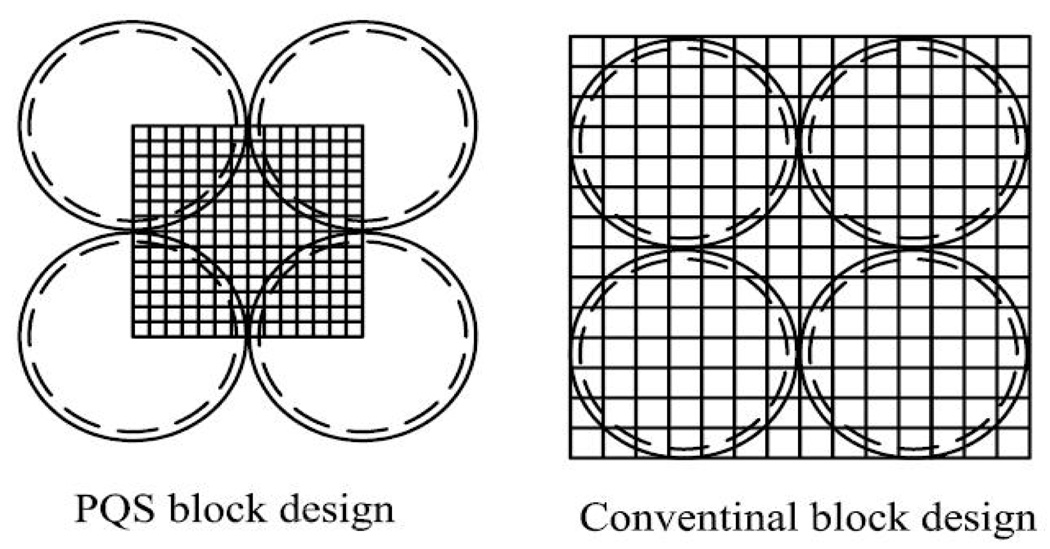
To assess the scintillator performance, the detector blocks were optically coupled to regular round PMT’s of 19/51 mm in PQS configuration using optical coupling grease (Rexon 688). A mirror-film reflector was placed under the central gap inside the four circular PMT’s to enhance the light-collection efficiency for the crystals in the central region of a block. Compared to the regular detector design, the PQS method is more efficient in its use of PMT’s. In this configuration, a quarter of each PMT can reach a maximum decodable ratio of 1:1. In other words, each PMT serves four block detectors [9], instead of one as in the regular detector design. This design can lower the PMT cost by up to 75% compared to a PET camera using four PMT’s to decode just one block detector, as shown in fig.3.
Fig.3.
Comparison between PQS-block and regular block/PMT design.
List-mode data was taken with Ga-68 source (511 KeV) and home-made electronics and data acquisition software, [10] to [12]. For data analysis, a crystal-decoding map was acquired with an energy threshold, typically set to the Compton edge of the block-composite energy spectrum. A crystal look-up table was created from crystal identifications through a crystal-decoding map. Using the look-up table and the list data, we extracted spectral information such as pulse height and energy resolution from the energy spectra of individual crystals by fitting the spectra with Gaussian curves. Profiles of each row and column of crystals were obtained from the decoding map. The profiles were fitted with Gaussian functions to obtain the heights and position of peaks and valleys. To minimize the influences of PMT non-uniformities, we averaged values for crystals with the same rotational symmetry, (symmetry restoration) i.e., the same up–down and left–right crystal locations relative to the center of the block. Light-collection efficiency is obtained by measuring the pulse height of each individual crystal spectrum.
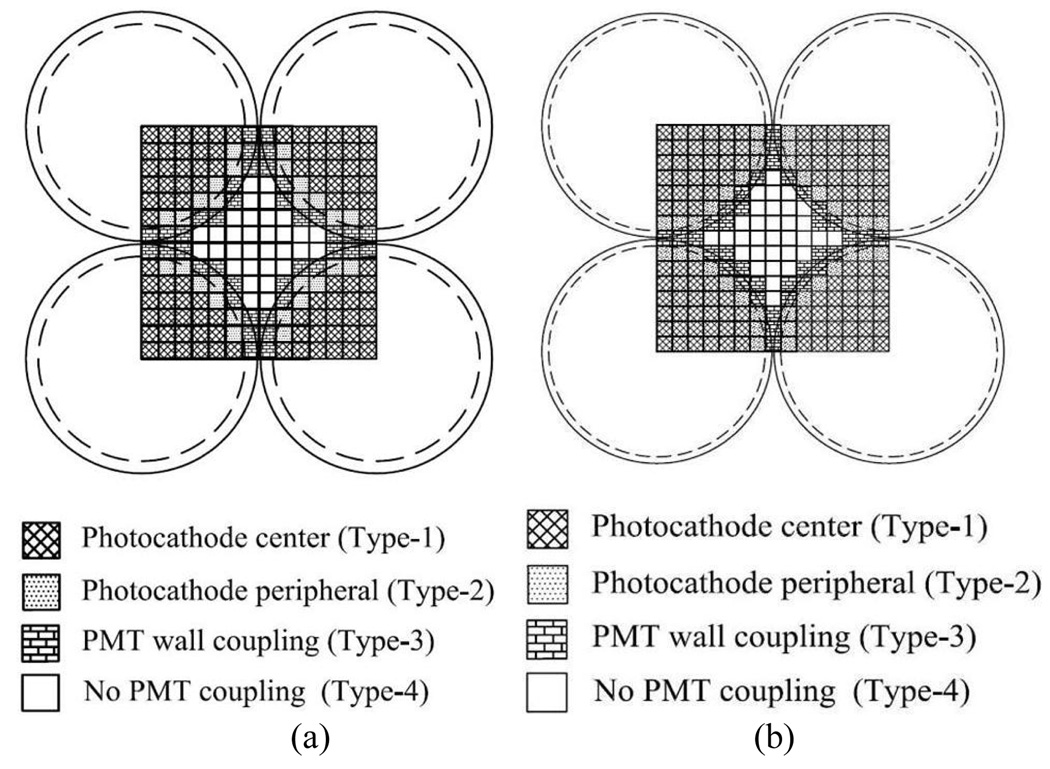
Due to the large number of middle crystals sitting in space without coupling to any photocathode; the data were also analyzed according to the crystal location in the block and crystal-PMT coupling. For this analysis the block was divided into four types of crystal-to-PMT coupling regions. Region type 1 designated crystals that are coupled in the center of the photocathode. Region type 2, crystals are those coupled in the peripheral area of the photocathode, region type 3 are crystals coupled in the PMT wall and, region type 4, are crystals without PMT coupling. Fig. 4 shows the PQS-block crystal-to-PMT coupling regions distribution, for two configurations, animal and human PQS-PET respectively.
Fig.4.
Crystal-to-PMT coupling regions. (a) 14 × 14 animal PET and (b) 15 × 15 human PET.
We also investigated the potential PET imaging performance from the decoded block geometry using GATE (Geant4 Application for Tomographic Emission) simulation package. GATE is a GEANT4-based software toolkit for realistic simulation of PET and SPECT systems for small-animal and human applications, [22] and [23]. .
For the animal PET simulation, we adopted the same geometry as our BGO rodent-research PET (RRPET), [3], with 16.5-cm detector-ring diameter and 11.8 cm axial field of view (AFOV), except we substituted 14 × 14 LYSO detectors. Both point sources and the Micro Deluxe hot rod phantom were simulated. The positron range and the gamma acollinearity at the annihilation points were taken into accounts. The micro deluxe phantom is a 4.5 cm diameter cylinder with rods of 1.2, 1.6, 2.4, 3.2, 4.0 and 4.8 mm, and the center-to-center distance between rods was twice the rod diameters. The methodology for this study is described in Reference [13].
For the human PET simulation, we configured a PET system with a ring diameter of 86 cm with 54 LSO block detectors (15 × 15 array) or 810 crystals per detector ring. Both point sources and a resolution Derenzo-like phantom of 128.0 mm in diameter and hot rod diameters of 2.0, 2.4, 3.2, 4.0, 4.8, 6.4 mm. were simulated using small bin sizes (0.44°, 0.5 mm). For spatial resolution simulation, an ideal point source (F18 positron embedded in water sphere in the GATE code) was used. For the image reconstruction of the simulated data was used filtered-back projection.
All simulation results were based on the assumption where the energy resolution was fixed for all crystals LYSO animal PET and LSO human PET, at 511 keV. The energy resolution was 15.0%, and the energy window 300–750 keV.
III. RESULTS
A. Characterization of the PQS detectors
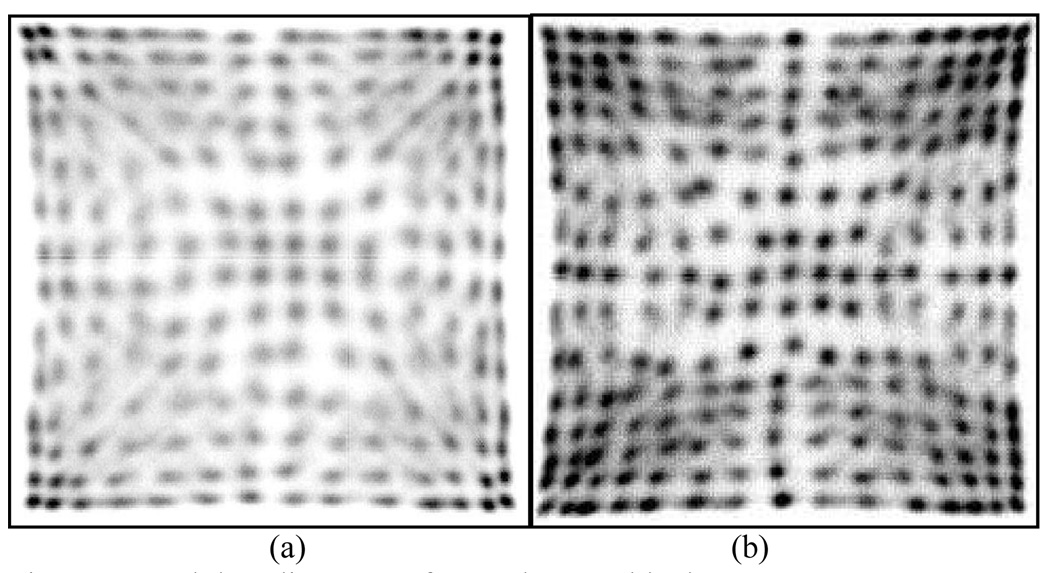
The decoding maps from all crystals were well identified in both, 14 × 14 and 15 × 15 detector arrays, as shown in Fig. 5 (a) and (b). To determine the crystal spectra, relative light output, energy resolution at several gamma-ray energies and light collection efficiency of L(Y)SO PQS-Detector blocks, we used a standard nuclear spectroscopy technique.
Fig.5.
Crystal decoding map of PQS-detector blocks. (a) 14 × 14 animal PET with 196 clearly identified crystals and (b) 15 × 15 human PET with 225 clearly identified crystals
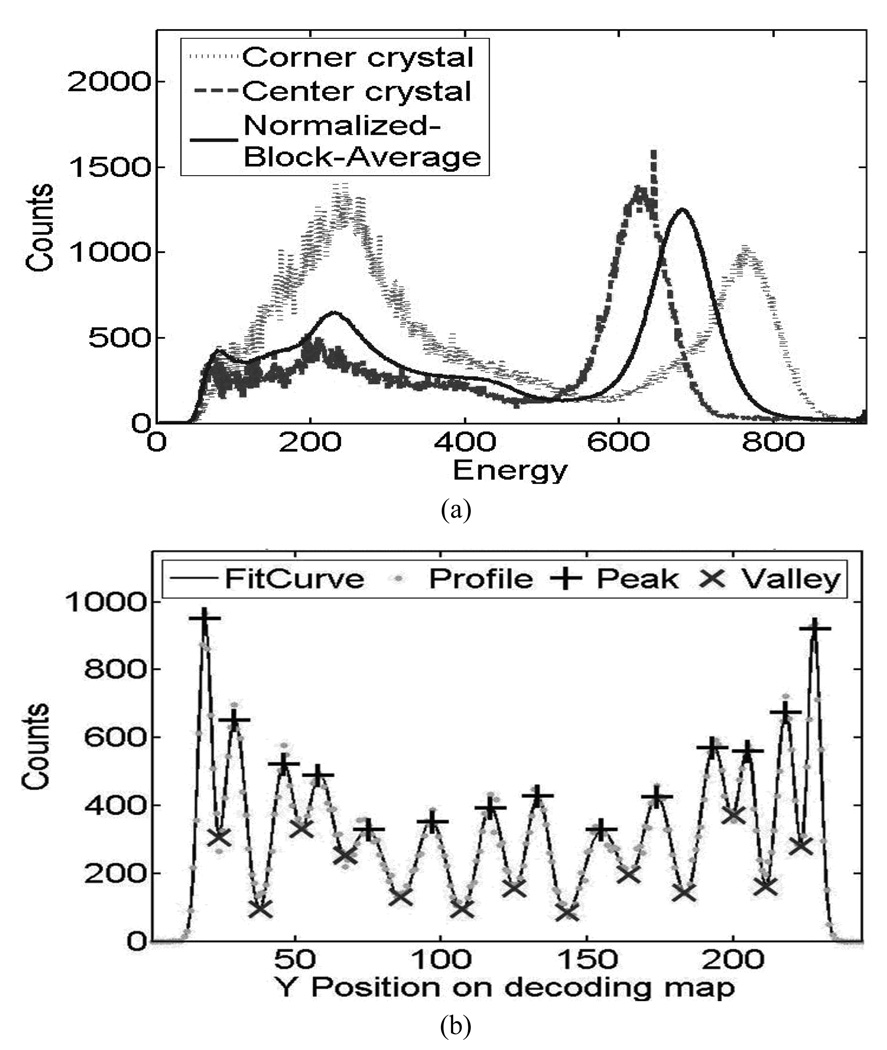
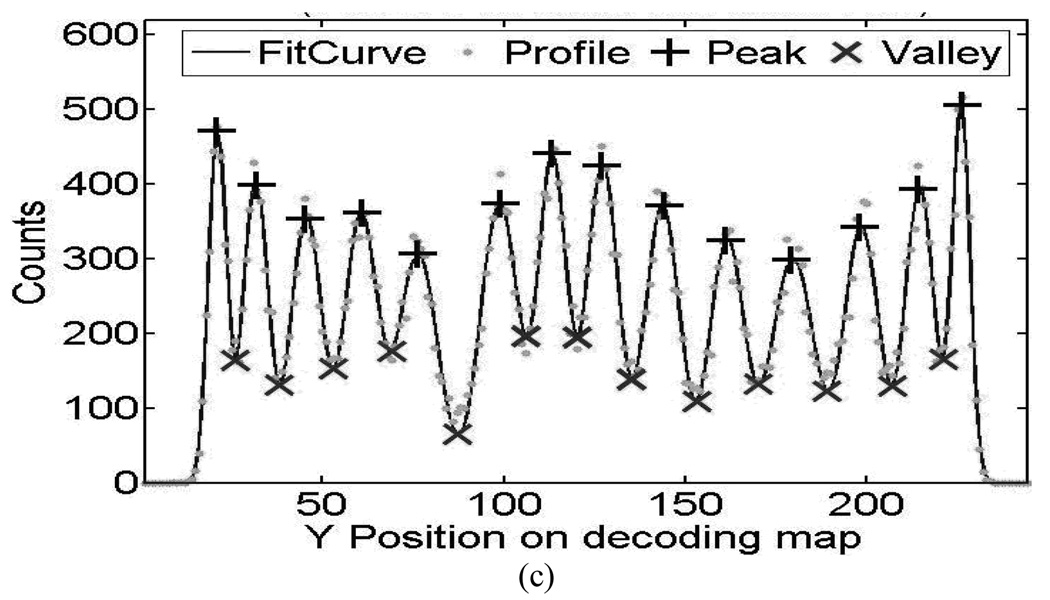
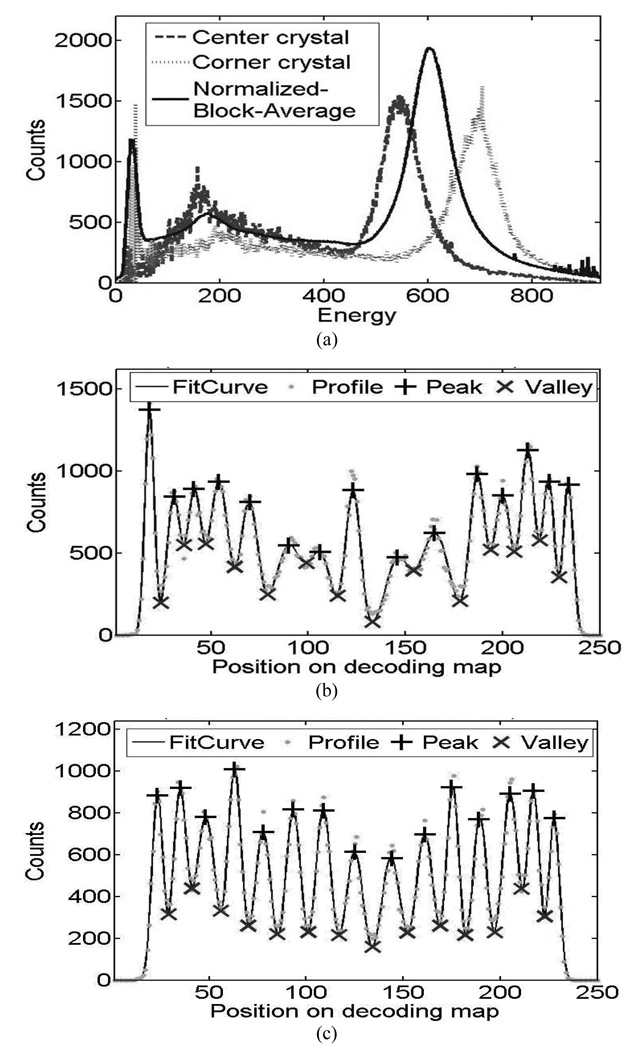
The energy spectra from PQS-blocks are shown in Fig. 6(a), for animal and Fig.7(a), for human PET, there is a comparison between corner crystals, center crystals and normalized block average energy spectrum. Examples of crystal profiles are shown in Fig. 6(b) and Fig. 7(b) for external crystal column (corner to corner) and Fig 6(c) and 7 (c) for central crystal column.
Fig.6.
Performance of crystal energy from 14 × 14 L(Y)SO animal PET detectors. (a) Typical crystal energy spectrum (b) Profile of external crystal column and (c) Profile of the central crystal column in decoding map.
Fig.7.
Performance of crystal energy from 15 × 15 LSO human PET detectors. (a) Typical crystal energy spectrum (b) Profile of external crystal column and (c) Profile of the central crystal column in decoding map
The corner crystals have higher light-collection efficiency than all others because of there are coupled in the center of the photocathode and the central crystals in the block are sitting without any PMT coupling. Photo peaks of the spectra are well defined with high peak-to-valley ratios.
The energy spectra from PQS-blocks are shown in Fig. 6(a), for animal and 7(a), for human PET, there is a comparison between corner crystals, center crystals and normalized block average energy spectrum. Examples of crystal profiles are shown in Fig. 6(b) and Fig. 7(b) for external crystal column (corner to corner) and Fig 6(c) and 7 (c) for central crystal column. The corner crystals have higher light-collection efficiency than all others because of there are coupled in the center of the photocathode and the central crystals in the block are sitting without any PMT coupling. Photo peaks of the spectra are well defined with high peak-to-valley ratios.
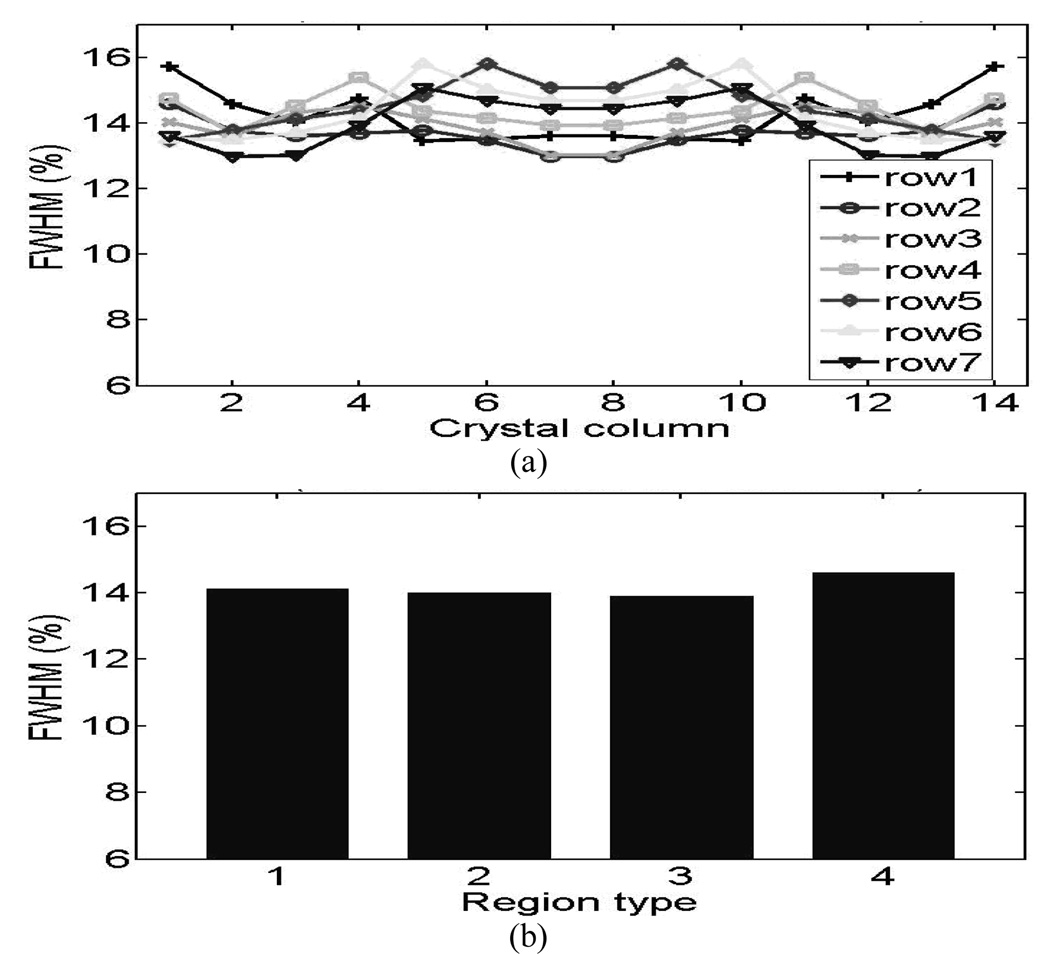
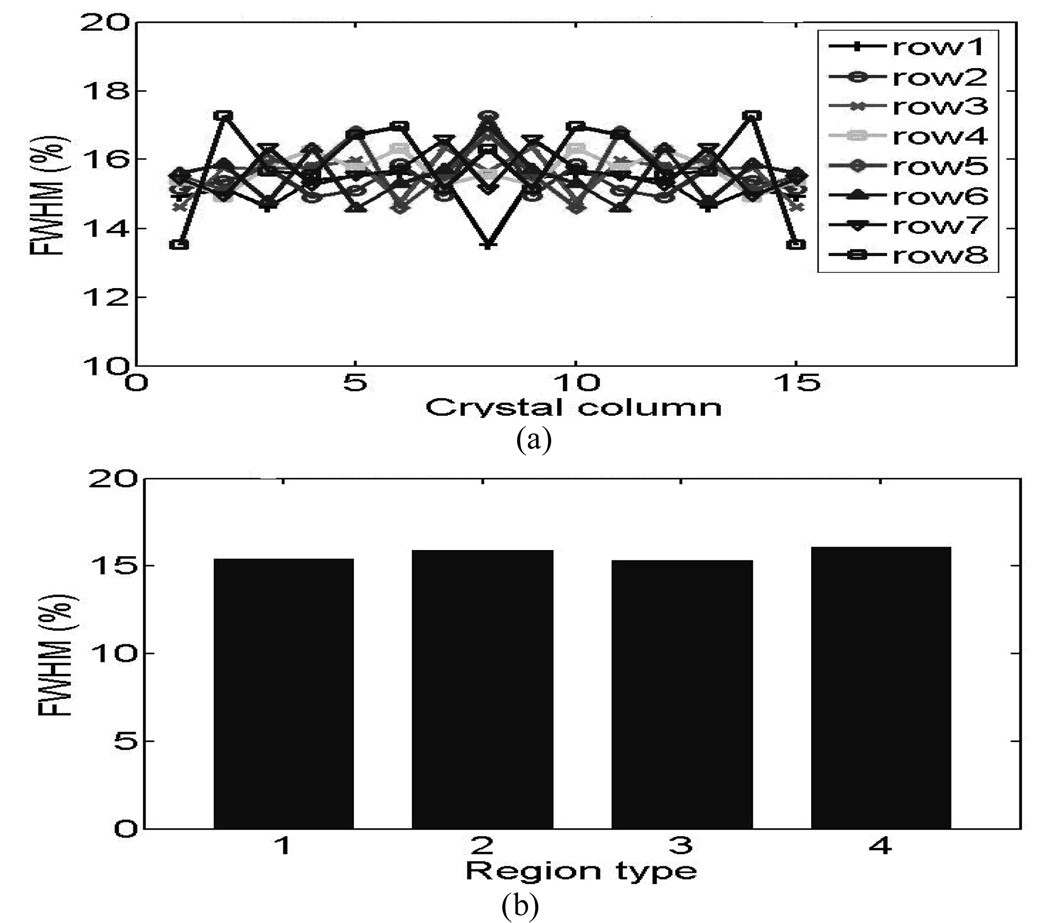
The measured energy resolutions from 14×14 L(Y)SO animal PET detectors are ranged from 12.9% to 15.8% after symmetric restoration with an average of 14.0%. For 15×15 LSO human PET detectors, the energy resolutions varied from 13.5% to 17.3% after symmetric restoration with an average of 15.6%.
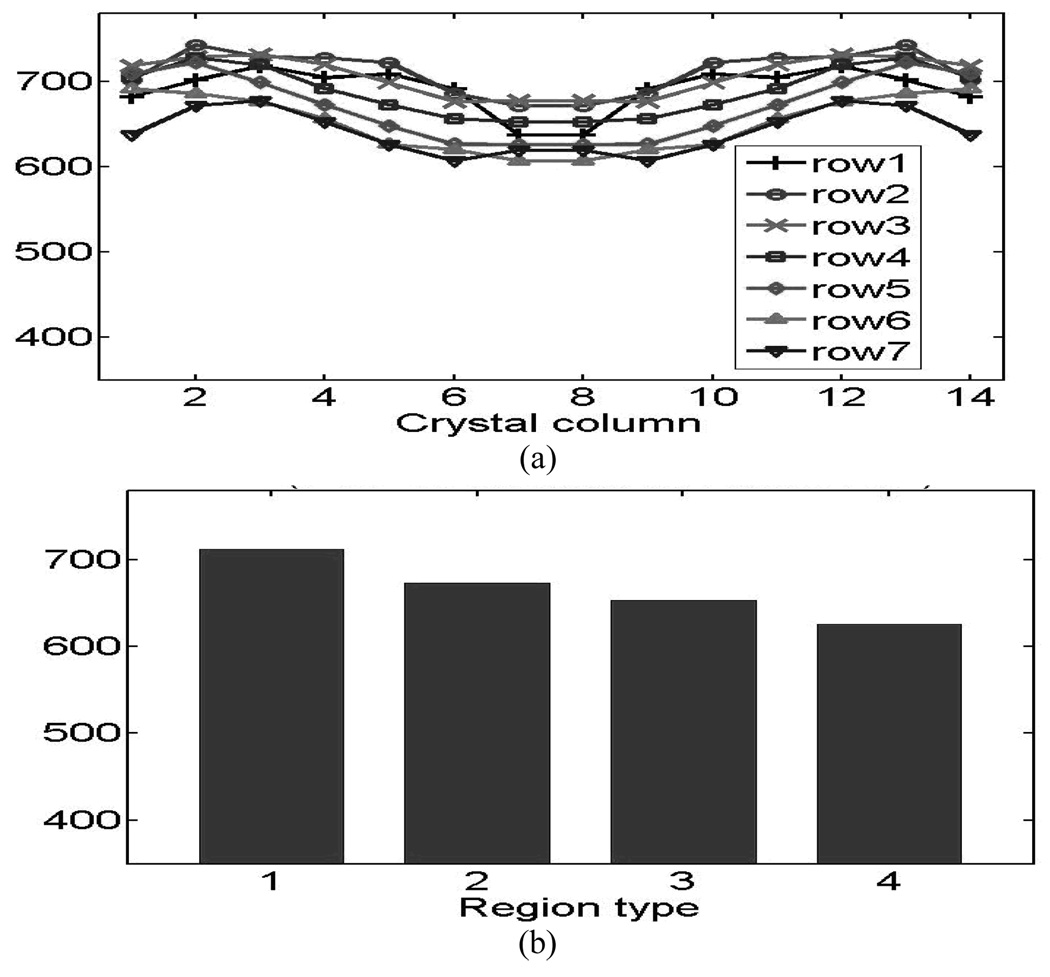
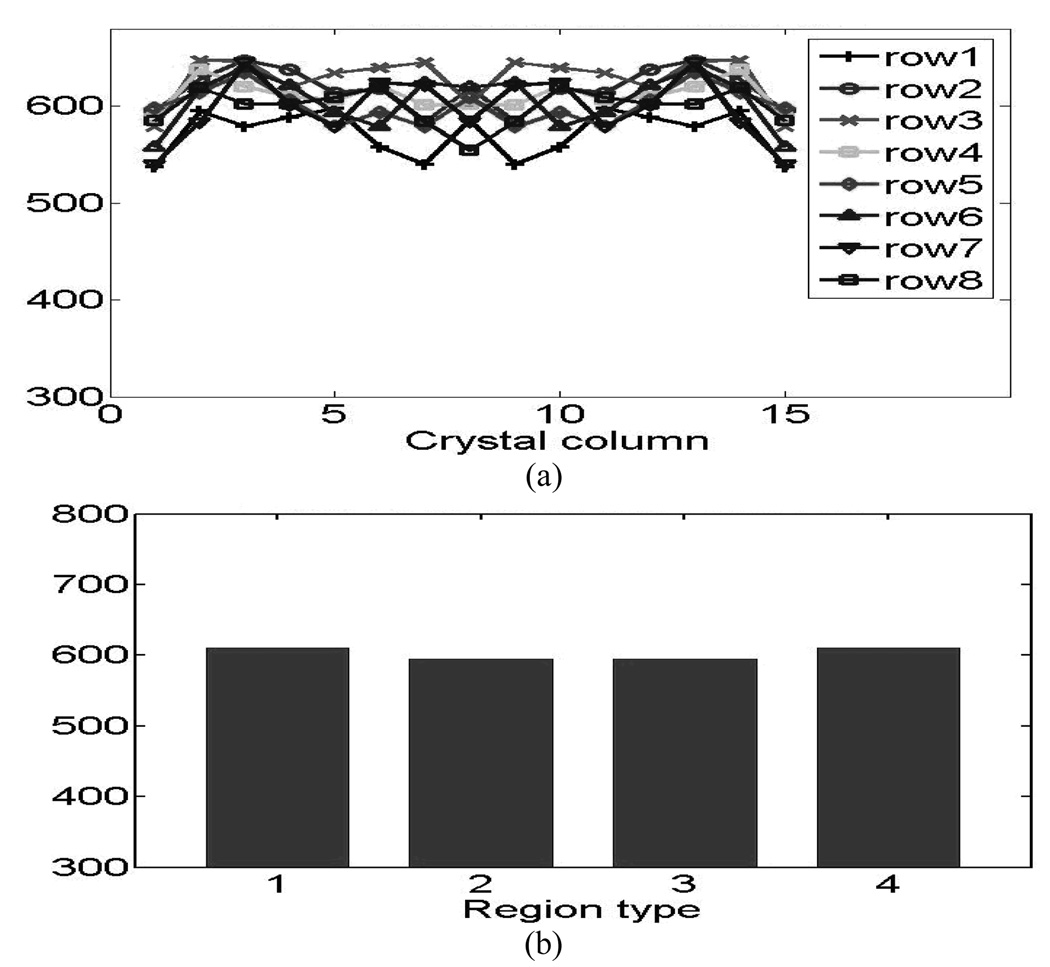
The crystal energy resolutions symmetrically restored from both blocks are plotted in Fig.8 (animal detectors) and Fig.9 (human detectors). Fig.8 (a) and Fig.9 (a) show the results from the individual crystals and Fig.8 (b) and Fig.9 (b) show the results of the four crystal-to-PMT coupling regions, where good uniformities were observed for both the animal and human detector blocks. . The distribution of light-collection efficiencies is shown in Fig. 10 (animal detectors) and Fig. 11 (human detectors), where the individual values were expressed as a percentage of the highest value obtained for each detector block. Fig. 10(a) and Fig. 11(a) show the symmetry-restored crystal signal pulse-height distribution of individual crystals, and Fig. 10(b) and Fig. 11(b) show the crystal Pulse-height distribution in the four regions of the PQS-detector blocks. The higher light loss of 35.5% for central crystals in the animal PET detectors might reflect the difficulty for light to go through the tiny crystal needles and many interfaces before reaching the PMT.
Fig.8.
Energy resolution distribution of 14×14 L(Y)SO animal PET detectors. (a) Individual crystals. (b) Four coupling regions.
Fig.9.
Energy resolution distribution of 15 × 15 LSO human PET detectors (a) Individual crystals. (b) Four coupling regions.
Fig.10.
The distribution of light-collection efficiencies of animal PQS-detectors. (a) Pulse-height of individual crystals. (b) Pulse-height of the four coupling regions.
Fig.11.
(a) Pulse-height distribution of human PET detectors. (b) Pulse-height distribution of the four coupling regions for human PET detectors block.
B. Results from Monte Carlo simulations
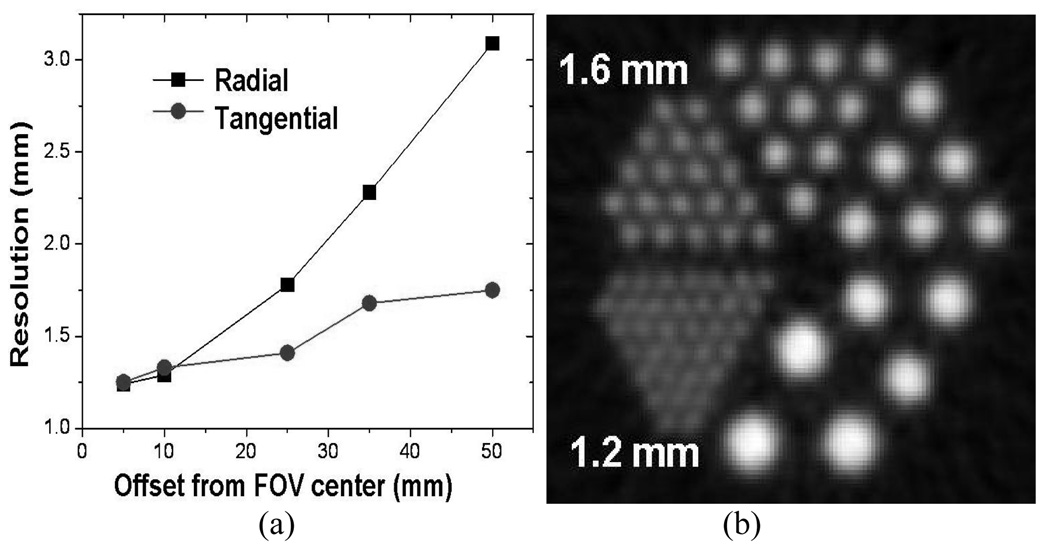
For the LYSO animal PET, the simulation data suggests that the new LYSO scanner could have a reconstructed radial and (tangential) spatial resolution of 1.24 (1.25) mm, 1.29 (1.33) mm, 1.78 (1.41) mm, 2.28 (1.680) mm and , 3.09 (1.75) mm at 0.5 cm, 1 cm, 2.5 cm, 3.5 cm and 5 cm off center, respectively. The first number is radial resolution, while the number in () is for tangential resolution. Fig. 12 shows (a) simulated radial and tangential resolution results and (b) the reconstructed image of the simulated data for the micro deluxe phantom with hot rod inserts for the new animal LYSO camera. The 1.2-mm hot rods are clearly distinguishable. Certainly, additional spatial blurring of the hit crystal, due to block decoding effects and mechanical misalignment of the detector blocks, which are difficult to simulate and which change with production techniques and production errors, are likely, making these simulation results too optimistic.
Fig.12.
(a) Projected spatial radial and tangential resolution curves from Monte Carlo simulation of the animal detector block. (b) Reconstructed image of the simulated data for the micro deluxe phantom for LYSO animal PET cameras.
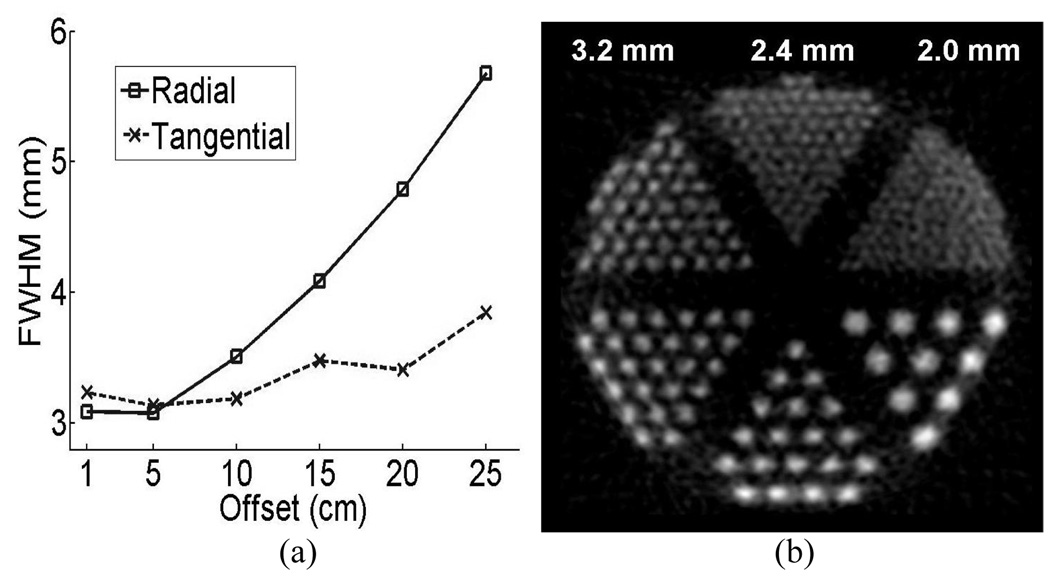
For the human PET, the simulation data suggests that the new human LSO scanner could have a reconstructed radial (tangential) spatial resolution of 3.09 (3.24) mm, 3.08 (3.14) mm, 3.51 (3.19) mm, 4.09 (3.48) mm, 4.79 (3.41) mm, 5.68 (3.85) mm at 1 cm, 5 cm, 10 cm, 15 cm, 20 cm and 25 cm off center, respectively. Fig. 13 (a) shows the simulated radial and tangential resolution results and (b) the reconstructed image of the phantom for the human LSO system. The resolution sectors down to 2.4 mm were resolved. The simulation shows that a central spatial resolution of 3 mm is potentially achievable using the human PET detectors developed in this study.
Fig.13.
(a) Projected radial and tangential resolution curves from Monte Carlo simulation of the human detector block. (b) Reconstructed image of the simulated data for the resolution phantom for LSO human PET cameras.
IV. DISCUSSION
Since our PQS block detector also plays the role of an internal light guide for distributing scintillation light to the four PMT’s, this design increases light output, thereby improving decoding resolution, as the scintillation light from each crystal is dispersed (sideways through the cylinder surfaces) into many other crystals to conduct the light to the decoding PMT, instead of transporting all the light along its own narrow and deep geometry first and then going though another external light guide system before reaching the PMT. Both light collection and crystal decoding depend on the PMT photocathode characteristics and the internal light-guide properties such as refractive index of crystals and optical grease, number of interfaces, surface finish of the interfaces and the reflector patterns. For this study and with the application of the PQS analog decoding technology for Lutetium-based crystals, we developed and tested high resolution, position-sensitive block detectors. The developed lutetium PQS-detector blocks for animal/human PET applications could decode 196/225 crystals per PMT using regular round 19/51 mm PMTs, respectively.
For animal PET detectors, we decoded a 14 × 14 array with a crystal pitch of 1.27 × 1.27 mm2. This animal detector-block had a packing fraction of 95.6% and an energy resolution ranging between 12.9%~15.8% for individual crystals (average energy resolution of 14%); the pulse height for the least favorable crystal was 63.5% of the most favorable crystal.
For human PET detectors, we decoded a 15 × 15 array with a crystal pitch of 3.25 × 3.25 mm2. The human detector-block had a packing fraction of 98.2%, and an energy resolution range of 13.5%~17.3% (average energy resolution 15.6%). The pulse height of the least favorable crystal was 80% of the most favorable crystal, thereby achieving a nearly uniform light output throughout the block. The results of this study are summarized in Table I.
TABLE I.
Performance of L(Y)SO PQS-Block Detectors
| Detector Application |
Animal PET |
Human PET |
|---|---|---|
| Scintillation Crystal | LYSO | LSO |
| Block size (mm3) | 18.6 ×18.6 ×10 | 49.7 ×49.7 ×20 |
| Crystal dimension (mm3) | 1.27 ×1.27 ×10 | 3.25 ×3.25 ×20 |
| Packing fraction | 95.6% | 98.2% |
| Decoding Resolution crystals per PMT |
196 crystals/PMT |
225 crystals/PMT |
| The peak to valley ratio of decoding map |
2.7 | 2.8 |
| Crystal signal pulse height range | 560~780 | 487~807 |
| Light collect efficiency | 71.8% | 60.3% |
| Crystal signal pulse heights of 4 regions |
1: 712 2: 674 3: 654 4: 626 |
1: 610 2: 595 3: 595 4: 610 |
| Light collect efficiency | 87.9% | 97.6% |
| Crystal energy resolution range | 11.9% ~ 18.6% | 12.0%~18.9% |
| Crystal energy resolution average | 14.1% | 15.6% |
| After symmetric restoration | ||
| Crystal signal pulse height range | 607~743 | 538~648 |
| Pulse height average | 680 | 605 |
| Light collect efficiency | 81.7% | 83.0% |
| Crystal energy resolution range | 12.9% ~ 15.8% | 13.5%~17.3% |
| Crystal energy resolution average |
14.1% | 15.6% |
| Crystal energy resolution of 4 regions |
1:14.1 2:13.9 3:13.9 4: 14.6 |
1: 15.4 2: 15.8 3: 15.3 4: 16.1 |
| Average spec peak | 679.9 ch | 602.9 ch |
From Monte Carlo simulations for LYSO small animal PET, a central (near the center of field of view) spatial resolution of 1.1–1.2 mm may potentially be achieved using low cost 19 mm circular PMT. For human PET systems, 3 mm central spatial resolution may potentially be achieved using a large 51 mm circular PMT.
With the PQS-L(Y)SO detector blocks developed in this study, we may be able to realize a lower cost PET systems that has higher resolution than existing cameras without requiring costly position sensitive photomultiplier tubes (PSPMTs) or Avalanche photodiodes (APDs), [14]–[21]. The comparison of detector specifications between commercial PET systems and the PQS-LYSO system development are shown in Table II.
TABLE II.
Comparison of Detector Specifications Between commercial PET Systems and this PQS-LYSO detector development
| Human body PET detectors Commercial PET vs. PQS-PET | ||||||
|---|---|---|---|---|---|---|
| System | Ref [X] |
Crystal Type |
Crystal Pixel size (mm3) |
Block / Module matrix |
PMT size (mm) |
Decoding Resolution crystals per PMT |
| Discovery -STE- |
[14] | BGO | 5 ×6 × 30 | 8 × 6 | 19 | 12 |
| Biography -64- |
[15] | LSO | 4 × 4 × 20 | 13 ×13 | 26 | 42 |
| Gemini | [16] [17] |
GSO | 4 × 6 × 20 | 22 ×29 | 39 | 42 |
| PQS-PET | LSO | 3.25×3.25×20 | 15 ×15 | 51 | 225 | |
|
Animal PET Detectors Commercial PET VS. PQS-PET | ||||||
| Inveon -Siemens- |
[18] | LSO | 1.6 × 1.6 × 10 | 20 × 20 | PS-PMT | * |
| “Lab-PET” | [19] | LYSO and LGSO |
2 × 2 × 10 | 4× 2 48 modules |
APD | 1 |
| “JPET” | [20] | GSO | 2.9 × 2.9 × 7.5 | 16 × 16 | PS-PMT | 256 × 4 layers |
| PQS-PET | LYSO | 1.27×1.27×10 | 14 ×14 | 19 | 196 | |
Parameter not available or not applicable for the system.
The cost savings may be used so as to extend the axial field of view (AFOV) sufficiently, that the whole mouse/rat body can be imaged in one fixed bed position. This would in turn allow for dynamic pharmaceutical studies while tapping the dynamic arterial input function directly from the cardiac images being acquired concurrently. An extended AFOV also increases the detection sensitivity, especially for the two ends of a mouse/rat (brain and hind quarters) where tumors were often implanted.
There may be some potential drawbacks such as:
(1) Increase in costs of manufacturing process, due to surface-finish requirement. However, all animal PET systems already uses crystals that are chemically polished (etched) or mechanically polished to maximize light output, which is even more smooth than the 4–5 µm finish used here. To achieve the high mechanical precision required in animal PET systems with 1–2 mm detector sizes, the crystals are not cut to size but lapped to the exact size anyway; therefore the lapping process used in this work is already an integral process in the manufacturing of other animal systems, although the grit sizes of the palling particles are different. Using the slab-sandwich-slice production method [21], that we developed, only large slabs of crystals, 10–20 detectors in width, and not individual pixels are handled or processed in making the detector array, which lowers the manufacturing cost. (2) The increase in dead time and reduction in the dynamic range of PET scanner due to the sharing of PMT channels in PQS. This drawback can be partly mitigated by the fast LYSO crystal used here and partly by the pileup-event-recovery electronics [10] to [12], that has been shown to increase detection rates by 10 times compared to traditional pulse-processing electronics.
For a hypothetical animal PET geometry with a long 12 cm (20 cm) AFOV and a 16–17 cm detector- ring diameter, only 168 (280) PMT’s will be used with an estimated total PMT cost of only $20,000 ($33,000) for such large systems. Existing human clinical PET systems achieved a lower 4–6 mm detector-pitch resolution using much smaller 19 mm PMT than the 51 mm PMT used in this study, (see Table II).
Hence, the human PET detector developed in this study may provide higher image resolution than existing clinical PET while reducing the total cost of PMT by (51/19)2 or 7 times. A typical human PET system with 15–16 cm AFOV would need only 220 PMT instead of the typical 1200 PMT, thereby, reducing the total PMT cost per camera from $160,000 to $28,600, plus the additional savings in the corresponding supporting electronics for each PMT channel as amplifiers, analog-to-digital converters (ADCs), high voltage dividers (HV-dividers), assembly labor, etc.
V. CONCLUSION
With PMT-Quadrant-Sharing design along and using the latest improved L(Y)SO block, we have achieved the decoding of very large arrays, a 14 × 14 for animal PET system and a 15 × 15 for human PET system.
Despite the disadvantages that the detector sizes are very narrow and that a large number of the middle crystals are sitting in space without coupling to any photocathode, the crystal light outputs, the energy resolution and the pulse-height distributions are uniform. For small animal PET application, we achieved a high crystal-decoding resolution of 1.27 × 1.27 × 10 mm3 using the low-cost generic 19 mm circular PMT with an excellent average energy resolution of 14% and a high crystal-to-PMT ratio of 196 crystals per PMT. For human PET application, we achieved a high decoding resolution of 3.25 × 3.25 × 20 mm3 crystals using a large 51 mm circular PMT with an average energy resolution of 15.6% and a crystal-to-PMT ratio of 225 crystals per PMT.
With the proposed application of PMT-quadrant-sharing to L(Y)SO crystals, PET systems with higher spatial resolution together with excellent energy resolution can be achieved at a lower production cost and without using expensive readout devices.
Acknowledgments
This work is supported in part by the NIH-CA58980 PHS Grant, NIH-CA61880 PHS Grant, NIH-CA76246 PHS Grant, NIH-CA58980S PHS Grant, NIH-EB01481 PHS Grant, NIH-EB00217 PHS Grant, NIH-EB01038 PHS Grant, U.S. Army-Breast Cancer Research Grant, Texas ARP/ATP Grant 003657-0058-2001.
REFERENCES
- 1.Wong W-H, et al. Design and Preliminary Performance of a Low-cost High-sensitivity Rodent Research PET and PET/CT. In: Taipei, Taiwan, editors. Animal Molecular Imaging International Symposium; Elsevier Health Sciences Excerpta Medica; 2005. pp. 75–78. Chapter. [Google Scholar]
- 2.Uribe J, et al. Signal characteristics of individual crystals in high resolution BGO detector designs using PMT-quadrant sharing. IEEE Trans. Nuclear Science. 2003;vol. 50:325. [Google Scholar]
- 3.Xie S, Ramirez R, et al. A Pentagon Photomultiplier-Quadrant-Sharing BGO Detector for a Rodent Research PET (RRPET) IEEE Transactions on Nuclear Science. 2005 Feb;vol. 52(1):210–216. [Google Scholar]
- 4.Kim S, et al. High Resolution GSO Block Detectors Using PMT-Quadrant-Sharing Design for Small Animal PET. IEEE Transactions on Nuclear Science. 2006 Feb;53(1):40–43. doi: 10.1109/TNS.2008.922832. [DOI] [PMC free article] [PubMed] [Google Scholar]
- 5.Melcher CL, et al. Scintillation properties of LSO: Ce boules. IEEE Trans. Nucl. Sci. 2000;vol. 47:965–968. [Google Scholar]
- 6.Innovation, ESR Film. Vikuiti. ™. Enhanced Specular Reflector (ESR), ESR. PDF [Google Scholar]
- 7.Allied High Tech Products, Inc. The Multiprep System, Unequalled Results in All of These Sample Preparation Application. www.alliedhightech.com.
- 8.H Li, et al. A simulation study on optically decoding reflecting windows for PMT quadrant sharing scintillation detector Block. IEEE Trans. Nucl. Sci. 2006 Oct;53:2557–2562. [Google Scholar]
- 9.Wong, et al. The Design of a High Resolution Transformable Wholebody PET Camera. IEEE Transactions on Nuclear Science. 2002 October;49(5):2079–2084. [Google Scholar]
- 10.Wong W-H, Li H, Uribe J, Baghaei H, Wang Y, Yokoyama S. Feasibility of a high speed gamma camera design using the high-yield-pileup-event-recovery (HYPER) method. J. of Nucl. Med. 2001 April;42(4):624–632. [PubMed] [Google Scholar]
- 11.Li H, et al. A high speed position-decoding electronics for BGO block detectors in PET. IEEE Trans. Nucl. Sci. 2002 Oct.vol. 47(Issue3 Part 3):1006–1010. [Google Scholar]
- 12.Li H, et al. A New Pileup-Prevention Front-End Electronic Design for High Resolution PET and Gamma Cameras. IEEE Transactions on Nuclear Science. 2002 October;49(5):2051–2056. [Google Scholar]
- 13.Baghaei, Hossain, et al. GATE Monte Carlo Simulation of the Performance of a High-Sensitivity and High-Resolution LSO Based Small Animal PET Camera. 2006 IEEE, Nuclear Science Symposium Conference Record; 2006. Oct, pp. 2476–2479. accepted for publication in IEEE TNS. [Google Scholar]
- 14.Turkington TG, et al. Performance of a BGO PET/CT with higher resolution PET detectors. IEEE, Nuclear Science Symposium Conference Record, M04-2..2005. [Google Scholar]
- 15.Worstell W, et al. Design and performance of a prototype whole-body PET/CT scanner with fiber optic readout. IEEE, Nuclear Science Symposium Conference Record, on page(s); 2004. pp. 3280–3284. [Google Scholar]
- 16.Imaging Technology News, PET/CT Comparison Charts. http://www.itnonline.net/
- 17.Gregory R, et al. Performance evaluation of the Philips 'Gemini' PET/CT System. 2004 IEEE, Nuclear Science Symposium Conference Record; pp. 2605–2609. [Google Scholar]
- 18.Kemp BJ, et al. Performance Measurements of the Siemens Inveon Small Animal PET scanner. 2006 IEEE, Medical Imaging Conference, M14-69.. [Google Scholar]
- 19.Fontaine R, et al. The architecture of LabPET/spl trade/, a small animal APD-based digital PET scanner. 2005 IEEE, Nuclear Science Symposium Conference Record, J02-3, on page(s); pp. 2785–2789. R. E. [Google Scholar]
- 20.Yoshida, et al. The jPET-D4: Detector Calibration and Acquisition System of the 4-layer DOI-PET Scanner. 2005 IEEE, Nuclear Science Symposium Conference Record, M11-270. [Google Scholar]
- 21.Uribe J, Wong W-H, Li H, Baghaei H, Wang Y, Liu Y, Xing T, Farrell R. An Efficient Detector Production Method for Position-Sensitive Scintillation Detector Arrays with 98% Detector Packing Fraction. IEEE Transactions on Nuclear Science. 2003 October;50(5):1469–1476. [Google Scholar]
- 22.Jan S, Santin G, Strul D, et al. GATE: a simulation toolkit for PET and SPECT. Institute of Physics Publishing. Phys. Med. Biol. 2004;49:4543–4561. doi: 10.1088/0031-9155/49/19/007. [DOI] [PMC free article] [PubMed] [Google Scholar]
- 23.National Electronical Manufactures Association, NEMA Standards Publication NU 2-2001. Performance Measurements of Positron Emission Tomographs. 2001 [Google Scholar]


