

Abstract
Anthocyanins are a class of polyphenols responsible for the orange, red, purple and blue colors of many fruits, vegetables, grains, flowers and other plants. Consumption of anthocyanins has been linked as protective agents against many chronic diseases and possesses strong antioxidant properties leading to a variety of health benefits. In this review, we examine the advances in the chemical profiling of natural anthocyanins in plant and biological matrices using various chromatographic separations (HPLC and CE) coupled with different detection systems (UV, MS and NMR). An overview of anthocyanin chemistry, prevalence in plants, biosynthesis and metabolism, bioactivities and health properties, sample preparation and phytochemical investigations are discussed while the major focus examines the comparative advantages and disadvantages of each analytical technique.
Keywords: Anthocyanins, Polyphenols, Plant sources, Analytical methodology, HPLC, CE
1. INTRODUCTION
Anthocyanins are a class of compounds belonging to the larger flavonoids class which comprises a subset of the poly-phenol class of compounds. Anthocyanins are responsible for much of the red, blue, and purple colors of fruits, vegetables, grains, flowers, and herbs, which explains their name, in Greek, anthos means flower and kyanos means blue. Anthocyanins are predominantly found in nature as glycosides of polyhydroxy and polymethoxy derivatives of 2-phenyl-benzopyryliurn or flavylium salts, (Fig. (1)). Individual members are differentiated by the number of hydroxyl and methoxyl groups of the B-ring, by the number of sugars attached to the aglycon and the position of attachment, and by the nature and number of aliphatic or aromatic acids attached to the sugar residues [1].
Fig. (1).
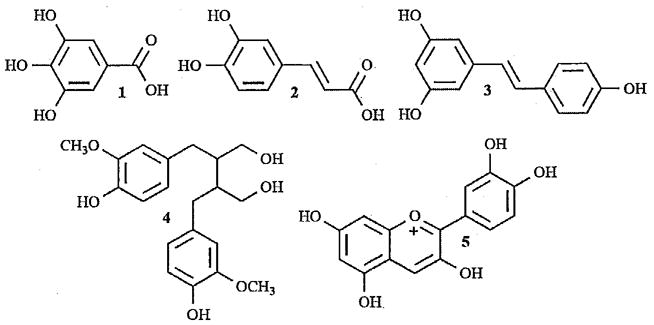
Chemical structure of some common polyphenolic compounds: phenolic acids, gallic acid (1) and caffeic acid (2); a stilbene, resveratrol (3); a lignan, secoisolariciresinol (4); and a flavonoid, cyanidin (5).
Flavonoids, as a class of compounds containing anthocyanins, are a member of a larger class of compounds called polyphenols, which includes all molecules with more than one hydroxyl group on an aromatic ring. Other polyphenol compounds are phenolic acids, stilbenes, and lignans, (Fig. (1)). Phenolic acids consist predominantly of two types of molecules: derivatives of benzoic acid and derivatives of cinnamic acid. Gallic acid (1), a derivative of benzoic acid, and caffeic acid (2), a derivative of cinnamic acid, are two widespread representatives of the phenolic acids, (Fig. (1)). These compounds are found in various teas in relatively high quantities and act as antioxidants by free-radical scavenging [2, 3]. Stilbenes contain two phenyl moieties connected by a two-carbon methylene bridge and are the smallest class of polyphenols. Stilbenes often act as antifungal phytoalexins, compounds that are synthesized only in response to infection or injury [3]. One example of a stilbene is Resveratrol (3), an anticarcinogenic compound produced in grapes and peanuts that effects cell signaling pathways, cell proliferation, and apoptosis [4–6]. Lignans are diphenolic compounds formed by the dimerization of two cinnamic acid residues. Several lignans, such as secoisolariciresinol (4), are considered to be phytoestrogens and are converted by intestinal bacteria into enterolactone and enterodiol. These can mimic estrogen compounds in the body and may reduce the effect of estrogen by displacing it from cells, leading to the prevention of some cancers, such as breast cancer, that are estrogen dependent [2, 3, 7].
Flavonoids (5) include the group of anthocyanins which represent the largest class of polyphenols comprising over 9000 identified compounds with more being continually discovered [8]. These compounds share a common framework consisting of two aromatic rings (A and B) that are bound together by three carbon atoms that form an oxygenated heterocycle (ring C). This design can be seen in the flavonoid structures in Fig. (2). Flavonoids are subsequently divided into several groups differing in the oxidation state of the heterocyclic pyran ring C. The subclasses consist of flavanols, flavanones, flavones, isoflavones, flavonols, and anthocyanins (listed in ascending order of oxidation) and within each of these subclasses, individual compounds are characterized by specific hydroxylation and conjugation patterns [9]. Most flavonoids are present in nature as the glycosidic form, with the exception of flavanols, and this contributes to their complexity and the large number of individual molecules that have been identified [10].
Fig. (2).
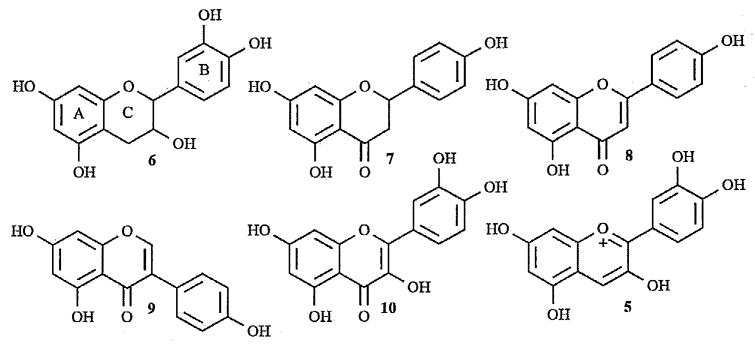
The chemical structures of flavanol, (±)-catechin (6); flavanone, naringenin (7); flavone, apigenin (8); isoflavone, genistein (9); flavonol, quercetin (10); and anthocyanins, cyanidin (5).
Flavanols (6) exist in the monomer form as catechins and in the polymeric form as proanthocyanidins, also known as tannins. Proanthocyanidins are found in many types of fruit as well as red wine, but green tea and chocolate appear to be the richest sources [2, 9]. Proanthocyanidins are responsible for the astringency of fruits and beverages and the bitterness of chocolate and when heated in acid, yield anthocyanidins, the aglycone form of anthocyanins [11]. Flavanones (7) are found in high concentrations in citrus fruits and when found in nature, they exist as glycosides, but when absorbed in humans, they are converted into aglycones [2, 9, 12]. Flavones (8), rarely found in fruits and vegetables, are found in many other plants including parsley, celery, millet and wheat. Several prenylated flavones have also been identified in hops and beer. These specific flavones have been characterized as a potent phytoestrogen and have been shown to have anti-cancer activity. Isoflavones (9) are almost exclusively found in leguminous plants, such as soy products, in the inactive glycosidic form. However, these compounds are metabolized in the digestive tract to their corresponding aglycones and can, only then, be absorbed [2, 9, 13]. Flavonols (10) are the most widespread flavonoids in foods, mostly in the form of quercetin and kaempferol. The richest sources are onions, kale, leeks, broccoli, and blueberries as well as red wine and tea. Flavonols are often found as glycosides in nature and tend to accumulate in the skin and leaves of plants as their biosynthesis is stimulated by light. Not surprisingly, the concentration of flavonols can differ between pieces of fruit on the same branch, depending on exposure to sunlight [2,9].
Anthocyanins (5) are the most oxidized flavonoids with the C ring fully unsaturated and a hydroxyl at position 3. The basic structure is an aglycone, or anthocyanidin, with one or more sugars attached at most often C3, C5, or C7 and possibly esterification on the sugars. Currently, there are 19 naturally occurring anthocyanidins (Table 1). The six most common anthocyanidins found in edible plants include pelargonidin, peonidin, cyanidin, malvidin, petunidin, and delphinidin [14]. These naturally occurring anthocyanidins can all be associated with three parent aglycone structures, pelargonidin, cyanidin, and delphinidin, due to the substitution pattern seen in the B-ring. When referring to the six major anthocyanidins, they can be grouped together with peonidin and cyanidin having 3′ and 4′ substitutions while petunidin, malvidin and delphinidin are trisubstituted at the 3′, 4′ and 5′ positions and pelargonidin is monosubstituted [1]. The prevalence of sugar occurrence in natural anthocyanins is glucose, rhamnose, xylose, galactose, arabinose, and fructose. Many anthocyanins have been found to be acylated by aliphatic or aromatic acids, the most commonly seen acyl groups being coumaric, caffeic, ferulic, p-hydroxy benzoic, synapic, malonic, acetic, succinic, oxalic, and malic acids. Considering all these factors, the number of probable anthocyanin compounds is quite large, leading to over 600 having been identified from natural sources [15,16].
Table 1.
Naturally Occurring Anthocyanidins
| Anthocyanidin | Abbreviation | Substitution Pattern | ||||||
|---|---|---|---|---|---|---|---|---|
| 3 | 5 | 6 | 7 | 3′ | 4′ | 5′ | ||
| Apigeninidin | Ap | H | OH | H | OH | H | OH | H |
| Aurantinidin | Au | OH | OH | OH | OH | H | OH | H |
| Capensinidin | Cp | OH | OMe | H | OH | OMe | OH | OMe |
| Cyanidin | Cy | OH | OH | H | OH | OH | OH | H |
| Delphinidin | Dp | OH | OH | H | OH | OH | OH | OH |
| Europinidin | Eu | OH | OMe | H | OH | OMe | OH | OH |
| Hirsutidin | Hs | OH | OH | H | OMe | OMe | OH | OMe |
| 6-Hydroxycyanidin | 6-OHCy | OH | OH | OH | OH | OH | OH | H |
| 6-Hydroxydelphinidin | 6-OHDp | OH | OH | OH | OH | OH | OH | OH |
| Luteolinidin | Lt | H | OH | H | OH | OH | OH | H |
| Malvidin | Mv | OH | OH | H | OH | OMe | OH | OMe |
| 5-Methylcyanidin | 5-MCy | OH | OMe | H | OH | OH | OH | H |
| Pelargonidin | Pg | OH | OH | H | OH | H | OH | H |
| Peonidin | Pn | OH | OH | H | OH | OMe | OH | H |
| Petunidin | Pt | OH | OH | H | OH | OMe | OH | OH |
| Pulchellidin | PI | OH | OMe | H | OH | OH | OH | OH |
| Riccionidin A* | H | H | OH | OH | H | OH | H | |
| Rosinidin | Rs | OH | OH | H | OMe | OMe | OH | H |
| Tricetinidin | Tr | H | OH | H | OH | OH | OH | OH |
Bold type indicates the most commonly found anthocyanidins.
2′OH and an ether connection between 3 & 6′.
1.1. Plant Sources
Anthocyanins are almost exclusively found in higher plants, although a few have been found in lower plants such as mosses and ferns [15, 17]. Generally, the types of anthocyanins in ornamental plants, or flowers, are more complex than those found in fruits, with the exception of grapes which consist of a vareity of anthocyanins. That is, flower pigments can involve both polyglycosylations and polyacylations and undergo a highly regulated series of biochemical steps that lend to a defined set of different compounds that produce the variety of shades or hues, while fruit anthocyanins are simpler and generally include just one or two main pigments per plant source. Examples of such fruits containing anthocyanins includes: pome fruits, stone fruits, berries, tropical fruits, and grapes. Anthocyanins are also found in cereals, legumes, roots, tubers, bulbs, cole crops, grasses, and many other crops outside of these categories. In general, the anthocyanins in most of the fruits and vegetables are observed in concentrations from 0.1% up to 1.0% dry weight [15, 18]. Table 2 gives the concentrations of identified anthocyanins in a variety of plant sources.
Table 2.
Concentration and Plant Sources of Commonly Found Anthocyanins
| Vaccinium macrocarpon | Ribes nigrum | Ribes grossularia | Aronia melanocarpa | Sambucus nigra | ||||||
|---|---|---|---|---|---|---|---|---|---|---|
| Cranberry | Cranberry | Black Currant | Black Currant | Black Currant | Gooseberry | Chokeberry | Chokeberry | Elderberry | Elderberry | |
| Anthocyanins | [23] | [24] | [25] | [25] | [26] | [26] | [26] | [24] | [26] | [27] |
| cy 3-glu | 39.6 | 7.4 | 165 | 165 | 124.8–285.6 | 0.49–54.2 | 376 | 16.9 | 7398 | 2141–2518 |
| cy 3-(coum)glu | 4.3–44.3 | 1.3–22.6 | ||||||||
| cy 3-(caff)glu | 2.4–4.5 | |||||||||
| cy3-gal | 907.2 | 88.9 | 0.25 | 9897 | 1256.3 | |||||
| cy 3-ara | 853.2 | 48 | 3993 | 1424.3 | ||||||
| cy 3-rut | 890 | 851 | 704.4–1388.3 | 4.6–33.6 | 44 | |||||
| cy 3-xyl | 515 | 469 | ||||||||
| cy 3-sam | 5459 | 2705–2770 | ||||||||
| cy 3-sam-5-glu | 826 | |||||||||
| dp 3-glu | 372 | 270 | 542.0–1132.1 | |||||||
| dp 3-rut | 916 | 841 | 1803.0–3114 | |||||||
| pt 3-(coum)glu | 13.4–144.1 | |||||||||
| pt 3-gal | 32.4 | |||||||||
| pt 3-rut | 1 | 2 | 18.6–41.5 | |||||||
| pn 3-glu | 40.4 | 0.5–1.3 | ||||||||
| pn 3-gal | 1195.2 | 213.6 | ||||||||
| pn 3-ara | 568.8 | 99.7 | ||||||||
| pn 3-rut | 12 | 8 | 4.0–16.7 | 0.5–1.5 | ||||||
| pg 3-glu | 18 | |||||||||
| pg 3-ara | 23 | |||||||||
| pg 3-rut | 12.6–22.2 | |||||||||
| Vitis vinifera | Vaccinium angustifolium | Vaccinium corymbosum | Vaccinium myrtillus | |||||||
|---|---|---|---|---|---|---|---|---|---|---|
| Cabernet Franc | Merlot | Pinot Noir | Grape skin | Lowbush blueberry | Lowbush blueberry | Highbush blueberry | Highbush blueberry | Bilberry | Bilberry | |
| Anthocyanins | [28] | [28] | [28] | [29] | [30] | [23] | [30] | [24] | [31] | [25] |
| cy 3-glu | 29.9–53.8 | 59.4–87.5 | 21.1–24.1 | 27.9–53.1 | 91 | 95.2 | 6.8 | 30.4 | 488 | 488 |
| cy 3-(ac)glu | 8.1–14.0 | 11.6–15.4 | 18.7–25.9 | 66.8 | 27.2 | 17.3 | ||||
| cy 3-(coum)glu | 4.3–5.1 | 8.7–9.5 | ||||||||
| cy 3-gal | 93.7 | 85 | 27.4 | 74.9 | 533 | 493 | ||||
| cy 3-(ac)gal | 19.3 | 1.2 | ||||||||
| cy 3-ara | 57.5 | 19.7 | 689 | 450 | ||||||
| cy 3-(ac)ara | 9.5 | 6.8 | ||||||||
| dp 3-glu | 105.0–115.7 | 173.0–250.6 | 62.5–105.6 | 231.7–431.6 | 162 | 132.6 | 78.8 | 112.3 | 766 | 562 |
| dp 3-(ac)glu | 25.6–31.5 | 34.2–46.5 | 57–111.3 | 101.9 | 23.8 | 33 | ||||
| dp 3-(coum)glu | 8.3–10.1 | 16.5–16.6 | ||||||||
| dp 3-gal | 158.8 | 130.9 | 140.8 | 187.4 | 857 | 629 | ||||
| dp3-(ac)gal | 58.8 | 5.7 | ||||||||
| dp 3-ara | 70.8 | 88.4 | 142.2 | 94 | 859 | 632 | ||||
| pt 3-glu | 73.1–78.8 | 110.0–125.6 | 68.7–104.5 | 270.9–385.2 | 115.2 | 181.9 | 51.1 | 70.3 | 437 | 359 |
| pt 3-(ac)glu | 22.8–23.0 | 25.4–29.2 | 84–114.1 | 70.7 | 25.5 | 19.3 | ||||
| pt 3-(coum)glu | 5.5–7.7 | 9.4–11.7 | 33.6–69.7 | |||||||
| pt3-gal | 80.4 | 86.7 | 77.3 | 144.3 | 186 | 167 | ||||
| pt 3-(ac)gal | 1.9 | 0.7 | ||||||||
| pt 3-ara | 33.3 | 54.4 | 50.4 | 128.9 | 147 | 137 | ||||
| pt3-glu | 87.4–106.2 | 74.2–80.9 | 114.2–146.2 | 259.5–381.9 | 49.3 | 5 | 160 | 187 | ||
| pn 3-(ac)glu | 29.7–35.2 | 12.7–14.1 | 118.7–165.5 | 47.8 | 18.7 | 3.5 | ||||
| pn 3-(coum)glu | 17.4–18.4 | 8.8–12.0 | 78.3–300 | |||||||
| pn 3-(caff)glu | 1.6–2.6 | 2.1–3.1 | ||||||||
| pn 3-gal | 25.3 | 32.3 | 5.7 | 33 | 34 | |||||
| pn 3-(ac)gal | 15.3 | 0.3 | ||||||||
| pn 3-ara | 18.7 | 33 | 20 | |||||||
| mv 3-glu | 188.3–263.1 | 203.0–248.2 | 303.5–378.5 | 1834.7–2889.7 | 199 | 239.7 | 112.1 | 114.6 | 492 | 350 |
| mv 3-(ac)glu | 55.4–76.8 | 43.6–56.1 | 923.3–1720.6 | 221.1 | 78.2 | 40 | ||||
| mv 3-(coum)glu | 23.0–39.9 | 20.6–35.1 | 564.3–1908.3 | |||||||
| mv 3-gal | 174.2 | 244.8 | 137.2 | 150.1 | 181 | 124 | ||||
| mv 3-(ac)gal | 116.2 | 27.2 | 24 | |||||||
| mv 3-ara | 68.3 | 98.6 | 122.2 | 114.5 | 136 | 91 | ||||
| Prunus cerasus | Prunus avium | Rubus occidentalis | ||||||||
|---|---|---|---|---|---|---|---|---|---|---|
| Tart cherries | Tart cherries | Tart cherries | Tart cherries | Tart cherries | Sweet Cherry | Sweet Cherry | Sweet Cherry | Black Raspberry | Black Raspberry | |
| Anthocyanins | [32] | [33] | [34] | [35] | [36] | [37] | [35] | [36] | [38] | [39] |
| cy 3-glu | 5.2–12.8 | 6 | 14.3–27.9 | 63.2–441 | 115.1 | 22.6–120.6 | 359–890 | |||
| cy 3-(coum)glu | 4535.3 | |||||||||
| cy 3-rut | 92.6–252.6 | 11.0–49.0 | 94 | 104.8 | 154.5–219.7 | 721.6–1933.3 | 477.5 | 268.2–747.4 | 498–1677 | |
| cy 3-glucorut | 173.0–518.9 | 1.0–165 | 373 | 230 | 889.5–2276.6 | |||||
| cy 3-xylorut | 591–1158 | |||||||||
| cy 3-arabinorut | 17 | |||||||||
| cy 3-sam | 335–552 | |||||||||
| cy 3 (coum)sam | 1295.8 | |||||||||
| cy 3-sopho | 7.2–28.9 | 3.5 | 30.7–119.3 | |||||||
| pn 3-glu | 2.5–7.6 | 1.4 | ||||||||
| pn 3-rut | 17 | 17.8 | 5.9–91.7 | 6.7 | 8.0–58.4 | |||||
| pg 3-glu | 2 | |||||||||
| pg 3-rut | 24.1–158 | 3.3 | ||||||||
| Smilax aspera | Ocimum basilicum | Solanum tuberosum | Tropaeolum tuberosum | Daucus carota | Kalanchoe blossfeldiana | Hippeastrum | ||||
|---|---|---|---|---|---|---|---|---|---|---|
| Sarsaparilla berries | Purple basil | Potato skin | Potato flesh | Mashua Potato | Black Carrot | Flower | Flower | |||
| Anthocyanins | [40] | [41] | [42] | [42] | [43] | [44] | [45] | [46] | ||
| cy 3-glu | 3.8 | 7.3–47.5 | ||||||||
| cy 3-(coum)glu | 1.5 | |||||||||
| cy 3-rut | 1670 | 3.6–60.5 | 76.5–965.7 | |||||||
| cy 3-sopho | 27.8–113.4 | |||||||||
| cy 3-sopho-5-rham | 40.9–132.0 | |||||||||
| cy 3-xyloglucogal | 71.7 | |||||||||
| cy 3-(feru)xyloglucogal | 750.3 | |||||||||
| cy 3-(caff)xyloglucogal | 8.8 | |||||||||
| cy 3-(sina)xyloglucogal | 142.6 | |||||||||
| cy 3-(coum)xyloglucogal | 512.9 | |||||||||
| cy 3-lathy | 255.2 | |||||||||
| cy 3,5-diglu | 1.5 | 26.0–305.8 | ||||||||
| cy 3-(coum)glu-5-glu | 3.6 | |||||||||
| dp 3-glu | 7.4–35.6 | |||||||||
| dp 3-sopho-5-rham | 64.6–228.3 | |||||||||
| dp 3-glu-5-rham | 27.8–113.4 | |||||||||
| dp 3-glu-5-(ac)rham | 214.8–594.8 | |||||||||
| dp 3-sopho-5-(ac)rham | 64.6–729.4 | |||||||||
| dp 3,5-diglu | 2.9–82.8 | |||||||||
| pt 3-(coum)rut-5-glu | 3325–4376 | 115–2320 | ||||||||
| pt 3,5-diglu | 1.3–61.2 | |||||||||
| pn 3,5-diglu | 1.5 | 1.0–74.5 | ||||||||
| pn 3-(coum)glu-5-glu | 34.9 | |||||||||
| pg 3-rut | 20400 | 3.5–1163.1 | ||||||||
| pg 3,5-diglu | 1.6–10.3 | |||||||||
| mv 3-(coum)rut-5-glu | 1954–5779 | 99–1352 | ||||||||
| mv 3,5-diglu | 5.0–52.1 | |||||||||
| Rubus idaeus | Rubus ursinus | Prunus domestica | Lauras nobilis | |||||||
|---|---|---|---|---|---|---|---|---|---|---|
| Red Raspberry | Red Raspberry | Red Raspberry | Blackberry | Blackberry | Blackberry | Plum | Plum flesh | Plum | Bay Laurel berries | |
| Anthocyanins | [38] | [39] | [47] | [48] | [38] | [39] | [49] | [49] | [50] | [51] |
| cy 3-glu | 29–168 | 69.9 | 236.7–251.2 | 1532.7 | 640 | 79.3–1039.3 | 3.2–22.7 | 80–7590 | 90000 | |
| cy 3-(ac)glu | 7.9–43.6 | |||||||||
| cy 3-(coum)glu | 1470.3 | |||||||||
| cy 3-(mal)glu | 17.7 | 19.7 | ||||||||
| cy 3-(dioxal)glu | 37.3 | |||||||||
| cy 3-gal | 27.2 | |||||||||
| cy 3-rut | 22–71 | 62.2 | 382.2 | 450 | 42.0–565.9 | 1.8–7.5 | 8590–1190 | 116000 | ||
| cy 3-glucorut | 62–106 | 115.8 | ||||||||
| cy 3-xyl | 0.1 | |||||||||
| cy 3-sopho | 47–356 | 557.7–638.6 | ||||||||
| Cy 3, 5-diglu | 580.1 | |||||||||
| dp 3-glu | 28.8 | |||||||||
| pn 3-glu | 60–1190 | 10600 | ||||||||
| pn 3-rut | 440–5030 | 10600 | ||||||||
| pg 3-glu | 26.7–42.3 | |||||||||
| pg 3-glucorut | 8 | 24.9 | ||||||||
| pg 3-sopho | 4.0–43.0 | 52.1–87.7 | ||||||||
| mv 3-glu | 28.5–36.4 | |||||||||
Values are listed in μg/g and anthocyanin concentrations may vary within a plant species due to variety, conditions under which the product was sampled and even methods of calculation. Anthocyanin abbreviations are as follows: cy, cyanidin; dp, delphinidin; pt, petunidin; pn, peonidin; pg, pelargonidin; mv, malvidin; glu, glucoside; gal, galactoside; ara, arabinoside; xyl, xyloside; rut, rutinoside; sopho, sophoroside; sam, sambubioside; lathy, lathyroside; ac, acetyl; coum, coumaryl; caff, caffeoyl; mal, malonyl; feru, feruloyl; sinap, sinapoyl; dioxal, dioxaloyl.
Anthocyanins are found in the vacuoles of plants at the surface of the fruit and vegetable skin, also known as the outer epidermal peel, or flower petal. Generally speaking, as the vacuolar concentration of anthocyanins increases, the coloring of the plant skin, flesh, or petal intensifies. Vacuolar concentration can also affect the color hue, causing the difference between pink and deep red pigmentation [19].
1.2. Chemistry
Because anthocyanins act as pigments in a variety of fruits, vegetables, and other plants, color intensity, hue, and stability are very important properties. These properties are highly influenced by structure, pH, temperature, light, oxygen, and a number of other factors. Structurally, anthocyanins undergo transformations with changes in the pH, which has a dramatic effect on color. Studies have examined the color and stability of anthocyanins at a range of pHs and the following scheme shown with the cyanidin (5) structure is generally accepted, (\Fig. (3)). At a pH of approximately 3 or lower, the anthocyanin exists as the flavylium cation and is orange or red. As the pH is raised, kinetic and thermodynamic competition occurs between the hydration reaction of the flavylium cation and the proton transfer reactions related to its acidic hydroxyl groups. While the first reaction gives a colorless carbinol pseudo-base, which can undergo ring opening to a yellow chalcone, the latter reactions give rise to quinonoidal bases. Further deprotonation of the quinonoidal base takes place at a pH of 6–7 with the formation of purplish blue resonance-stabilized quinonoid anions [16, 20]. Due to the pH values typical for fresh fruits and vegetables, each anthocyanin should accurately be represented by a mixture of equilibrium forms [21].
Fig. (3).
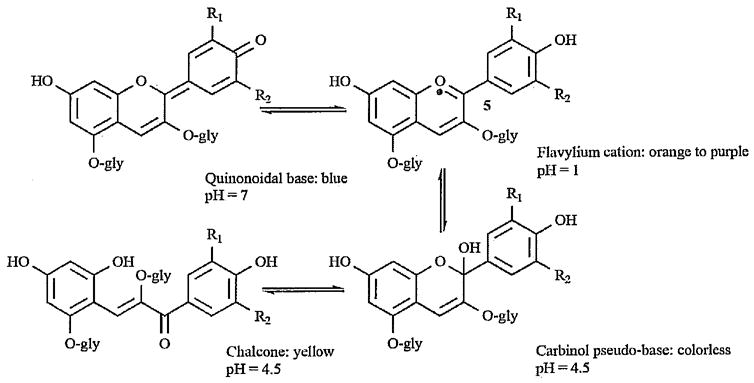
Structural transformations of cyanidin (5) pigments with change in pH, modified from [16].
The structure of each anthocyanin also has an effect on the color that is produced. When evaluating the six common anthocyanidin compounds, the effect of hydroxyl and methoxyl moieties on the resulting color could be elucidated. The hydroxyl group at C-3, a position that is frequently glycosylated, is highly significant because it shifts the color of anthocyanins from yellow-orange to red [22]. The anthocyanins can be placed into two groups based on the colors and intensities at different pHs. Group 1, consisting of the 3-glucosides of pelargonidin, peonidin, and malvidin, maintain bluish colors with intensity and stability above pH 8. However, Group 2, of cyanidin, petunidin, and delphinidin, show a shift from blue pigmentation back to reddish colors above pH 8. Petunidin and delphinidin compounds were found to be very unstable in the basic media, but interestingly, cyanidin was found to have similar stability as the Group 1 compounds [52]. That is, the Group 1 aglycons with just one free hydroxyl group on the B ring were found to give more blue colors and be more stable in basic environments than the group 2 aglycous, with the exception of cyanidin stability. The effects of glucosidic substitutions were also examined at different pHs. The 3-glucoside and 5-glucoside anthocyanins also show bluer hues in alkaline solutions as well as lower the color stability significantly. One of the explanations of the color loss that follows glucosidic substitution is attributed to an enhanced electrophilicity of the flavylium cation as a result of the electron-withdrawing effect induced by introduction of the sugar moiety [53].
Along with variations in the number of sugars and position of attachment, anthocyanins can also differ in acylating groups of the previously mentioned sugar substitutions. Acylated anthocyanins indicate a low sensitivity to pH changes, steadily producing a bluer color than non-acylated anthocyanins. Yet unlike the effect of glucosidic moieties, acylated anthocyanins possess higher color stability in neutral and alkaline solutions. This increased stability is due to the fact that acylated anthocyanins are more resistant to hydration of the flavylium ion leading to an equilibrium pushed towards more quinonoidal base forms [21, 54]. In effect, the acylating groups encourage the production of the bluer pigmentation that glucosidic moieties bring forth but also counteract the instability attributed to the sugars.
Because anthocyanins are highly reactive and therefore easily degraded, the storage environment plays a critical role in maintaining pigmentation. Light and temperature are both known to breakdown anthocyanins. Anthocyanins are best kept in cool, dark environments as the presence of sunlight and high temperatures result in the loss of pigmentation. The degradation of anthocyanins increases proportionally with the heat of storage and exposure of pigments to temperatures from 65°–90°C for only a short amount of time lowered the color half-life to just a few hours. Anthocyanins have been successfully stored for several weeks at temperatures around 2–4°C [55–58]. Relative to storage and preservation of the anthocyanins is the bleaching effect of sulfur dioxide on these compounds. While SO2 is often added to fruits and vegetables as an inhibitor of microbial growth, it also acts as a nucleophile and attacks the flavylium ion of the anthocyanin, effectively bleaching the pigment as it progresses to the colorless hemiacetal form [59–61].
Anthocyanins are also degraded by oxidative mechanisms involving the enzyme polyphenol oxidase (PPO). PPO can be found in blueberries, strawberries, grapes, and cherries and plays an important role in the browning of these fruit juices. However, polyphenol oxidase cannot degrade anthocyanins on its own, but must be in the presence of another substrate, such as caffeic acid, chlorogenic acid, or gallic acid. All these acids are o-diphenolic compounds found in fruits and are involved in the first step of polyphenolic oxidation. The acid is oxidized to its o-quinone form which then oxidizes the anthocyanin to form brown polymers. The different aglycones will result in different products with o-diphenolic anthocyanidins giving products with part of the original acid incorporated. That is, the cyanidin degradation products involve a coupled oxidation mechanism with partial regeneration of the acid. The non-o-diphenolic anthocyanidins such as pelargonidin react with the quinone to form adducts, still resulting in loss of pigmentation. Because the quinone formation from acid is vital in polyphenol oxidation, reduction of the quinone would effectively inhibit the oxidative degradation of anthocyanins. Addition of ascorbic acid retards the color loss by acting as the hydrogen donor to convert the quinone back into its acid form. As long as ascorbic acid is present in the reaction mixture, the anthocyanins remain preserved in the presence of polyphenol oxidase [62–66]. However, ascorbic acid (vitamin C) on its own has an additional degradation effect on anthocyanins. When ascorbic acid is present in the anthocyanin solution, the introduction of oxygen causes the destruction of both compounds. Ascorbic acid performs an oxidative cleavage of the flavylium ion in a manner analogous to the attack by SO2 [67].
Another property of color hue and intensity is the presence of a copigment. A copigment is another compound that is typically colorless, but when added to anthocyanins, interacts with the anthocyanin and greatly enhances the color of the solution [68]. Intermolecular copigmentation reactions are the result of associations between anthocyanins and co-factors such as other polyphenolics, metal ions, or organic acids to produce weak chemical bonds with increased physical and chemical attributes. When polyphenol compounds act as cofactors towards anthocyanins, the two compounds are held together by vertical hydrophobia stacking of the aromatic nuclei. The flavylium cation is then stabilized by its interaction with the copigment and avoids hydration which would form the colorless carbinol pseudo-base. Rather, more flavylium ions are present in the solution leading to intense red colors [69, 70]. Commonly found organic copigments include catechin, epicatechin, procyanidin B2, caffeic acid, p-coumaric acid, chlorogenic acid, myricitrin, and quercitin [71]. As expected, the effect of copigmentation on the color and intensity of solutions varies with anthocyanin structure and changing pH environments. The copigment effect increases with both the number of methoxyl moieties and the number of glycosidic groups on each anthocyanin. That is, copigmentation with pelargonidin, peonidin, and malvidin would produce more intense colors than the other common aglycons or a diglycosidic form would increase the intensity over a monoglycoside [68]. Also, copigmentation increases color intensity at pH values from about 2 to neutral. This indicates that a copigment stabilizes not only the flavylium ion but also the quinonoidal base that is found at neutral pHs and leads to brighter red colors in acidic media and brighter blue colors at neutrality [68]. Another form of copigmentation found in blue flowers is the complexation of metal ions. These metalloanthocyanins involve a supramolecular metal-complex pigment composed of simple anthocyanins, ones that are commonly found in other flowers, flavone cofactors, and metal ions. The metals include Fe3+, Al3+, Mg2+, and Ca2+ and are essential for the blue pigmentation of the flower petals. All known metalloanthocyanin structures show a chiral molecular stacking of the anthocyanins and flavone cofactors, which distinguishes these pigments from other assemblies of compounds [72–74].
While copigmentation is used to intensify color hues by resisting hydration of the flavylium ion, it does not necessarily increase the stability of the anthocyanins with respect to temperature and the presence of light. Heating of the copigmented anthocyanins causes dissociation of the complex resulting in a loss of color at the same rate as non-copigmented anthocyanins. The influence of UV or visible light on the stability of the anthocyanin-copigment complex is fairly similar to anthocyanins without copigments. The pigment complex is shown to slow the degradation, but given enough time, the complexed pigments will also become bleached [75, 76].
The resistance of anthocyanins toward hydration and nucleophilic attack is a promising area and recently new compounds were reported in wine pigments. A type of anthocyanin-pyruvic acid adduct has been studied recently because of an increased stability to pH and SO2 bleaching. They are the pyranoanthocyanins comprised of anthocyanins with the addition of pyruvic acid at C4 and a hydroxyl group at C5 of the original anthocyanin structure. This forms a fourth ring which is responsible for the increased stability found with this compound. The nucleophilic attack of water and sulfur dioxide preferentially occurs at the C4 position of the original anthocyanin structure. This converts the red flavylium ion into its colorless hemiacetal form, causing discoloration of the solution. If this pyruvic acid adduct adds to the C4 position, the molecule is blocked from nucleophilic attack and is suddenly more stable at pH values up to neutral and in higher concentrations of sulfur dioxide [61, 77].
1.3. Bioactivity and Health Properties
The ability of anthocyanins to impart color to the plants or plant products in which they occur leads to an important role of attraction or repulsion of various animals, birds and insects. They serve to attract animals, birds and insects for pollination in flowers and seed dispersal in fruits [1]. The reddish color of Canadian shrub foliage accentuates the black-colored fruits to birds leading to increased removal of the black fruits [78]. One of the more commonly found anthocyanins, cyanidin-3-glucoside, was reported to inhibit larval growth in tobacco worms making anthocyanins agents of biological control as well [79]. California maple aphids flock to and consume yellow leaves of the Japanese maple but tend to ignore the red colored leaves [80]. Anthocyanins can serve as optical filters by protecting molecules from being degraded by visible light. The silver beachweed, for example, holds large amounts of thiarubrine A, a toxin acting as a defense mechanism from insects. Thiarubrine A happens to be very photolabile and since the tree grows along the California coast, it could easily be rendered inactive by the sunlight. However, beachweed also contains a mix of two anthocyanins that serves to protect the compound from sunlight by absorbing the visible light that would otherwise lead to its destruction [81]. Anthocyanins can also protect leaves from a decrease in photosynthesis by absorbing extra light that would otherwise be intercepted by chlorophyll b. Anthocyanins are, in addition to optical filters, excellent scavengers of free radicals. This is a property that has been exploited for its therapeutic purpose, but is also evident in plant cells. Purified solutions can effectively scavenge almost all species of reactive oxygen and nitrogen in a leaf [82].
While anthocyanins serve these important assignments in plants, they are currently studied for their ability to protect against myriad human diseases. The natural electron deficiency of anthocyanins makes these compounds particularly reactive towards oxygen radicals. These antioxidative properties result from the chemical structure of anthocyanins, particularly from the hydroxyl moieties of the C ring which allows chelation of metal ions such as Fe or Cu. The antioxidative activity is also increased by acylation of the sugar residues with aromatic acids. In fact, studies show that anthocyanins can have higher antioxidative activity than vitamin E, ascorbic acid, and β-carotene [83, 84].
The antioxidative activity of anthocyanins has been exhaustively examined [25, 26, 43, 85–91]. Anthocyanin-rich plants have historically been used to treat a number of symptoms and diseases, such as the improvement of visual acuity. Administration of cyanidin-3-rutinoside enhanced night and overall vision due to its effect on rhodopsin regeneration. Studies show that the anthocyanin accelerates formation of an intermediate to regenerate the G-protein-coupled receptor in the retina of the eye [92]. Protection from heart attacks is also associated with administration of anthocyanins, particularly in the form of grape juice and wine but also from other sources [93, 94]. This role is attributed to the ability of these products to reduce inflammation, enhance capillary strength and permeability, and inhibit platelet formation. The mechanism of vasorelaxation that was observed is due to increased nitric oxide release [93]. Anthocyanins can even be shown to aid in the prevention of obesity and diabetes. Studies show that anthocyanin pigments from purple corn inhibit both body weight and adipose tissue increases. The symptoms of hyperglycemia that can follow a high-fat diet were also suppressed with ingestion of this cyanidin-3-glucoside [95].
Interestingly, some antioxidants have shown anti-inflammatory activity as well by interfering with the signaling mechanisms that regulate the cyclooxygenase (COX) gene. Anthocyanins from tart cherries and hibiscus flowers were found to inhibit the activities of COX-1 and COX-2 in vitro [91, 94, 96] and because the COX-2 gene plays a role in tumorigenesis, anthocyanins can affect the spread of cancer through a variety of mechanisms. Apoptosis is a common method of eliminating tumor cells and apoptosis-inducing agents are expected to be excellent anticancer or antitumor drugs. Some anthocyanidins and their glycosides, specifically delphinidin, cyanidin, and petunidin, induce apoptosis of human promyelocytic leukemia (HL-60) cells. These compounds differ from pelargonidin, peonidin, and malvidin by the number of hydroxyl groups on the B ring and it appears the specific ortho position of the hydroxyls is necessary for the apoptosis action [97, 98]. The same anthocyanidins can also inhibit activator protein 1 (AP-1) transcriptional activity and cell transformation in certain mouse epidermal cells. AP-1 is a transcription factor mat promotes carcinogenesis and so the associated anthocyanins show encouraging properties against the progression of cancer. Again, since only delphinidin, cyaniding, and petunidin exhibited this inhibition, the researchers postulated that the structure of the B ring produces the observed activity [99]. The chemopreventive studies of anthocyanin pigments have mostly been limited to the aglycone form. This does not suggest that anthocyanins lack chemopreventive activity, in fact they do possess the same properties, but to a different degree. The biological activities of anthocyanins tend to increase with decreasing number of glycosides and an increasing number of hydroxyls [96]. Given the increasing number of research studies highlighting and examining the health benefits, it is reasonable to predict that over time, an increasing array of health benefits and applications to improve human health and nutrition will follow as well as a greater understanding of their mode of actions as well as their bioavailability and final form at the targeted tissue site(s) of action.
1.4. Biosynthesis and Metabolism
The rainbow of colors and diverse functions attributed to anthocyanins has made these pigments of great interest to biochemists and molecular biologists. The biosynthetic pathway of anthocyanins is one of the most extensively studied pathways of plant secondary products and has lead to the identification of the genes and enzymes responsible for the biosynthesis of anthocyanins. A representation of the general biosynthetic pathway is shown in Fig, (4); this pathway was mostly formed from the investigation of three main species: maize (Zea mays), snapdragon (Antirrhinum majus), and petunia (Petunia hybrida) [100, 101].
Fig. (4).
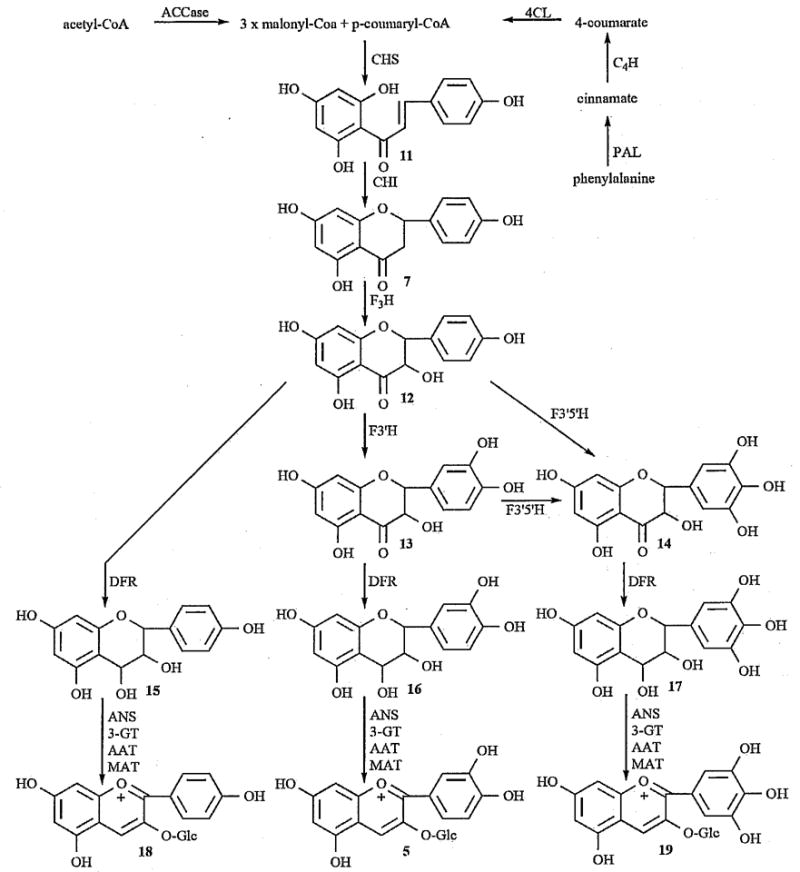
General representation of the biosynthetic pathway of anthocyanins, specifically pelargonidin (18), cyanidin (5), and delphinidin (19), modified from [101]. The intermediate compounds consist of naringenin chalcone (11), naringenin (7), dihydrokaempferol (12), dihydroquercetin (13), dihydromyricetin (14), leucopelargonidin (15), leucocyanidin (16), and leucodelphinidin (17). Catalysts are acetyl-CoA carboxylase (ACCase), phenylalanine ammonia-lyase (PAL), cinnamate 4-hydroxylase (C4H), 4-coumarate:CoA ligase (4CL), chalcone synthase (CHS), calcone isornerase (CHE), flavanone 3-hydroxylase (F3H), flavonoid 3′-hydroxylase (F3′H), flavonoid 3′,5′-hydroxylase (F3′5′H), dihydroflavonol 4-reductase (DFR), anthocyanidin synthase (ANS), flavonoid 3-O-glucosyltransferase (3-GT), anthocyanin acyltransferase (AAT), and anthocyanin rnalonyltranferase (MAT).
The precursors for the synthesis of all flavonoids, including anthocyanins, are malonyl-CoA and p-coumaryl-CoA. Chalcone synthase (CHS) catalyzes the first committed step in the biosynthetic pathway by sequential condensations of three acetate moieties from malonyl-CoA with p-coumaryl-CoA to yield a tetraketide intermediate that immediately cyclizes to form naringenin chalcone (11), a tetrahydroxychalcone [100]. The accumulation of this chalcone in plant tissues is quite rare; therefore, naringenin chalcone undergoes a Michael-type addition, catalyzed by chalcone isomerase (CHI), to the stereospecific (2S)-naringenin (7) with the nucleophilic attack of the deprotonated hydroxyl on the α,β-unsaturated alkene. This isomerization can occur spontaneously, without CHI, but does so at a much slower rate [101]. Naringenin, a flavanone, is then converted to a dihydroflavonol (dihydrokaempferol, 12) by hydroxylation at position 3 catalyzed by flavanone 3-hydroxylase (F3H). From this point, the dihydroflavonol can be converted into three different molecules, leading to three different anthocyanidins. Dihydrokaempferol can be converted to a dihydroquercetin (13) with hydroxylation at me 3′ position, catalyzed by flavanone 3′-hydroxylase (F3′H), which will give cyanidin pigments (5). Hydroxylation at the 3′ and 5′ positions to give dihydromyricetin (14), catalyzed by flavanone 3′,5′-hydroxylase (F3′5′H), will eventually lead to the blue delphinidin pigments (19). Finally, no additional hydroxylations on the B ring will give the pelargonidin pigments (18) [101].
The dihydroflavonols are reduced by dihydroflavonol 4-reductase (DFR) to leucoanthocyanidins (leucopelargonidin 15, leucocyanidin 16, and leucodelphinidin 17) in the course of the biosynthetic pathway. The reductase enzyme catalyzes the stereospecific reduction of the ketone at position 4 to give (2R, 3S,4S)-leucoanthocyanidins [100]. Anthocyanidin synthase (ANS) catalyzes the next step, conversion of the colorless leucoanthocyanidin to 2-flaven-3,4-diol, which is then glycosylated by flavonoid 3-O-glucosyltransferase (3-GT) and transported into the vacuole where it is finally converted to the colored flavylium ion [100]. The ANS belongs to a family of 2-oxoglutarate-dependent oxygenases and, therefore, requires the presence of Fe2+, 2-oxoglutarate, molecular oxygen, and ascorbate; however, the reaction sequence does not require any additional dehydratase, despite the involvement of a formal dehydration step [102, 103]. In the first step, ANS uses the ferrous ion, molecular oxygen, and 2-oxoglutarate to form an oxoferryl-enzyme complex, along with succinate and CO2. This oxoferryl-enzyme complex catalyzes the hydroxylation at position 2 followed by spontaneous dehydration to give 2-flaven-3,4-diol. This product immediately isomerizes to the more stable pseudo-base (3-flaven-2,3-diol) at neutral pH [104]. The enzyme 3-GT now catalyzes the glucosylation at position 3 of the pseudo-base which is subsequently transported into the vacuoles and converted to the colored flavylium ion due to die acidic vacuolar conditions [100].
As natural anthocyanins are more complex than a simple monoglucoside, the 3-O-glycosylation is almost always a prerequisite for further modification, such as additional glycosylation, methylation, and acylation [101]. Glucosylation at the 5 position is catalyzed by anthocyanin 5-O-glucosyltransferase (5-GT) and uses UDP-glucose as a co-factor. The placement of a sugar moiety at die 5 position allows for more stable complexes in copigmentation of anthocyanins as well as modifying die pigment color, specifically creating a purplish-blue hue [100, 104]. The glycosylation of roses (Rosa hybrida), differs from the normal biosynthetic pathway in that it relies on a single enzyme to achieve glucose attachment at the 3 and 5 positions of die pseudo-base, 3-flaven-2,3-diol. Interestingly, the 3-O-glycosylation is not a prerequisite for this species, but rather glycosylation occurs first at die 5-OH and then at the 3-OH group. The enzyme, UDP-glucose: anthocyanidin 5,3-O-glycosyl transferase, is referred to as RhGT1 being that it is unique to members of the R. hybrida family. After the first glycosylation, anthocyanidin 5-O-glucoside is unstable without the additional glycosylation at its 3-OH position and so cannot be isolated; however, the unorthodox pathway was identified because RhGT1 cannot use anthocyanidin 3-O-glucoside as an acceptor, only the unglycosylated or 5-O-glucosidic anthocyanidin [105].
Methylation of the anthocyanidin hydroxyls and acylation of the sugar moieties are common methods used to affect color hue and stability of the pigment as well as aid in copigmentation. Methoxyl groups are found in three of the main anthocyanidins, peonidin, petunidin, and malvidin, and lead to more stable compounds with the methylation of the reactive hydroxyl groups. Acylated anthocyanins indicate a low sensitivity to pH changes by increasing water solubility, steadily producing a bluer color than non-acylated anthocyanins. Acylation also leads to higher structure stability by protecting the suger moieties against degradation by glucosidase. The use of aromatic acids for acylation contributes to intra- and inter-molecular stacking seen in copigmentation, resulting in intensifying the blue pigmentation. Anthocyanin acyltransferases (AATs) catalyze the regiospecific acyl transfer from acyl-CoA to the appropriate sugar of the anthocyanin. The enzymes are classified on the basis of their acyl-donor specificity into two categories: aliphatic and aromatic acyltransferases [100, 106]. Once the biosynthesis is completed, including modifications such as additional glycosylation, methylation, acylation, the final product is transported into the plant vacuole for storage. The acidic environment of this vacuole is responsible for the conversion of the pseudo-base anthocyanin to its colored flavylium ion form. While the biosynthetic pathway of anthocyanins has been well studied, the vacuolar transportation has several possible mechanisms. The proposed mechanisms consist of: pH-dependent transport [107], multidrug and toxic compound extrusion (MATE) protein-mediated system [108], MgATP-energized transport by ATP-binding cassette (ABC) [109–111], or 24-kDa vacuolar protein (VP24) precursor protein transport [112]. Taken together, these findings indicate that different plant species may use distinct mechanisms to distribute flavonoids among subcellular compartments, and multiple mechanisms may be used in individual species [100].
The metabolism of dietary anthocyanins dictates how active the compounds are in the human system. While extensive studies have been performed, more metabolic studies are needed to fully ascertain the activity of anthocyanins as the knowledge of these compounds increases. The early methods for testing anthocyanin absorption consisted of measuring the presence of red pigments in urine after oral administration. The evolution of testing methods has lead to observing anthocyanin absorption in plasma and urine to determine both location of absorption and rate of excretion. For many years, studies reported very low numbers for absorption of anthocyanins after oral administration, on the order of 0.004% to 0.1% of the intake, and indicated a rapid absorption and excretion with time to the maximum concentration to be 1.5 h for plasma and 2.5 h for urine [113]. However, most of the analyses were performed with UV-Vis detection after acidification, under the assumption all the anthocyanins would be converted into the colored flavylium form, and it is possible that some forms existing at neutral pH could not be colored due to chemical reactions within the plasma or urine [113]. Also, the common technique involved freezing and storing the urine and plasma samples before analysis but chromatograms of samples immediately after collection showed additional peaks that had degraded in the chromatograms of frozen samples [114]. Taking into account the special conditions on the analysis of anthocyanins, the metabolic products found in urine samples have included methylation, Phase II glucuronidation, and sulfated derivatives [114, 115]. The common methylate derivatives are cyanidin glycosides methylated to peonidin glycosides but other glucuronyl and sulfate derivatives were not limited to any specific aglycone. Even with the observation of these anthocyanin metabolites, the majority of ingested anthocyanins are not recovered and therefore continued investigation is necessary to determine the fate of the compounds in the body. As anthocyanins are rapidly degraded by intestinal microflora, this additional metabolism could account for the unrecovered anthocyanins [116], yet the development of a quantitative marker to better understand the bioavailability and in situ concentration is needed. Anthocyanidin glycosides are hydrolyzed by the microflora with cleavage of the protective 3-glycosidic linkage. The released aglycones are very unstable molecules under any condition, but in the neutral pH of the physiological conditions, they are spontaneously degraded into monomeric phenolic acids and aldehydes, specifically protocatechuic acid, syringic acid, vanillic acid and phloroglucinol aldehyde [116,117].
2. ANALYTICAL METHODOLOGIES
To adequately cover the analytical methodologies of anthocyanin compounds, the complete process of analysis is reviewed from the initial extraction of anthocyanins from plant tissues, the isolation and purification of anthocyanins from the crude plant extract and, finally, the structure elucidation or identification of each particular anthocyanin. The analysis of anthocyanin is complicated because of their ability to undergo structural transformations and complexation reactions, as discussed. Also, these compounds are difficult to measure separate of other flavonoids because they have similar structures, see Fig. (2), and reactivity characteristics. Finally, pure anthocyanin standards, which are integral for accurate quantification purposes, are not readily available for purchase and are not easily purified from plant sources for use in research in part due to the instability issues previously highlighted [18].
The specific methods of extraction from the plant tissues are best discussed after a description of the analytical methods. There are a number of different sample preparation techniques that are somewhat dependent on the analytical techniques being utilized. However, the overall concept involves dried, powdered plant material and extracted with alcohol under cold conditions, because of the susceptibility of anthocyanins to degradation by high temperatures. The extracting solution should be slightly acidic to maintain the flavylium cation form, which is red and stable in highly acidic medium, but not too acidic to cause partial hydrolysis of the acyl moieties in acylated anthocyanins [18,118,119].
The most common method for analysis of anthocyanins is high performance liquid chromatography (HPLC). This often refers to separation methods by HPLC in conjunction with identification methods such as UV/Vis spectrophotometry (LC/UV), mass spectrometry (LC/MS), or nuclear magnetic resonance (LC/NMR) to elucidate the anthocyanin structures [118]. Another common technique used for separation of anthocyanins from crude plant extracts is capillary electrophoresis (CE) [1]. Both of these common separation methods are demonstrated in a side-by-side comparison in Fig. (5). While a complete description of the current abilities and recent advances of HPLC and CE instrumentation for analyses of anthocyanins will be covered in this review, some historical separation techniques should also be briefly described, such as paper chromatography (PC) and thin-layer chromatography (TLC) [18, 79].
Fig. (5).
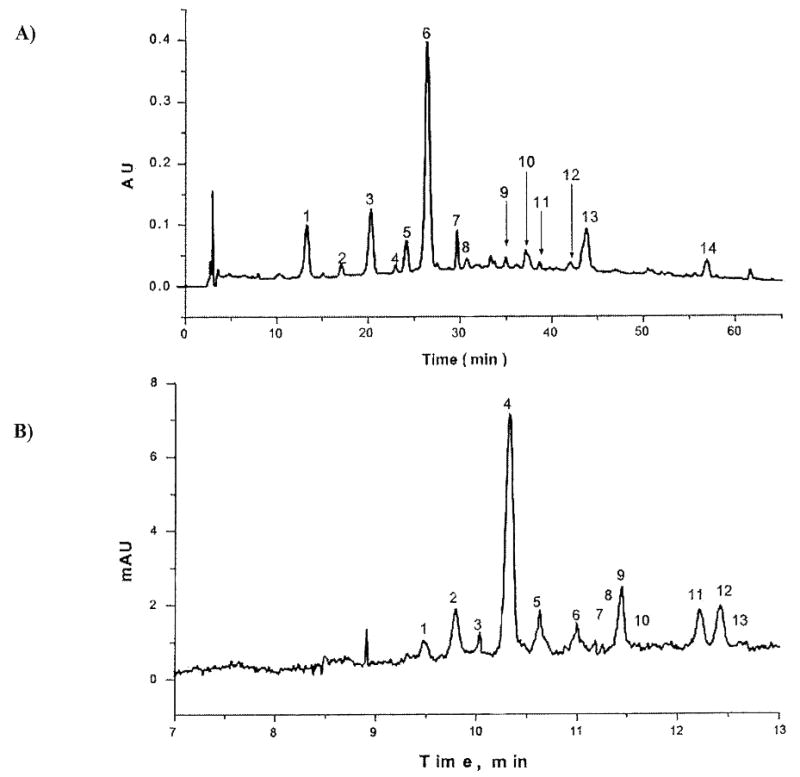
A side-by-side comparison of an LC analysis (upper) and CE analysis (lower) of a 2002 vintage Tannat red wine. The conditions are described in the original paper and the peak identification for each follows. The LC chromatogram (A): 1, delphinidin-3-glucoside (dp); 2, cyanidin-3-glucoside (cy); 3, petunidin-3-glucoside (pt); 4, pt-3-glucoside pyruvic acid dimer; 5, peonidin-3-glucoside (pn); 6, malvidin-3-glucoside (mv); 7, mv-3-glucoside pyruvic acid derivative; 8, dp-3-(6-acetyl)glucoside; 9, mv-3-glucoside catechin dimer; 10, pt-3-(6-acetyl) glucoside; 11, mv-3-glucoside catechin dimer; 12, pn-3-(6-acetyl)glucoside; 13, mv-3-(6-acetyl)glucoside; 14, mv-3-(6-coumaryl)glucoside; The CE electrophoregram (B): 1, rnv-3-(6-coumaryl)glucoside; 2, mv-3-(6-acetyl)glucoside; 3, pn-3-(6-acetyl)glucoside; 4, mv-3-glucoside; 5, pn-3-glucoside; 6, mv-3-glucoside catechin dimer; 7, mv-3-glucoside catechin dimer; 8, pt-3-(6-acetyl)glucoside; 9, mv-3-glucoside pyruvic acid derivative; 10, pt-3-glucoside pyruvic acid derivative; 11, pt-3-glucoside; 12, dp-3-glucoside; 13, cy-3-glucoside. Modified from Calvo et al. [120] and used with permission from Elsevier Publishers.
2.1. Historical Chromatographic Methods
Paper chromatography (PC) and thin layer chromatography (TLC) are two techniques that have historically been used for the separation of anthocyanins, but with the development of HPLC and CE methodology, there is little advancement to describe for these two basic chromatographic techniques. Paper chromatography was one of the first methods employed for the isolation and purification of certain anthocyanins and depending on the specific sample and the different mobile phases, PC did permit good resolution for some pigment mixtures. Unfortunately, this technique did not allow large quantities of pure anthocyanins to be obtained and generally needed long development times [118].
With the introduction of TLC, some specific advantages over PC were realized in that TLC requires lower quantities of anthocyanin mixtures for analysis, requires shorter times for elution, and achieves better resolution. Due to the variability in distance the compounds travel with different solvent systems, it is necessary to use reference compounds when using TLC to isolate anthocyanins from plant extracts. While it is an advancement in technology, TLC does offer results directly comparable to PC and, along with PC, does not permit pure anthocyanins to be obtained in large quantities. In spite of their drawbacks, TLC and PC, are still being used as routine techniques in many laboratories, due to their low cost and the constant development of better supports and mobile phases [118].
2.2. Capillary Electrophoresis
Capillary electrophoresis (CE) separates compounds based on differences in their electrophoretic motility and possesses excellent mass sensitivity, high resolution, low sample consumption, and minimal generation of solvent waste. The CE instrumentation consists of two reservoirs and a fused silica capillary tube containing a carrier electrolyte and a high voltage source. A sample is introduced into the capillary tube at the anode and the mobile phase will move some components of the sample towards the cathode while others are held back at the anode by charge attraction [1, 79]. In capillary zone electrophoresis (CZE), the most common method used for separation of anthocyanins, the migration of a particular compound depends on its charge-to-size ratio. That is, the total migration time for positively-charged smaller molecules is longer than that for molecules of lesser charge and/or larger size [121]. The commonly accepted method for separation of anthocyanins, using basic media, involves a sodium tetraborate buffer at pH = 8.4 with 15% methanol. The separation is carried out in positive polarity mode and a positive electroosmotic flow with migration of the compounds from anode to cathode. Detection of the compounds is performed by UV/Vis at 599nm, given the blue quinonoidal base form Fig. (3) of the anthocyanins, and often include collection of the full spectrum, from 200 to 599 nm, for each peak [120, 122, 123].
The applicability of CZE in basic media is limited by the instability of anthocyanins in basic environments; therefore, the separation of anthocyanins from plant extracts by CZE will use acidic media and configure the system to run from cathode to anode. The acidic media will ensure the anthocyanins remain in the protonated flavylium form, (Fig, (3)), and the migration of anthocyanins is towards the anode, reversing the electroosmotic flow. The speed by which they are drawn to the anode depends on their charge-to-size ratio, as seen with normal electroosmotic flow [124]. With acidic media and the acidic form of anthocyanin compounds, another problem arises with the formation of ionic interactions between the flavylium cation and the anionic silanol groups covering the capillary tube. For this reason, da Costa et al. [124] optimized their acidic media from a phosphate buffer at pH 1.5 up to pH 1.8, after which no interaction between the silanols and the anthocyanins could be detected. Bicard et al. [125] shortened the analysis time by introducing a cationic surfactant, cetyltrimethylammonium bromide (CTAB), to interact with the negatively-charged silica on the capillary wall ensuring free-flowing anthocyanin cations in the presence of the anionic silanols. The concentration of CTAB added to the running buffer remains below the critical micelle concentration and effectively separates the compounds, utilizing a reversed electroosmotic flow as they migrate from the cathode to the anode. This experiment was performed using running buffer and sample media at a pH 2.1 and produced excellent separation of anthocyanin peaks as detected by UV/Vis at 520 nm [125].
There is an additional chromatographic method of CE known as micellar electrokinetic chromatography (MEKC) that has been used to efficiently separate the anthocyanins of elderberry pigments and grape skins. The separation principle of MEKC is based on partitioning of the solute, consisting of non-charged anthocyanins in a neutral environment, between an aqueous phase and a micellar pseudophase. The anthocyanins, all cyanidin derivatives, were separated using sodium dodecyl sulfate (SDS) in a phosphate-borate buffer at pH 7.0 and show a UV/Vis absorbance maximum at 280 and 560 nm. While many MEKC separations might use a shorter wavelength such as 214nm, anthocyanins are best monitored at 280 or 560 nm [124, 126].
2.2.1. CE with MS Detection
Capillary electrophoresis has grown in prominence because of its abilities to separate complex mixtures of anthocyanins. Traditionally, the common detector coupled to CE instrumentation has almost exclusively been UV/Vis spectrophotometry, but the more sophisticated detection method of mass spectrometry is growing. The use of CE/MS provides important advantages given the combination of the great separation capabilities of CE and the power of MS as an identification and confirmation method [127]. Regardless of the large number of ionization techniques available for mass spectrometry, the principal interface used for direct coupling of CE to MS has been electrospray ionization (ESI). ESI-MS effectively couples liquid phase separation methods, such as CE, with the gas phase-based MS. The mechanism of ESI, a soft ionization method that produces gaseous ions from highly charged evaporating liquid droplets, causes a challenge in coupling these two techniques because most running buffers used in CE are non-volatile substances. This limitation must be accounted for when choosing a solvent system for a CE-ESI-MS analysis of anthocyanins compounds [127, 128]. Additionally, a sheath liquid should be introduced into the system, running with the system, to stabilize the spray by providing a steady stream out of the capillary. Bednar et al. [129] examined different solvent systems for the analysis of anthocyanin dyes, comparing an acidic running electrolyte (pH = 2) and a basic one (pH = 9) to determine what environment provides the better results, the results of this comparison are demonstrated in Fig. (6). Glucosylated anthocyanins were efficiently separated with an acidic buffer of monochloroacetate-ammonium at a pH of 2 using a sheath liquid of 80% aqueous methanol with 0.25 % acetic acid (v/v). The migration order corresponded to increasing molecular mass as predicted in acidic media. However, the basic running buffer, comprised of borate-ammonium at a pH of 9, used the same sheath liquid and achieved a better overall separation of the anthocyanins, specifically of diastereomeric pairs that could not be distinguished in the acidic CE-ESI-MS analysis. These observations demonstrate a basic running electrolyte should be used if possible for optimal separation of anthocyanin compounds, but an acidic media is acceptable under certain conditions. While most borate buffers are made with disodium tetraborate which is non-volatile and not appropriate for ESI-MS, this borate buffer was made with boric acid having a similar volatility to acetic acid [129].
Fig. (6).
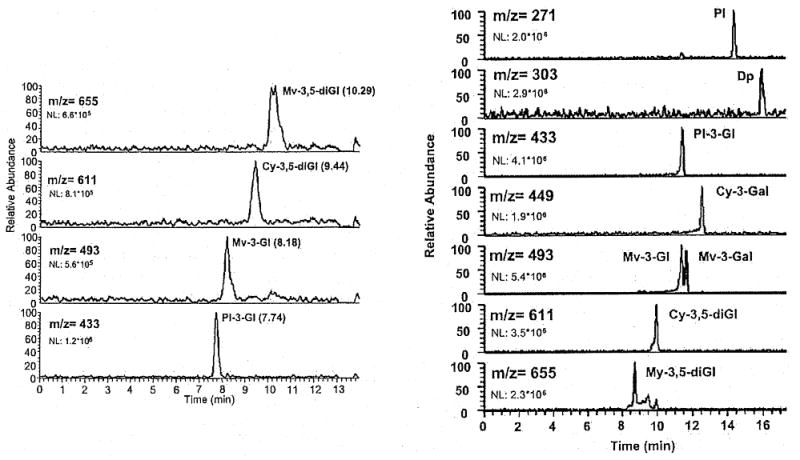
Separation of common glucosylated anthocyanins in acidic electrolyte at pH=2 (left) and basic electrolyte at pH=9 (right) with appropriate mass spectrometry data included for each anthocyanins. The two figures demonstrate the difference in migration order with acidic versus basic media. Modified from Bednar et al. [129] and reprinted with permission from Wiley VCH Publishers.
2.3. High Performance Liquid Chromatography
As reviewed, high-performance liquid chromatography (HPLC) has been the method of choice for the qualitative and quantitative analysis of anthocyanins. This is because of the capability of LC in preparation of samples on the gram scale using preparative-HPLC (prep-HPLC) and the purification of samples on the milligram scale with semipreparative-size LC columns and on the microgram scale with analytical-size column. HPLC is also used for identification of individual natural compounds in the plant matrices using coupled techniques such as HPLC with UV/Vis spectrophotometry detection (LC-UV), with mass spectrometry detection (LC-MS), or with nuclear magnetic resonance detection (LC-NMR). The extent of HPLC and its various detection methods will be discussed in depth as well as the recent advances and future directions regarding the analytical methodologies of anthocyanins.
As illustrated in Table 3, there is not a single standard procedure for the analyses of anthocyanins using HPLC. Rather, there are a wide variety of columns and parameters that have been used in anthocyanin characterization from the same plant source resulting in equivalent separations. Some specific methods are described in detail, and there are some general trends for anthocyanin analysis. A high proportion of isolation methods for anthocyanins are generally run on reverse-phase columns, such as octadecyl silane (ODS), polystyrene, or phenyl-bonded columns [124]. Also, HPLC methods tend to utilize gradient solvent systems of acetonitrile-water or methanol-water with a small amount of acid to lower the solution pH and increase stability of the anthocyanins as mentioned with CE methodology. These solvents are most popular due to their compatibility with gradient methods for isolation and the various detection methods coupled to the HPLC used for identification. To obtain reproducible results using this instrumentation, the pH of the mobile phase and temperature of the column must be controlled due to the instability of anthocyanin compounds in changing pH and temperature environments. For optimal results, acidic mobile phases, lower than pH 2.0, are employed to ensure the anthocyanin remains in the more stable flavylium form and to reduce peak tailing of the chromatogram [1, 119, 124]. In reverse-phase chromatography, the retention time decreases with increasing polarity, which corresponds to increasing number of hydroxyl moieties on the flavylium ion and the elution order of delphinidin, cyanidin, petunidin, pelargonidin, peonidin, and malvidin. Due to reverse-phase elution, diglycosylated anthocyanins will have the lowest retention time, followed by monoglycosylated anthocyanins, aglycones, and lastly the acylated anthocyanins [121, 124]. In the acidic media, the flavylium cation is red-colored and gives an absorption maximum around 520 nm, which avoids interference from other flavonoids that may be present in the plant extract. Because of this unique absorbance maxima, anthocyanins have been accurately identified and quantified from very crude plant extracts [124]. Normal phase systems, or those using unmodified silica gel, are not effective for the separation of anthocyanins due to the polarity of these compounds [119].
Table 3.
HPLC Methodology of Analysis for Selected Anthocyanins
| Plant Sample | Anthocyanins | Column | Column Size (mm) |
Particle Size (um) |
Solvent A | Solvent B | Gradient (Changing % B) | Detector | Reference |
|---|---|---|---|---|---|---|---|---|---|
| Apples (Malus domestica) | cy glycosides | Waters Xterra RP-18 | 150×2.1 | 3.5 | water-formic acid (95:5) | methanol-formic acid (95:5) | 10% to 30% over 10 min, 40% at 17 min, 51.2% at 21 min, 64% at 26 min, 90% at 30 min | DAD, ESI-MS | [131] |
| Artichoke (Cynara scolymus) | cy mono & diglycosides | Phenomenex C18 Hydro Synergi | 150×3.0 | 4 | water-formic acid-acn (87:10:3) | water-formic acid-acn (40:10:50) | 5% for 5 min, 12% at 12 min, 18% at 20 min, 25% at 25 min, 40% at 35 min, 100% at 37 min, 100% at 42 min, 5% at 45 min, 5:% at 50 min | DAD, ESI-MS, MS-MS | [132] |
| Bilberry (Vaccinium myrtilus) | cy, dp, pt, pn, mv glycosides | Waters Xterra Phenyl | 150×4.6 | 5 | water-formic acid (90:10) | acn | 1% to 3% over 5 min, 10% at 8 min, 10% at 12 min, 30% at 13 min, 30% at 15 min | UV | [133] |
| Bilberry (V. myrtilus) | cy, dp, pt, pn, mv glycosides | Waters Xterra Phenyl | 150×2.1 | 3.5 | water-formic acid (90:10) | acn | 1% to 3% over 5 min, 10% at 8 min, 10% at 12 min, 10% at 17 min, 30% at 18 min, 30% at 20 min | MS-MS | [133] |
| Bilberry (V. myrtilus. & rabbiteye blueberry (V. ashei) | dp, cy, pt, pn, mv mono & diglycosides | Capcell Pak C18 UG120 | 150×4.6 | 5 | 0.1%TFA in water | acn-water (50:50) with 0.1% TFA | 15% to 30% over 60 min | DAD, ESI-MS | [134] |
| Black & red raspberry (Rubus occidentalis & idaeus) | cy, pg glycosides | Waters Symmetry C18 | 75×4.6 | 3.5 | water-formic acid (90:10) | acn | 0% to 10% over 20 min, 0% at 25 min | DAD, ESI-MS, MS-MS | [135] |
| Black currant (Ribes nigrum) | dp & cy glycosides | Hypersil ODS | 60×4.6 | 3 | water-formic acid (95:5) | acn | 5% to 18% over 8 min, 95% at 13 min, 95% at 14 min. 5% at 19 min, 5 % at 24 min | DAD | [136] |
| Black currant (R. nigrum), chokeberry (Aronia melanocarpa), & elderberry (Sambucus nigra) | dp, cy, pt mono & diglycosides | Capcell Pak C18 UG120 | 150×4.6 | 5 | 0.1%TFA in water | acn-water (50:50) with 0.1% TFA | 15% to 30% over 60 min | DAD, ESI-MS | [134] |
| Black rice (Oryza sativa) | cy & pn glycosides | Waters Xterra RP-18 | 50×2.1 | 2.5 | water | methanol (solvent C: 5% formic acid | A-B-C (70:10:20) to (40:40:20) over 5 min, (70:10:20) for 3 min | DAD, ESI-MS | [137] |
| Blueberry (Vaccinium corymbosum) | dp, cy, pt, pn, mv glycosides | Waters Symmetry C18 | 75×4.6 | 3.5 | water-formic acid (90: 10) | acn | 0% to 30% over 20 min, 0% at 25 min | DAD, ESI-MS, MS-MS | [135] |
| Boysenberry extract (R. loganbaccus × bailyanus) | cy mono & diglycosides | LiChroCart Superspher 100RP-18 | 250×2.0 | 5 | water-formic acid (95:5) | methanol | 25% to 60% over 40 min, 100% at 45 min, 100% at 50 min | DAD, ESI-MS | [138, 139] |
| Camu-camu (Myrciaria dubia) | dp, cy glycosides | C18 Shim-pack CLC-ODS | 250×4.6 | 5 | water-phosphoric acid (96:4) | acn | 85% to 20% over 25 min | DAD | [140] |
| Camu-camu (M. dubia) | dp, cy glycosides | Synergi MaxRO RP-12 | 250×4.6 | 5 | water-acn-formic acid (87:3:10) | water-acn-formic acid (40:50: 10) | 6% to 20% over 20 min, 40% at 35 min, 60% at 40 min, 90% at 45 min | UV, ESI-MS, MS-MS | [140] |
| Crabapple (Malus domestica) | cy glycosides | Waters Xterra RP-18 | 250×4.6 | 5 | water-phosphoric acid (96:4) | acn | isocratic at 10% | DAD | [141] |
| Crabapple (Malus domestica) | cy glycosides | Waters Xterra RP-18 | 250×4.6 | 5 | 0.1% TFA in water | water-acn-acetic acid-TFA (50.4:48.5:1:.1) | 20% for 26 min, 60% at 30 min, 20% at 35 min | ESI-MS | [141] |
| Cranberry (Vaccinium macrocarpon | cy & pn glycosides | Waters Nova-Pak C18 | 150×3.9 | 5 | water-phosphoric acid (96:4) | acn | 5% to 25% over 60 min | DAD | [142] |
| Cranberry (V. macrocarpon) | cy & pn glycosides | Waters Symmetry C18 | 100×2.1 | 3.5 | water-formic acid (98:2) | methanol-formic acid (98:2) | 1% to 20% over 30 min, 40% at 45 min, 95% at 60 min | DAD, ESI-MS | [142] |
| Bee pollen (Echium plantagineum) | dp, cy, pt, pn, mv glycosides & acylglycosides | Phenomenex AQUA RP-C18 | 150×4.6 | 5 | 0.1% TFA in water | acn | 10% for 5 min, 13% at 20 min, 15% at 35 min, 35% at 55 min, 10% at 65 min | DAD, ESI-MS | [143] |
| Flower petal (Clitoria ternatea) | dp acylglycosides | Develosil C30-UG-3 | 150×1.5 | 3 | water-acn (95:5) with 0.05% TFA | water-acn (60:40) with 0.05% TFA | 14% to 86% over 30 min | DAD | [144] |
| Flower petal (C. ternatea) | dp acylglycosides | Develosil C30-UG-3 | 150×1.5 | 3 | water-acn (95:5) with 0.05% TFA | water-acn (60:40) with 0.05% TFA | 0% to 60% over 45 min | DAD | [144] |
| Flower petal (C. ternatea) | dp acylglycosides | Develosil Ph-UG-5 | 150×1.5 | 5 | water-acn (95:5) with 0.1% TFA | acn-water (80:20) with 0.1% TFA | 5% to 25% over 45 min | DAD | [144] |
| Flower petal (C. ternatea) | dp glycosides & acylglycosides | Develosil CC30-UG-5 | 250×1.5 | 5 | water-acn (95:5) with 0.1% TFA | water-acn (60:40) with 0.1% TFA | 14% to 86% over 45 min | DAD, MS-MS | [145] |
| Fruit (Coriaria myrtifolia) | dp, cy, pt, pn, mv glycosides | Nova Pak C18 | 250×4.5 | 5 | water-formic acid (90:10) | acn | 5% to 9% over 5 min, 11% at 15 min, 15% at 40 min, 20% at 50 min, 30% at 65 min, 40% at 70 min | DAD | [146] |
| Fruit-derived foods | mv glycosides | Lichrospher 100-RP18 | 250×4.0 | 5 | water-formic acid (98:2) | acn-water-formic acid (80:18:2) | 5% to 30% over 40 min, 40% at 50 min, 100% at 55 min | DAD | [147] |
| Fruit-derived foods | mv glycosides | Lichrospher 100-RP18 | 250×4.0 | 5 | water-formic acid (98:2) | acn-water-formic acid (80:18:2) | 10% for 4 min, 15% at 15 min, 50% at 40 min, 100% at 45 min | ESI-MS | [147] |
| Grapes (Vitis vinifera) | cy, dp, pt, pn, mv glycosides & acylglycosides | Agilent Zorbax SB-C18 | 250×3.6 | 5 | water-formic acid (95:5) | methanol-acn-water (33:60:70) | 10% to 11% over 6 min, 12% at 17 min, 14% at 21 min, 23% at 27 min, 47% at 37 min, 85% at 39 min, 100% at 40 min, 100% at 48 min | DAD | [148] |
| Grapes (V. vinifera) | dp, cy, pt, pn, mv glycosides & acylglycosides | C18 Krornasil 100. | 250×4.0 | 4 | water-formic acid (90:10) | acn-water-formic acid (45:45:10) | 25% to 35% over 15 min, 50% at 20 min, 55% at 25 min, 65% at 40 min, 25% at 45 min | DAD | [149] |
| Grapes (V. vinifera) | dp, cy, pt, pn, pg, mv glycosides & acylglycosides | Waters Symmetry C18 | 75×4.6 | 3.5 | water-formic acid (90: 10) | acn | 0% to 20% over 13 min, 30% at 20 min, 0% at 25 min | DAD, ESI-MS, MS-MS | [135] |
| Grapes (V. vinifera) | dp, pt, mv glycosides | Synergi Hydro-RP 80 A | 150×2.1 | 4 | water-formic acid (95:5) | acn-water-formic acid (80:15:5) | 10% to 35% over 35 min, 60% at 60 min, 60% at 61 min | DAD, ESI-MS | [150] |
| Grapes (V. vinifera) | pn, cy, mv, pt, dp glycosides and acylglycosides | LiChroCart Superspher 100RP-18 | 250×4.0 | 5 | water-formic acid (95:5) | methanol | 2% to 32% over 30 min, 40% at 40 min, 95% at 50 min, 95% at 55 min | DAD, ESI-MS, MS-MS | [151,152] |
| Huckleberry (Vaccinium membranaceum & V. ovatum) | dp, cy, pt, pn glycosides | Phenomenex Prodigy ODS (3) | 250×4.6 | 5 | water-acetic acid-phosphoric acid (89:10:1) | acn | 2% to 20% over 25 min, 40% at 30 min | DAD | [153] |
| Huckleberry (V. membranaceum & V ovatum) | dp, cy, pt, pn glycosides | Synergi Hydro-RP 80 A | 250×2 | 4 | water-formic acid (95:5) | acn-water-formic acid (80:15:5) | 10% to 30% over 30 min, | DAD, ESI-MS | [153] |
| Isla oca tubers (Oxalis tuberosa) | dp, pt, pn, mv mono & diglycosides | Phenomenex AQUA RP-C18 | 150×4.6 | 5 | 0.1%TFA in water | acn | 10% for 5 min, 15 % at 20 min, 15% at 25 min, 18% at 30 min, 35% at 50 min | DAD, ESI-MS | [154] |
| Kidney bean (Phaseolus vulgaris) | cy, dp, pt, pg mono & diglycosides | Supelco TSK gel ODS-120T | 150×4.6 | 5 | water-formic acid (95:5) | acn-formic acid (95:5) | 1-% to 18% over 10 min, 28% at 18 min, 40% at 19 min, 40% at 21 min, 10% at 23 min, 10% at 25 min | DAD, ESI-MS | [155] |
| Mashua tubers (Tropaeolum tuberosum) | dp, cy, pg mono & diglycosides | Waters Atlantis C18 | 150×4.6 | 5 | water-phosphoric acid (100:.85) | water-acn-acetic acid-phosphoric acid (50.3:49.1:.4:.2) | 20% to 38% over 13 min, 40% at 14 min, 50% at 25 min | DAD | [43] |
| Mashua tubers (T. tuberosum) | dp, cy, pg mono & diglycosides | Waters Symmetry C18 | 75×4.6 | 3.5 | water-formic acid (90:10) | acn | 5% to 15% over 20 min | DAD, ESI-MS, MS-MS | [43] |
| Myrtle liqueur berry (Myrtus communis) | dp, cy, pt, pn, mv glycosides | Waters u-Bondapack C18 | 300×7.8 | 10 | 0.1%TFA in water | 0.1% TFA in acn | 20% to 33% over 18 min, 40% at 30 min, 40% at 40 min | DAD, ESI-MS, MS-MS | [156] |
| Pinta boca tubers (Solanum stenotomum) | pt, pn, mv, dp acylglycosides | Phenomenex AQUA RP-C18 | 150×4.6 | 5 | 0.1%TFA in water | acn | 10% for 5 min, 15% at 20 min, 15% at 25 min, 18% at 30 min, 35% at 50 min | DAD, ESI-MS | [157] |
| Port wine (Vitis vinifera) | mv glycosides | Merck RP-C18 | 250×4.6 | 5 | water-formic acid (95:5) | acn | 10 to 65% for 50 min | DAD | [158, 159] |
| Port wine (V. vinifera) | mv glycosides | Phenomenex AQUA RP-C18 | 150×4.6 | 5 | 0.1%TFA in water | acn | 10% for 5 min, 15% at 20 min, 15% at 25 min, 18% at 30 min, 35% at 50 min | ESI-MS, MS-MS | [158, 159] |
| Port wine (V. vinifera) | mv glycosides | Phenomenex AQUA RP-C18 | 150×4.6 | 5 | 0.1%TFA in water | acn | 10% for 5 min, 15 % at 20 min, 15 % at 25 min, 18% at 30 min, 35% at 50 min | DAD, ESI-MS | [160] |
| Potato plants (S. tuberosum cv. Desiree) | pg, pt acylglycosides | Superspher 100 RP | 250×4.0 | 5 | water-formic acid (90:10) | acn-formic acid (90:10) | 10% for 2 min, 30% at 25 min, 70% at 27 min | UV | [161] |
| Potato plants (S. tuberosum cv. Desiree) | pg, pt acylglycosides | Superspher 100 RP | 250×4.0 | 5 | water-acn-formic acid (95:4.5:.5) | acn-water-formic acid (95:4.5:35) | 0% to 100% over 15 min, 100% at 25 min | UV | [161] |
| Purple corn cob (Zea mays cv. Morado) | cy, pg, pn glycosides & acylglycosides | Phenomenex AQUA RP-C18 | 150×4.6 | 5 | 0.1%TFA in water | acn | 10% for 5 min, 15% at 20 min, 15% at 25 min, 18% at 30 min, 35% at 50 min | DAD, ESI-MS, MS-MS | [162] |
| Red onion (Allium cepa) | cy glycosides | ODS Hypersil | 250×3.0 | 5. | water-formic acid (90:10) | water-methanol-formic acid (40:50:10) | 10% to 100% over 17 min, 100% at 23 min, 10% at 24 min | DAD, ESI-MS | [163] |
| Red onion (A. cepa) | cy glycosides | ODS Hypersil | 250×4.0 | 5 | water-formic acid (95:5) | methanol-water-formic acid (50:40:10) | 10% to 100% over 23 min, 100% at 28 min, 10% at 29 min | DAD | [164] |
| Red wine (Visit vinifera) | dp, cy, pt, pn, mv glycosides & acylglycosides | Discovery RP-Amide C16 | 150×4.6 | 5 | 1% formic acid in water | acn | 5% to 15% over 2 min, 15% at 10 min, 20% at 25 min, 25% at 35 min, 30% at 44 min, 40% at 49 min, 50% at 54 min, 60% at 60 min | DAD, MS | [165] |
| Red wine (V. vinifera) | dp, cy, pt, pn, mv glycosides & acylglycosides | Superspher 100 RP | 250×4.6 | 18.5 | water-formic acid (90:10) | methanol-water-formic acid (45:45:10) | 35 to 95% in 20 min, 100% at 25 min, 100% at 30 min | UV, APCI-MS | [166] |
| Red wine (V. vinifera) | dp, cy, pt, pn, mv glycosides & acylglycosides | Phenomenex Luna C18 | 250×4.6 | 5 | water-formic acid (92.5:7.5) | acn-formic acid (92.5:7.5) | 3%for 1 min, 15% at 12 min, 25% at 24 min, 30% at 28 min, 30% at 32 min | DAD | [130] |
| Red wine (V. vinifera) | dp, cy, pt, pn, mv glycosides & acylglycosides | Phenomenex Luna C18 | 250×2.0 | 3 | water-formic acid (92.5:7.5) | acn-formic acid (92.5:7.5) | 3% for 1 min, 15% at 12 min, 25% at 24 min, 30% at 28 min, 30% at 32 min | ESI-MS | [130] |
| Red wine (V. vinifera) | dp, cy, pt, pn, mv glycosides & acylglycosides | Phenomenex Luna C18 | 150×2.0 | 5 | water-acn (95:5) with 0.1% TFA | water-acn (10:90) with 0.1% TFA | 2% for 2 min, 10% at 8 min, 13% at 30 min, 20% at 50 min, 30% at 75 min | DAD, ESI-MS, MS-MS | [167] |
| Red wine (V. vinifera) | dp, cy, pt, pn, mv glycosides & acylglycosides | Waters Symmetry C18 | 150×1.0 | 3.5 | water-formic acid (90:10) | water-formic acid-acn (40:10:50) | 12% for 2 min, 50% at 20 min, 90% at 25 min | UV, ESI-MS | [168] |
| Red wine (V. vinifera) | dp, cy, pt, pn, mv glycosides & acylglycosides | Supelco Discovery Biopeptide C18 | 100×.32 | 3 | water-formic acid (90: 10) | water-formic acid-acn (40:10:50) | 2% for 4. min, 12% at 6 min, 50% at 20 min, 90% at 25 min | UV, ESI-MS | [168] |
| Red wine (V. vinifera) | dp, cy, pt, pn, mv glycosides & acylglycosides | Lichrospher 100-RP18 | 250×4.0 | 5 | 9mM aqueous o-phosphoric acid | water-acn (75:25) with 9mM o-phosphoric acid | 0% for 20 min, 100% at 120 min, 100% at 140 min | DAD | [85, 169] |
| Red wine (V. vinifera) | mv glycosides | Macherey-Nagel NucleosilC18 | 125×4.0 | 3 | water-formic acid (98:2) | acn-water-formic acid (80: 18:2) | 15% to 75% over 15 min, 100% at 20 min | DAD | [170] |
| Red wine (V. vinifera) | mv glycosides | Lichrospher 100-RP18 | 250×2.0 | 5 | water-formic acid (98:2) | acn-water-formic acid (80:18:2) | 10% for 4 min, 15% at 15 min, 50% at 40 min, 100% at 45 min | ESI-MS | [170] |
| Red wine (V. vinifera) | thiolysed mv glycosides | Superspher 100 RP | 125×2.0 | 3 | water-formic acid (98:2) | acn-water-formic acid (80:18:2) | 10% to 50% over 17 min, 60% at 20 min, 100% at 22 min | ESI-MS | [170] |
| Red wine and grape skins (V vinifera) | dp, cy, pt, pn, mv glycosides & acylglycosides | Spherisorb ODS2 | 150×4.6 | 5 | water-formic acid (90: 10) | methanol-water- formic acid (45:45:10) | 35% to 95% over 20 min, 100% at 25 min, 100% at 30 min | DAD, ESI-MS | [171] |
| Rosé and blanc de noir wine (V. vinifera) | mv, pn glycosides | Waters Nova-Pak C18 | 150×3.9 | 4 | water-formic acid (90:10) | water-methanol- formic acid (45:45:10) | 15% to 80% over 30 min, 80% at 43 min | DAD, ESI-MS | [172] |
| Rosé cider (Malus × domestica) | cy glycosides | Inertsil ODS3 | 250×4.6 | 5 | water-formic acid (95:5) | methanol | 15% for 15 min, 38% at 105 min, 50% at 110 min, 50% at 120 in | DAD, ESI-MS | [173] |
| Rose (Rosa chinensis) | cy & pg diglycosides | Nomura ODS-VP C18 | 250×2.0 | 5 | 0.1% formic acid in water | 0.1% formic acid in methanol | 5% for 5 min, 45% at 90 min, 45% at 100 min, 5% at 101 min | DAD, ESI-MS | [86] |
| Rose hip (Rosa canina) | cy glycosides | Supelcosil LC-18-DB | 250×2.1 | 5 | water-formic acid (90:10) | methanol-formic acid (90:10) | 5% for 3 min, 30% at 16 min, 100% at 26 min, 100% at 29 min, 5% at 32 min | DAD, ESI-MS | [174] |
| Strawberry (Fragaria × ananassa) | cy, pg mono, di, & acylglycosides | Phenomenex AQUA RP-C18 | 150×4.6 | 5 | 0.1%TFA in water | acn | 10% for 5 min, 15 % at 20 min, 15 % at 25 min, 18% at 30 min, 35% at 50 min | DAD, ESI-MS | [175] |
| Tart cherry (Prunus cerasus), elderberry (Sambucus nigra), and bilberry (Vaccinium myrtillus) | cy, dp, pt, pn, mv glycosides | HP ODS hypersil | 125×4.0 | 5 | 0.1%TFA in water | water-acn-acetic acid-TFA (50.4:48.5:1:.1) | 20% to 60% over 26 min, 60% at 30 min, 20% at 35 min | DAD, ESI-MS | [34] |
Abbreviations are as follows: cy, cyanidin; dp, delphinidin; pt, petunidin; pn, peonidin: pg, pelargonidin; mv, malvidin. Glycosides consist of any of the following: glucoside, arabinoside, xyloside, rutinoside, sophoroside, sambubioside, or lathyroside. Acylating groups consist of any of the following: acetyl, coumaryl, caffeoyl, malonyl, feruloyl, sinapoyl. or dioxaloyl. Solvent abbreviations are: acn, acetonitrile; TFA, trifluoroacetic acid.
2.3.1. HPLC with UV Detection
The most frequently used detection method for HPLC is UV/Vis spectrophotometry. This is due to the prevalence of spectrophotometric instrumentation in laboratories studying anthocyanin chemistry, both in the industrial and academic sectors. Anthocyanins have a unique absorption maximum at ~520 nm which sets these compounds apart from other flavonoids in the plant extract and simplifies the resulting chromatograms for isolation and purification. An example of an HPLC chromatogram with detection at 520 nm can be seen in Fig. (7). UV/Vis spectrophotometry was not used for identification of anthocyanin compounds until the introduction of diode-array technology, which allowed for the accumulation of UV/Vis spectral data libraries, aiding in peak identification. Diode array detection coupled to HPLC (LC-UV-DAD) performs a complete spectrophotometric scan on each peak as it elutes and provides a unique chromatogram for each anthocyanin compound that can subsequently be compared to other compound spectra and used for identification purposes [119, 121, 124]. Generally, the spectral characteristics of a particular anthocyanin are related to the hydroxylation pattern of the aglycone structure from which it is derived. The anthocyanidin with just one oxygenated position on the B-ring, pelargonidin, gives an absorption maxima at approximately 520 nm while di-oxygenated anthocyanidins, cyanidin and peonidin, give maxima at 535 nm and tri-oxygenated anthocyanidins, delphinidin, petunidin and malvidin, give maxima at 544 run. Glycosidic substitution of the anthocyanins also affects the spectral characteristics specifically in that 3-rnonoglycosides generate a ratio of absorbance at 440 run to absorbance at the wavelength maxima that is twice as large as the 3,5-diglycoside anthocyanins [176, 177]. The various sugars commonly seen in the glycosidic substitution do not seem to have an effect on the observed spectra but do significantly change the retention times of anthocyanins. Finally, acylation of anthocyanins result in a fairly significant increase in the retention time compared to nonacylated anthocyanins [177].
Fig. (7).
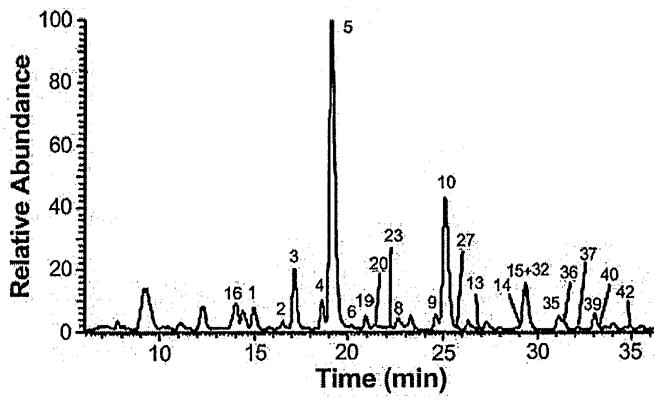
Base peak chromatogram from the HPLC analysis of a South African Pinotage red wine with detection at 520 nm. The separation of anthocyanins is demonstrated and peak identification can be found in the original paper. Modified from de Villiers et al [130] and used with permission from Elsevier Publishers.
2.3.2. HPLC with MS Detection
The technique of coupling HPLC and MS instrumentation has had a significant effect on the quantitative and qualitative analytical methodology of anthocyanins in the last decade. This combination, LC-MS, offers the separation advantages of liquid chromatography combined with the identification advantages of mass spectrometry. MS is a very sensitive method of molecular analysis and due to its separation by mass, good selectivities can be obtained and the identification of individual compounds in a mixture of compounds is permitted [1]. However, as observed with capillary electrophoresis, the physical coupling of these two techniques presents some problems, such as the amount of column effluent that has to be introduced in the MS system, the composition of the eluent, and the type of compounds to be analyzed. The most common interface for LC and MS employs an analytical HPLC which utilizes smaller columns and lower flow rates, therefore, facilitating the coupling of LC to MS instrumentation. The analysis of specific types of compounds requires an appropriate ionization technique for introducing the molecular ions into the instrument and, to date, there is no universal interface that has been constructed. The ionization techniques that are most suitable for anthocyanin chemistry are continuous-flow fast-atom bombardment (CF-FAB), matrix-assisted laser desorption ionization (MALDI), atmospheric pressure chemical ionization (APCI), and electrospray ionization (ESI) [119, 124]. For the first few years after the introduction of LC-MS interface systems, CF-FAB was the most common MS technique used. However, as LC-MS technology developed, some disadvantages with fast atom bombardment were made obvious, specifically the fact that analyses must be preceded by purification and dissolution of the sample in a polar matrix before injection [178]. As observed with CE-MS, ESI is the most common LC-MS interface today because it avoids the problems seen with CF-FAB. ESI is a soft ionization method that produces gaseous ions from highly charged evaporating liquid droplets which makes it appropriate for small plant metabolites such as anthocyanins. Also, ESI has the ability to introduce liquid samples to the MS with minimum manipulation, successfully avoiding the common problems seen with other LC-MS interfaces [179]. Different types of mass analyzers are also available for various LC-MS interfaces such as magnetic sectors, time-of-flight (TOF) analyzers, quadrupole mass filters, quadrupole ion traps, and ion cyclotron resonance. The TOF analyzer is often coupled with MALDI because of the precise time of ionization seen with MALDI. The quadrupole ion trap is the most common type of analyzer for LC-ESI-MS which allows for simplified interpretations of complex mixtures but still includes identification of minor peaks [121].
The application of tandem MS (MS-MS or MSn) can be used to characterize individual compounds in a mixture or to identify the structure of compounds by separate ionization and fragmentation steps. An important mass spectrometer structure elucidation is the triple quadrupole ion trap because it can serve as an exceptionally high specificity detector due to a mass filter capable of transmitting only the ion of choice. There are three quadrupoles in which the first (Q1) and third (Q3) quadrupoles act as mass filters, and the middle (Q2) quadrupole is employed as a collision cell, where the ionization happens [180]. This filtering process works by mass to charge ratios (m/z) and allows for the study of fragments which are crucial in structural elucidation. For example, the Q1 can be set to filter out an ion of a known mass, which is fragmented in Q2, and Q3 can then be set to scan the entire m/z range, giving information on the sizes of the fragments made as well as information on that one specific ion fragment. Thus, the structure of the original ion can be deduced [181]. However, as was mentioned, electrospray ionization has been an efficient ionization technique for LC-MS but is a soft technique and does not tend to produce many fragments, which are essential for MS/MS. Because of this, LC-MS/MS will use two methods of ionization, ESI to introduce a parent ion into the mass spectrometer and then collision-induced dissociation (CID) to enhance the fragmentation of the parent ion [119]. An example of LC-ESI-MS/MS, demonstrating precursor-ion analysis and product-ion analysis by Tian et al. can be seen in Fig. (8) [135].
Fig. (8).
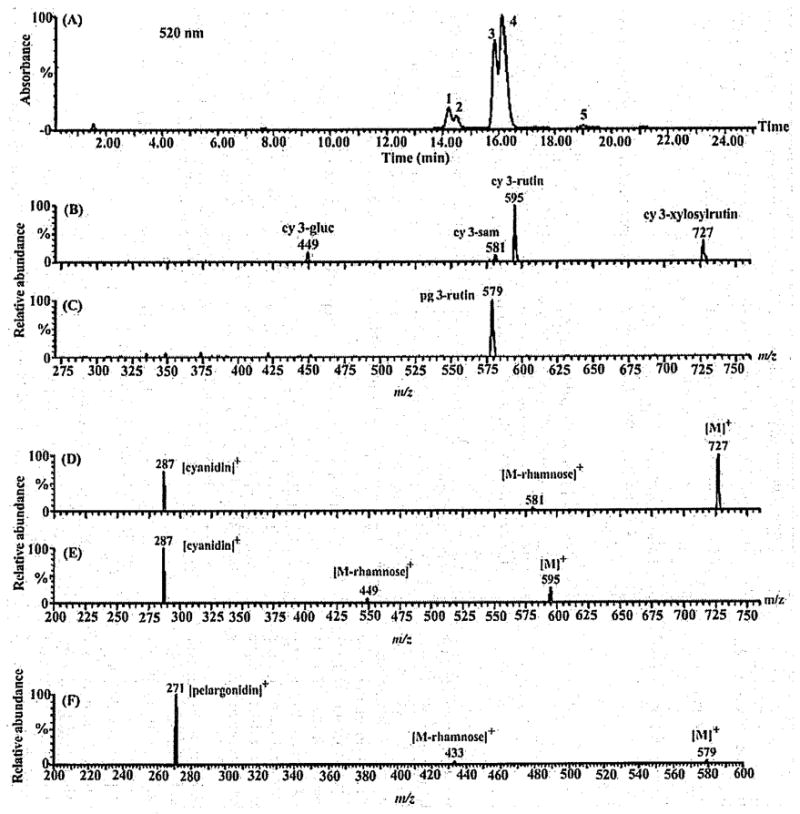
LC-ESI/MS/MS of anthocyanins in black raspberries. (A) HPLC chromatogram of anthocyanins at 520 nm. Peak labels: (1) cyanidin 3-glucoside (cy 3-gluc); (2) cyanidin 3-sambubioside (cy 3-sam); (3) cyanidin 3-(2-xylosylrutinoside) (cy 3-xylosylrutin); (4) cyanidin 3-rutinoside (cy 3-rutin); and (5) pelargonidin 3-rutinoside (pg 3-rutin). Precursor-ion analysis of (B) m/z 287 (cyanidin) and (C) m/z 271 (pelargonidin). Product-ion analysis of (D) cy 3-xylosylrutin (m/z 727); (E) cy 3-rutin (m/z 595); and (F) pg 3-rutin (m/z 579). Modified from Tian et al. [135] and used with permission from Elsevier Publishers.
2.3.3. HPLC with NMR Detection
While LC-UV-MS and LC-MS-MS are very powerful analytical methods for anthocyanins, the use of NMR detection combined with HPLC separation (LC-NMR) surpasses the previous methodologies in structural elucidation of unknown compounds in crude plant extracts. When it was first introduced, LC-NMR struggled due to a lack of sensitivity, but with progress in solvent suppression, pulse field gradients, probe technology, and high-field magnets this technique has only grown in popularity. The physical interfacing of these two instruments was not difficult, but observing the analyte response in the presence of nondeuterated solvents caused serious problems until the development of solvent suppression techniques [118]. Also, the precise separation procedures with HPLC often employ gradient solvent systems, which cause the resonances to change frequency during analysis in the gradient mode but with increased pulse field gradient technologies, this problem has also been alleviated [119].
At the current time, LC-NMR methodology is mostly limited to 1H NMR spectra or, under certain conditions, 13C NMR spectra, but only when the peak concentration of interest is high and inverse detection experiments are acceptable. Due to the low natural abundance of 13C isotope, the sensitivity for direct measurement of 13C-NMR using LC-NMR instrumentation has not yet been developed. When measuring the 1H spectra of the main constituents of a crude extract, this can be done in what is called on-flow mode. The on-flow operation requires a fairly high concentration of the crude plant extract (at least 1 mg injection) and the spectra are acquired continuously during the separation; what is observed with on-flow operation is a 2-D NMR spectrum with a low sensitivity. For more precise measurements or 2-D correlation experiments, the LC-NMR can be operated in the stopped-flow mode which halts the flow of solvent, for a short amount of time, when the required peak reaches the NMR flow cell. In this mode, various 2-D experiments can be performed such as COSY, NOESY, HSQC, and HMBC, because stopping the mobile phase flow allows for a large number of scans (or transients) to be taken for a given LC peak [118,119].
2.4. Sample Preparation
As with the isolation and quantification methodologies, there are a numerous methods for preparing samples for analysis and the selection of the most appropriate method depends on the sample being analyzed and individual results desired. Generally speaking, liquid anthocyanin-containing samples such as juices, syrups, wines, and biological fluids require very little preparation before analysis; but regardless of the selected preparation, it must be done under cold conditions, due to the susceptibility of anthocyanins to degradation at high temperatures [55–58]. The majority of references analyzing red wine samples have progressed to simply filtering the samples through a 0.45 μm filter before injection or even just a direct injection method for anthocyanin analysis [85, 130, 167–169]. When testing anthocyanins in biological fluids, such as urine or plasma, the samples are generally acidified, to maintain the anthocyanin in its flavylium form, filtered and injected into the LC [31, 114, 135]. Solid anthocyanin containing samples, however, require the samples to be homogenized before a representative sample can be extracted. For seeds or dried plant materials, the samples must first be crushed using a mortar and pestle or ground using a coffee grinder, depending on the specific sample. Once the samples have been powdered and mixed, a representative aliquot can easily be removed for a smaller scale extraction [121]. Berry samples are different in that when they are fresh, they need to be crushed and filtered, in order to isolate and dry the solid residue which subsequently undergoes extraction [175]. Berries can also be individually frozen, stored for a short amount of time, and ground in liquid nitrogen allowing for large amounts of berries to be ground together and completely mixed before a representative subsample is removed [182].
Once the plant tissues have been prepared, the next step involves solid-phase extraction (SPE) or liquid-liquid extraction (LLE). Whichever method is preferred, it must allow for recovery of the anthocyanins avoiding any chemical modification. Anthocyanins are soluble in polar solvents, due to the hydroxyls and sugars attached, and are therefore commonly extracted with methanol or ethanol. Because of the instability of the compounds, extractions are performed under cold conditions, not higher than 30°C, and with small amounts of acid to give an environment of pH 2.0 or below. The most common acids used for extraction are hydrochloric (HCl) or formic acid; however, the use of these acids can cause hydrolysis of acylating groups in certain anthocyanins [1, 121, 124]. Because of this, acylated anthocyanins should be extracted with solvent containing HCl below a concentration of 0.12 mol/L or containing organic acids (e.g., acetic or formic acid) [183]. When extracting malonated anthocyanins, extractions are proceeded with weak acids, such as tartaric or citric acid, to avoid hydrolysis of the dicarboxylic acid [79]. Acetone is also used for LLE with efficient and more reproducible results than using methanol or ethanol. This technique works well because solvent concentration can be done at the lower temperatures needed for anthocyanins and also avoids problems with pectins that are observed with the other LLE techniques. The pectins that are found in the walls of some anthocyanin containing berries can cause problems when in the acidic extraction environments, forming a turbid extract that slows the procedure; however, acetone contains pectin-clotting properties and rapidly produces a clean anthocyanin extract [184, 185]. For solid-phase extraction, popular methods utilize C18 cartridges or Sephadex LH-20 for the initial separation of the anthocyanin extracts from the crude plant sample. The polar anthocyanins bind to these adsorbants through unsubstituted hydroxyl groups and are separated from other plant compounds using solvents of increasing polarity. Investigations have shown SPE to be a fast and highly efficient method for the separation of crude anthocyanin solutions from plant material [1, 124, 186]. With the collection of the anthocyanin extract, the next step is to remove the solvent to a known amount and continue with the analysis. Samples which need to be stored are generally stored as dried samples, with the solvent rotovapped and lyophilized, in cold, dark environments to avoid decomposition of the anthocyanins.
2.5. Phytochemical Investigation Procedures
After the anthocyanin extract has been separated from the plant tissue, the extracts are evaluated to determine whether additional preparation is needed before the purification and quantification methods. Generally, because the results of SPE or LLE give crude anthocyanin extracts, additional separation methods are utilized to purify the sample before analysis. The appropriate techniques for a preliminary separation include large-scale chromatographic techniques, such as normal-phase column chromatography, countercurrent chromatography and preparative-HPLC and these methods would be monitored with the previously mentioned TLC to ensure minimum loss of the desire product. These steps are routinely employed when working with a comprehensive phytochemical investigation of anthocyanin-containing plant tissues.
2.5.1. Normal-Phase Column Chromatographic Separations
The first of these techniques, column chromatography, originally grew in popularity because of the need to obtain pure anthocyanin compounds in sufficient quantities for subsequent identification and characterization as well as to be used as reference substances in qualitative and quantitative analyses. An effective column chromatography technique capable of separating the impure anthocyanin derivatization and degradation products that are inevitably present in crude plant extracts, as well as resolving the naturally found mixture of different anthocyanins was needed [118]. Liu et al, [187] investigated six adsorbant resins, each a cross-linked polystyrene copolymer, and X-5 was found to be the most efficient adsorbant of the anthocyanin as a nonpolar resin with relatively high surface area (500–600 m2/g) and pore radius (290–300 Å). The tested resins were loaded with centrifuged mulberry juice and washed with distilled H2O until clear, which effectively removed the sugars, acids, and other water-soluble compounds. The adsorbed anthocyanins were then eluted with acidic ethanol (0.5% hydrochloric acid v/v) until the resins was clean [187]. The concentrated anthocyanins were quantified using the pH differential method with the total content calculated as cyanidin-3-glucoside which, even though mulberry anthocyanins consist of cyanidin-3-glucoside and cyanidin-3-rutinoside, gives acceptable calculations [188]. A more popular adsorbent resin is Amberlite XAD-7, an acrylic ester of intermediate polarity, ~450 m2/g surface area and ~90 Å pore diameter. Similar to Liu’s experiment with macroporous resins, an Amberlite XAD-7 column was loaded with the crude plant extract and washed with distilled H2O to remove sugars, acids, and other by products after which the anthocyanin compounds are eluted with acidic methanol (0.3–1.0 % trifluoroacetic acid v/v) [189, 190]. Following this initial separation of the anthocyanin fractions by macroporous resins, the anthocyanins are often further purified using size exclusion chromatography with Sephadex LH-20 or Toyopearl HW-40 and acidic methanol elution or silica gel preparative TLC [189–191].
2.5.2. Countercurrent Chromatographic Separations
Countercurrent chromatography (CCC), in contrast to chromatography with a solid phase, is an all liquid chromatographic technique that operates under gentle conditions and allows non-destructive isolation of the anthocyanin compounds. Due to the absence of any solid stationary phase, adsorption losses are minimized and a 100% sample recovery is assured. CCC is an automated version of liquid-liquid extraction, comparable to the repeated partitioning of an analyte between two immiscible pases by vigorous mixing in a separatory funnel. The latest technique, high-speed CCC (HSCCC) or multilayer coil CCC (MLCCC), creates separation by wrapping an inert Teflon tubing around a holder in multiple layers and the coil is subsequently rotated in a planetary fashion; that is, it rotates at ~900 rpm around its own ‘planetary’ axis and simultaneously around a parallel ‘solar’ axis [192].
High-speed countercurrent chromatography requires the use of two immiscible solvents, generally an organic and an aqueous phase, one to serve as the stationary phase and the other as the mobile phase. Throughout the utilization of CCC, a common multisolvent system composed of tert-butyl methyl ether (TBME)/n-butanol/acetonitrile/water acidified with 0.1% (v/v) trifluoroacetic acid (TFA) has been proven to be efficient regarding anthocyanin fractionation from a number of different plant sources [87, 193]. A similar solvent system containing less TFA (0.01% instead of 0.1% v/v) can be used with malonylated anthocyanins to avoid degradation of these more labile compounds compared to other acylated anthocyanins [192]. Winterhalter et al. [194] effectively separated the different classes of anthocyanins in wine by using multiple solvent systems of different polarities. This large-scale separation technique retained the solvent system involving TBME/n-butanol/acetonitrile/water acidified with 0.1% TFA (2:2:1:5) for the glucosidic anthocyanins, ethyl acetate/water (1:1) plus 0.1% TFA for the coumaroyl- and caffeoyl-glucosides and ethyl acetate/n-butanol/water (4:1:5) plus 0.1% TFA for the acetyl-glucosides [194]. Furthermore, a step gradient system was designed to efficiently separate anthocyanin compounds of red wine marc and grape skins by varying the polarity of the mobile phase, which is the organic phase in this case. This protocol, meant to simplify the process, involves changing the ratio of an auxiliary solvent, the acetonitrile concentration, while maintaining the immiscibility of the partitioning solvents. A three step gradient was selected to shorten the chromatographic process while keeping the level of resolution seen with an isocratic elution and consists of the following: TBME/n-butanol/acetonitrile/water acidified with 0.02% TFA (2:2:x:5), with x = 0.1, 1.2, and 1.8 parts [195]. As described, the step gradient method used the aqueous phase as the stationary phase, due to better phase retention, resulting in a tail to head elution pattern while the previous multisolvent systems all employed the lighter, organic phase as the stationary phase leading to a head to tail elution mode [87, 192–196]. The complication most often seen with counter-current chromatography is difficulty keeping the stationary phase in its stationary position, whether it is aqueous or organic; because of this, stationary chromatographic techniques are still the most popular and reported separation methods for anthocyanins.
2.5.3. Preparative-HPLC Separations
HPLC, as discussed, is a popular method for the analysis of anthocyanin compounds; however, when preparative separations are necessary before the analyses, preparative-HPLC (prep-HPLC) can be used to clean up gram-scale quantities of plant extracts. Because of the larger column size and higher flow rate allowed with prep-HPLC, it is easy to inject as much as 100–200 mg and clean out the crude plant extracts. The columns that are used can be the same packing material, but a larger dimension, as is used for the analytical HPLC methods and the same mobile phases with an isocratic or simple gradient system. TLC is used to monitor the collected fractions and the similar TLC plates will correspond to the fractions that can be combined, concentrated, and used to continue on with the isolation techniques [119].
3. CONCLUSIONS
Plant anthocyanins play an important role in the biology of the plant, and more recently have been shown to have increasingly important applications in human health and nutrition. From their biological activity, such as antioxidant, anti-inflammatory, antiatherosclerotic, and anticancer properties, to their use as a natural pigment of processed foods, the interest in anthocyanins continues to grow. This class of compounds is found in hundreds of different plant tissues at very wide ranges of concentration (Table 2). In this review, various chromatographic separations and their derived analytical techniques to identify and quantitate natural anthocyanins have been described in detail. The progression of anthocyanin separation techniques started with traditional paper chromatography and thin-layer chromatography, and has grown with advances in analytical instrumentations to HPLC and CE combined with a variety of UV, MS, or NMR detectors. The range of investigated approaches spans normal-phase column chromatography and CCC for separation and preparation of large scale quantities to CE and HPLC for analytical identification and quantification of complex mixtures. Though some may be more common than others, each of these analyses has an appropriate function and capacity for execution in the analysis of anthocyanin-containing plant tissues. The analytical methodologies described here represent the current and foremost methodologies for the complete analyses of anthocyanins. As improved technologies continue to advance, so will our abilities for greater resolution at lower concentrations. This review also detailed the importance in the preanalytical phase of plant and sample preparation relative to maintaining the integrity of the natural anthocyanins. We illustrated the type of chemical changes that may occur during the processing and analysis of samples which could result in the identification of polyphenols that are artifacts of the extraction and analytical methods employed. Anthocyanins represent an increasingly examined class of compounds from their role in plant biology to their use and impact in health and nutrition. As a consequence, chemistry and analysis are the foundation upon which all other studies involving these compounds rely whether in biochemistry, chemistry, genetics, nutrition, foods, or pharmacognosy.
Acknowledgments
This work was supported by the National Botanical Center for Age-Related Diseases, NIH grant OD-00-004; and by the Partnership in Food Industry Development for Natural Products, USAID Award No. AEG-A-00-04-00012-00.
References
- 1.Kong JM, Chia LS, Goh NK, Chia TF, Brouillard R. Phytochemistry. 2003;64:923. doi: 10.1016/s0031-9422(03)00438-2. [DOI] [PubMed] [Google Scholar]
- 2.Manach C, Scalbert A, Morand C, Rémésy C, Jiménez L. Am J Clin Nutr. 2004;79:727. doi: 10.1093/ajcn/79.5.727. [DOI] [PubMed] [Google Scholar]
- 3.Kondratyuk TP, Pezzuto JM. Pharm Biol. 2004;42S:46. [Google Scholar]
- 4.Siemann EH, Creasy LL. Am J Enol Viti. 1992;43:49. [Google Scholar]
- 5.Gehm BD, McAndrew JM, Chien PY, Jameson JL. Proc Natl Acad Sci USA. 1997;9:14138. doi: 10.1073/pnas.94.25.14138. [DOI] [PMC free article] [PubMed] [Google Scholar]
- 6.Stewart JR, Ward NE, Ioannides CG, O’Brian CA. Biochemistry. 1999;38:13244. doi: 10.1021/bi990875u. [DOI] [PubMed] [Google Scholar]
- 7.Kitts DD, Yuan YV, Wijewickreme AN, Thompson LU. Mol Cell Biochem. 1999;202:91. doi: 10.1023/a:1007022329660. [DOI] [PubMed] [Google Scholar]
- 8.Williams CA, Grayer RJ. Nat Prod Rep. 2004;21:539. doi: 10.1039/b311404j. [DOI] [PubMed] [Google Scholar]
- 9.Beecher GR. J Nutr. 2003;133:3248S. doi: 10.1093/jn/133.10.3248S. [DOI] [PubMed] [Google Scholar]
- 10.Harborne JB, Williams CA. Phytochemistry. 2000;55:481. doi: 10.1016/s0031-9422(00)00235-1. [DOI] [PubMed] [Google Scholar]
- 11.Santos-Buelga C, Scalbert A. J Sci Food Agric. 2000;80:1094. [Google Scholar]
- 12.Manach C, Morand C, Gil-Izquierdo A, Bouteloup-Demange C, Remesy C. Eur J Clin Nutr. 2003;57:235. doi: 10.1038/sj.ejcn.1601547. [DOI] [PubMed] [Google Scholar]
- 13.Cos P, De Bruyne T, Apers S, Vanden Berghe D, Pieters L, Vlietinck AJ. Planta Med. 2003:69. doi: 10.1055/s-2003-41122. [DOI] [PubMed] [Google Scholar]
- 14.Iwashina T. J Plant Res. 2000;113:287. [Google Scholar]
- 15.Delgado-Vargas F, Jimenez AR, Paredes-Lopez O. Crit Rev Food Sci Nutr. 2000;40:173. doi: 10.1080/10408690091189257. [DOI] [PubMed] [Google Scholar]
- 16.Wrolstad RE. J Food Sci. 2004;69:C419. [Google Scholar]
- 17.Fossen T, Slimestad R, Ovstedal DO, Andersen OM. Biochem Syst Ecol. 2002;30:855. [Google Scholar]
- 18.Mazza G, Miniati E. Anthocyanins in fruits, vegetables and grains. CRC Press, Ino; Boca Raton, FL: 1993. [Google Scholar]
- 19.Markham KR, Gould KS, Winefield CS, Mitchell KA, Bloor SJ, Boase MR. Phytochemistry. 2000;55:327. doi: 10.1016/s0031-9422(00)00246-6. [DOI] [PubMed] [Google Scholar]
- 20.Brouillard R. In: The flavonoids, advances in research since 1980. Harborne JB, editor. Chapman and Hall; London: 1998. p. 525. [Google Scholar]
- 21.Torskangerpoll K, Andersen OM. Food Chem. 2005;89:427. [Google Scholar]
- 22.Ahmed J, Shivhare US, Raghavan GSV. Eur Food Res Tech. 2004;218:525. [Google Scholar]
- 23.Prior RL, Lazarus SA, Cao G, Muccitelli H, Hammerstone JF. J Agric Food Chem. 2001;49:1270. doi: 10.1021/jf001211q. [DOI] [PubMed] [Google Scholar]
- 24.Zheng W, Wang SY. J Agric Food Chem. 2003;51:502. doi: 10.1021/jf020728u. [DOI] [PubMed] [Google Scholar]
- 25.Kahkonen MP, Heinamaki J, Ollilainen V, Heinonen M. J Sci Food Agric. 2003;83:1403. [Google Scholar]
- 26.Wu X, Gu L, Prior RL, McKay S. J Agric Food Chem. 2004;52:7846. doi: 10.1021/jf0486850. [DOI] [PubMed] [Google Scholar]
- 27.Dawidowicz AL, Wianowski D, Baraniak B. LWT - Food Sci Tech. 2006;39:308. [Google Scholar]
- 28.Mazza G, Fukumoto L, Delaquis P, Girard B, Ewert B. J Agric Food Chem. 1999;47:4009. doi: 10.1021/jf990449f. [DOI] [PubMed] [Google Scholar]
- 29.Ortega-Regules A, Romero-Cascales I, Lopez-Roca JM, Ros-Garcia JM, Gomez-Plaza E. J Sci Food Agric. 2006;86:1460. [Google Scholar]
- 30.Gao L, Mazza G. J Food Sci. 1994;59:1057. [Google Scholar]
- 31.Ichiyanagi T, Hatano Y, Matsugo S, Konishi T. Chem Pharm Bull. 2004;52:628. doi: 10.1248/cpb.52.628. [DOI] [PubMed] [Google Scholar]
- 32.Blando F, Gerardi C, Nicoletti I. J Biomed Biotech. 2004;5:253. doi: 10.1155/S1110724304404136. [DOI] [PMC free article] [PubMed] [Google Scholar]
- 33.Simunic V, Kovac S, Gaso-Sokac D, Pfannhauser W, Murkovic M. Eur Food Res Tech. 2005;220:575. [Google Scholar]
- 34.Chandra A, Rana J, Li Y. J Agric Food Chem. 2001;49:3515. doi: 10.1021/jf010389p. [DOI] [PubMed] [Google Scholar]
- 35.Chaovanalikit A, Wrolstad RE. J Food Sci. 2004;69:FCT73. [Google Scholar]
- 36.Kim DO, Heo HJ, Kim YJ, Yang HS, Lee CY. J Agric Food Chem. 2005;53:9921. doi: 10.1021/jf0518599. [DOI] [PubMed] [Google Scholar]
- 37.Gao L, Mazza G. J Agric Food Chem. 1995;43:343. [Google Scholar]
- 38.Torre LC, Barritt BH. J Food Sci. 1977;42:488. [Google Scholar]
- 39.Wada L, Ou B. J Agric Food Chem. 2002;50:3495. doi: 10.1021/jf011405l. [DOI] [PubMed] [Google Scholar]
- 40.Longo L, Vasapollo G. Food Chem. 2006;94:226. [Google Scholar]
- 41.Phippen WB, Simon JE. J Agric Food Chem. 1998;46:1734. [Google Scholar]
- 42.Lewis CE, Walker JRL, Lancaster JE, Sutton KH. J Sci Food Agric. 1998;77:45. [Google Scholar]
- 43.Chirinos R, Campos D, Betalleluz I, Giusti MM, Schwartz SJ, Tian Q, Pedreschi R, Larondelle Y. J Agric Food Chem. 2006;54:7089. doi: 10.1021/jf0614140. [DOI] [PubMed] [Google Scholar]
- 44.Kammerer D, Carle R, Schieber A. Eur Food Res Tech. 2004;219:479. [Google Scholar]
- 45.Nielsen AH, Olsen CE, Moller BL. Phytochemistry. 2005;66:2829. doi: 10.1016/j.phytochem.2005.09.041. [DOI] [PubMed] [Google Scholar]
- 46.Byamukama R, Jordheim M, Kiremire B, Namukobe J, Andersen OM. Sci Hort. 2006;109:262. [Google Scholar]
- 47.de Ancos B, Gonzalez E, Cano MP. Z Leb Unt Forsch A. 1999;208:33. [Google Scholar]
- 48.Fan-Chiang HJ, Wrolstad RE. J Food Sci. 2005;70:c198. [Google Scholar]
- 49.Tomás-Barberán FA, Gil MI, Cremin P, Waterhouse AL, Hess-Pierce B, Kader AA. J Agric Food Chem. 2001;49:4748. doi: 10.1021/jf0104681. [DOI] [PubMed] [Google Scholar]
- 50.Deineka VI, Deineka LA, Sirotin AA. Chem Nat Cpds. 2005;41:230. [Google Scholar]
- 51.Longo L, Vasapollo G. J Agric Food Chem. 2005;53:8063. doi: 10.1021/jf051400e. [DOI] [PubMed] [Google Scholar]
- 52.Cabrita L, Fossen T, Andersen OM. Food Chem. 2000;68:101. [Google Scholar]
- 53.Borkowski T, Szymusiak H, Gliszczynska-Swiglo A, Tyrakowska B. Food Res Int. 2005;38:1031. [Google Scholar]
- 54.Fossen T, Cabrita L, Andersen OM. Food Chem. 1998;63:435. [Google Scholar]
- 55.Abdel-Aal ESM, Hucl P. J Agric Food Chem. 2003;51:2174. doi: 10.1021/jf021043x. [DOI] [PubMed] [Google Scholar]
- 56.Connor AM, Luby JJ, Hancock JF, Berkheimer S, Hanson EJ. J Agric Food Chem. 2002;50:893. doi: 10.1021/jf011212y. [DOI] [PubMed] [Google Scholar]
- 57.Kiroa A, Ozkan M, Cemeroglu B. Food Chem. 2007;101:212. [Google Scholar]
- 58.Reyes LF, Cisneros-Zevallos L. Food Chem. 2007;100:885. doi: 10.1021/jf0635661. [DOI] [PubMed] [Google Scholar]
- 59.Goodman LP, Markakis P. J Food Sci. 1965;30:135. [Google Scholar]
- 60.McBean DM, Johnson AA, Pitt JI. J Food Sci. 1964;29:257. [Google Scholar]
- 61.Oliveira J, Fernandes V, Miranda C, Santos-Buelga C, Silva A, de Freitas V, Mateus N. J Agric Food Chem. 2006;54:6894. doi: 10.1021/jf061085b. [DOI] [PubMed] [Google Scholar]
- 62.Kader F, Haluk JP, Nicolas JP, Metche M. J Agric Food Chem. 1998;46:3060. doi: 10.1021/jf981400x. [DOI] [PubMed] [Google Scholar]
- 63.Kader F, Irmouli M, Nicolas JP, Metche M. Food Chem. 2001;75:139. doi: 10.1021/jf981400x. [DOI] [PubMed] [Google Scholar]
- 64.Kader F, Irmouli M, Nicolas JP, Metche M. J Food Sci. 2002;67:910. doi: 10.1021/jf981400x. [DOI] [PubMed] [Google Scholar]
- 65.Kader F, Irmouli M, Zitouni N, Nicolas JP, Metche M. J Agric Food Chem. 1999;47:4625. doi: 10.1021/jf981400x. [DOI] [PubMed] [Google Scholar]
- 66.Wesche-Ebeling P, Montgomery MW. J Food Sci. 1990;55:731. [Google Scholar]
- 67.Garoia-Viguera C, Bridle P. Food Chemistry. 1999;64:21. [Google Scholar]
- 68.Mazza G, Brouillard R. Phytochemistry. 1990;29:1097. [Google Scholar]
- 69.Brouillard R, Mazza G, Saad Z, Albreoht-Gary AM, Cheminat A. J Am Chem Soc. 1989;111:2604. [Google Scholar]
- 70.Mistry TV, Cai Y, Lilley TH, Haslam E. J Chem Soc Perkin Trans 2. 1991;8:1287. [Google Scholar]
- 71.Gomez-Miguez M, Gonzalez-Manzano S, Escribano-Bailon MT, Heredia FJ, Santos-Buelga C. J Agric Food Chem. 2006;54:5422. doi: 10.1021/jf0604586. [DOI] [PubMed] [Google Scholar]
- 72.Ellestad GA. Chirality. 2006;18:134. doi: 10.1002/chir.20228. [DOI] [PubMed] [Google Scholar]
- 73.Takeda K. Proc Jap Acad Ser B. 2006;82:142. doi: 10.2183/pjab.82.142. [DOI] [PMC free article] [PubMed] [Google Scholar]
- 74.Yoshida K, Kitahara S, Ito D, Kondo T. Phytochemistry. 2006;67:992. doi: 10.1016/j.phytochem.2006.03.013. [DOI] [PubMed] [Google Scholar]
- 75.Bakowskia A, Kucharska AZ, Oszmianski J. Food Chem. 2003;81:349. [Google Scholar]
- 76.Gradinaru G, Biliaderis CG, Kallithraka S, Kefalas P, Garcia-Viguera C. Food Chem. 2003;83:423. [Google Scholar]
- 77.Hakansson AE, Pardon K, Hayasaka Y, de Sa M, Herderich M. Tetrahedron Lett. 2003;44:4887. [Google Scholar]
- 78.Burns KC, Dalen JL. Oikos. 2002;96:463. [Google Scholar]
- 79.Escribano-Bailón MT, Santos-Buelga C, Rivas-Gonzalo JC. J Chromatogr A. 2004;1054:129. doi: 10.1016/j.chroma.2004.08.152. [DOI] [PubMed] [Google Scholar]
- 80.Furuta K. J Appl Ent. 1986;102:93. [Google Scholar]
- 81.Page JE, Towers GH. Planta. 2002;215:478. doi: 10.1007/s00425-002-0769-6. [DOI] [PubMed] [Google Scholar]
- 82.Gould KS, Vogelmann TC, Han T, Clearwater MJ. Phys Planta. 2002;116:127. doi: 10.1034/j.1399-3054.2002.1160116.x. [DOI] [PubMed] [Google Scholar]
- 83.Galvano F, La Fauci L, Lazzarino G, Fogliano V, Ritieni A, Ciappellano S, Battistini NC, Tavazzi B, Galvano G. J Nutr Biochem. 2004;15:2. doi: 10.1016/j.jnutbio.2003.07.004. [DOI] [PubMed] [Google Scholar]
- 84.Kowalczyk E, Krzesiński P, Kura M, Szmigiel B, Blaszczyk J. Pol J Pharmacol. 2003;55:699. [PubMed] [Google Scholar]
- 85.Arnous A, Makris DP, Kefalas P. J Agric Food Chem. 2001;49:5736. doi: 10.1021/jf010827s. [DOI] [PubMed] [Google Scholar]
- 86.Cai YZ, Xing J, Sun M, Zhan ZQ, Corke H. J Agric Food Chem. 2005;53:9940. doi: 10.1021/jf052137k. [DOI] [PubMed] [Google Scholar]
- 87.Degenhardt A, Knapp H, Winterhalter P. J Agric Food Chem. 2000;48:338. doi: 10.1021/jf990876t. [DOI] [PubMed] [Google Scholar]
- 88.Ichiyanagi T, Hatano Y, Matsugo S, Konishi T. Reactivity of Anthocyanin Toward Reactive Oxygen and Reactive Nitrogen Species. CRC Press LLC; Niigata, Japan: 2006. [Google Scholar]
- 89.Juranic Z, Zizak Z. BioFactors. 2005;23:207. doi: 10.1002/biof.5520230405. [DOI] [PubMed] [Google Scholar]
- 90.Wang H, Cao G, Prior RL. J Agric Food Chem. 1997;45:304. [Google Scholar]
- 91.Wang H, Nair MG, Strasburg GM. J Nat Prod. 1999;62:294. doi: 10.1021/np980501m. [DOI] [PubMed] [Google Scholar]
- 92.Matsumoto H, Nakamura Y, Tachibanaki S, Kawamura S, Hirayama M. J Agric Food Chem. 2003;51:3560. doi: 10.1021/jf034132y. [DOI] [PubMed] [Google Scholar]
- 93.Folts J. Pharm Biol. 1998;36:21. [Google Scholar]
- 94.Christian KR, Nair MG, Jackson JC. J Food Comp Anal. 2006;19:778. [Google Scholar]
- 95.Tsuda T, Horio F, Uchida K, Aoki H, Osawa T. J Nutr. 2003;133:2125. doi: 10.1093/jn/133.7.2125. [DOI] [PubMed] [Google Scholar]
- 96.Hou DX, Fujii M, Terahara N, Yoshimoto M. J Biomed Biotech. 2004;5:321. doi: 10.1155/S1110724304403040. [DOI] [PMC free article] [PubMed] [Google Scholar]
- 97.Hou DX, Ose T, Lin S. Int J Oncol. 2003;23:705. [PubMed] [Google Scholar]
- 98.Katsube N, Iwashita K, Tsushida T, Yamaki K, Kobori M. J Agric Food Chem. 2003;51:68. doi: 10.1021/jf025781x. [DOI] [PubMed] [Google Scholar]
- 99.Hou DX, Kai K, Li JJ. Carcinogenesis. 2004;25:29. doi: 10.1093/carcin/bgg184. [DOI] [PubMed] [Google Scholar]
- 100.Springob K, Nokajima J-i, Yamazaki M, Saito K. Nat Prod Rep. 2003;20:288. doi: 10.1039/b109542k. [DOI] [PubMed] [Google Scholar]
- 101.Holton TA, Cornish EC. Plant Cell. 1995;7:1071. doi: 10.1105/tpc.7.7.1071. [DOI] [PMC free article] [PubMed] [Google Scholar]
- 102.Nakajima JI, Tanaka Y, Yamazaki M, Saito K. J Bio Chem. 2001;276:25797. doi: 10.1074/jbc.M100744200. [DOI] [PubMed] [Google Scholar]
- 103.Nakajima JI, Sato Y, Hoshino T, Yamazaki M, Saito K. J Bio Chem. 2006;281:21387. doi: 10.1074/jbc.M600303200. [DOI] [PubMed] [Google Scholar]
- 104.Saito K, Yamazaki M. New Phytol. 2002;155:9. doi: 10.1046/j.1469-8137.2002.00440.x. [DOI] [PubMed] [Google Scholar]
- 105.Ogata J, Kanno Y, Itoh Y, Tsugawa H, Suzuki M. Nature. 2005;435:757. doi: 10.1038/nature435757a. [DOI] [PubMed] [Google Scholar]
- 106.Nakayama T, Suzuki H, Nishino T. J Mol Cat B Enz. 2003;23:117. [Google Scholar]
- 107.Hopp W, Seitz HU. Planta. 1987;170:74. doi: 10.1007/BF00392383. [DOI] [PubMed] [Google Scholar]
- 108.Debeaujon I, Peeters AJM, Leon-Kloosteriziel KM, Koornneef M. Plant Cell. 2001;13:853. doi: 10.1105/tpc.13.4.853. [DOI] [PMC free article] [PubMed] [Google Scholar]
- 109.Klein M, Martinoia E, Hoffmann-Thoma G, Weissenbock G. Plant J. 2000;21:289. doi: 10.1046/j.1365-313x.2000.00684.x. [DOI] [PubMed] [Google Scholar]
- 110.Marrs KA, Alfenito MR, Lloyd AM, Walbot V. Nature. 1995;375:397. doi: 10.1038/375397a0. [DOI] [PubMed] [Google Scholar]
- 111.Mueller LA, Goodman CD, Silady RA, Walbot V. Plant Phys. 2000;123:1561. doi: 10.1104/pp.123.4.1561. [DOI] [PMC free article] [PubMed] [Google Scholar]
- 112.Xu W, Shiori H, Kojima M, Nozue M. Plant Phys. 2001;125:447. doi: 10.1104/pp.125.1.447. [DOI] [PMC free article] [PubMed] [Google Scholar]
- 113.Manach C, Williamson G, Morand C, Scalbert A, Remesy C. Am J Clin Nutr. 2005;81:230S. doi: 10.1093/ajcn/81.1.230S. [DOI] [PubMed] [Google Scholar]
- 114.Felgines C, Talavera S, Texier O, Gil-Izquierdo A, Lamaison JL, Remesy C. J Agric Food Chem. 2005;53:7721. doi: 10.1021/jf051092k. [DOI] [PubMed] [Google Scholar]
- 115.Felgines C, Talavera S, Gonthier MP, Texier O, Scalbert A, Lamaison JL, Remesy C. J Nutr. 2003;133:1296. doi: 10.1093/jn/133.5.1296. [DOI] [PubMed] [Google Scholar]
- 116.Keppler K, Humpf HU. Bioorg Med Chem. 2005;13:5195. doi: 10.1016/j.bmc.2005.05.003. [DOI] [PubMed] [Google Scholar]
- 117.Fleschhut J, Kratzer F, Rechkemmer G, Kulling SE. Eur J Nutr. 2006;45:7. doi: 10.1007/s00394-005-0557-8. [DOI] [PubMed] [Google Scholar]
- 118.Santos-Buelga C, Williamson G. Methods in Polyphenol Analysis. The Royal Society of Chemistry; Cambridge: 2003. [Google Scholar]
- 119.Andersen OM, Markham KR. Flavonoids: Chemistry, Biochemistry and Applications. CRC Press; Boca Raton: 2006. [Google Scholar]
- 120.Calvo D, Saenz-Lopez R, Fernandez-Zurbano P, Tena MT. Anal Chim Acta. 2004;524:207. [Google Scholar]
- 121.Mazza G, Cacace JE, Kay CD. Food Comp Add. 2004;87:129. [PubMed] [Google Scholar]
- 122.Saenz-Lopez R, Fernandez-Zurbano P, Tena MT. J Chromatogr A. 2003;990:247. doi: 10.1016/s0021-9673(02)02006-x. [DOI] [PubMed] [Google Scholar]
- 123.Saenz-Lopez R, Fernandez-Zurbano P, Tena MT. J Chromatogr A. 2004;1052:191. doi: 10.1016/j.chroma.2004.08.007. [DOI] [PubMed] [Google Scholar]
- 124.da Costa CT, Horton D, Margolis SA. J Chromatogr A. 2000;881:403. doi: 10.1016/s0021-9673(00)00328-9. [DOI] [PubMed] [Google Scholar]
- 125.Bicard V, Fougerousse A, Brouillard R. J Liq Chromatogr Rel Technol. 1999;22:541. [Google Scholar]
- 126.Bednar P, Tomassi AV, Presutti C, Pavlikova M, Lemr K, Fanali S. Chromatographia. 2003;58:283. [Google Scholar]
- 127.Simo C, Barbas C, Cifuentes A. Electrophoresis. 2005;26:1306. doi: 10.1002/elps.200410108. [DOI] [PubMed] [Google Scholar]
- 128.Smyth WF. Electrophoresis. 2005;26:1334. doi: 10.1002/elps.200406202. [DOI] [PubMed] [Google Scholar]
- 129.Bednar P, Papouskova B, Muller L, Bartak P, Stavek J, Pavlousek P, Lemr K. J Sep Sci. 2005;28:1291. doi: 10.1002/jssc.200500071. [DOI] [PubMed] [Google Scholar]
- 130.de Villiers A, Vanhoenacker G, Majek P, Sandra P. J Chromatogr A. 2004;1054:195. [PubMed] [Google Scholar]
- 131.Vrhovsek U, Rigo A, Tonon D, Mattivi F. J Agric Food Chem. 2004;52:6532. doi: 10.1021/jf049317z. [DOI] [PubMed] [Google Scholar]
- 132.Schutz K, Persike M, Carle R, Schieber A. Anal Bioanal Chem. 2006;384:1511. doi: 10.1007/s00216-006-0316-6. [DOI] [PubMed] [Google Scholar]
- 133.Cooke DN, Thomasset S, Boocock DJ, Schwarz M, Winter-halter P, Steward WP. J Agric Food Chem. 2006;54:7009. doi: 10.1021/jf061562q. [DOI] [PubMed] [Google Scholar]
- 134.Nakajima JI, Tanaka I, Seo S, Yamazaki M, Saito K. J Biomed Biotech. 2004;5:241. doi: 10.1155/S1110724304404045. [DOI] [PMC free article] [PubMed] [Google Scholar]
- 135.Tian Q, Giusti MM, Stoner GD, Schwartz SJ. J Chromatogr A. 2005;1091:72. doi: 10.1016/j.chroma.2005.07.036. [DOI] [PubMed] [Google Scholar]
- 136.Anttonen MJ, Karjalainen RO. J Agric Food Chem. 2006;54:7530. doi: 10.1021/jf0615350. [DOI] [PubMed] [Google Scholar]
- 137.Hu C, Zawistowski J, Ling W, Kitts DD. J Agric Food Chem. 2003;51:5271. doi: 10.1021/jf034466n. [DOI] [PubMed] [Google Scholar]
- 138.Cooney JM, Jensen DJ, McGhie TK. J Sci Food Agric. 2004;84:237. [Google Scholar]
- 139.McGhie TK, Ainge GD, Barnett LE, Cooney JM, Jensen DJ. J Agric Food Chem. 2003;51:4539. doi: 10.1021/jf026206w. [DOI] [PubMed] [Google Scholar]
- 140.Zanatta CF, Cuevas E, Bobbio FO, Winterhalter P, Mercadante AZ. J Agric Food Chem. 2005;53:9531. doi: 10.1021/jf051357v. [DOI] [PubMed] [Google Scholar]
- 141.Seeram NP, Cichewicz RH, Chandra A, Nair MG. J Agric Food Chem. 2003;51:1948. doi: 10.1021/jf025993u. [DOI] [PubMed] [Google Scholar]
- 142.Seeram NP, Adams LS, Hardy ML, Heber D. J Agric Food Chem. 2004;52:2512. doi: 10.1021/jf0352778. [DOI] [PubMed] [Google Scholar]
- 143.Di Paola-Naranjo RD, Sanchez-Sanchez J, Gonzalez-Paramas AM, Rivas-Gonzalo JC. J Chromatogr A. 2004;1054:205. doi: 10.1016/j.chroma.2004.05.023. [DOI] [PubMed] [Google Scholar]
- 144.Kazuma K, Noda N, Suzuki M. Phytochemistry. 2003;64:1133. doi: 10.1016/s0031-9422(03)00504-1. [DOI] [PubMed] [Google Scholar]
- 145.Kazuma K, Noda N, Suzuki M. Phytochemistry. 2003;62:229. doi: 10.1016/s0031-9422(02)00486-7. [DOI] [PubMed] [Google Scholar]
- 146.Escribano-Bailon MT, Santos-Buelga C, Alonso GL, Salinas MR. Phytochem Anal. 2002;13:354. doi: 10.1002/pca.667. [DOI] [PubMed] [Google Scholar]
- 147.Es-Safi NE, Cheynier V, Moutounet M. J Agric Food Chem. 2002;50:5571. doi: 10.1021/jf025503y. [DOI] [PubMed] [Google Scholar]
- 148.Ali A, Strommer J. J Agric Food Chem. 2003;51:7246. doi: 10.1021/jf030435g. [DOI] [PubMed] [Google Scholar]
- 149.Pomar F, Novo M, Masa A. J Chromatogr A. 2005;1094:34. doi: 10.1016/j.chroma.2005.07.096. [DOI] [PubMed] [Google Scholar]
- 150.Vidal S, Meudeo E, Cheynier V, Skouroumounis G, Hayasaka Y. J Agric Food Chem. 2004;52:7144. doi: 10.1021/jf048939h. [DOI] [PubMed] [Google Scholar]
- 151.Cantos E, Espin JC, Tomás-Barberán FA. J Agric Food Chem. 2002;50:5691. doi: 10.1021/jf0204102. [DOI] [PubMed] [Google Scholar]
- 152.Cantos E, Garcia-Viguera C, de Pascual-Teresa S, Tomás-Barberán FA. J Agric Food Chem. 2000;48:4606. doi: 10.1021/jf0002948. [DOI] [PubMed] [Google Scholar]
- 153.Lee J, Finn CE, Wrolstad RE. J Agric Food Chem. 2004;52:7039. doi: 10.1021/jf049108e. [DOI] [PubMed] [Google Scholar]
- 154.Alcalde-Eon C, Saavedra G, de Pascual-Teresa S, Rivas-Gonzalo JC. J Chromatogr A. 2004;1054:211. doi: 10.1016/j.chroma.2004.08.074. [DOI] [PubMed] [Google Scholar]
- 155.Choung MG, Choi BR, An YN, Chu YH, Cho YS. J Agric Food Chem. 2003;51:7040. doi: 10.1021/jf0304021. [DOI] [PubMed] [Google Scholar]
- 156.Montoro P, Tuberoso CIG, Perrone A, Piacenta S, Cabras P, Pizza C. J Chromatogr A. 2006;1112:232. doi: 10.1016/j.chroma.2005.11.055. [DOI] [PubMed] [Google Scholar]
- 157.Alcalde-Eon C, Saavedra G, de Pascual-Teresa S, Rivas-Gonzalo JC. Food Chem. 2004;86:441. doi: 10.1016/j.chroma.2004.08.074. [DOI] [PubMed] [Google Scholar]
- 158.Pissarra J, Lourenco S, Gonzalez-Paramas AM, Mateus N, Santos-Buelga C, de Freitas V. Anal Chim Acta. 2004;513:215. [Google Scholar]
- 159.Pissarra J, Mateus N, Rivas-Gonzalo JC, Santos-Buelga C, de Freitas V. J Food Sci. 2003;68:476. [Google Scholar]
- 160.Mateus N, de Pascual-Teresa S, Rivas-Gonzalo JC, Santos-Buelga C, de Freitas V. Food Chem. 2002;76:335. [Google Scholar]
- 161.Stobiecki M, Matysiak-Kata I, Franski R, Skala J, Szopa J. Phytochemistry. 2003;62:959. doi: 10.1016/s0031-9422(02)00720-3. [DOI] [PubMed] [Google Scholar]
- 162.de Pascual-Teresa S, Santos-Buelga C, Rivas-Gonzalo JC. J Sci Food Agric. 2002;82:1003. [Google Scholar]
- 163.Fossen T, Andersen OM. Phytochem. 2003;62:1217. doi: 10.1016/s0031-9422(02)00746-x. [DOI] [PubMed] [Google Scholar]
- 164.Fossen T, Slimestad R, Andersen OM. Phytochemistry. 2003;64:1367. doi: 10.1016/j.phytochem.2003.08.019. [DOI] [PubMed] [Google Scholar]
- 165.Vivar-Quintana AM, Santos-Buelga C, Rivas-Gonzalo JC. Anal Chim Acta. 2002;458:147. [Google Scholar]
- 166.Kosir IJ, Lapornik B, Andrensek S, Wondra AG, Vrhovsek U, Kidric J. Anal Chim Acta. 2004;513:277. [Google Scholar]
- 167.Pati S, Losito I, Gambacorta G, La Notte E, Palmisano F, Zambonin PG. J Mass Spectrom. 2006;41:861. doi: 10.1002/jms.1044. [DOI] [PubMed] [Google Scholar]
- 168.Dugo P, Favoino O, Lo Presti M, Luppino R, Dugo G, Mondello L. J Sep Sci. 2004;27:1458. doi: 10.1002/jssc.200401822. [DOI] [PubMed] [Google Scholar]
- 169.Makris DP, Kallithraka S, Mamalos A. Talanta. 2006;70:1143. doi: 10.1016/j.talanta.2006.03.024. [DOI] [PubMed] [Google Scholar]
- 170.Remy S, Fulcrand H, Labarbe B, Cheynier V, Moutounet M. J Sci Food Agric. 2000;80:745. doi: 10.1002/(SICI)1097-0010(20000501)80:6<745::AID-JSFA611>3.0.CO;2-4. [DOI] [PubMed] [Google Scholar]
- 171.Revilla I, Perez-Magarino S, Gonzalez-SanJose ML, Beltran S. J Chromatogr A. 1999;847:83. doi: 10.1016/s0021-9673(99)00255-1. [DOI] [PubMed] [Google Scholar]
- 172.Pozo-Bayon MA, Monagas M, Polo MC, Gomez-Cordoves C. J Agric Food Chem. 2004;52:1300. doi: 10.1021/jf030639x. [DOI] [PubMed] [Google Scholar]
- 173.Shoji T, Goda Y, Toyoda M, Yanagida A, Kanda T. Phytochemistry. 2002;59:183. doi: 10.1016/s0031-9422(01)00427-7. [DOI] [PubMed] [Google Scholar]
- 174.Hvattum E. Rapid Commun Mass Spectrom. 2002;16:655. doi: 10.1002/rcm.622. [DOI] [PubMed] [Google Scholar]
- 175.Lopes-da-Silva F, de Pascual-Teresa S, Rivas-Gonzalo JC, Santos-Buelga C. Eur Food Res Technol. 2002;214:248. [Google Scholar]
- 176.Harborne JB. Biochem J. 1958;70:22. doi: 10.1042/bj0700022. [DOI] [PMC free article] [PubMed] [Google Scholar]
- 177.Hong V, Wrolstad RE. J Agric Food Chem. 1990;38:708. [Google Scholar]
- 178.Flamini R. Mass Spectrom Rev. 2003;22:213. doi: 10.1002/mas.10052. [DOI] [PubMed] [Google Scholar]
- 179.Baldi A, Romani A, Mulinacci N, Vinoieri FF, Casetta B. J Agric Food Chem. 1995;43:2104. [Google Scholar]
- 180.Johnstone RAW, Rose ME. Mass Spectrometry for Chemists and Biochemists. University Press; Cambridge, UK: 1996. [Google Scholar]
- 181.de Rijke E, Zappey H, Ariese F, Gooijer C, Brinkman UAT. J Chromatogr A. 2003;984:45. doi: 10.1016/s0021-9673(02)01868-x. [DOI] [PubMed] [Google Scholar]
- 182.Mazza G, Cacace JE. J Food Sci. 2003;68:240. [Google Scholar]
- 183.Revilla E, Ryan JM, Martin-Ortega G. J Agric Food Chem. 1998;46:4592. [Google Scholar]
- 184.Garoia-Viguera C, Zafrilla P, Tomás-Barberán FA. Phytochem Anal. 1998;9:274. [Google Scholar]
- 185.Giusti MM, Rodriguez-Saona LE, Baggett JR, Reed GL, Durst RW, Wrolstad RE. J Food Sci. 1998;63:219. [Google Scholar]
- 186.Kraemer-Schafhalter A, Fuchs H, Pfannhauser W. J Sci Food Agric. 1998;78:435. [Google Scholar]
- 187.Liu Z, Xiao G, Chen W, Xu Y, Wu J. J Biomed Biotechnol. 2004;5:326. doi: 10.1155/S1110724304403052. [DOI] [PMC free article] [PubMed] [Google Scholar]
- 188.Giusti MM, Wrolstad RE. J Food Sci. 1996;61:322. [Google Scholar]
- 189.Byamukama R, Kiremire B, Andersen OM, Steigen A. J Food Comp Anal. 2005;18:599. [Google Scholar]
- 190.Pale E, Nacro M, Vanhaelen M, Vanhaelen-Fastre R. J Agric Food Chem. 1997;45:3359. [Google Scholar]
- 191.Sun B, Leandro MC, de Freitas V, Spranger MI. J Chromatogr A. 2006;1128:27. doi: 10.1016/j.chroma.2006.06.026. [DOI] [PubMed] [Google Scholar]
- 192.Schwarz M, Hillebrand S, Habben S, Degenhardt A, Winter-halter P. Biochem Eng J. 2003;14:179. [Google Scholar]
- 193.Du Q, Jerz G, Winterhalter P. J Chromatogr A. 2004;1045:59. doi: 10.1016/j.chroma.2004.06.017. [DOI] [PubMed] [Google Scholar]
- 194.Degenhardt A, Hofmann S, Knapp H, Winterhalter P. J Agric Food Chem. 2000;48:5812. doi: 10.1021/jf0007481. [DOI] [PubMed] [Google Scholar]
- 195.Vidal S, Hayasaka Y, Meudec E, Cheynier V, Skouroumounis G. J Agric Food Chem. 2004;52:713. doi: 10.1021/jf034906a. [DOI] [PubMed] [Google Scholar]
- 196.Degenhardt A, Schwarz M, Winterhalter P, Ito Y. J Chromatogr A. 2001;922:355. doi: 10.1016/s0021-9673(01)00908-6. [DOI] [PubMed] [Google Scholar]