Abstract
A water bolus used in superficial hyperthermia couples the electromagnetic (EM) or acoustic energy into the target tissue and cools the tissue surface to minimize thermal hotspots and patient discomfort during treatment. Parametric analyses of the fluid pressure inside the bolus computed using 3D fluid dynamics simulations are used in this study to determine a bolus design with improved flow and surface temperature distributions for large area superficial heat applicators. The simulation results are used in the design and fabrication of a 19×32 cm prototype bolus with dual input-dual output (DIDO) flow channels. Sequential thermal images of the bolus surface temperature recorded for a step change in the circulating water temperature are used to assess steady state flow and surface temperature distributions across the bolus. Modeling and measurement data indicate substantial improvement in bolus flow and surface temperature distributions when changing from the previous single input-single output (SISO) to DIDO configuration. Temperature variation across the bolus at steady state was measured to be less than 0.8°C for the DIDO bolus compared to 1.5°C for the SISO waterbolus. The new DIDO bolus configuration maintains a nearly uniform flow distribution and low variation in surface temperature over a large area typically treated in superficial hyperthermia.
Keywords: waterbolus, superficial disease, hyperthermia, flow distribution, chestwall recurrence
1. Introduction
Moderate temperature hyperthermia in the range of 40–44°C has been demonstrated to be a promising adjuvant to radiation and chemotherapy treatments of superficial tissue disease [1–4]. Moreover, preclinical data has demonstrated a significant increase in thermal enhancement ratio (response with heat/response without heat) when heat and radiation therapies are delivered simultaneously [5–7]. This led to the development of new combination applicators capable of simultaneous therapy [8–13]. One such applicator developed by this group for concurrent microwave heating and brachytherapy treatment of large area surface disease such as chest wall recurrence of breast cancer was reported in [8, 13–16]. This prototype combination applicator is a conformal vest with the following layers: thermal mapping catheters for tissue surface thermometry, a temperature stabilizing water bolus, a conformal microwave array (CMA) applicator with 915 MHz dual concentric conductor (DCC) aperture antennas [17], a dielectric spacer to maintain distance between the tissue surface and high-dose rate (HDR) brachytherapy sources, HDR brachytherapy catheters and an inflatable air bladder for securing the applicator to the contoured patient anatomy [8, 14, 16]. The water bolus is a crucial component of the combination superficial hyperthermia applicator. There are numerous papers that discuss the influence of the water coupling bolus on tissue surface temperature inhomogeneity and tissue specific absorption rate (SAR) during hyperthermia treatment [18–24]. Guide lines for using water bolus during superficial hyperthermia have been proposed [22] and several water bolus designs have been proposed for use with different microwave hyperthermia devices [14, 20, 23, 25]. The water bolus used with multielement electromagnetic applicators must be thin (0.5–2 cm depending on frequency) or the bolus layer will support spurious surface waves and volume oscillations that distort the specific absorption rate (SAR) pattern inside the tissue [21, 25–29]. The water circulating through the bolus provides a finite thickness homogeneous dielectric interface that couples the electromagnetic (EM) waves into the high dielectric constant tissue. Besides EM coupling, the temperature controlled deionized water circulating inside the bolus cools the skin surface and minimizes spatial variation in tissue surface temperature during the hour long hyperthermia treatments.
In our superficial hyperthermia treatments of chestwall recurrence, the target tissue (typically 10–15 mm deep including skin) is elevated to 40–45°C using a 915 MHz multielement array applicator to heat at depth and a thin bolus with circulating 42.5°C water is used to improve uniformity of skin surface temperature [27–30]. The fluid dynamics of the water bolus used with the DCC array have been shown to play a crucial role in regulating the surface temperature distribution [31]. As the size of multi-element array applicators increases to treat larger areas, the ability to generate uniform flow across the bolus and thereby maximize surface temperature homogeneity becomes increasingly difficult, especially for simple bolus designs with small inlet and outlet ports. Larger bolus sizes exhibit pressure loss along the flow channels which produces non-uniform flow distribution unless the bolus design is improved. Regions inside the water bolus with poor fluid flow have low thermal transfer to skin due to slow convective heat exchange with the circulating water. In addition, the longer transit time of water in low flow regions of the bolus allows increased absorption of energy from the microwave antennas. As a result, surface temperature increases in low flow regions resulting in hot spots on the skin during hyperthermia treatment [31].
Thus, it is important to maintain a nearly uniform flow distribution across the bolus to regulate tissue surface temperature homogeneity during hyperthermia treatment. Maintaining uniform flow distribution across a bolus with perforated inlet and outlet flow channels and a finite thickness open cell filter foam (bolus active area) like the one used in our hyperthermia clinic requires a nearly constant lateral pressure distribution inside the flow channels to maintain monotonic pressure drop across the bolus active area. In this paper we present 3D computational fluid dynamics simulations and experimental measurements that investigate the flow dynamics of the waterbolus and propose an improved water bolus design for a 19×32 cm hyperthermia applicator intended to heat large area superficial disease.
2. Methods
Fluid flow inside a thin layer of rectangular water bolus with 19×32 cm active area suitable for coupling a 3×6 DCC microwave antenna array to tissue was analyzed as a manifold fluid network [32–34]. Parametric analyses of the bolus design variables were studied using 3D computational fluid dynamics simulations and pressure distributions inside the bolus were used to design a prototype 19×32 cm conformal waterbolus with improved fluid flow and surface temperature distribution.
2.1 Single inlet – single outlet (SISO) Waterbolus
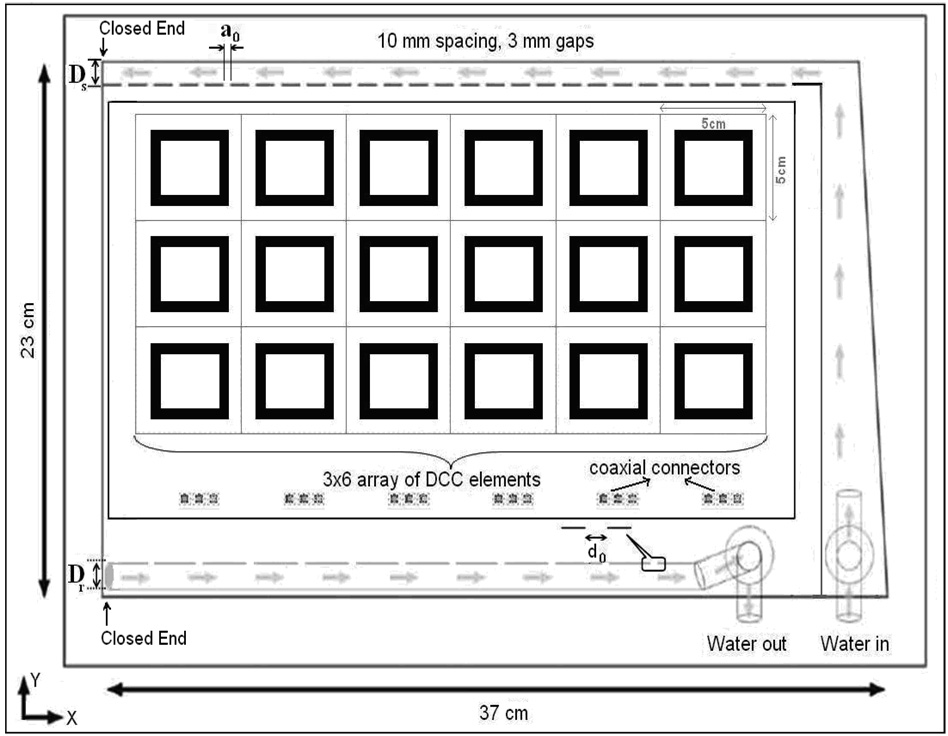
Figure 1 shows the schematic of a waterbolus with single inlet and single outlet flow channels used in the combination CMA applicator [8]. Layers of flexible medical grade PVC material (3 mm thickness) were heat sealed together around the edges to form a reusable and highly conformal bolus bag. Deionized water was circulated through the inlet and outlet channels of the bolus which contained 6 mm thick open cell filter foam. Numerical simulations and experimental measurements of SAR inside tissue equivalent phantoms have shown the optimum bolus thickness for 915 MHz DCC apertures to be between 5–10 mm [27–29]. The thin layer of filter foam maintained a finite thickness coupling for optimal SAR deposition from the microwave antenna array and a constant distance between the HDR brachytherapy sources and tissue surface [15]. The 1 cm wide inlet water channel on one side of the bolus distributed water into the porous filter foam (bolus active area) through 3 mm wide openings spaced at 10 mm intervals. The water flowing through the porous medium was collected on the opposite side of the bolus using a 0.635 cm diameter (1/4″ ID) tubing with approximately 3 mm diameter perforations at 10 mm interval. Water circulation was maintained using a peristaltic pump so that water inflow and outflow rates through the bolus are identical.
Figure 1.
Schematic illustration of the bolus with single inlet and single outlet (SISO) flow channels. The 3×6 DCC aperture antenna array with coaxial connectors is overlaid to indicate the 19×32 cm bolus area.
2.2 Improved Waterbolus Design
The SISO bolus configuration of Figure 1 is a reverse manifold fluid network [32–34]. Water flowing through the bolus flow channels experience frictional loss at the rigid wall resulting in pressure drop along the flow path. At each opening in the inlet manifold, part of the water flowing through the orifice reduces fluid momentum resulting in pressure increase [35–36]. Friction and momentum effects inside the inlet manifold have opposing effects causing variation in pressure along the fluid path [35–36]. On the other hand, in the outlet channel, frictional losses along the fluid path and increasing fluid momentum due to confluence of fluid streams from successive orifices combine to reduce pressure along the fluid path [32–36]. A nearly uniform pressure distribution inside the flow channels will maintain a monotonic pressure drop and uniform fluid flow distribution across the bolus. Simple design techniques such as tapering inlet/outlet flow channels to compensate for change in fluid flow velocity due to pressure drop along the fluid path [37], or changing the individual orifice size [38] do not prove sufficient to maintain uniform flow distribution over a range of fluid flow rates possible with this size bolus. Thus, it is desirable to construct a bolus bag that yields satisfactory performance over the desired range of flow rates with acceptably low variation in fluid velocity across the bolus.
Design Variables
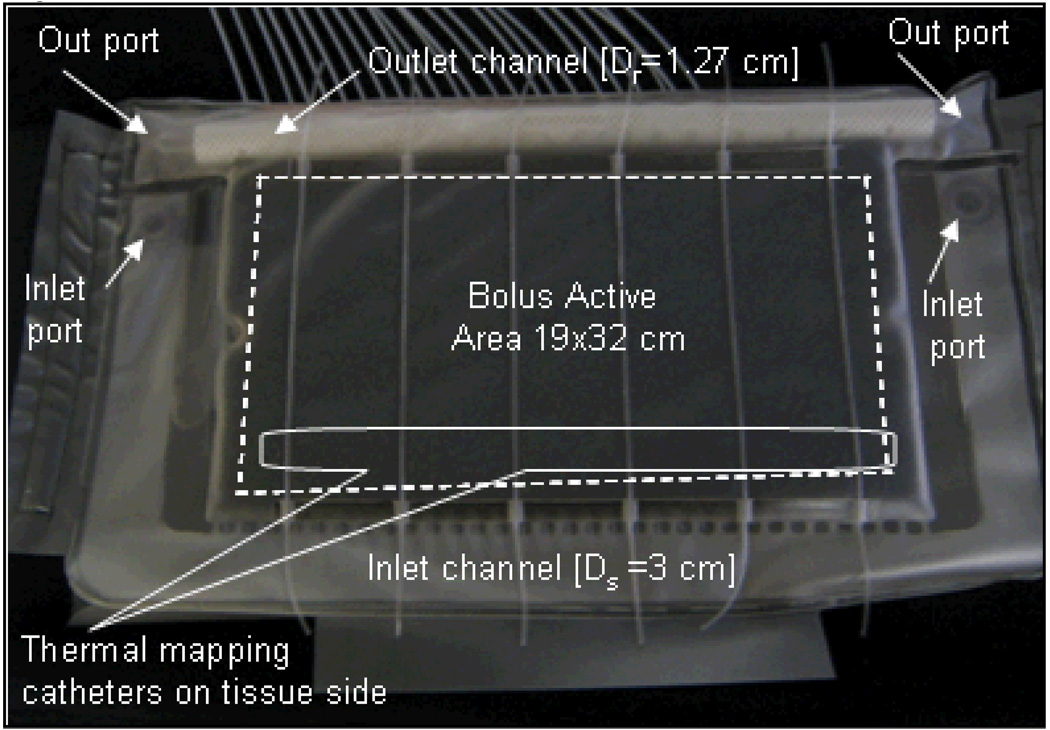
In order to minimize variation in fluid pressure within the flow channels and maintain a nearly uniform flow distribution across the bolus active area, flow channels with larger cross sectional area were investigated. The following parameters were analyzed to improve the fluid dynamics of the 19×32 cm rectangular bolus: inlet channel width (Ds), diameter of the outlet channel (Dr), width of the skip seals (a0) in the inlet channel and diameter of the holes (d0) in the outlet channels. Figure 1 identifies the bolus design variables and the 19×32 cm active bolus area of the 3×6 DCC array. The length of the inlet and outlet channels was fixed by the dimension of the applicator array. Conformity to the body surface, comfort and physical dimensions of the CMA applicator were considered in determining the following limits for the bolus design variables: Ds∈[1, 3] cm, Dr≤1.27 cm. The upper limit on outlet channel diameter (Dr) was set to match the dimension of a readily available half inch diameter vacuum rated tubing with a bend radius ≤5 cm.
The upper limit on Ds was chosen in order to fit patient anatomy while the lower limit was based on previous bolus design which is known to provide minimally adequate flow [31]. For the new waterbolus design, the orifice dimensions in the inlet and outlet channels (a0, d0) were increased from 3 to 5 mm with 10 mm spacing. Larger openings in the outlet channel reduce flow resistance inside the return tubing due to increase in flow cross section. On the inlet channel, they reduce flow resistance and also the mechanical stress on the narrow skip seals between each orifice. Increasing orifice width any further while maintaining 10 mm spacing interval (>50% opening) was observed to deteriorate flow distribution due to increased fluid momentum from the first few orifices along the fluid path.
2.3 Fluid Dynamics Simulations
Mathematical Model
Steady state fluid flow inside the water bolus is studied by coupling the incompressible Navier-Stokes equation in the flow channels with Brinkman’s equation for porous media inside the open cell filter foam. Free flow of water through the bolus inlet and outlet channels and orifices during steady state is studied using incompressible Navier-Stokes and continuity equations, given by [39],
| (1.1) |
| (1.2) |
The Navier-Stokes equation (1.1) represents conservation of momentum and the continuity equation (1.2) represents conservation of mass of the circulating water with constant dynamic viscosity (η), density (ρ), velocity vector, u and pressure, p. Steady state fluid flow through the porous filter foam in the bolus active area is studied using Brinkman’s and continuity equations [40],
| (2.1) |
| (2.2) |
respectively where ε and κ are the porosity and permeability of the filter foam. Steady state pressure and velocity of the circulating water is studied by solving equations (1)–(2) using the following boundary conditions:
| (3.1) |
at the rigid walls of the bolus, ,
| (3.2) |
at the exit port of the outlet channel and continuity of fluid flow at the interface between free flow and flow through a porous medium. Simulations were carried out for laminar inflow of Q [L/min] through the inlet port.
Simulations
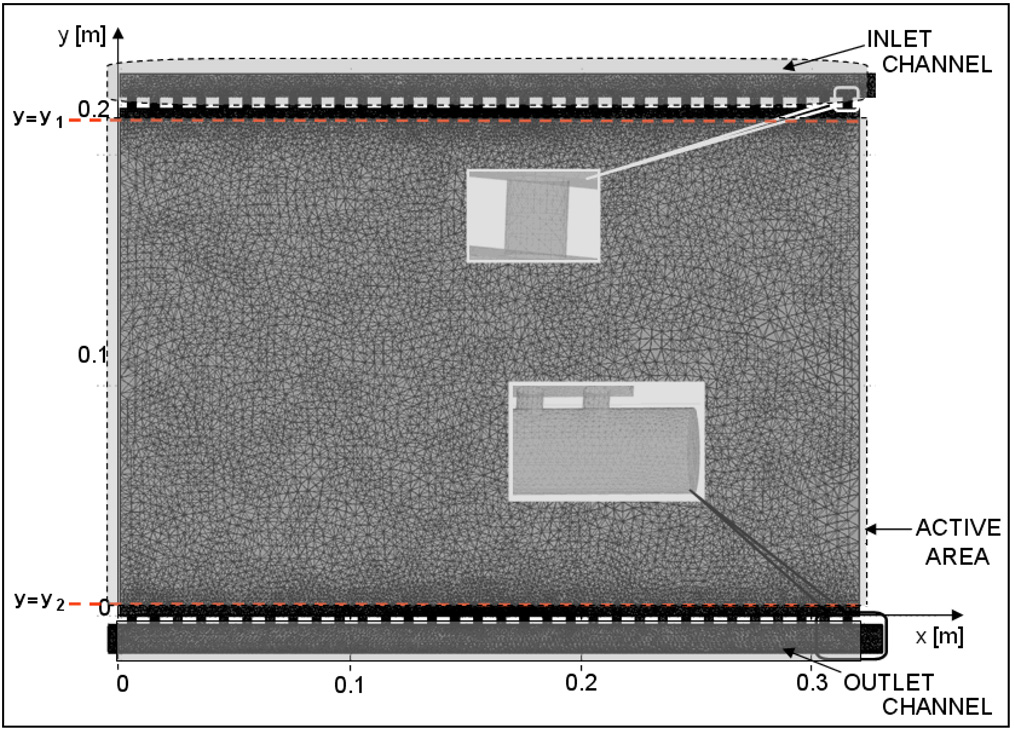
An equivalent 3D model of the rectangular bolus was created to study fluid flow dynamics through the waterbolus. Figure 2 shows a SISO bolus model used in the simulation. During water circulation, the RF welded inlet channel and skip seals in the PVC bolus bag takes a cylindrical shape. Thus, the inlet channel of width Ds and skip seals of width a0 were modeled as cylinders with diameters, 2Ds/π and 2a0/π respectively. The length of the inlet channel and skip seals were 34 cm and 0.5 cm respectively in the model. The outlet tubing was modeled as a 0.34 cm long cylinder with inner diameter, Dr and wall thickness equal to 0.3175 cm (1/8″). The holes on the outlet tubing connecting the porous medium were modeled as 0.3175 cm long cylinders with diameter, d0 spaced every 10 mm. The porous medium containing open cell filter foam is modeled as 19×32 cm cuboid of thickness, t=6 mm.
Figure 2.
Numerical model of a SISO bolus illustrating the peripheral inlet and outlet flow channels and central “active area” of the bolus available for coupling a hyperthermia applicator to tissue surface.
Fluid dynamics simulations of the bolus steady state flow were carried out for the following cases: (a) SISO bolus of Figure 1 with a0=3 mm, d0=3 mm, Dr=0.635 cm (1/4″) and Ds=1 cm – existing design [14], (b) SISO bolus with wider flow channels; a0=5 mm, d0=5 mm, Dr=1.27 cm and Ds varying between 1 to 3 cm, and (c) DIDO waterbolus with wider flow channels; a0=5 mm, d0=5 mm, Dr=1.27 cm and Ds varying between 1 and 3 cm. The wider cross section flow channels in models (b) and (c) were investigated for their potential to improve flow distribution across the bolus. The SISO bolus models of (a)–(b) are reverse manifold fluid networks [32–34]. The DIDO bolus configuration of model (c) combines the reverse and parallel manifold fluid networks [32–34]. Table 1 summarizes the fluid dynamics simulations studied in this effort.
Table 1.
Fluid dynamics models simulated for possible flow distributions across a 19×32 cm water bolus.
| Models | Ds [cm] | Dr [cm] | a0 [mm] | d0 [mm] | Flow configuration |
|---|---|---|---|---|---|
| a) | 1 | 0.635 | 3 | 3 | SISO (Figure 1) |
| b) | [1, 3] | 1.27 | 5 | 5 | SISO |
| c) | [1, 3] | 1.27 | 5 | 5 | DIDO |
Comsol Multiphysics (Comsol Inc, Burlington, MA USA), a finite element based simulation software was used to solve the combined Navier-Stokes and Brinkman equations (1)–(2) for the boundary conditions in equation (3). Steady state pressure and velocity distributions in the numerical simulations were calculated for 2 L/min total inflow rate. The DIDO bolus simulations were carried out for 2 L/min total inflow that was equally split between the two inlet ports of the bolus. The following values were used in the simulations: p0=0, ρ=991.46 kg/m3, and η=6.3e−4 kg/m/s for 42.5 °C water, ε=0.85 and κ=3.3e−7 m2 for 15–25 ppi open cell filter foam [40]. As the flow dynamics in the bolus active area is studied in terms of internal fluid pressure, normalized pressure defined as,
| (4) |
was computed in the central plane (z=t) of the bolus active area for all models. In (4), Pmin and Pmax refer to the minimum and maximum values of steady state pressure in the mid plane (z=t) of the bolus active area. Let and be the normalized pressure in Eqn 4 evaluated at y=y1 and y=y2 where y1 and y2 denote the start and end locations of the bolus active area containing the open cell filter foam. The location of the filter foam is indicated by the dotted lines in Figure 2. When and , a monotonic pressure gradient exists across the bolus leading to nearly uniform flow distribution. The fluid dynamics of the bolus models were assessed based on the normalized pressure curves, and .
2.4 Experimental Evaluation of Bolus Fluid Dynamics
Results of the simulations were used to finalize the design of a new conformal DIDO waterbolus (19×32 cm). A prototype following this design was fabricated by Bionix Development Corp (Paoli, PA USA) as a part of a collaborative research project with Duke University. Since it is difficult to measure flow or pressure inside the thin water bolus, thermal image sequences of the bolus surface were used to assess steady state flow and surface temperature distributions of the bolus under forced convection. Temperature controlled water was circulated through the bolus bags lying on flat surface using a peristaltic pump (Cole-Parmer, Vernon Hills, IL USA). For the prototype DIDO bolus, water was fed to both inlet channels using a Tee splitter in the supply tubing and water was pulled from both ends of the outlet tube using a Tee combiner on the return side connected to the peristaltic pump. The bolus thickness during water circulation was maintained at 6 mm and temperature distribution on the bolus surface was monitored from above using an infrared (IR) camera (Mikron 7500, Mikron Infrared Inc., Oakland, NJ) with +/−2% measurement accuracy. The temperature of the water flowing through the bolus was suddenly switched to a temperature controlled water bath that was 5°C above the initial temperature. Thermal image sequences of the bolus surface were recorded using the IR camera before and after this step change in circulating water temperature at a steady state fluid flow rate of 2 L/min. Thermographic images of the bolus surface temperatures were used to assess the steady state fluid flow dynamics and quantify surface temperature variation of the SISO and DIDO water boluses.
3. Results
3.1 Fluid Dynamics Simulations
Case (a)
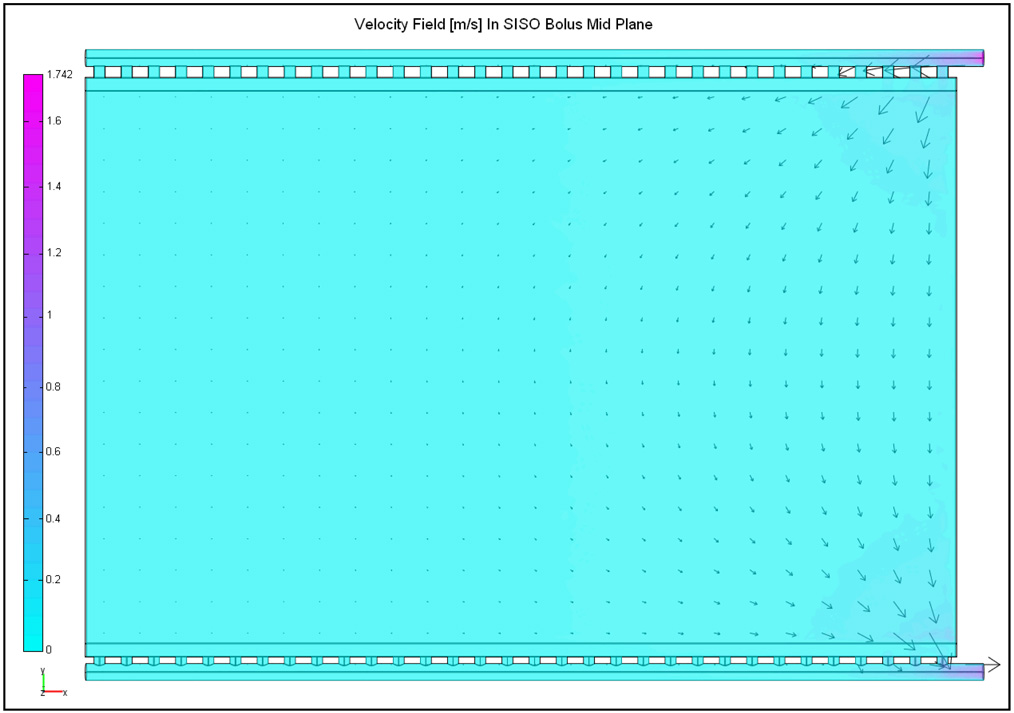
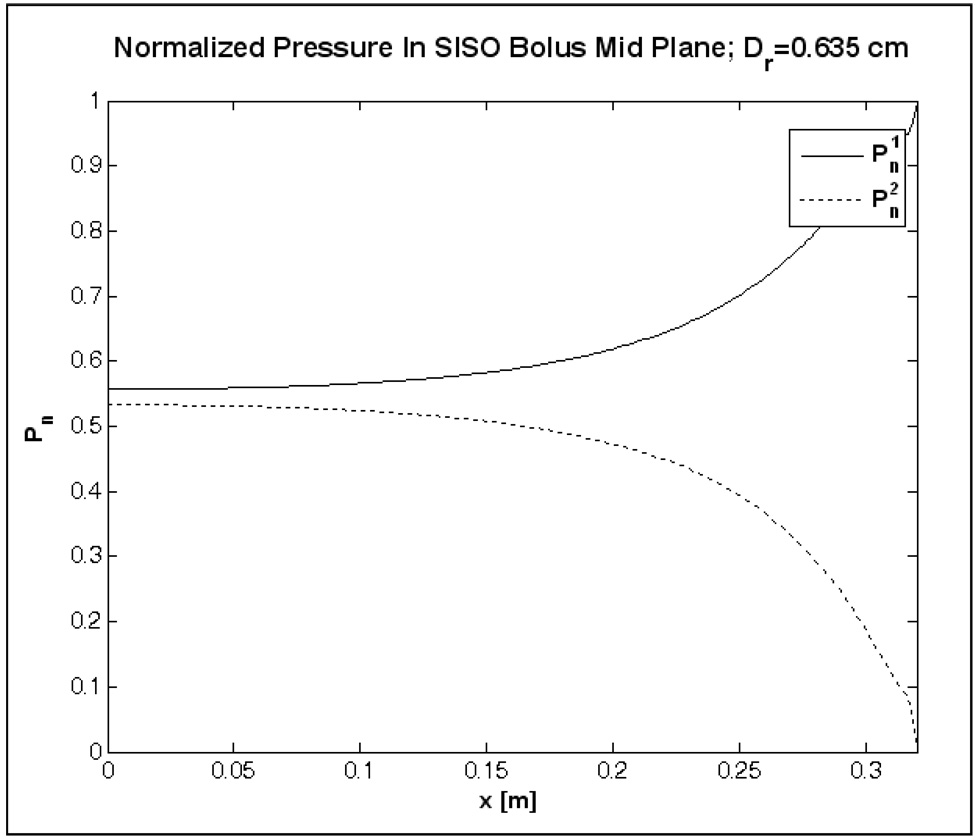
Figure 3 shows the steady state velocity field computed in the mid plane of the SISO bolus of Figure 1 for 2 L/min inflow. The arrows in Figure 3 denote the direction and magnitude of the water velocity at steady state. Figure 4 shows the normalized pressure curves, and computed at the beginning and end of the active area. In Figure 3–Figure 4, water enters the inlet channel at x/L=1 (L=32 cm) from above and exits via the port on the outlet channel located at the bottom right (x/L=1), and x=0 corresponds to the closed end of the inlet and outlet channels. Friction along the flow path and narrow cross section of the flow channels in the SISO bolus of Figure 1 resulted in significant pressure drop (Figure 4) with maximum fluid momentum through few orifices near the inlet and outlet ports [33, 35]. Thus, the water entering the inlet manifold disperses through the numerous openings at a nonlinearly decreasing flow rate along the fluid path (Figure 3). Once inside the bolus, water suction through the holes in the outlet tubing with narrow flow cross section causes a non-uniform flow distribution with preferential volume flowing through the holes nearest to the outlet port at bottom right (Figure 3).
Figure 3.
Steady state velocity field in the central plane of the SISO bolus model (a) of Figure 1, calculated for 2 L/min flow rate.
Figure 4.
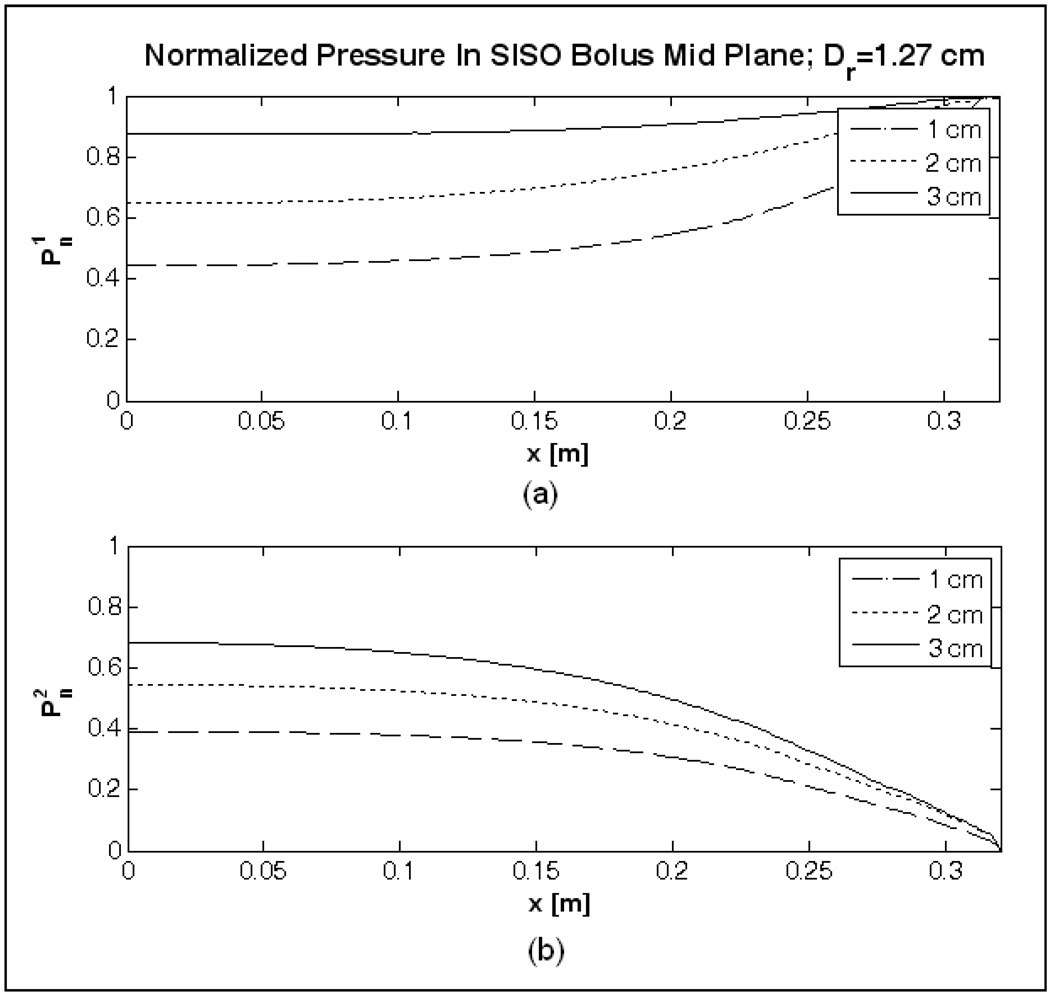
Normalized pressure above and below the 19×32 cm bolus active area computed for the SISO bolus model of Figure 1.
Case (b)
Figure 5 shows the normalized pressure curves of the SISO bolus model with wider flow channels; Ds∈[1, 3] cm, Dr=1.27 cm, d0=5mm and a0=5 mm with equi-spaced orifices in the flow channels. In Figure 5a, increasing the inlet channel width (Ds) increased the surface area of the channel and reduced pressure drop due to friction along the fluid path [32]. Subsequently, it improved the pressure distribution in the inlet channel and above the bolus active area, . From Figure 5a it can be observed that the effect of fluid momentum on internal fluid pressure is negligible compared to frictional effect along the fluid path. However, pressure variation on the bolus return side, increased with increase in inlet channel width, Ds. This is because, on the return side, friction from tube wall and increase in fluid momentum due to confluence of numerous fluid streams act together to reduce the pressure along the flow path [32–36]. Sufficiently larger diameter tubing is required on the return side to minimize variation in fluid pressure in the outlet channel and subsequently inside the bolus active area. Furthermore, since it is a closed fluid network, the flow cross section of the outlet channel (Dr) should be larger than that of the inlet channel in order to maintain nearly uniform flow distribution across the bolus [32–33, 35]. Thus, the variation in pressure on the exit side of the bolus active area, increased in Figure 5b, as Ds was increased
Figure 5.
Normalized pressure above and below the 19×32 cm bolus active area computed for the SISO bolus model (b) of Table 1.
Case (c)
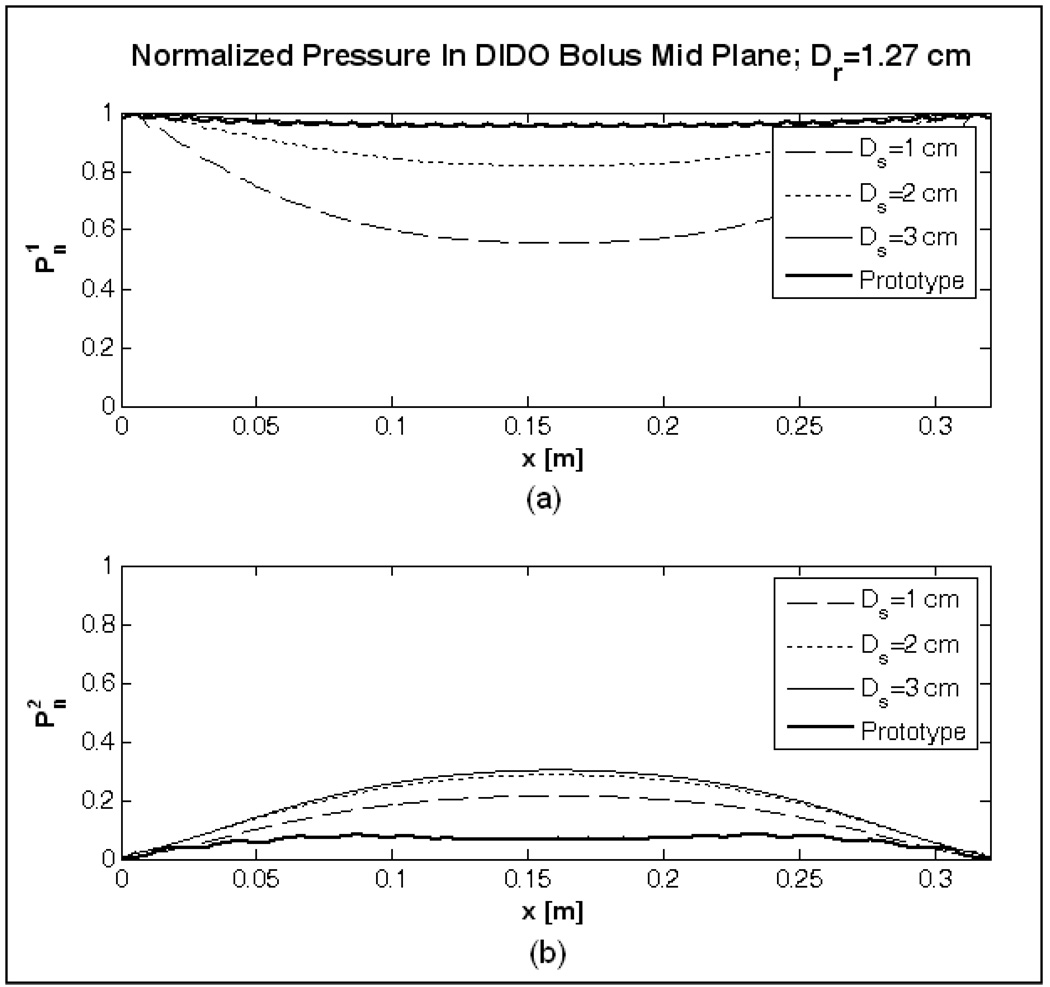
Figure 6 shows the normalized pressure curves computed for the DIDO bolus model (c) in Table 1. Similar to the observations made for the SISO bolus, normalized fluid pressure across the active area improved in Figure 6 as the inlet channel width (Ds) and return tubing diameter (Dr) were increased compared to the SISO bolus model, (a) of Figure 4. In addition to the use of wider flow channels, water inflow from opposing directions and suction from both ends of the outlet tubing effectively reduced the pressure variation inside the flow channels and across the bolus active area. For values of Ds greater than 1 cm, pressure distribution above the active area, in Figure 6a approached unity. On the return side of the bolus, reduction in fluid path length due to suction from both ends of the return tubing, reduced the friction and fluid momentum effects on fluid pressure. Thus, variation in pressure on the return side of the bolus active area, in Figure 6 significantly reduced for the DIDO bolus models.
Figure 6.
Normalized pressure above and below the 19×32 cm bolus active area computed in the mid plane of the DIDO bolus model (c) of Table 1.
In an effort to reduce variation in fluid pressure away from the exit ports, without increasing the upper limit on Dr, simulations were carried out for the DIDO waterbolus with non-uniform orifice spacing on the return tubing. Subsequently, fluid flow through a DIDO bolus with Ds=3 cm and d0=5 mm, a0=5 mm was simulated for Dr=1.27cm (1/2″) and variable spacing of holes in the return tubing. Logarithmic spacing was chosen to counteract the nonlinear increase in pressure on the bolus return side (Figure 6b). The holes in the outlet channel were symmetrically located about the center (x=L/2; L=32 cm) with closer spacing towards the center (x=L/2) and sparser holes near the tube ends (x=0, L) of the return tubing as shown in Figure 7.
Figure 7.
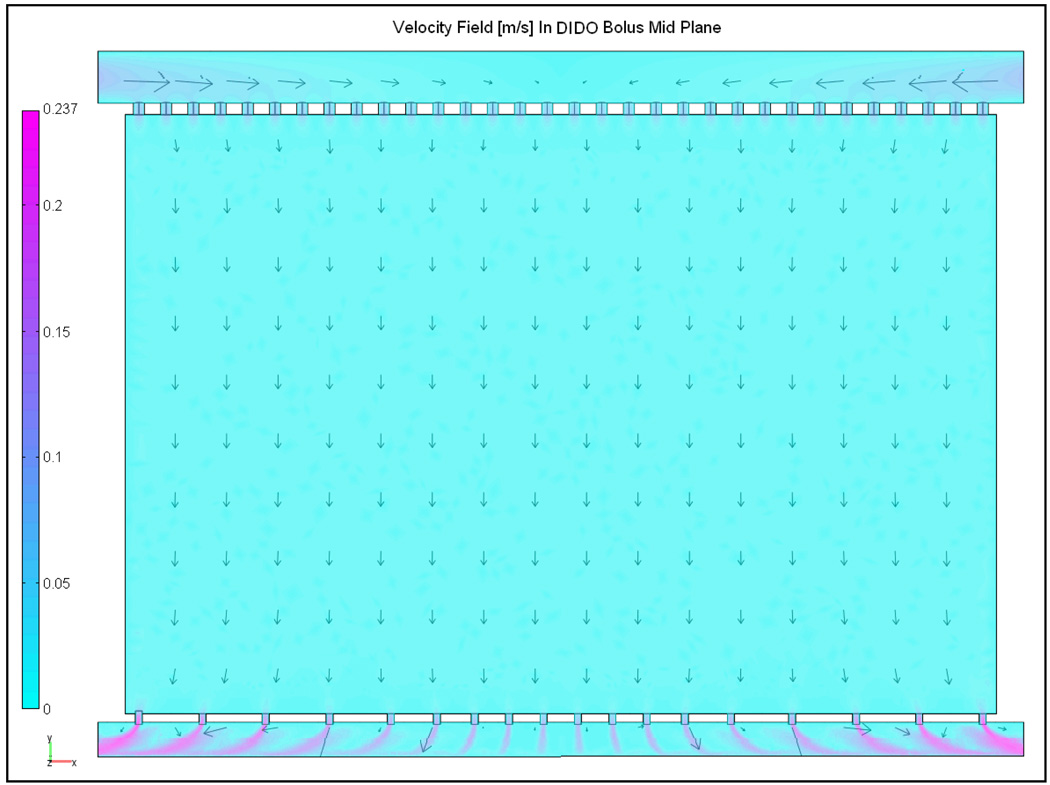
Steady state velocity field in the mid plane of the DIDO bolus with Ds=3 cm, a0=5 mm, d0=5 mm, Dr=1.27 cm and logarithmically spaced holes in the outlet channel.
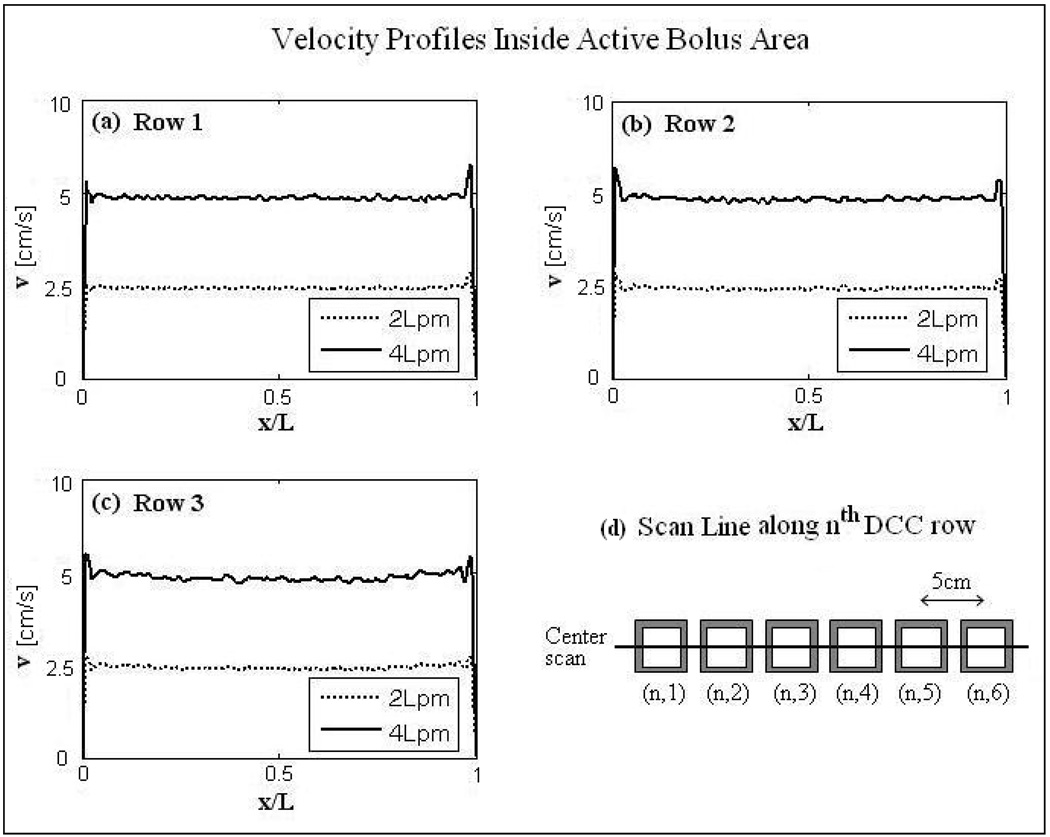
Figure 7 shows the steady velocity field in the mid plane (z=t) of the DIDO bolus with log spaced holes in the outlet channel. Figure 7 indicate nearly monotonic flow distribution across the bolus. The solid curves in Figure 6 denote the normalized fluid pressure computed on either sides of the active area of the DIDO bolus with log spaced return holes. The low variation in fluid pressure across the filter foam in Figure 6 maintained a monotonic pressure drop and nearly uniform fluid flow across the 19×32 cm active area. Figure 8 shows the steady state velocity profiles in the central plane of the DIDO waterbolus with logarithmically spaced orifices and larger diameter return tubing (Dr=1.27 cm) computed parallel to the center of each row of the 3×6 DCC array for 2 and 4 L/min flow rates. Simulation results in Figure 8 indicate uniform fluid distribution across the bolus, and a proportional increase in velocity at higher flow rate.
Figure 8.
Steady state velocity field inside the active area of the DIDO bolus of Figure 7. Velocity profiles (a)–(c) were calculated for the cross sectional cuts in the bolus mid plane parallel to the center of each row of the 3×6 DCC array for 2 and 4 L/min flow rates as shown in (d).
3.2 New Prototype Water Coupling Bolus
Figure 9 shows the prototype PVC DIDO waterbolus bag fabricated based on the numerical simulation outcome. The prototype waterbolus in Figure 9 was fabricated with the design values of the DIDO bolus model in Figure 7. The flow channels and skip seals on the inlet side of the PVC waterbolus in Figure 9 were sealed by RF welding. PVC tubing with 5 cm bending radius, sufficiently rigid to remain open under negative pressure during water circulation and still conform to contoured body surface was used for the return tubing. Vinyl medical micro tubings (Scientific Commodities Inc., Lake Havasu City, AZ) were sealed to the patient contacting side of the waterbolus for tissue surface temperature monitoring and feedback power control of the DCC antenna array during treatment.
Figure 9.
Prototype DIDO water coupling bolus with dual opposing inlet and outlet flow channels and logarithmically spaced orifices in the return tubing fabricated based on the fluid dynamics simulation outcome; design values: Ds=3 cm, a0=5 mm, d0=5 mm, Dr=1.27 cm.
3.3 Experimental Confirmation of Bolus Flow Dynamics
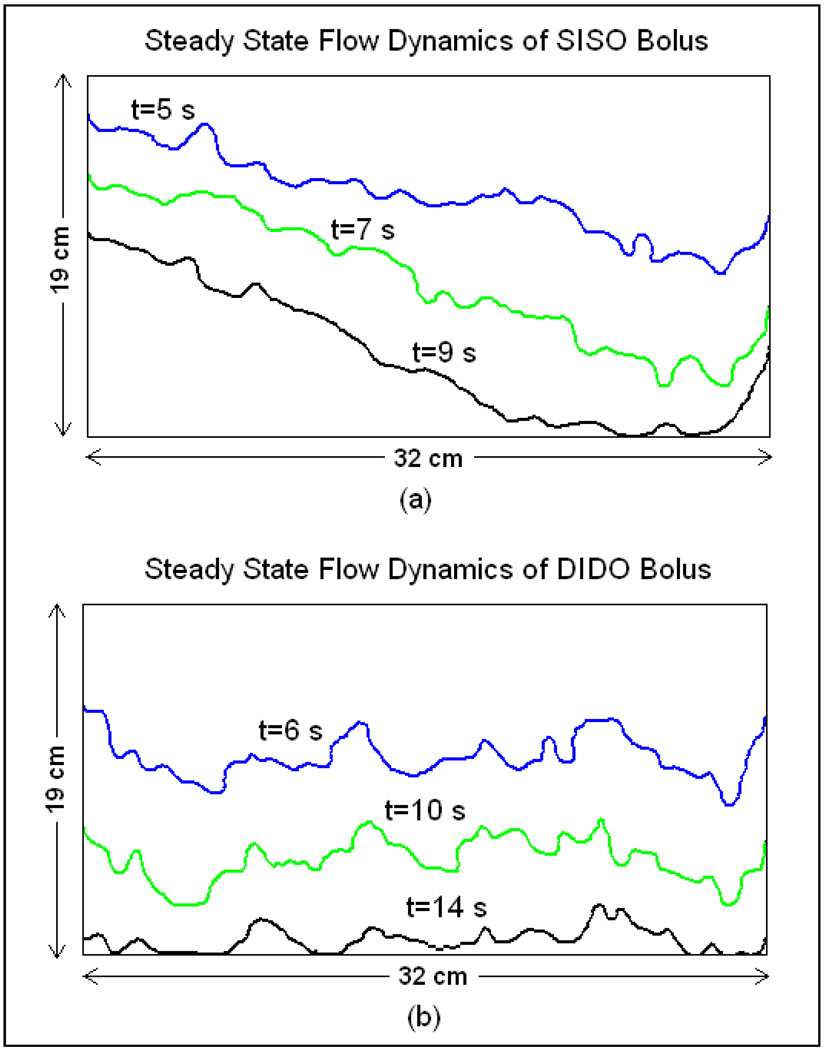
Figure 10a shows the propagation of the isothermal contour on the surface of the SISO bolus of Figure 1 as the temperature of the circulating water was switched at steady state flow. The time rate of propagation of the isothermal contour in Figure 10a indicates non-uniformity in fluid velocity with preferential volume flowing through the holes near the inlet and outlet ports of the flow channels which is in qualitative agreement with the simulation (Figure 3). Temperature variation across the SISO bolus at thermal steady state prior to switching the water bath was measured as 1.5°C with the highest variation on the left side of the bolus where the flow is much slower.
Figure 10.
Propagation of isothermal contour on the bolus surface for a step change in the circulating water temperature captured for the (a) SISO and (b) prototype DIDO water boluses at steady state fluid flow and 2 L/min flow rate.
Figure 10b shows the isothermal contours of the DIDO bolus of Figure 9. The time rate of propagation of the isothermal contour in Figure 10b indicates a nearly uniform water velocity with acceptably low variation across the bolus active area. The low variation in fluid flow across the DIDO bolus maintained a low variation in bolus surface temperatures (<0.8°C). Since the water flowing through the DIDO bolus was split using a Tee splitter on the inlet side and combined using a Tee combiner on the bolus return side, the propagation of the thermal contour in Figure 10b is slow compared to the flow pattern of the SISO bolus in Figure 10a. It should be noted that the measured flow patterns in Figure 10 observed on the bolus surface is due to convective and conductive heat transfer of the temperature controlled circulating water. Thus, the flow pattern measurements of Figure 10 is only a qualitative measure of the bolus flow dynamics unlike the fluid velocity fields computed in the simulations. The discrepancy in the simulated (Figure 7) and measured (Figure 10b) DIDO bolus flow dynamics is acceptably low and indicates the difference between an ideal numerical model and real world. Nonetheless, the steady state flow pattern and surface temperature distributions across the 19×32 cm bolus are superior for the new DIDO water bolus compared to the previously used SISO bolus.
4. Discussion
The SISO water bolus of Figure 1 initially designed for use with multi-element DCC array applicator is adequate to maintain sufficient flow and temperature uniformity across smaller SISO bolus bags. The velocity and pressure distributions of the SISO bolus in Figure 3–Figure 5 for a 19×32 cm active area indicate non-uniform flow for larger size applicators. The tissue beneath the low flow regions of the SISO bolus experiences poor thermal transfer with the slow circulating water leading to thermal hot spots when irradiated with EM energy [31]. As applicator size increases, the pressure gradient across the bolus increases resulting in increasingly non-uniform flow and inhomogeneous tissue surface temperature distributions, unless the flow channels are optimized to operate at higher flow rates. Several papers on the guide lines for using water bolus [22, 25] and surface temperature distributions maintained by different bolus configurations [18–21, 23–27] describe the importance of the water coupling bolus in hyperthermia treatments. A detailed analysis on the convective heat transfer across the SISO bolus on tissue surface temperature distribution when irradiated by the DCC microwave antenna array is reported in [31]. The analysis revealed the limitations of the SISO water bolus configuration for large applicator arrays and higher flow rates. Thus, we studied steady state bolus flow dynamics for varying values of bolus design variables and flow configurations (SISO and DIDO) to aid in the fabrication of conformal water bolus with nearly uniform flow and temperature distribution for use with large multi-element hyperthermia applicators.
Pressure curves of the SISO bolus model with wider flow channels in Figure 5 indicate a reduced variation in and an increased variation in as the channel width (Ds) was increased. The increase in flow cross section on the inlet channel due to increase in Ds reduced the pressure drop along the fluid flow path and laterally above the active area as discussed in [32]. On the return side, variation in increased with increase in Ds because the flow cross section of the outlet channel (Dr) was not large enough to minimize the friction and fluid momentum effects acting on the fluid pressure [33–35]. Being a reverse manifold fluid network, as mentioned in [33–35], sufficiently larger diameter tubing is required on the return side of the SISO bolus to minimize variation in fluid pressure in the outlet channel and subsequently inside the active bolus area.
Due to practical design limitations on the return tubing diameter, an alternate flow configuration with dual opposing feed and suction ports was studied in an attempt to minimize pressure variation along the flow channels of the 19×32 cm bolus. This DIDO bolus configuration is a combination of reverse and forward manifold fluid flow networks discussed in [33–35]. In the DIDO bolus models investigated in Figure 6, superposition of equal volume fluid flowing from opposite directions compensated the pressure drop along the flow path. The variation in pressure along the inlet channel lowered with increasing inlet channel width (Ds) as observed in Figure 5. On the outlet side, suction from both ends of the return tubing reduced the fluid path length towards the exit ports. This reduction in path length reduced the frictional loss and fluid momentum effects acting on fluid pressure [33, 35], resulting in a significantly lower variation in (Figure 6b) compared to the SISO bolus (Figure 5b). The variation in the pressure curves of Figure 6b resulted in a progressively decreasing flow rate through the perforated filter foam with lower flow towards the center (x=L/2) compared to the ends (x=0, x=L). The decrease in flow towards the center of the bolus active area was minimized by changing to a logarithmic spacing of holes on the return tube without having to increase the outlet channel diameter (Dr). Simulation data of Fig 7–Fig 8 of the DIDO bolus with logarithmically spaced holes in the outlet channel indicated nearly uniform fluid flow across the 19×32 cm bolus with and (solid curves in Figure 6) and, proportional increase in fluid velocity over the desired range of flow rates.
The steady state flow pattern of the SISO waterbolus with narrow flow channels in Figure 10a indicate non-uniform flow with a relatively higher flow on the right and reduced flow on the left. Empirically derived steady state flow dynamics of the SISO waterbolus showed qualitative agreement with the simulation data of Figure 3 (arrows). Regions with lower flow in Figure 10a resulted in surface temperature variation as high as 1.5°C across the SISO bolus. The isothermal contours of the prototype DIDO waterbolus of Figure 9 indicated a nearly uniform flow across the bolus with acceptably low variation in Figure 10b. The surface temperature variation across the 19×32 cm DIDO bolus was less than 0.8°C at steady state, almost 50% improvement in thermal homogeneity. The steady state fluid dynamics of the prototype DIDO waterbolus in Figure 10b is in qualitative agreement with the simulation data of Figure 7. Compared to the SISO waterbolus, measured variations in steady state fluid flow and surface temperature across the 19×32 cm bolus are acceptably low for the new DIDO water bolus. Nearly uniform bolus flow distribution at higher flow rates is expected to improve convective heat transfer across the tissue surface and minimize surface thermal heterogeneities during hyperthermia treatment of large area tissue disease using the DCC array.
5. Conclusion
A new conformal waterbolus configuration allowing higher flow rates without turbulence and improved fluid flow distribution over a large surface area was studied for large multielement superficial hyperthermia applicators. Numerical simulations indicate that the bolus flow distribution is characterized solely by internal fluid pressure along the flow channels and nearly uniform bolus flow distribution can be maintained by minimizing variation in the internal fluid pressure across the bolus active area. Nearly uniform flow distribution across the bolus leads to nearly uniform convective heat transfer from the circulating temperature controlled water. This enables the water coupling bolus to effectively regulate tissue surface temperature inhomogeneity during hyperthermia treatment, particularly as the applicator size is increased to treat large area superficial disease.
In this effort we have shown that water bolus with nearly uniform flow and low variation in surface temperature distribution can be designed for large superficial hyperthermia applicators using wider dual opposing flow channels as in Figure 9. Steady state fluid flow patterns of the SISO and prototype DIDO water boluses show significant improvement in flow distribution, in agreement with fluid dynamics simulation data. With the improvement in flow distribution, surface temperature variation over the 19×32 cm active area of the DIDO bolus was reduced below 0.8°C. Bolus flow pattern measurements indicate that the new DIDO waterbolus configurations with larger diameter return tubing are capable of maintaining a nearly uniform flow distribution and effectively homogenizing surface temperatures under large array applicators used in hyperthermia treatment of chest wall recurrence of breast cancer.
Acknowledgements
This effort was supported by NIH Grants R44 CA104061 and RO1 CA70761. The authors would like to express their appreciation of efforts from Edward Markowitz and Tamara Masters at Bionix Development Corp for their contribution to bolus fabrication. The authors would also like to thank Roberto Berruti from Ditta Schinetti, Torino, Italy for important suggestions about manifold feed networks.
References
- 1.Jones E, et al. Randomized trial of hyperthermia and radiation for superficial tumors. Journal of Clinical Oncology. 2005;23(13):3079–3085. doi: 10.1200/JCO.2005.05.520. [DOI] [PubMed] [Google Scholar]
- 2.Kapp DS. Efficacy of adjuvant hyperthermia in the treatment of superficial recurrent breast cancer: confirmation and future directions. International Journal of Radiation Oncology, Biology and Physics. 1996;35(5):1117–1121. doi: 10.1016/0360-3016(96)00288-x. [DOI] [PubMed] [Google Scholar]
- 3.Sneed PK, et al. Survival benefit of hyperthermia in a prospective randomized trial of brachytherapy boost +/− hyperthermia for glioblastoma multiforme. International Journal of Radiation Oncology, Biology and Physics. 1998;40(2):287–295. doi: 10.1016/s0360-3016(97)00731-1. [DOI] [PubMed] [Google Scholar]
- 4.Vernon CC, et al. Radiotherapy with or without hyperthermia in the treatment of superficial localized breast cancer: Results from five randomized controlled trials. International Journal of Radiation Oncology, Biology and Physics. 1996;35(4):731–744. doi: 10.1016/0360-3016(96)00154-x. [DOI] [PubMed] [Google Scholar]
- 5.Dewey WC, et al. In: Cell biology of hyperthermia and radiation, in Radiation Biology in Cancer Research. Meyn RE, Withers HR, editors. New York: Raven Press; 1980. pp. 589–621. [Google Scholar]
- 6.Overgaard J. Simultaneous and sequential hyperthermia and radiation treatment of an experimental tumor and its surrounding normal tissue in vivo. International Journal of Radiation Oncology Biology Physics. 1980;6:1507–1517. doi: 10.1016/0360-3016(80)90008-5. [DOI] [PubMed] [Google Scholar]
- 7.Overgaard J. The current and potential role of hyperthermia in radiotherapy. International Journal of Radiation Oncology Biology Physics. 1989;16:535–549. doi: 10.1016/0360-3016(89)90470-7. [DOI] [PubMed] [Google Scholar]
- 8.Juang T, et al. Multilayer conformal applicator for microwave heating and brachytherapy treatment of superficial tissue disease. International Journal of Hyperthermia. 2006;22(7):527–544. doi: 10.1080/02656730600931815. [DOI] [PubMed] [Google Scholar]
- 9.Moros EG, et al. Simultaneous delivery of electron beam therapy and ultrasound hyperthermia utilizing scanning reflectors: a feasibility study. International Journal of Radiation Oncology Biology Physics. 1995;31(4):893–904. doi: 10.1016/0360-3016(94)00469-2. [DOI] [PubMed] [Google Scholar]
- 10.Myerson RJ, et al. Simultaneous superficial hyperthermia and external radiotherapy: Report of thermal dosimetry and tolerance to treatment. Int J Hyperthermia. 1999;15:251–266. doi: 10.1080/026567399285639. [DOI] [PubMed] [Google Scholar]
- 11.Novak P, et al. SURLAS: a new clinical grade ultrasound system for sequential or concomitant thermoradiotherapy of superficial tumors: applicator description. Medical Physics. 2005;32(1):230–240. doi: 10.1118/1.1835572. [DOI] [PubMed] [Google Scholar]
- 12.Straube WL, et al. Dosimetry and techniques for simultaneous hyperthermia and external beam radiation therapy. International Journal of Hyperthermia. 2001;17(1):48–62. doi: 10.1080/02656730150201598. [DOI] [PubMed] [Google Scholar]
- 13.Stauffer PR, et al. Progress on system for applying simultaneous heat and brachytherapy to large-area surface disease; Proc. of SPIE; San Jose: SPIE Press; 2005. [Google Scholar]
- 14.Juang T, et al. Construction of a conformal water bolus vest applicator for hyperthermia treatment of superficial skin cancer; International Conference of the IEEE Engineering in Medicine and Biology Society; San Francisco: IEEE Press; 2004. [DOI] [PubMed] [Google Scholar]
- 15.Taschereau R, et al. Radiation dosimetry of a conformal heat-brachytherapy applicator. Technology in Cancer Research and Treatment. 2004;3(4):347–358. doi: 10.1177/153303460400300404. [DOI] [PubMed] [Google Scholar]
- 16.Arunachalam Kavitha, Craciunescu Oana I, Maccarini Paolo F, Schlorff Jaime L, Markowitz Edward, Stauffer Paul R. “Progress on thermobrachytherapy surface applicator for superficial tissue disease”, Energy-based Treatment of Tissue and Assessment V; Proceedings of the SPIE; 2009. pp. 71810C–71810C-12. [DOI] [PMC free article] [PubMed] [Google Scholar]
- 17.Rossetto F, Diederich CJ, Stauffer PR. Thermal and SAR Characterization of Multielement Dual Concentric Conductor Microwave Applicators for Hyperthermia, A Theoretical Investigation. Med. Phys. 2000;27:745–753. doi: 10.1118/1.598937. [DOI] [PubMed] [Google Scholar]
- 18.Lee ER, Kapp DS, Lohrbach AW, Sokol JL. Influence of Water Bolus Temperature on Measured Skin Surface and Intradermal Temperatures. International Journal of Hyperthermia. 1994;10(1):59–72. doi: 10.3109/02656739409009332. [DOI] [PubMed] [Google Scholar]
- 19.Chan KW, McDougall JA, Chou CK. FDTD simulations of Clini-Therm applicators on inhomogeneous planar tissue models. International Journal of Hyperthermia. 1995;11(6):809–820. doi: 10.3109/02656739509052337. [DOI] [PubMed] [Google Scholar]
- 20.Chou CK, et al. Evaluation of captive bolus applicators. Medical Physics. 1990;17:705–709. doi: 10.1118/1.596470. [DOI] [PubMed] [Google Scholar]
- 21.De Bruijne M, et al. Effects of waterbolus size, shape and configuration on the SAR distribution pattern of the Lucite cone applicator. International Journal of Hyperthermia. 2006;22(1):15–28. doi: 10.1080/02656730500384297. [DOI] [PubMed] [Google Scholar]
- 22.Van Der Gaag ML, De Bruijne M, Samaras T, Van Der Zee J, Van Rhoon GC. Development of a guideline for the water bolus temperature in superficial hyperthermia. International Journal of Hyperthermia. 2006;22(8):637–656. doi: 10.1080/02656730601074409. [DOI] [PubMed] [Google Scholar]
- 23.Sherar MD, et al. A variable microwave array attenuator for use with single-element waveguide applicators. International Journal of Hyperthermia. 1994;10(5):723–731. doi: 10.3109/02656739409022450. [DOI] [PubMed] [Google Scholar]
- 24.Sherar MD, et al. Beam shaping for microwave waveguide hyperthermia applicators. International Journal of Radiation Oncology Biology Physics. 1993;25:849–857. doi: 10.1016/0360-3016(93)90315-m. [DOI] [PubMed] [Google Scholar]
- 25.Diederich CJ, Stauffer PR, Bozzo D. An improved bolus configuration for commercial multielement ultrasound and microwave hyperthermia systems. Medical Physics. 1994;21(9):1401–1403. doi: 10.1118/1.597196. [DOI] [PubMed] [Google Scholar]
- 26.Gelvich EA, Mazokhin VN. Contact flexible microstrip applicators (CFMA) in a range from microwaves up to short waves. IEEE Transactions on Biomedical Engineering. 2002;49:1015–1023. doi: 10.1109/TBME.2002.802053. [DOI] [PubMed] [Google Scholar]
- 27.Neuman DG, et al. SAR pattern perturbations from resonance effects in water bolus layers used with superficial microwave hyperthermia applicators. International Journal of Hyperthermia. 2002;18(3):180–193. doi: 10.1080/02656730110119198. [DOI] [PubMed] [Google Scholar]
- 28.Rossetto F, Stauffer PR. Effect of complex bolus-tissue load configurations on SAR distributions from dual concentric conductor applicators. IEEE Transactions on Biomedical Engineering. 1999;46(11):1310–1319. doi: 10.1109/10.797991. [DOI] [PubMed] [Google Scholar]
- 29.Rossetto F, et al. Effect of practical layered dielectric loads on SAR patterns from dual concentric conductor microstrip antennas. International Journal of Hyperthermia. 1998;14(6):513–534. doi: 10.3109/02656739809018254. [DOI] [PubMed] [Google Scholar]
- 30.Stauffer PR. In: Thermal Therapy Techniques for Skin and Superficial Tissue Disease, in A Critical Review, Matching the Energy Source to the Clinical Need. Ryan TP, editor. Vol. CR75. Bellingham, WA: SPIE Optical Engineering Press; 2000. pp. 327–367. [Google Scholar]
- 31.Birkelund Yngve, Jacobsen Svein, Arunachalam Kavitha, Maccarini Paolo, Stauffer Paul R. Flow patterns and heat convection in a rectangular water bolus for use in superficial hyperthermia. accepted. Physics in Medicine and Biology. 2009 doi: 10.1088/0031-9155/54/13/001. [DOI] [PMC free article] [PubMed] [Google Scholar]
- 32.Baijura RA. “A model for flow distribution in manifolds”. Journal of Engineering for power. 1971;vol. 93:7–12. [Google Scholar]
- 33.Johnson ST. Analysis of manifold fluid flow networks for air and liquid flow through modular electronics; Seventeenth IEEE SEMI-THERM symposium: IEEE; 2001. [Google Scholar]
- 34.Datta AB, Majumdar AK. “Flow distribution in parallel and reverse flow manifolds”. Int Journal of Heat and Fluid Flow. 1980;2(4):253–262. [Google Scholar]
- 35.Acrivos A, Babcock BD, Pigford RL. Flow distribution in manifolds. Journal of Chemical Engineering Science. 1959;10:112–124. [Google Scholar]
- 36.Baijura RA, Jones EH. Flow distribution manifolds. ASME Journal of Fluids Engineering. 1976;98:654–666. [Google Scholar]
- 37.Dow WM. The uniform distribution of a fluid flowing through a perforated pipe. Journal of Applied Mechanics, Transaction of the ASME. 1950;72:431–438. [Google Scholar]
- 38.Kubo T, Ueda T. On the characterization of divided flow and confluent flow in headers. Bulletin of Japan Socity of Mechanical Engineers. 1969;12(52):802–809. [Google Scholar]
- 39.Zienkiewicz OC, Taylor RL, Nithiarasu P. The Finite Element Method for Fluid Dynamics. Sixth edition. Elsevier; 2005. [Google Scholar]
- 40.Bars ML, Worster MG. Interfacial conditions between a pure fluid and a porous medium: implications for binary alloy solidification. Journal of Fluid Mechanics. 2006;550:149–173. [Google Scholar]
- 41.Givler RC, Altobelli SA. A determination of effective viscosity for the Brinkman-Forchheimer flow model. Journal of Fluid Mechanics. 1994;258:355–370. [Google Scholar]


