

Abstract
Hybrid quantum/classical molecular dynamics simulations of the two proton transfer reactions catalyzed by ketosteroid isomerase are presented. The potential energy surfaces for the proton transfer reactions are described with the empirical valence bond method. Nuclear quantum effects of the transferring hydrogen increase the rates by a factor of ~8, and dynamical barrier recrossings decrease the rates by a factor of 3–4. For both proton transfer reactions, the donor-acceptor distance decreases substantially at the transition state. The carboxylate group of the Asp38 side chain, which serves as the proton acceptor and donor in the first and second steps, respectively, rotates significantly between the two proton transfer reactions. The hydrogen bonding interactions within the active site are consistent with the hydrogen bonding of both Asp99 and Tyr14 to the substrate. The simulations suggest that a hydrogen bond between Asp99 and the substrate is present from the beginning of the first proton transfer step, whereas the hydrogen bond between Tyr14 and the substrate is virtually absent in the first part of this step but forms nearly concurrently with the formation of the transition state. Both hydrogen bonds are present throughout the second proton transfer step until partial dissociation of the product. The hydrogen bond between Tyr14 and Tyr55 is present throughout both proton transfer steps. The active site residues are more mobile during the first step than during the second step. The van der Waals interaction energy between the substrate and the enzyme remains virtually constant along the reaction pathway, but the electrostatic interaction energy is significantly stronger for the dienolate intermediate than for the reactant and product. Mobile loop regions distal to the active site exhibit significant structural rearrangements and, in some cases, qualitative changes in the electrostatic potential during the catalytic reaction. These results suggest that relatively small conformational changes of the enzyme active site and substrate strengthen the hydrogen bonds that stabilize the intermediate, thereby facilitating the proton transfer reactions. Moreover, the conformational and electrostatic changes associated with these reactions are not limited to the active site but rather extend throughout the entire enzyme.
Δ5-3-Ketosteroid isomerase (KSI) catalyzes the isomerization of 3-oxo-Δ5-steroids to their Δ4-conjugated isomers. The reaction occurs by a two-step general acid-base mechanism involving a dienolate intermediate (1). Kinetic studies of KSI have provided estimates of the free energy barriers for the four steps corresponding to substrate binding, two proton transfer reactions, and dissociation of product (2). A variety of mutant KSIs have been studied to identify the catalytically important residues (3–8). The three-dimensional structures of KSIs from two bacterial strains, Commamonas testosteroni and Pseudomonas putida, have been determined by X-ray crystallography and NMR (3, 4, 9–13). These two KSIs are homologous with 34% sequence identity, and the key catalytic residues of the active sites are conserved.
The catalytic efficiency of KSI approaches the diffusion-controlled limit (1). This high catalytic efficiency has been explained in terms of a wide range of factors, including electrostatic stabilization and hydrogen bonding (3, 4, 14, 15). Electronic structure calculations on model systems have illustrated the importance of hydrogen bonding in KSI (13, 16, 17). Molecular dynamics (MD) simulations of KSI have provided additional insights into the mechanistic role of hydrogen bonding (14, 15, 18–20). Experimental studies of the primary and secondary kinetic isotope effects have suggested that hydrogen tunneling is significant in these reactions (21). Moreover, systematic studies of a series of phenolates binding to KSI have enabled the evaluation of both geometric and electrostatic contributions to binding and catalysis (20, 22). Additional recent experimental studies have been directed at clarifying the role of electrostatics, geometrical discrimination, and hydrogen bond coupling in the active site of KSI (23–26).
In this paper, we present hybrid quantum/classical MD simulations aimed at elucidating the geometrical, conformational, and electrostatic changes occurring during the isomerization reaction catalyzed by KSI. Our simulations focus on KSI from Commamonas testosteroni bacteria with the Δ5-androstene-3,17-dione (5-AND) substrate. The two-step mechanism is depicted in Figure 1. In the first step, Asp38 abstracts the axial β–proton from the C4 carbon atom of the substrate to form a dienolate intermediate. The negative charge on the dienolate intermediate is thought to be stabilized by hydrogen bonds with Tyr14 and Asp99. In the second step, Asp38 transfers a proton to the axial β-position at the allylic C6 carbon atom of the substrate to form the Δ4-androstene-3,17-dione (4-AND) product.
Figure 1.

Schematic depiction of the proton transfer reactions catalyzed by KSI. In the first step, the proton transfers from the C4 atom of the substrate to the Asp38 residue. In the second step, the proton transfers from the Asp38 residue to the C6 atom of the substrate. The reactant, intermediate, and product states of the overall reaction are labeled.
To study this isomerization reaction, we performed MD simulations using an empirical valence bond (EVB) potential to generate the free energy profiles for both proton transfer steps along a collective reaction coordinate. We also calculated the contributions to the proton transfer rates from the nuclear quantum effects of the transferring hydrogen and the dynamical barrier recrossings. Nuclear quantum effects are thought to be important for this reaction based on the experimentally measured primary deuterium kinetic isotope effect of ~6 (27). In addition, we analyzed changes in key geometrical properties within the active site along the collective reaction coordinate to clarify the roles of the catalytically important hydrogen bonds. Moreover, we examined thermally averaged structures along the reaction pathway to identify conformational changes in the protein that are associated with the proton transfer reactions. An analysis of the electrostatic potentials for these thermally averaged structures provides additional insights into the changes in the electrostatic environment throughout the protein that are occurring during the proton transfer reactions.
The present work is related to several previous computational studies of KSI. In Refs. (14) and (15), MD simulations were used to characterize hydrogen bonding in the active site of KSI bound to the substrate and intermediate, but these simulations did not probe the proton transfer reactions. In Ref. (18), the EVB method was combined with classical MD free energy perturbation simulations to study the proton transfer reactions catalyzed by KSI. The methodology in the present work differs from that used in Ref. (18) because the present work includes contributions from the nuclear quantum effects of the transferring hydrogen and the dynamical barrier recrossings. The methodologies also utilize different forcefields and EVB parametrizations, and the present MD simulations were propagated for substantially longer times. In addition, the previous simulations focused on KSI from Pseudomonas putida, while the present simulations focus on KSI from Commamonas testosteroni. The previous work analyzed hydrogen bonding, as well as the electrostatic and van der Waals interaction energies, in the active site for the reactant and intermediate species. In the present work, we extend this analysis to study hydrogen bonding, conformational motions in the active site and distal loop regions, and electrostatics throughout the enzyme along the entire collective reaction coordinate for both proton transfer reactions. Our results are consistent with the previous study (18) and provide additional insights into these aspects of the KSI enzymatic reaction.
An outline of this paper is as follows. Section II describes the computational methods used in these studies. Section III presents the results of applying these methods to the two proton transfer reactions catalyzed by KSI. In the first part, we present the calculated free energy profiles, nuclear quantum effects, and transmission coefficients. In the second part, we present an analysis of the geometrical changes in the active site during the two proton transfer reactions, as well as the conformational and electrostatic changes in the entire enzyme along the reaction pathway. The conclusions are presented in Section IV.
II. Methods
A. EVB Model
A two-state empirical valence bond (EVB) potential was used to model the electronic potential energy surface for each proton transfer reaction catalyzed by KSI (28). The two proton transfer reactions are thought to be sequential, where the product of the first proton transfer reaction is the reactant of the second proton transfer reaction. Moreover, early experiments established conservation of the transferred proton (i.e., the same proton is transferred in both steps) (29). These two proton transfer steps are depicted in Figure 1. Since the Intermediate is thermally stable and the electronic coupling between the Reactant and Product states is negligible, we describe these reactions with two two-state EVB models rather than one three-state EVB model. For the first step, the two EVB states correspond to the Reactant and the Intermediate. For the second step, the two EVB states correspond to the Intermediate and the Product. The partial atomic charges for the substrate in all three states were calculated using the RESP methodology (30). For each two-state EVB model, the diagonal matrix elements V11 and V22 of the EVB Hamiltonian were described by the AMBER99 forcefield (31, 32) with modifications described below, and the energy difference Δ and the coupling V12 between the two states were obtained by fitting to the experimentally determined rate constants for the forward and backward reactions (2, 33). The ground state electronic potential energy surface for each proton transfer reaction is obtained from the lowest energy eigenvalue of the corresponding 2×2 EVB Hamiltonian.
As mentioned above, minor modifications to the AMBER99 forcefield were implemented for the diagonal matrix elements of the EVB Hamiltonians. The charge on the transferring hydrogen was found to be small, so this charge was added to the charge of the donor atom in the reactant and to the charge of the acceptor atom in the product. The resulting zero charge on the transferring hydrogen enhances the computational efficiency for the path integral calculations because the electrostatic interactions do not need to be recalculated when only the hydrogen coordinates change. In addition, small Lennard-Jones parameters were assigned to the transferring hydrogen atom to provide a more accurate description of the breaking and forming of the bonds. We determined the values of these parameters by studying the model system shown in Figure 2, where cyclohexone is used to mimic the substrate, ethanoic acid is used to mimic aspartic acid, and two water molecules are used to mimic the hydrogen-bonding network in the active site. We calculated the transition state for this model system using density functional theory (DFT) at the B3LYP/6–31G** level with Gaussian03 (34). The transition state structure donor-hydrogen distance, acceptor-hydrogen distance, and donor-acceptor distance were calculated to be 1.45 Å, 1.20 Å, and 2.65 Å, respectively. The Lennard-Jones parameters for the hydrogen were chosen so that the donor-acceptor distance for the midpoint of the first proton transfer step generated with the EVB potential was consistent with the distance of 2.65 Å obtained for the transition state of this model system. The resulting Lennard-Jones parameters for the transferring hydrogen were ε = 4.0 × 10⁻⁶ kcal/mol and σ = 1.487 Å. The resulting EVB hydrogen potential energy surfaces were found to be qualitatively consistent with those obtained from DFT calculations at the B3LYP/6–31G** level.
Figure 2.
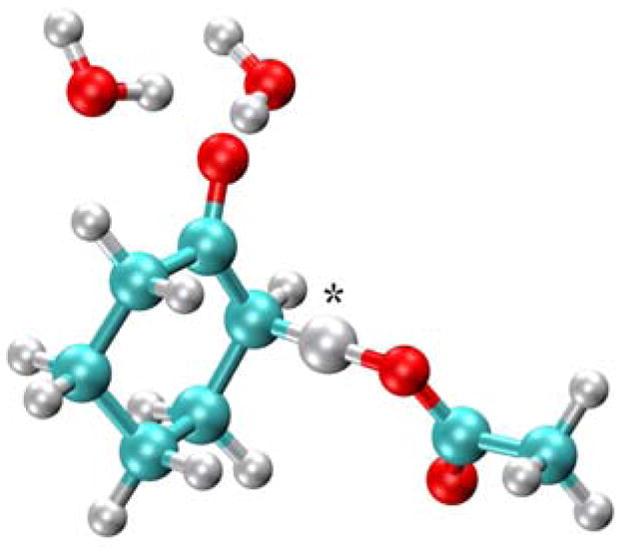
Model system of the KSI active site used to assist in the parameterization of the EVB potential. In this simple model, the substrate is represented by cyclohexone, Asp38 is represented by ethanoic acid, and Tyr14 and Asp99 are represented by water molecules to include the key hydrogen bonding interactions. The transferring hydrogen is identified with an asterisk.
We calculated the potential of mean force (PMF) for each proton transfer reaction as a function of a collective reaction coordinate that includes motions of the entire solvated enzyme. This energy gap reaction coordinate, Λ, is defined as
| (1) |
A series of biasing potentials (i.e., mapping potentials) was used to drive the reaction from the reactant to the product state. These mapping potentials are defined as (28)
| (2) |
where the mapping parameter λ is varied between zero and unity. Classical MD trajectories were propagated according to these mapping potentials, and the PMF for each mapping potential was calculated using standard binning procedures. These individual pieces of the PMF were combined to obtain the complete PMF for the unbiased EVB potential using the weighted histogram analysis method (WHAM) (35–38) or umbrella integration (39–41).
B. Calculation of rate constants
Within the framework of transition state theory (TST), the rate constant is expressed in the following form:
| (3) |
where kTST is the TST rate constant determined by the equilibrium forward flux through the dividing surface and κ is the transmission coefficient that accounts for dynamical recrossings of the dividing surface. The TST rate constant can be expressed as
| (4) |
where β = 1/kBT, kB is the Boltzmann constant, and ΔG‡ is the free energy barrier for the reaction. An alternative form for the TST rate constant in terms of the PMF along a general reaction coordinate has been derived (42–44). For simplicity, here we use Eq. (4) with the PMF barrier as the free energy barrier. The results using the alternative expression derived in Ref. (42) are very similar and are provided in Supporting Information.
The reactive flux approach can be used to calculate the transmission coefficient κ (45–49). In this approach, the transmission coefficient is calculated as the flux-weighted average of the quantity ξ for a canonical ensemble of trajectories initiated at the dividing surface and propagated backward and forward in time. The quantity ξ is defined so that ξ = 1/α for trajectories with α forward crossings and α−1 backward crossings and ξ = 0 otherwise. In practice, an equilibrium distribution of configurations near the dividing surface is selected from a simulation based on the mapping potential in Eq. (2) with the mapping parameter λ = 0.5. Initial velocities are sampled from a Maxwell-Boltzmann distribution of velocities chosen so that the initial velocity component normal to the dividing surface is positive. Starting with these initial conditions, MD trajectories are propagated backward and forward in time until they reach either the reactant or product region. The transmission coefficient is calculated from the expression (50, 51)
| (5) |
where Ṙi denotes the initial velocities, n̂i is the unit vector normal to the dividing surface, and is the weighting to ensure a canonical distribution for the EVB potential at the dividing surface. In our calculations, the dividing surface is defined as Λ = 0, where Λ is the energy gap reaction coordinate defined in Eq. (1).
The nuclear quantum effects associated with the transferring hydrogen nucleus are included using the quantized classical path (QCP) method (52–54). In this method, free particle path integral calculations are performed along a classical MD trajectory, where the transferring hydrogen is represented by a ring of beads with the centroid constrained to the classical position of the hydrogen. This method provides corrections to the classical free energy barrier that account for nuclear quantum effects such as zero point energy and hydrogen tunneling. This method has been shown to lead to similar results as Fourier grid methods (55).
C. Simulation Details
The 2.3 Å resolution crystal structure (PDB 1QJG)(12) of Commonas testosteroni Δ5-3-ketosteroid isomerase complexed with equilenin (EQU) was selected as the starting structure for the simulations. This structure has six monomeric units (i.e., three dimers) with the two mutations Asp38Asn and Ile83Thr. For computational efficiency, we used only the second dimer, monomeric units C and D, for our simulations. For simplicity, the proton transfer reactions in only one monomeric unit (Chain C) were studied. Allosteric effects between the two identical monomeric units are not thought to be significant (15). Moreover, we changed the mutated residues 38 and 83 back to Asp and Ile, respectively. Finally, we replaced the EQU, which mimics the intermediate state of the substrate, 3-hydroxy-androsta-3,5-dien-17-one, back to the naturally occurring substrate, 5-AND.
The initial state of the enzyme was prepared as follows. The mutated residues 38 and 83 were restored to those in the wild-type enzyme using the profix utility in the JACKAL protein modeling package (56, 57). The protonation states for wild-type KSI were determined from the 1BUQ solution structure (11) of KSI complexed with 19-nortestosterone–hemisuccinate. This NMR structure was calculated at a pH of 7.0, which is the pH at which the experimental rates were obtained. The EQU substrate analogue was replaced with 5-AND in both active sites of the dimeric unit. For this purpose, 5-AND was optimized in the gas phase with DFT at the B3LYP/6–31G** level with Gaussian03 (34). The optimized structure of 5-AND was mapped onto EQU in the active sites of the enzyme by superimposing the C4 atom and the carbonyl oxygen of 5-AND onto the C4 atom and hydroxyl oxygen of EQU. The partial atomic charges for the 5-AND substrate, the 4-AND product, and the dienolate intermediate were determined using the RESP methodology (30), and the other forcefield parameters for these ligands were obtained from the General Amber Force Field (GAFF) (58).
The protein was immersed in a truncated octahedron box of pre-equilibrated TIP3P rigid water molecules (59, 60). All crystallographic waters within 5.4 Å of units C and D were included to preserve any significant hydrogen-bonding interactions. Six water molecules were replaced by Na+ ions to maintain charge neutrality. The total solvated enzyme system consisted of 3844 protein atoms, 6837 water molecules, and six Na+ ions, leading to a total of 24361 atoms in the system. All atoms in the system, including the water molecules, were treated explicitly. The hydrogen atoms bonded to heavy atoms were constrained to their equilibrium distances with the SHAKE algorithm (61). The Smooth Particle Mesh Ewald method (62) was used to calculate the electrostatic interactions. A modified version of the DLPROTEIN package (63) was used for these simulations.
The system was prepared for the simulations using a well-defined equilibration procedure. In the first step, the water molecules were equilibrated with 50 ps of MD for an isobaric, isothermal ensemble (NPT) at 300K with the protein fixed. Then the residues Asp38 and Thr83, which were mutated in the crystal structure but restored to the wild-type residues for the simulations, were optimized (i.e., the energy was minimized with respect to their coordinates) with the protein and water molecules fixed. Subsequently, the water molecules and ions were optimized with the protein fixed, and then the entire system was optimized. During this last optimization step and for the remainder of the equilibration procedure, three constraints were applied to maintain the catalytically important hydrogen bonds. These constraints were applied to the distances between the Tyr14 hydroxyl oxygen atom and the substrate O3 atom, between the Asp99 hydroxyl oxygen atom and the substrate O3 atom, and between the carboxylic carbon of Asp38 and the substrate C4 atom. These distances were constrained to their crystal structure values of 2.56 Å and 2.57 Å and 4.42 Å, respectively, during the equilibration. Note that the hydrogen bond lengths obtained by NMR chemical shifts and fractionation factors of the dihydroequilenin complex were 2.49 ± 0.02 Å and 2.72 ± 0.02 Å for Tyr14 and Asp99, respectively (8, 64, 65). The errors in these distances in the crystal structure impact the starting configuration and initial equilibration of our MD simulations. As discussed below, however, these constraints were released prior to the equilibration for each window (i.e., for each mapping potential) and during data collection. Thus, the hydrogen bond distances are allowed to change according to the EVB potential, providing qualitatively meaningful but not quantitatively accurate values.
The system was equilibrated according to a simulated annealing procedure consisting of 50 ps of NPT MD at each temperature, where the temperature was increased from 50 K to 300 K by increments of 50K. The last step of equilibration consisted of 200 ps of MD for a canonical ensemble (NVT) at 298 K. For all of the MD simulations, the temperature and pressure were maintained with Nosé-Hoover thermostats (66, 67). The three constraints mentioned above were removed after this last step of the initial equilibration. The length of the side for the final cell was 78.77 Å. The root mean squared deviation (RMSD) between the protein backbone atoms of the final equilibrated structure and the initial crystal structure was calculated to be 1.42 Å. All MD simulations for data collection were propagated at 298 K for a canonical ensemble (NVT) with a time step of 1 fs.
For the first proton transfer step, we propagated MD trajectories using 19 different mapping potentials with values of λ = 0.05, 0.09, 0.125, 0.190, 0.250, 0.310, 0.375, 0.400, 0.440, 0.500, 0.565, 0.625, 0.690, 0.750, 0.80, 0.815, 0.875, 0.910 and 0.950. These mapping potentials span the region of the reaction coordinate from the Reactant to the Intermediate state. The window corresponding to λ= 0.05 was started from the equilibrated system described above. This structure was further equilibrated for 100 ps prior to data collection. The trajectory in the next window (λ= 0.09) was started from this equilibrated structure. Each subsequent window was started from the configuration of the previous window after 10 ps of equilibration. For each window, 100 ps of equilibration was performed prior to data collection. Two independent sets of trajectories were propagated, starting from the same equilibrated configuration but different initial velocities in the first window. In the second set of trajectories, a procedure involving gradually decreasing restraints on the hydrogen bonds between the substrate and Asp99 and Tyr14 was performed prior to the 100 ps of equilibration in each window. Over 1 ns of data was collected for each mapping potential in both sets of trajectories, leading to a total of over 40 ns of data collection for this first proton transfer step. For each of the two data sets acquired, the PMF curves were generated with WHAM using a bin size of 1.0 kcal/mol.
We followed a similar procedure to study the second proton transfer step. In this case, we propagated MD simulations using 19 different mapping potentials with values of λ = 0.05, 0.10, 0.15, 0.20, 0.25, 0.30, 0.35, 0.40, 0.45, 0.50, 0.55, 0.60, 0.65, 0.70, 0.75, 0.80, 0.85, 0.90 and 0.95. These mapping potentials span the region of the reaction coordinate from the Intermediate to the Product state. The initial configurations for the two independent sets of trajectories were chosen to be the protein conformations obtained after 1 ns of MD from the window corresponding to λ = 0.95 for the first proton transfer step. The energies of these conformations were minimized according to the mapping potential corresponding to λ = 0.05 for the second proton transfer step and were subsequently equilibrated with 100 ps of MD prior to data collection. The remainder of the procedure was identical to the one described above for the first proton transfer step. Over 1 ns of data was collected for each mapping potential for the two independent sets of trajectories, leading to a total of over 40 ns of data collection, and the PMF curves were generated for the two sets of trajectories with WHAM.
In the path integral QCP calculations, each quantum hydrogen nucleus was represented by a ring of 16 beads. The quantum distribution for each classical configuration was equilibrated over 100 three-level bisection steps. Data was collected over 1000 three-level bisection steps with quantum energies stored every 10 steps. We confirmed that the number of beads, equilibration steps, and data collection steps were sufficient for this system. We performed QCP calculations treating only the transferring hydrogen nucleus quantum mechanically and treating the two hydrogen nuclei involved in the hydrogen bonds between the substrate and Tyr14 and Asp99, as well as the transferring hydrogen nucleus, quantum mechanically. For the latter QCP calculations, the SHAKE constraints applied to the O–H bonds in Tyr14 and Asp99 during the generation of classical configurations were removed.
We used the reactive flux approach described above to calculate the transmission coefficients. For these calculations, we selected 100 configurations that were within 2.5 kcal/mol of the dividing surface. For each configuration, 100 sets of initial velocities were assigned according to a Maxwell-Boltzmann distribution. Each trajectory was propagated forward and backward in time with a time step of 0.01 fs until it reached the reactant or product region. The transmission coefficient was calculated for these 104 trajectories using Eq. (5) for each of the two data sets for each proton transfer step.
III. Results and Discussion
A. Rate calculations: PMFs, nuclear quantum effects, transmission coefficients
As described above, we generated 40 ns of MD data using a series of mapping potentials for each proton transfer step. We used this data to calculate the classical free energy profiles (i.e., the PMF curves) for each proton transfer step using both WHAM and umbrella integration and found that the barrier is the same to within 0.5 kcal/mol for these two methods. The PMF curves for the two proton transfer steps are depicted in Figure 3. For each step, we generated separate PMF curves for the two data sets to test convergence and reproducibility. For the first proton transfer step, the PMF barrier is 10.3 and 9.7 kcal/mol for the first and second data sets, respectively. For the second proton transfer step, the PMF barrier is 10.1 and 9.7 kcal/mol for the first and second data sets, respectively. A comparison between the two data sets, as well as between the use of WHAM and umbrella integration, suggests that the error in the PMF barrier due to numerical procedures is ~1.0 kcal/mol.
Figure 3.
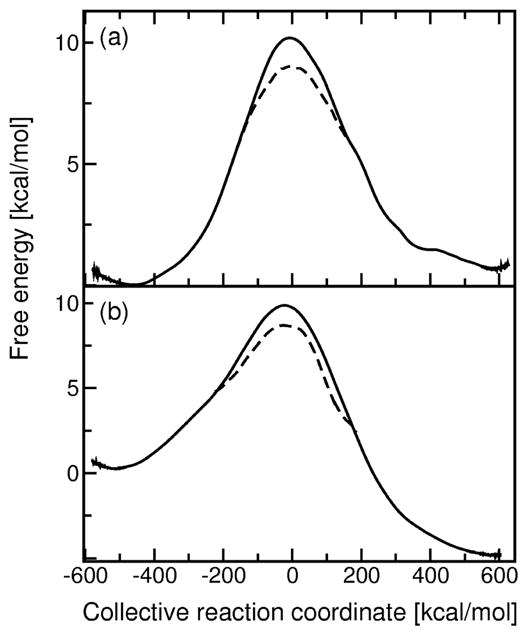
Free energy profiles calculated for (a) the first proton transfer step and (b) the second proton transfer step catalyzed by KSI. These PMF curves were generated along an energy gap collective reaction coordinate using two-state EVB models with a series of mapping potentials. The QCP free energy profiles, which include the nuclear quantum effects of the transferring hydrogen, are indicated by the dashed lines in the barrier region.
We also analyzed the impact of nuclear quantum effects and dynamical barrier recrossings. We found that treatment of the transferring hydrogen nucleus quantum mechanically with the QCP method lowers the classical free energy barrier by 1.2 kcal/mol and 1.3 kcal/mol for the first and second proton transfer steps, respectively. For the first proton transfer step, we also performed the QCP calculations with a quantum treatment of the two hydrogen nuclei involved in the hydrogen bonds between the substrate and Tyr14 and Asp99, as well as the transferring hydrogen nucleus. The quantum treatment of these additional two hydrogen nuclei does not significantly impact the free energy barrier. We calculated the transmission coefficients κ using the reactive flux approach described above. For the first proton transfer step, κ = 0.26 and 0.28 for the first and second data sets, respectively. For the second proton transfer step, κ = 0.25 and 0.26 for the first and second data sets, respectively. The magnitudes of the transmission coefficients indicate that dynamical barrier recrossings occur but only impact the overall rate constant by a factor of ~3.
Table 1 provides the calculated rate constants. The experimentally measured values are also provided for comparison. These values indicate that both proton transfer steps are partially rate-limiting in the overall two-step reaction (i.e., the two rate constants are similar). The EVB parameters V12 and Δ were fit so that the TST rate constants reproduce the experimentally estimated forward and backward rate constants for each proton transfer step (2, 33). Since the nuclear quantum effects increase the rate and the dynamical barrier recrossings decrease the rate, the two effects counteract each other, and the inclusion of both effects together does not significantly impact the rate constant. The results obtained using the alternative rate constant expression given in Ref. (42) are given in Supporting Information. Our objective is to generate a qualitatively reasonable potential energy surface that enables us to analyze the geometrical, conformational, and electrostatic changes in the enzyme during the proton transfer reactions. We found that these analyses were virtually indistinguishable using the parameters obtained with the two different rate constant expressions.
Table 1.
Rate constantsf for the two proton transfer reactions catalyzed by KSI.
| Rate constantsa | Experimentalb | kTSTc | kTST with QCPd | ktote |
|---|---|---|---|---|
| k1 | 1.7 × 10⁵ | 1.7 × 10⁵ | 1.3 × 10⁶ | 3.6 × 10⁵ |
| k−1 | 5.6 × 10⁵ | 5.6 × 10⁵ | 4.3 × 10⁶ | 1.2 × 10⁶ |
| k2 | 2.1 × 10⁵ | 2.1 × 10⁵ | 1.8 × 10⁶ | 4.6 × 10⁵ |
| k−2 | 40 | 40 | 343.2 | 89.2 |
The EVB parameters used in all calculations for this table were V12 = 102.6 kcal/mol and Δ = 3.8 kcal/mol for the first step and V12 = 98.2 kcal/mol and Δ = −14.45 kcal/mol for the second step.
kTST was calculated with Eq. (4).
The QCP method includes the nuclear quantum effects of the transferring H.
ktot was calculated with Eq. (3) and includes nuclear quantum effects and barrier recrossings.
Rate constants given in s−1.
B. Geometrical changes in the active site
By construction, the EVB potential energy surface provides a qualitatively reasonable description of the changes in bonding and charge localization during the two proton transfer steps. During the first proton transfer step, the donor carbon atom smoothly transitions from exhibiting characteristics associated with sp3 to those associated with sp2 hybridization. Moreover, the substrate C3-O3 bond increases and the magnitude of the negative charge on the O3 atom increases during the first proton transfer step, which results in the dienolate intermediate form of the substrate. A snapshot of the dienolate intermediate is depicted in Figure 4. The reverse process occurs during the second proton transfer step, in which the dienolate intermediate is transformed into the final product. Specifically, the substrate C3-O3 bond decreases and the magnitude of the negative charge on the O3 atom decreases during the second proton transfer step. Concurrently, the acceptor carbon atom smoothly transitions from exhibiting characteristics associated with sp2 to those associated with sp3 hybridization.
Figure 4.
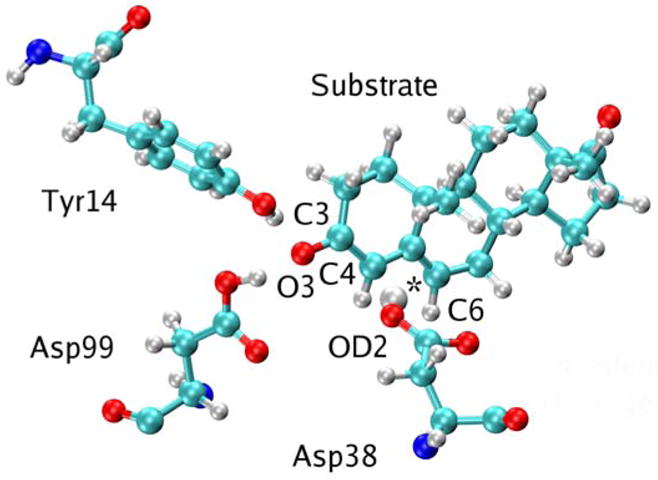
Snapshot of the KSI active site for the Intermediate state shown in Figure 1. The snapshot was obtained from the MD simulation of the first proton transfer step with the mapping potential corresponding to λ = 0.95. The proton has transferred from the substrate to Asp38, and residues Tyr14 and Asp99 are hydrogen bonded to the substrate, which is in the dienolate form. The transferring hydrogen is identified with an asterisk.
In order to study the conformational changes occurring during these two proton transfer steps, we calculated thermally averaged distances and angles in the active site along the collective reaction coordinate. Distances and angles involving catalytically important residues were sampled with the mapping potentials, and standard binning procedures were used to calculate biased distributions for these quantities. Subsequently, the contributions from the individual mapping potentials were unbiased and combined using the WHAM procedure that was used to generate the PMFs. This procedure resulted in the generation of curves corresponding to the thermally averaged distances and angles over the entire relevant range of the collective reaction coordinate.
Figure 5 depicts the thermally averaged distances between the donor, acceptor, and transferring hydrogen atoms for the first and second proton transfer steps. For the first proton transfer step, the donor atom is the substrate C4 atom, and the acceptor atom is the Asp38 carboxylate oxygen atom closest to the substrate C4 atom. For the second proton transfer step, the donor atom is the protonated carboxylate oxygen atom in Asp38, and the acceptor is the substrate C6 atom. The donor-hydrogen distance increases and the acceptor-hydrogen distance decreases for both proton transfer reactions. The donor-acceptor distance exhibits a minimum value at the transition state, which is defined as Λ = 0. For the first proton transfer step, the donor-acceptor distance starts at 2.87 Å, decreases to 2.66 Å at the transition state, and then increases to 2.97 Å at the end of the first proton transfer step. The transition state donor-acceptor distance of 2.66 Å is in agreement with the value obtained from DFT calculations for the model system described above. For the second proton transfer step, the donor-acceptor distance starts at 2.97 Å, decreases to 2.67 Å at the transition state, and then increases to 2.85 Å. Note that the first and last mapping potentials for each step represent mixtures of the two EVB states dominated by the first and second states, respectively, to prevent the substrate from dissociating.
Figure 5.
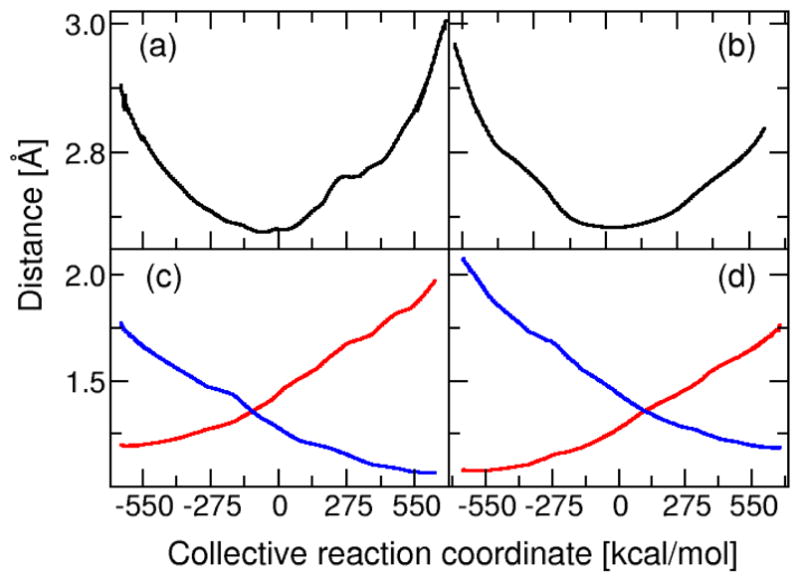
Thermally averaged distances within the proton transfer interface calculated along the collective reaction coordinate for the two proton transfer reactions catalyzed by KSI. For the first proton transfer step, the substrate C4 atom is the donor and the Asp38 OD2 atom is the acceptor. For the second proton transfer step, the Asp38 OD2 atom is the donor and the substrate C6 atom is the acceptor. The donor-acceptor distance is depicted for the first step in (a) and the second step in (b). The donor-hydrogen (red) and acceptor-hydrogen (blue) distances are depicted for the first step in (c) and the second step in (d).
We also examined the catalytically important hydrogen bonds formed in the active site. In particular, we analyzed the hydrogen bonds between the substrate O3 atom and both Asp99 and Tyr14. These hydrogen bonds stabilize the dienolate intermediate and are thought to enhance the enzymatic rate relative to the non-enzymatic rate. In addition to analyzing these distances, we also analyzed the hydrogen bond between Tyr14 and Tyr55. Analysis of the crystal structure of the Tyr55Phe mutant suggested that Tyr55 may play a minor role in positioning Tyr14 to optimize its hydrogen bond with the substrate (68). Since the Tyr55Phe mutation decreases kcat by only four-fold, while the Tyr14Phe mutation decreases kcat by 104.7-fold (69), however, Tyr55 is not thought to contribute significantly to catalysis. Figure 6 depicts the changes in these hydrogen bonds during the isomerization reaction. Figures 5 and 6 were generated from the first data set. The analogous figures generated from the second data set are qualitatively similar and are provided in Supporting Information.
Figure 6.
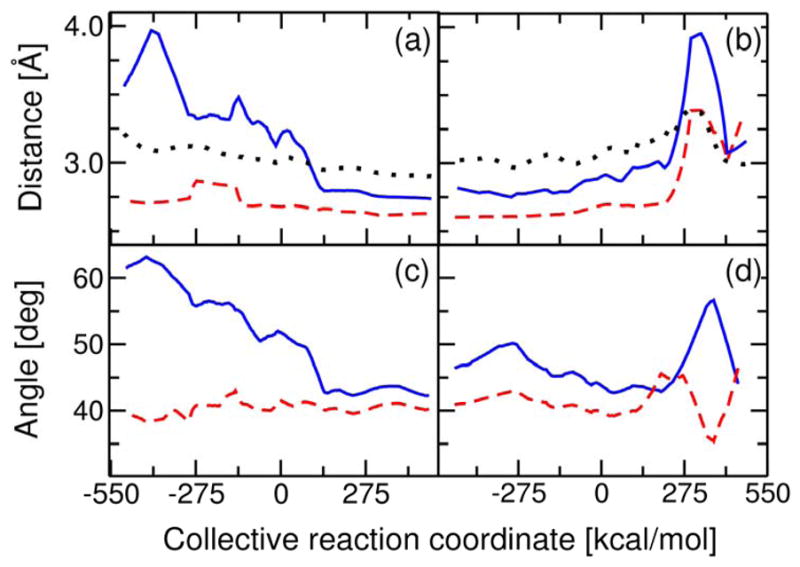
Thermally averaged distances and angles within the active site calculated along the collective reaction coordinate for the two proton transfer reactions catalyzed by KSI. The hydrogen bond donor-acceptor distances between the substrate O3 atom and Tyr14 (solid blue), between the substrate O3 atom and Asp99 (dashed red), and between Tyr14 and Tyr55 (dotted black) are depicted for the first step in (a) and the second step in (b). The angles Tyr14-Asp99-SubstrateO3 (solid blue) and Asp99-Tyr14-SubstrateO3 (dashed red) are depicted for the first step in (c) and the second step in (d). These angles are defined in terms of the heavy atoms involved in the hydrogen bonds between the substrate and both Tyr14 and Asp99.
Figures 6a and 6b depict the changes in hydrogen bond distances during isomerization. Figure 6a depicts the thermally averaged hydrogen bond distances along the collective reaction coordinate for the first proton transfer step. These data indicate the presence of a hydrogen bond between the substrate and Asp99 throughout this proton transfer reaction. In contrast, the hydrogen bond between Tyr14 and the substrate is virtually absent for the first part of the reaction but is formed by the end of the reaction. Figure 6b depicts the thermally averaged hydrogen bond distances for the second proton transfer step. In this step, the hydrogen bond distances between the substrate and both Asp99 and Tyr14 remain relatively constant during the first part of the reaction but increase in the later part of the reaction. This increase and the numerical fluctuations at the end of the second step are due to partial dissociation of the product. The Tyr14-Tyr55 hydrogen bond distance remains relatively constant and independent of the hydrogen bond distance between Tyr14 and the substrate for both steps.
Note that the hydrogen bond distances between the substrate and both Asp99 and Tyr14 in the Intermediate state are larger than the values obtained from the crystal structure (12) and NMR chemical shift experiments (8, 64, 65) discussed above. Moreover, the NMR chemical shift experiments suggest that the hydrogen bond with the substrate is shorter for Tyr14 than for Asp99, and this trend is not observed in the simulations. These quantitative discrepancies in average distances may be due to limitations of the forcefield in describing hydrogen bonding. Furthermore, experiments have shown that kcat is diminished more by the Tyr14Phe mutation than by the Asp99Ala mutation (3, 4, 64, 65). The later development of the hydrogen bond between the substrate and Tyr14 observed in our simulations is not inconsistent with these experimental data. One possibility is that the catalytic rate is more sensitive to the mutation of Tyr14 than Asp99 because the hydrogen bond forms during the proton transfer reaction and thus impacts the free energy barrier more.
To monitor the changes in the orientation of the substrate during the reaction, we analyzed the thermally averaged angles for the heavy atoms involved in the hydrogen bonds between the substrate O3 atom and both Asp99 and Tyr14. Figures 6c and 6d depict these thermally averaged angles for the first and second proton transfer steps, respectively. For the first proton transfer step, the Tyr14-Asp99-O3(Substrate) angle decreases during the initial part of the reaction, and the Asp99-Tyr14-O3(Substrate) angle only fluctuates slightly during the initial part of the reaction. For the later part of the first step, these angles remain relatively constant. For the second proton transfer step, these angles remain relatively constant for the initial part of the reaction but then fluctuate significantly in the later part of the reaction. These structural rearrangements in the later part of the second proton transfer step are due to partial dissociation of the product.
This analysis of the thermally averaged distances and angles indicates that the enzyme and substrate undergo conformational changes to facilitate the proton transfer reactions. The results are consistent with the hydrogen bonding of both Asp99 and Tyr14 to the substrate. The hydrogen bond between the substrate and Asp99 appears to be present from the beginning of the first proton transfer step. In contrast, the hydrogen bond between the substrate and Tyr14 appears to be absent at the beginning of the first proton transfer step and to form nearly concurrently with the formation of the transition state for this step. Thus, the active site appears to be pre-organized to bind the substrate, but relatively small conformational changes of both the enzyme and substrate occur during the proton transfer reactions to strengthen the hydrogen bonds that stabilize the intermediate.
C. Conformational and electrostatic changes in enzyme
In addition to analyzing the thermally averaged distances, we also analyzed the thermally averaged structures of the entire enzyme-substrate complex at various stages of the proton transfer reactions. This analysis provides insight into the overall structural changes in the protein occurring during the catalytic reaction. We generated these thermally averaged structures for the reactant state, transition state, and product state of both proton transfer reactions. These structures were generated from MD trajectories obtained with mapping potentials corresponding to λ = 0.05, 0.50, and 0.95 for each proton transfer step. The thermally averaged structure for each mapping potential was obtained by minimizing the RMSD of the protein backbone with respect to a reference structure for the thousands of configurations sampled with more than 1 ns of MD using the g_confrms utility in GROMACS (70). Subsequently, the configurations were weighted and averaged in a manner that produced the thermally averaged structure for the EVB potential. Since this process may lead to non-physical bond distances and angles in the side chains, we used these average structures to analyze only the global changes in protein structure. The more specific changes were analyzed from the thermally averaged distances and angles described in Section IIIB.
Based on these thermally averaged structures, we identified conformational changes of the protein backbone that are associated with the proton transfer steps. The loop regions that exhibit significant conformational changes during the proton transfer reactions are illustrated in Figure 7. The Tyr88-Lys92 and Phe103-Gly107 loops exhibit the greatest structural rearrangements during the proton transfer reactions. We calculated RMSD values between these structures using the VMD program (71). The average RMSD between these six thermally averaged structures and an average structure for the backbone of the Tyr88-Lys92 and Phe103-Gly107 loops are 1.43 Å and 1.02 Å, respectively. The average RMSD for the backbone of the entire enzyme is 0.53 Å. Thus, the structural rearrangements in these two loop regions are significantly larger than those in the rest of the enzyme during the two proton transfer reactions. In addition, our analysis of the thermally averaged structures suggests an absence of large structural changes in the active site. The average RMSD between these six thermally averaged structures and an average structure for the backbone residues within 5 Å of the substrate, Tyr14, and Asp99 residues is 0.32 Å. This relatively low average RMSD value is consistent with experimental studies (24, 26, 72, 73).
Figure 7.
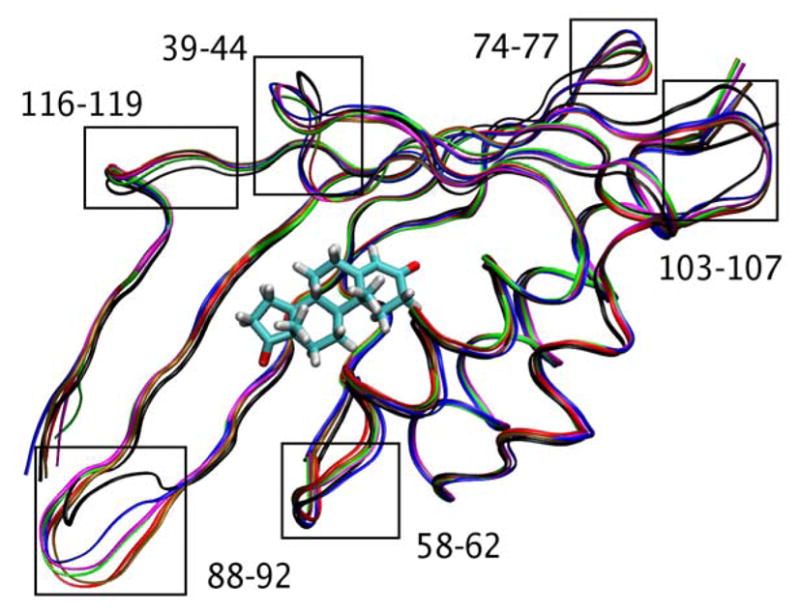
Thermally averaged structures of KSI along the reaction pathway for both proton transfer reactions. The reactant state (black), transition state (red) and product state (green) for the first proton transfer step and the reactant state (brown), transition state (magenta) and product state (blue) for the second proton transfer step are presented. The loop regions exhibiting significant structural changes are labeled. A version of this figure separating the structures for the two proton transfer steps is given in Supporting Information.
We also calculated the root mean square fluctuations (RMSF) for all Cα atoms of the protein backbone for the reactant state, transition state, and product state of both proton transfer reactions. Analogous to the generation of the thermally averaged structures, these RMSF values were generated from MD trajectories obtained with mapping potentials corresponding to λ = 0.05, 0.50, and 0.95 for each proton transfer step. The results are depicted in Figure 8. The peaks indicated by arrows correspond to the loop regions identified in Fig. 7 as exhibiting significant conformational changes during the proton transfer reactions based on the analysis of the thermally averaged structures. The more mobile loops are found to exhibit greater conformational changes during the proton transfer reactions. The red blocks underneath the data indicate the backbone residues within 5 Å of the substrate, Tyr14, and Asp99 residues. Note that the reactant state and transition state for the first proton transfer step have greater RMSF values for these active site residues. These data suggest that the active site is more mobile during the first proton transfer step than for the second proton transfer step. As mentioned above, however, the average RMSD for these active site residues among all six of the thermally averaged structures is only 0.32 Å. Thus, although the fluctuations within the active site are greater during the first proton transfer step, the average structure of the active site does not change significantly over the two proton transfer steps. The greater mobility of the active site residues in the initial stage of the chemical process may facilitate the strengthening of the hydrogen bonds between the substrate and the enzyme, as well as other relatively minor conformational changes that accompany the proton transfer reactions.
Figure 8.
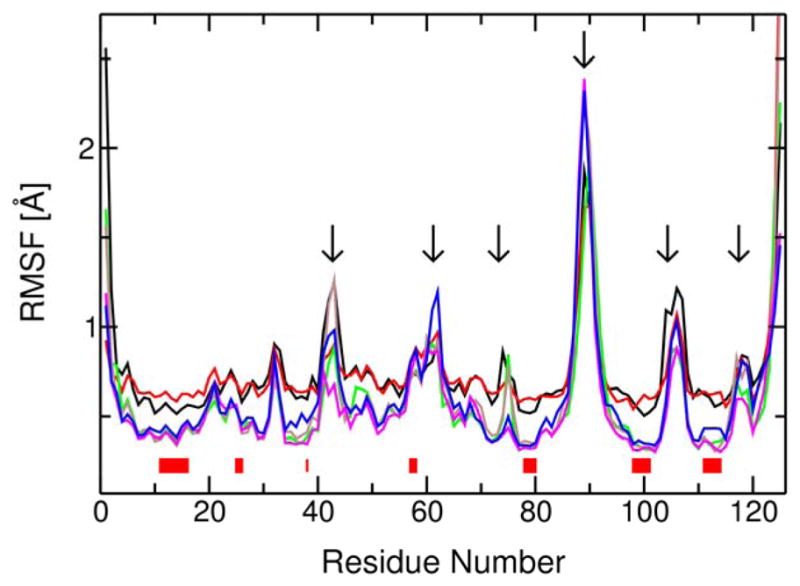
RMSF values for the Cα atoms of the protein backbone corresponding to the reactant state (black), transition state (red), and product state (green) for the first proton transfer step and the reactant state (brown), transition state (magenta), and product state (blue) for the second proton transfer step. The peaks indicated with arrows correspond to the loop regions labeled in Figure 7. The red blocks under the data identify the active site residues as defined in the text.
Figure 9 illustrates the conformational change that occurs in the Asp38 side chain to accommodate proton transfer to the C6 atom of the substrate after accepting a proton from the C4 atom of the substrate. The dihedral angle comprised of the C4 carbon on the substrate, the protonated carboxylate oxygen (OD2) on Asp38, the neighboring carbon atom on Asp38, and the other carboxylate oxygen (OD1) on Asp38 changes by 117°. These structures were obtained from the thermally averaged structure for the product of the first proton transfer step (i.e., the mapping potential with λ = 0.95 for the first step) and the reactant of the second proton transfer step (i.e., the mapping potential with λ = 0.05 for the second step). Although both structures correspond to the Intermediate state defined in Figure 1, the product of the first step has 5% contribution from the overall Reactant state, while the reactant of the second step has 5% contribution from the overall Product state. Thus, the differences between the structures shown in Figure 9 arise from the mixed nature of the states in the EVB models describing the first and second proton transfer steps. Nevertheless, this figure provides a qualitative illustration of the motion of Asp38 that occurs between the two proton transfer steps.
Figure 9.

Qualitative illustration of the conformational changes of Asp38 occurring between the first and second proton transfer steps catalyzed by KSI. The thermally averaged structures of the substrate and Asp38 are depicted for (a) the product of the first step and (b) the reactant of the second step. Although both structures correspond to the Intermediate state defined in Figure 1, each structure arises from a mixture of states in the two-state EVB models describing the two proton transfer steps. The transferring hydrogen is identified with an asterisk.
Furthermore, we calculated the electrostatic potential on the solvent accessible surface for the thermally averaged Reactant, Intermediate, and Product for the overall reaction pathway shown in Figure 1. This Intermediate structure is the thermally averaged product structure for the first proton transfer step. The electrostatic potentials were calculated by solving the nonlinear Poisson-Boltzmann equation numerically at 298 K using the Adaptive Poisson-Boltzmann Solver (APBS) utility (74) in the Pymol program (75). The PDB2PQR utility (76) was used to generate the input files for this calculation, and the charges for the residues were obtained from the AMBER99 forcefield. The dielectric constant was chosen to be 6 inside the cavity and 80 outside the cavity determined by the solvent-accessible surface. We found that the results did not change qualitatively when the dielectric constant inside the cavity was varied between 2 and 18. Note that the substrate was not included in these calculations and that the Intermediate structure has one more proton than the Reactant and Product structures.
The results of these electrostatic potential calculations are presented in Figure 10. The active site is comprised of predominantly hydrophobic residues, and the dielectric constant near Tyr14 has been estimated to be ~18 from pKa measurements (77). Figure 10 depicts the electrostatic potential on the solvent-accessible surface due to all of the charges in the system, and the red and blue colors depict the relative potentials for each particular system. Figures 9a, 9b, and 9c illustrate that the electrostatic potential in the active site is negative for the Reactant and Product but positive for the Intermediate. This trend is due mainly to the protonation of Asp38 in the Intermediate. The negatively charged dienolate form of the substrate will interact favorably with this positive electrostatic potential in the Intermediate structure. Figures 9d, 9e, and 9f depict the other side of the protein and identify regions distal from the active site exhibiting significant changes in the electrostatic potential during the proton transfer reactions. These regions correspond to some of the loop regions exhibiting structural changes in Figure 7. This analysis suggests an association between changes in the structure and electrostatic potential of these loop regions with the catalyzed proton transfer reactions, but it does not distinguish between cause and effect. Further insight into the possible catalytic role of these loop regions could be obtained by mutation experiments.
Figure 10.

Illustration of the changes in the electrostatic potential on the solvent accessible surface in KSI during the two proton transfer reactions. The electrostatic potential is depicted for the thermally averaged structures of the Reactant in (a) and (d), the Intermediate in (b) and (e), and the Product in (c) and (f) for the overall reaction pathway shown in Figure 1. The active site is identified in (a), (b), and (c). The regions exhibiting significant changes in electrostatic potential on the side of the protein opposite the active site are identified in (d), (e), and (f). The red regions correspond to negative potential and the blue regions correspond to positive potential. Since the substrate is not included in the electrostatic potential calculations, the Intermediate includes an extra positive charge in the active site from the transferred proton.
To further analyze the interaction between the substrate and the enzyme during the proton transfer steps, we calculated the average van der Waals and electrostatic interaction energies between the substrate ligand and the enzyme for the Reactant, first transition state, Intermediate, second transition state, and Product. These quantities were calculated by averaging the interaction energies over configurations sampled with more than 1 ns MD for mapping potentials with λ = 0.05, 0.5, and 0.95 for the first proton transfer step and λ = 0.5 and 0.95 for the second proton transfer step. The results are given in Table 2. The van der Waals interaction energy remains virtually constant during both proton transfer reactions, suggesting that no major structural rearrangements occur in the active site. The electrostatic interaction energy is similar for the Reactant and Product but is significantly stronger for the Intermediate. This stronger electrostatic interaction energy for the Intermediate is due to the transfer of the positively charged proton to Asp38 and the resulting redistribution of electronic charge in the substrate, as well as strengthening of the hydrogen bonds between the substrate oxygen and Asp99 and Tyr14. Note that Table 2 provides the total electrostatic interaction between the ligand and the entire enzyme, and a significant fraction of this total value is comprised of contributions from a large number of residues far from the active site due to the long-range nature of these electrostatic interactions.
Table 2.
Electrostatic and van der Waals interaction energiesb between the substrate and KSI for different states along the reaction pathway.
| State | Electrostatic | Van der Waals | Hydrogen bond electrostatica |
|---|---|---|---|
| Reactant | −29 | −35 | −6.8 |
| Transition State 1 | −58 | −31 | −11 |
| Intermediate | −99 | −32 | −16 |
| Transition State 2 | −57 | −29 | −12 |
| Product | −27 | −33 | −6.1 |
The hydrogen bond interaction energies were calculated between the carbonyl group at the C3 position of the substrate and the OH atoms on Tyr14 and Asp99 involved in hydrogen bonding with the substrate.
Interaction energies given in kcal/mol.
The specific electrostatic interaction energies between the carbonyl group at the C3 position of the substrate and the OH groups of Asp99 and Tyr14 are also given in Table 2. The electrostatic interaction energy for each hydrogen bond is −8 kcal/mol in the Intermediate state, and the van der Waals interaction energy for each hydrogen bond in the thermally averaged Intermediate state is ~2 kcal/mol, leading to an approximate interaction energy of −6 kcal/mol for each hydrogen bond. These values provide evidence for a reasonably strong hydrogen-bonding interaction in the Intermediate state (64). Moreover, the strengthening of the electrostatic interaction in the Intermediate relative to the Reactant for each hydrogen bond is 4.5 kcal/mol, which is consistent with the value of 6 kcal/mol obtained in previous EVB calculations (18). In future studies, a more quantitative analysis of the geometrical changes, electrostatic interactions, and hydrogen bonding will be performed with a quantum mechanical/molecular mechanical (QM/MM) approach in which the substrate and neighboring residues are treated quantum mechanically with a method such as DFT.
IV. Conclusions
In this paper, we performed hybrid quantum/classical MD simulations of the two proton transfer reactions catalyzed by KSI. We generated the free energy profiles for both reactions along a collective reaction coordinate. Our calculations indicate that nuclear quantum effects of the transferring hydrogen lower the free energy barriers by ~1.25 kcal/mol, increasing the rates by a factor of ~8, and dynamical barrier recrossings decrease the rates by a factor of 3–4. We also analyzed changes in thermally averaged distances and angles in the active site along the collective reaction coordinate. For both proton transfer reactions, the donor-acceptor distance decreases to ~2.66 Å at the transition state and then increases again. The thermally averaged structures illustrate the conformational change of the Asp38 side chain that occurs between the two proton transfer steps to accommodate both reactions. Specifically, the dihedral angle involving the substrate donor carbon and the carboxylate group of the Asp38 side chain changes by ~117°.
In addition, we examined the hydrogen bonding interactions within the active site of KSI during the two proton transfer reactions. Our results are consistent with the hydrogen bonding of both Asp99 and Tyr14 to the substrate and provide additional information about the formation of these hydrogen bonds. Specifically, our analysis suggests that a hydrogen bond between Asp99 and the substrate is present from the beginning of the first proton transfer step, whereas the hydrogen bond between Tyr14 and the substrate is virtually absent in the first part of this step but forms nearly concurrently with the formation of the transition state. Both of these hydrogen bonds are present throughout the second proton transfer step until partial dissociation of the product. We also found that the hydrogen bond between Tyr14 and Tyr55 is present throughout both proton transfer steps. This observation is consistent with the proposal that Tyr55 plays a minor role in positioning Tyr14 to optimize its hydrogen bond with the substrate (68). In addition, we found that the active site residues are more mobile during the first proton transfer step than during the second proton transfer step. Overall, these results suggest that relatively small conformational changes of both the enzyme and substrate strengthen the hydrogen bonds that stabilize the intermediate, thereby facilitating the proton transfer reactions.
Furthermore, we analyzed the conformational and electrostatic changes occurring throughout the protein during the proton transfer reactions. We found that the electrostatic potential in the active site is negative for the overall Reactant and Product but positive for the Intermediate due to the additional proton. The van der Waals interaction energy between the substrate and the enzyme remains virtually constant along the reaction pathway, but the electrostatic interaction energy is significantly stronger for the Intermediate than for the Reactant and Product. The mobility of the active site residues is lower for the Intermediate than for the Reactant. Moreover, we identified mobile loop regions distal to the active site that exhibit significant structural rearrangements and, in some cases, qualitative changes in the electrostatic potential during the two proton transfer reactions. These observations imply that the conformational and electrostatic changes associated with the catalyzed proton transfer reactions are not limited to the active site but rather extend throughout the entire enzyme. The possible catalytic role of these distal regions could be probed with mutation experiments.
Supplementary Material
Acknowledgments
This work was funded by NIH Grant No. GM56207.
We thank Dan Herschlag and Ari Chakraborty for helpful discussions.
Abbreviations
- KSI
ketosteroid isomerase
- EVB
empirical valence bond
- DFT
density functional theory
- PMF
potential of mean force
- WHAM
weighted histogram analysis method
- TST
transition state theory
- QCP
quantized classical path
- EQU
equilenin
- 5-AND
Δ5-androstene-3,17-dione (substrate)
- 4-AND
Δ4-androstene-3,17-dione (product)
- MD
molecular dynamics
Footnotes
Supporting Information Available: Figures 5 and 6 generated with the second data set; Table 1 and EVB parameters using the alternative TST rate constant expression derived in Ref. (42); Figure 6 generated with these alternative EVB parameters for the first data set; Figure 7 with the two proton transfer steps separated; thermally averaged structures and snapshot structures for the reactant, transition state, and product of both proton transfer reactions. This material is available free of charge via the Internet at http://pubs.acs.org.
References
- 1.Pollack RM. Enzymatic mechanisms for catalysis of enolization: ketosteroid isomerase. Bioorg Chem. 2004;32:341–353. doi: 10.1016/j.bioorg.2004.06.005. [DOI] [PubMed] [Google Scholar]
- 2.Hawkinson DC, Eames TCM, Pollack RM. Energetics of 3-oxo-Δ5-steroid isomerase: Source of the catalytic power of the enzyme. Biochemistry. 1991;30:10849–10858. doi: 10.1021/bi00109a007. [DOI] [PubMed] [Google Scholar]
- 3.Wu ZR, Ebrahimian S, Zawrotny ME, Thornburg LD, Perez-Alvarado GC, Brothers P, Pollack RM, Summers MF. Solution structure of 3-oxo-Δ5-steroid isomerase. Science. 1997;276:415–418. doi: 10.1126/science.276.5311.415. [DOI] [PubMed] [Google Scholar]
- 4.Choi G, Ha N-C, Kim SW, Kim D-H, Park S, Oh B-H, Choi KY. Asp-99 donates a hydrogen bond not to Tyr-14 but to the steroid directly in the catalytic mechanism of Δ5-3-ketosteroid isomerase from Pseudomonas putida Biotype B. Biochemistry. 2000;39:903–909. doi: 10.1021/bi991579k. [DOI] [PubMed] [Google Scholar]
- 5.Brothers PN, Blotny G, Qi L, Pollack RM. An active site phenylalanine of 3-oxo-Δ5-steroid isomerase is catalytically important for proton transfer. Biochemistry. 1995;34:15453–15458. doi: 10.1021/bi00047a009. [DOI] [PubMed] [Google Scholar]
- 6.Qi L, Pollack RM. Catalytic contribution of phenylalanine-101 of 3-oxo-Δ5-steroid isomerase. Biochemistry. 1998;37:6760–6766. doi: 10.1021/bi972745w. [DOI] [PubMed] [Google Scholar]
- 7.Thornburg LD, Henot F, Bash DP, Hawkinson DC, Bartel SD, Pollack RM. Electrophilic assistance by Asp-99 of 3-oxo-Δ5-steroid isomerase. Biochemistry. 1998;37:10499–10506. doi: 10.1021/bi980099a. [DOI] [PubMed] [Google Scholar]
- 8.Zhao Q, Abeygunawardana C, Gittis AG, Mildvan AS. Hydrogen bonding at the active site of Δ5-3-ketosteroid isomerase. Biochemistry. 1997;36:14616–14626. doi: 10.1021/bi971549m. [DOI] [PubMed] [Google Scholar]
- 9.Kim SW, Cha S-S, Cho H-S, Kim J-S, Ha N-C, Cho M-J, Joo S, Kim KK, Choi KY, Oh B-H. High-resolution crystal structures of Δ5-3-ketosteroid isomerase with and without a reaction intermediate analogue. Biochemistry. 1997;36:14030–14036. doi: 10.1021/bi971546+. [DOI] [PubMed] [Google Scholar]
- 10.Ha N-C, Kim M-S, Lee W, Choi KY, Oh B-H. Detection of large pKa perturbations of an inhibitor and a catalytic group at an enzyme active site, a mechanistic basis for catalytic power of many enzymes. J Biol Chem. 2000;275:41100–41106. doi: 10.1074/jbc.M007561200. [DOI] [PubMed] [Google Scholar]
- 11.Massiah MA, Abeygunawardana C, Gittis AG, Mildvan AS. Solution structure of Δ5-3-ketosteroid isomerase complexed with the steroid 19-nortestosterone hemisuccinate. Biochemistry. 1998;37:14701–14712. doi: 10.1021/bi981447b. [DOI] [PubMed] [Google Scholar]
- 12.Cho H-S, Ha N-C, Choi G, Kim H-J, Lee D, Oh KS, Kim KS, Lee W, Choi KY, Oh B-H. Crystal structure of Δ5-3-ketosteroid isomerase from Pseudomonas testosteroni in complex with equilenin settles the correct hydrogen bonding scheme for transition state stabilization. J Biol Chem. 1999;274:32863–32868. doi: 10.1074/jbc.274.46.32863. [DOI] [PubMed] [Google Scholar]
- 13.Oh KS, Cha S-S, Kim D-H, Cho H-S, Ha N-C, Choi G, Lee JY, Tarakeshwar P, Son HS, Choi KY, Oh B-H, Kim KS. Role of catalytic residues in enzymatic mechanisms of homologous ketosteroid isomerases. Biochemistry. 2000;39:13891–13896. doi: 10.1021/bi001629h. [DOI] [PubMed] [Google Scholar]
- 14.Park H, Merz KM., Jr Molecular dynamics and quantum chemical studies on the catalytic mechanism of Δ5-3-ketosteroid isomerase: The catalytic diad versus the cooperative hydrogen bond mechanism. J Am Chem Soc. 2003;125:901–911. doi: 10.1021/ja0208097. [DOI] [PubMed] [Google Scholar]
- 15.Mazumder D, Kahn K, Bruice TC. Computational study of ketosteroid isomerase: Insights from molecular dynamics simulation of enzyme bound substrate and intermediate. J Am Chem Soc. 2003;125:7553–7561. doi: 10.1021/ja030138s. [DOI] [PubMed] [Google Scholar]
- 16.Kim KS, Oh KS, Lee JY. Catalytic role of enzymes: Short strong H-bond-induced partial proton shuttles and charge redistributions. Proc Nat Acad Sc USA. 2000;97:6373–6378. doi: 10.1073/pnas.97.12.6373. [DOI] [PMC free article] [PubMed] [Google Scholar]
- 17.Pan Y, McAllister MA. Theoretical investigation of the role of hydrogen bonding during ketosteroid isomerase catalysis. Journal of Molecular Structure (Theochem) 2000;504:29–33. [Google Scholar]
- 18.Feierberg I, Aqvist J. The catalytic power of ketosteroid isomerase investigated by computer simulation. Biochemistry. 2002;41:15728–15735. doi: 10.1021/bi026873i. [DOI] [PubMed] [Google Scholar]
- 19.Feierberg I, Aqvist J. Computational modeling of enzymatic keto-enol isomerization reactions. Theoretical Chemical Accounts. 2002;108:71–84. [Google Scholar]
- 20.Warshel A, Sharma PK, Chu ZT, Aqvist J. Electrostatic contributions to binding of transition state analogues can be very different from the corresponding contributions to catalysis: Phenolates binding to the oxyanion hole of ketosteroid isomerase. Biochemistry. 2007;46:1466–1476. doi: 10.1021/bi061752u. [DOI] [PubMed] [Google Scholar]
- 21.Wilde TC, Blotny G, Pollack RM. Experimental evidence for enzyme-enhanced coupled motion/quantum mechanical hydrogen tunneling by ketosteroid isomerase. J Am Chem Soc. 2008;130:6577–6585. doi: 10.1021/ja0732330. [DOI] [PubMed] [Google Scholar]
- 22.Kraut DA, Sigala PA, Pybus B, Liu CW, Ringe D, Petsko GA, Herschlag D. Testing electrostatic complementarity in enzymatic catalysis: Hydrogen bonding in the ketosteroid isomerase oxyanion hole. PLoS Biology. 2006;4:501–519. doi: 10.1371/journal.pbio.0040099. [DOI] [PMC free article] [PubMed] [Google Scholar]
- 23.Sigala PA, Fafarman AT, Bogard PE, Boxer SG, Herschlag D. Do ligand binding and solvent exclusion alter the electrostatic character within the oxyanion hole of an enzymatic active site? J Am Chem Soc. 2007;129:12104–12105. doi: 10.1021/ja075605a. [DOI] [PMC free article] [PubMed] [Google Scholar]
- 24.Sigala PA, Kraut DA, Caaveiro JMM, Pybus B, Ruben EA, Ringe D, Petsko GA, Herschlag D. Testing geometrical discrimination within an enzyme active site: Constrained hydrogen bonding in the ketosteroid isomerase oxyanion hole. J Am Chem Soc. 2008;130:13696–13708. doi: 10.1021/ja803928m. [DOI] [PMC free article] [PubMed] [Google Scholar]
- 25.Kraut DA, Churchill MJ, Dawson PE, Herschlag D. Evaluating the potential for halogen bonding in the oxyanion hole of ketosteroid isomerase using unnatural amino acid mutagenesis. ACS Chemical Biology. 2009;4:269–273. doi: 10.1021/cb900016q. [DOI] [PMC free article] [PubMed] [Google Scholar]
- 26.Sigala PA, Caaveiro JMM, Ringe D, Petsko GA, Herschlag D. Hydrogen bond coupling in the ketosteroid isomerase active site. Biochemistry. doi: 10.1021/bi900713j. (in press) [DOI] [PMC free article] [PubMed] [Google Scholar]
- 27.Xue L, Talalay P, Mildvan AS. Studies of the mechanism of the Delta5-3-ketosteroid isomerase reaction by substrate, solvent, and combined kinetic deuterium isotope effects on wild-type and mutant enzymes. Biochemistry. 1990;29:7491–7500. doi: 10.1021/bi00484a019. [DOI] [PubMed] [Google Scholar]
- 28.Warshel A. Computer Modeling of Chemical Reactions in Enzymes and Solutions. John Wiley & Sons, Inc.; New York: 1991. [Google Scholar]
- 29.Batzold FH, Benson AM, Covey DF, Robinson CH, Talalay P. The Delta5-3-ketosteroid isomerase reaction: Catalytic mechanism, specificity and inhibition. Advances in Enzyme Regulation. 1976;14:243–267. doi: 10.1016/0065-2571(76)90016-9. [DOI] [PubMed] [Google Scholar]
- 30.Bayly CI, Cieplak P, Cornell WD, Kollman P. A well-behaved electrostatic potential based method using charge restraints for deriving atomic charges: The RESP model. J Phys Chem. 1993;97:10269–10280. [Google Scholar]
- 31.Cornell WD, Cieplak P, Bayly CI, Gould IR, Merz KM, Jr, Ferguson DM, Spellmeyer DC, Fox T, Caldwell JW, Kollman PA. A second generation force field for the simulation of proteins, nucleic acids, and organic molecules. Journal of the American Chemical Society. 1995;117:5179–5197. [Google Scholar]
- 32.Wang J, Cieplak P, Kollman PA. How well does a restrained electrostatic potential (RESP) model perform in calculating conformational energies of organic and biological molecules. Journal of Computational Chemistry. 2000;21:1049–1074. [Google Scholar]
- 33.Hawkinson DC, Pollack RM, Ambulos NP., Jr Evaluation of the internal equilibrium constant for 3-oxo-Delta(5)-steroid isomerase using the D38E and D38N mutants: The energetic basis for catalysis. Biochemistry. 1994;33:12172–12183. doi: 10.1021/bi00206a021. [DOI] [PubMed] [Google Scholar]
- 34.Frisch, M. J., Trucks, G. W., Schlegel, H. B., Scuseria, G. E., Robb, M. A., Cheeseman, J. R., Montgomery, J. A., Jr., Vreven, T., Kudin, K. N., Burant, J. C., Millam, J. M., Iyengar, S. S., Tomasi, J., Barone, V., Mennucci, B., Cossi, M., Scalmani, G., Rega, N., Petersson, G. A., Nakatsuji, H., Hada, M., Ehara, M., Toyota, K., Fukuda, R., Hasegawa, J., Ishida, M., Nakajima, T., Honda, Y., Kitao, O., Nakai, H., Klene, M., Li, X., Knox, J. E., Hratchian, H. P., Cross, J. B., Adamo, C., Jaramillo, J., Gomperts, R., Stratmann, R. E., Yazyev, O., Austin, A. J., Cammi, R., Pomelli, C., Ochterski, J. W., Ayala, P. Y., Morokuma, K., Voth, G. A., Salvador, P., Dannenberg, J. J., Zakrzewski, V. G., Dapprich, S., Daniels, A. D., Strain, M. C., Farkas, O., Malick, D. K., Rabuck, A. D., Raghavachari, K., Foresman, J. B., Ortiz, J. V., Cui, Q., Baboul, A. G., Clifford, S., Cioslowski, J., Stefanov, B. B., Liu, G., Liashenko, A., Piskorz, P., Komaromi, I., Martin, R. L., Fox, D. J., Keith, T., Al-Laham, M. A., Peng, C. Y., Nanayakkara, A., Challacombe, M., Gill, P. M. W., Johnson, B., Chen, W., Wong, M. W., Gonzalez, C., and Pople, J. A. (2003) Gaussian03, revision C.03 ed., Gaussian, Inc., Pittsburgh, PA.
- 35.Ferrenberg AM, Swendsen RH. New Monte Carlo technique for studying phase transitions. Phys Rev Lett. 1988;61:2635–2638. doi: 10.1103/PhysRevLett.61.2635. [DOI] [PubMed] [Google Scholar]
- 36.Ferrenberg AM, Swendsen RH. Optimized Monte Carlo data analysis. Phys Rev Lett. 1989;63:1195–1198. doi: 10.1103/PhysRevLett.63.1195. [DOI] [PubMed] [Google Scholar]
- 37.Kumar S, Rosenberg JM, Bouzida D, Swendsen RH, Kollman PA. The weighted histogram analysis method for free-energy calculations on biomolecules. I. The method. J Comput Chem. 1992;13:1011–1021. [Google Scholar]
- 38.Roux B. The calculation of the potential of mean force using computer simulations. Comput Phys Commun. 1995;91:275–282. [Google Scholar]
- 39.Kastner J, Thiel W. Bridging the gap between thermodynamic integration and umbrella sampling provides a novel analysis method: “Umbrella integration”. J Chem Phys. 2005;123:144104. doi: 10.1063/1.2052648. [DOI] [PubMed] [Google Scholar]
- 40.Kastner J, Thiel W. Analysis of the statistical error in umbrella sampling simulations by umbrella integration. J Chem Phys. 2006;124:234106. doi: 10.1063/1.2206775. [DOI] [PubMed] [Google Scholar]
- 41.Chakravorty DK, Kumarasiri M, Soudackov AV, Hammes-Schiffer S. Implementation of umbrella integration within the framework of the empirical valence bond approach. Journal of Chemical Theory and Computation. 2008;4:1974–1980. doi: 10.1021/ct8003386. [DOI] [PMC free article] [PubMed] [Google Scholar]
- 42.Watney JB, Soudackov AV, Wong KF, Hammes-Schiffer S. Calculation of the transition state theory rate constant for a general reaction coordinate: Application to hydride transfer in an enzyme. Chem Phys Lett. 2006;418:268–271. [Google Scholar]
- 43.Carter EA, Ciccotti G, Hynes JT, Kapral R. Constrained reaction coordinate dynamics for the simulation of rare events. Chem Phys Lett. 1989;156:472–477. [Google Scholar]
- 44.Schenter GK, Garrett BC, Truhlar DG. Generalized transition state theory in terms of the potential of mean force. J Chem Phys. 2003;119:5828–5833. [Google Scholar]
- 45.Neria E, Karplus M. A position dependent friction model for solution reactions in the high friction regime: Proton transfer in triosephosphate isomerase (TIM) J Chem Phys. 1996;105:10812–10818. [Google Scholar]
- 46.Bennett CH. Algorithms for Chemical Computation. American Chemical Society; Washington, DC: 1997. [Google Scholar]
- 47.Keck JC. Variational theory of chemical reaction rates applied to three-body recombinations. J Chem Phys. 1960;32:1035–1050. [Google Scholar]
- 48.Anderson JB. Statistical theories of chemical reactions. Distributions in the transition region. J Chem Phys. 1973;58:4684–4692. [Google Scholar]
- 49.Chandler D. A story of rare events: From barriers, to electrons, to unknown pathways. In: Berne BJ, Ciccotti G, Coker DF, editors. Classical and Quantum Dynamics in Condensed Phase Simulations. World Scientific; Singapore: 1998. pp. 3–23. [Google Scholar]
- 50.Billeter SR, Webb SP, Agarwal PK, Iordanov T, Hammes-Schiffer S. Hydride transfer in liver alcohol dehydrogenase: Quantum dynamics, kinetic isotope effects, and role of enzyme motion. J Am Chem Soc. 2001;123:11262–11272. doi: 10.1021/ja011384b. [DOI] [PubMed] [Google Scholar]
- 51.Billeter SR, Webb SP, Iordanov T, Agarwal PK, Hammes-Schiffer S. Hybrid approach for including electronic and nuclear quantum effects in molecular dynamics simulations of hydrogen transfer reactions in enzymes. J Chem Phys. 2001;114:6925–6936. [Google Scholar]
- 52.Hwang J-K, Chu ZT, Yadav A, Warshel A. Simulations of quantum mechanical corrections for rate constants of hydride-transfer reactions in enzymes and solutions. J Phys Chem. 1991;95:8445–8448. [Google Scholar]
- 53.Hwang J-K, Warshel A. A quantized classical path approach for calculations of quantum mechanical rate constants. J Phys Chem. 1993;97:10053–10058. [Google Scholar]
- 54.Hwang J-K, Warshel A. How important are quantum mechanical nuclear motions in enzyme catalysis? J Am Chem Soc. 1996;118:11745–11751. [Google Scholar]
- 55.Wang Q, Hammes-Schiffer S. Hybrid quantum/classical path integral approach for simulation of hydrogen transfer reactions in enzymes. J Chem Phys. 2006;125:184102. doi: 10.1063/1.2362823. [DOI] [PubMed] [Google Scholar]
- 56.Xiang Z, Honig B. Extending the accuracy limits of prediction for side-chain conformations. J Mol Biol. 2001;311:421–430. doi: 10.1006/jmbi.2001.4865. [DOI] [PubMed] [Google Scholar]
- 57.Xiang JZ, Honig B. JACKAL: A Protein Structure Modeling Package. Columbia University & Howard Hughes Medical Institute; New York: 2002. [Google Scholar]
- 58.Wang J, Wolf RM, Caldwell JW, Kollman PA, Case DA. Development and testing of a general Amber force field. J Comput Chem. 2004;25:1157–1174. doi: 10.1002/jcc.20035. [DOI] [PubMed] [Google Scholar]
- 59.Jorgensen WL, Chandrasekhar J, Madura JD, Impey RW, Klein ML. Comparison of simple potential functions for simulating liquid water. Journal of Chemical Physics. 1983;79:926–935. [Google Scholar]
- 60.Mahoney MW, Jorgensen WL. A five-site model for liquid water and the reproduction of the density anomaly by rigid, nonpolarizable potential functions. Journal of Chemical Physics. 2000;112:8910–8922. [Google Scholar]
- 61.Ryckaert JP, Ciccotti G, Berendsen HJC. J Comput Phys. 1977;23:327. [Google Scholar]
- 62.Darden T, York D, Pedersen L. Particle mesh Ewald - an N.Log(N) method for Ewald sums in large systems. Journal of Chemical Physics. 1993;98:10089–10092. [Google Scholar]
- 63.Melchionna S, Cozzini S. DLPROTEIN Version 2.1 Molecular Dynamics Software Package for Macromolecules. INFM Udr SISSA; Trieste, Italy. 2001. [Google Scholar]
- 64.Mildvan AS, Massiah MA, Harris TK, Marks GT, Harrison DHT, Viragh C, Reddy PM, Kovach IM. Short, strong hydrogen bonds on enzymes: NMR and mechanistic studies. J Mol Struct. 2002;615:163–175. [Google Scholar]
- 65.Zhao Q, Abeygunawardana C, Talalay P, Mildvan AS. NMR evidence for the participation of a low-barrier hydrogen bond in the mechanism of Δ5-3-ketosteroid isomerase. Proc Nat Acad Sci USA. 1996;93:8220–8224. doi: 10.1073/pnas.93.16.8220. [DOI] [PMC free article] [PubMed] [Google Scholar]
- 66.Nose S. A molecular dynamics method for simulations in the canonical ensemble. Molecular Physics. 1984;52:255–268. [Google Scholar]
- 67.Hoover WG. Canonical dynamics: Equilibrium phase-space distributions. Physical Review A. 1985;31:1695–1697. doi: 10.1103/physreva.31.1695. [DOI] [PubMed] [Google Scholar]
- 68.Kim D-H, Jang DS, Nam GH, Choi G, Kim J-S, Ha N-C, Kim M-S, Oh B-H, Choi KY. Contribution of the hydrogen-bond network involving a tyrosine triad in the active site to the structure and function of a highly proficient ketosteroid isomerase from Pseudomonas putida Biotype B. Biochemistry. 2000;39:4581–4589. doi: 10.1021/bi992119u. [DOI] [PubMed] [Google Scholar]
- 69.Kuliopulos A, Mildvan AS, Shortle D, Talalay P. Kinetic and ultraviolet spectroscopic studies of active-site mutants of Delta5-3-ketosteroid isomerase. Biochemistry. 1989;28:149–159. doi: 10.1021/bi00427a022. [DOI] [PubMed] [Google Scholar]
- 70.van der Spoel D, Lindahl E, Hess B, van Buuren AR, Apol E, Meulenhoff PJ, Tieleman DP, Sijbers ALTM, Feenstra KA, van Drunen R, Berendsen HJC. GROMACS. 3.2 2004. [Google Scholar]
- 71.Humphrey W, Dalke A, Schulten K. VMD - Visual Molecular Dynamics. Journal of Molecular Graphics. 1996;14:33–38. doi: 10.1016/0263-7855(96)00018-5. [DOI] [PubMed] [Google Scholar]
- 72.Zhao Q, Li Y-K, Mildvan AS, Talalay P. Ultraviolet spectroscopic evidence for decreased motion of the active site tyrosine residue of Delta5-3-ketosteroid isomerase by steroid binding. Biochemistry. 1995;34:6562–6572. doi: 10.1021/bi00019a038. [DOI] [PubMed] [Google Scholar]
- 73.Zhao Q, Abeygunawardana C, Mildvan AS. 13C NMR relaxation studies of backbone and side chain motion of the catalytic tyrosine residue in free and steroid-bound Delta5-3-ketosteroid isomerase. Biochemistry. 1996;35:1525–1532. doi: 10.1021/bi9525381. [DOI] [PubMed] [Google Scholar]
- 74.Holst M, Saied F. Multigrid solution of the Poisson-Boltzmann equation. J Comput Chem. 1993;14:105–113. [Google Scholar]
- 75.DeLano WL. The Pymol Molecular Graphics System. DeLano Scientific; San Carlos, CA: 2002. [Google Scholar]
- 76.Dolinsky TJ, Czodrowski P, Li H, Nielsen JE, Jensen JH, Klebe G, Baker NA. PDB2PQR: Expanding and upgrading automated preparation of biomolecular structures for molecular simulations. Nucleic Acids Res. 2007;35:W522–525. doi: 10.1093/nar/gkm276. [DOI] [PMC free article] [PubMed] [Google Scholar]
- 77.Li Y-K, Kuliopulos A, Mildvan AS, Talalay P. Environments and mechanistic roles of the tyrosine residues of Delta5-3-ketosteroid isomerase. Biochemistry. 1993;32:1816–1824. doi: 10.1021/bi00058a016. [DOI] [PubMed] [Google Scholar]
Associated Data
This section collects any data citations, data availability statements, or supplementary materials included in this article.