

Abstract
When cells are exposed to hormones that act on cell surface receptors, information is processed through the plasma membrane into the cell interior via second messengers generated in the inner leaflet of the plasma membrane. Individual biochemical steps along this cascade, starting with ligand binding to receptors to activation of guanine nucleotide binding proteins and their downstream effectors such as adenylate cyclase or phospholipase C, have been biochemically characterized. However, the complexity of temporal and spatial integration of these molecular events requires that they be studied in intact cells. The great expansion of fluorescent techniques and improved imaging technologies such as confocal- and TIRF microscopy combined with genetically engineered protein modules has provided a completely new approach to signal transduction research. Spatial definition of biochemical events followed with real-time temporal resolution has become a standard goal and we are breaking the resolution barrier of light microscopes with several new techniques.
Introduction
The concept of second messengers arose from the realization that many hormones and neurotransmitters do not penetrate the cell membrane but bind to receptors found on the surface of the cell. In order to communicate external cues to the cell interior, these receptors have to generate intracellular messengers to initiate a cellular response. The information flow from the cell surface receptors all the way to the response machinery of the cells, whether the response is contraction, secretion or gene activation, has been the subject of intense studies over the last 50 years. Anomalies in this pathway are underlying causes of most human diseases1-3, highlighting the importance of signal transduction research.
Classical studies targeting what are now known as G protein-coupled receptors (GPCRs) found that these receptors communicate with GTP binding proteins and activate enzymes that generate second messengers including cyclic adenosine- or guanosine monophosphates (cAMP and cGMP) 4, the Ca2+-mobilizing inositol 1,4,5-trisphosphate (InsP3) 5 or Ca2+ itself. These second messengers then activate a variety of proteins such as ion channels, transcription factors and other regulatory proteins either directly or via modulation of protein- and lipid kinases or phosphatases 6. Each of these processes has been delineated in vitro with biochemical methods using extracted cell components rapidly propelling the field. However, several observations suggest that this linear chain of information transfer is an oversimplification and that the overall increase in the concentration of second messengers do not necessarily correlate with the biological response 7. Similar cytoplasmic cAMP increases can reflect very different local cAMP elevations therefore, having completely different biological outcomes depending on the receptors or Ca2+ channels being involved 8, 9. As more and more molecular details are revealed as to how second messengers interact with their downstream targets, it is becoming obvious that these intracellular signals are highly restricted in space and time and hence it is necessary to obtain information both on their intracellular locations and temporal patterns. At the same time, significant progress is being made in our understanding of the conformational changes that occur upon activation of a large number of proteins at the structural level. The genomic era has revealed the modular nature of most signal transduction proteins and identified many basic protein folds 10 that now can be identified by simple sequence analysis tools. Moreover, fluorescence methods including the appearance of genetically encoded fluorescent proteins and the parallel advances in microscopy techniques have all contributed to the change of how signal transduction research is conducted. Current standards demand that every step in the second messenger activation cascade be followed in single living cells with spatial resolution that is breaking the limits of light microscopes (see Lidke & Wilson, and Larson et al. in this issue and Box-1). Here we summarize the current state of fluorescence techniques as they are applied to the individual elements of the information chain starting from the receptors all the way to protein kinases.
Box-1. Advances in fluorescence microscopy.
The success of fluorescence imaging tools is greatly aided by the enormous progress made in the microscopy front. Laser confocal microscopy and total internal reflection fluorescence (TIRF) microscopy made it possible to analyze signals that originate from a thin optical section of the cell thereby increasing the signal to noise ratio and spatial resolution. A further giant step was the appearance of super-resolution (SR) fluorescence microscopy, which was named “Technique of the Year, 2008” by Nature Methods 117, 118. SR refers to several recently developed techniques by which the resolution barrier of light microscopes, as defined in Abbe's law, has been broken allowing the generation of nanoscale images with light microscopy. These techniques were born out from separate efforts conducted in a handful of different laboratories and individuals 118. Some of these methods utilize single molecule fluorescent detection taking advantage of the photoactivable fluorescent indicators. Here, repeated cycles of small level of excitation followed by permanent photobleaching generates a series of images each showing the location of only a few individual molecules. The individual locations are then compiled from thousands of images to reconstruct the distribution of a large number of molecules. These methods include photoactivation localization microscopy (PALM) 119 and FPALM (fluorescence PALM) 120. A similar principle was used in stochastic optical reconstruction microscopy (STORM) using photoswitchabe dyes 121. An alternative way of increasing resolution was to use special illumination to effectively decrease the focal spot size in stimulated emission depletion (STED) microscopy 122 and saturated structured illumination microscopy (SSIM) 123. More detailed description and discussion of these techniques can be found in this issue in articles by Lippincott-Schwartz, Lidke & Wilson, and Larson et al.
Basic principles of fluorescence techniques to follow signaling events
Many studies use proteins tagged with the green fluorescent protein (GFP) or its variants 11 to determine the localization of proteins within the cell. This method has contributed tremendously to our knowledge of cell biology. Fluorescent tagging gives excellent information on the steady-state distribution of proteins, and combined with photobleaching or photoactivation it can also address the dynamics of protein trafficking 12. However, the GFP tag itself can affect localization and expressed proteins may not have their binding partner present in sufficient amounts for proper trafficking or localization sometimes leading to false results (See Fig. 1A and Snapp, in this issue).
Figure 1. Principles of fluorescent probes that report on distribution and conformational transitions of signaling molecules.

(A) Simple tagging of proteins with fluorescent tags (green) allows the monitoring of the distribution and the movements of the protein in cells but it does not address conformational transitions. (B) Reporters containing a protein domain (orange) that recognize a specific conformation (such as a phosphorylation event indicated by a red dot) can be recruited from the cytosol to the membrane upon phosphorylation of a membrane protein. However, the endogenous protein is often not sufficient to make a visible redistribution of the probe. (C) Ideal fluorescent reporters will change their properties (intensity or spectrum) upon binding of a ligand, such as the dyes used for Ca2+-measurements. (D) In a similar fashion some fluorescent molecules change their properties when their environment is changed, such as being in a more hydrophobic pocket. This allows monitoring conformational changes or protein-protein interactions with properly placed (conjugated) fluorophores. (E) In an ideal case, genetically coded fluorescent molecules (mostly circularly permutated GFP variants) can change their fluorescence properties when protein motifs woven into them bind specific ligands. (F) Classical probes based on FRET (see Box-2) where the conformational change induced by ligand binding alters the distance or orientation of the two attached fluorescent molecules causing a detectable change in FRET efficiency. See text for original citations.
It is a completely different task to design fluorescent probes that allow quantitative assessment of concentrations or activation states of molecules. Such probes have to possess conformational-specific recognition. In the simplest cases the activation status of a protein is reflected in the redistribution of the fluorescent probe within the cells: e.g., a fluorescent protein module is recruited from the cytosol to the plasma membrane when it binds to a specific conformation of a plasma membrane protein (Fig. 1B). This principle is very simple and often sufficient to follow the activation process but will not work if the amount of the probe that is moving represents only a small fraction of the total fluorescence expressed in the cytosol. In the case of most protein targets, the protein of interest also has to be transfected along with the reporter construct. However, this method is being used successfully to detect lipid messengers in the membrane (see below). The quantification of the recruitment process is not easily achievable in single cells (see 13 for some examples).
The ideal probes change their fluorescence properties in a conformational specific manner. This is best exemplified by the small fluorescent molecules used for measurements of intracellular Ca2+ or other ions 14. These probes drastically change their emission or excitation spectra upon ion binding (Fig. 1C). Similarly useful are fluorescent molecules that change their properties depending on the hydrophobicity of their environment. Such fluorescent molecules can be conjugated to recombinant proteins or attached with relatively simple chemistry to genetically encoded tags like the tetracysteine tag 15 the SNAP-tag 16 or Halotag 17, or will be recognized and highlighted by single chain antibodies 18. Proper placement of such fluorophores can effectively report a conformational change as they change their fluorescence by the changing hydrophobicity of their surroundings (Fig. 1D). Unfortunately, genetically engineered fluorescent proteins usually do not show profound spectral changes upon conformational changes of proteins to which they are attached. There are, however, exceptions to this rule, as one of the most robust Ca2+ indicators only contain a single fluorophore (a circularly permutated EGFP) placed between calmodulin and the M13 peptide from myosin light chain kinase (MLCK) 19-22 (see below) (Fig. 1E). Some fluorescent proteins show significant pH sensitivity (normally an undesirable feature) that can be utilized to monitor pH changes in vesicular compartments 23, but this cannot be used to monitor conformational transitions. This caveat is addressed by utilizing Förster resonance energy transfer (FRET) between two genetically engineered fluorescent proteins placed in the right position relative to one another (see Box-2). Although FRET is often discussed in the context of changing molecular distance, the dipole orientation of the two fluorophores also has a significant impact on the FRET efficiency that can be detected. Therefore, many of the intramolecular FRET sensors (in which both fluorophores are part of the same molecular probe) register changes in FRET – either an increase or a decrease – due to changes in orientation instead of, or in addition to, a changing distance between the two fluorophores. These principles are utilized by most currently used FRET sensors 24, 25 (Fig. 1F).
Box-2: FRET, FLIM and BRET to assess molecular proximity.
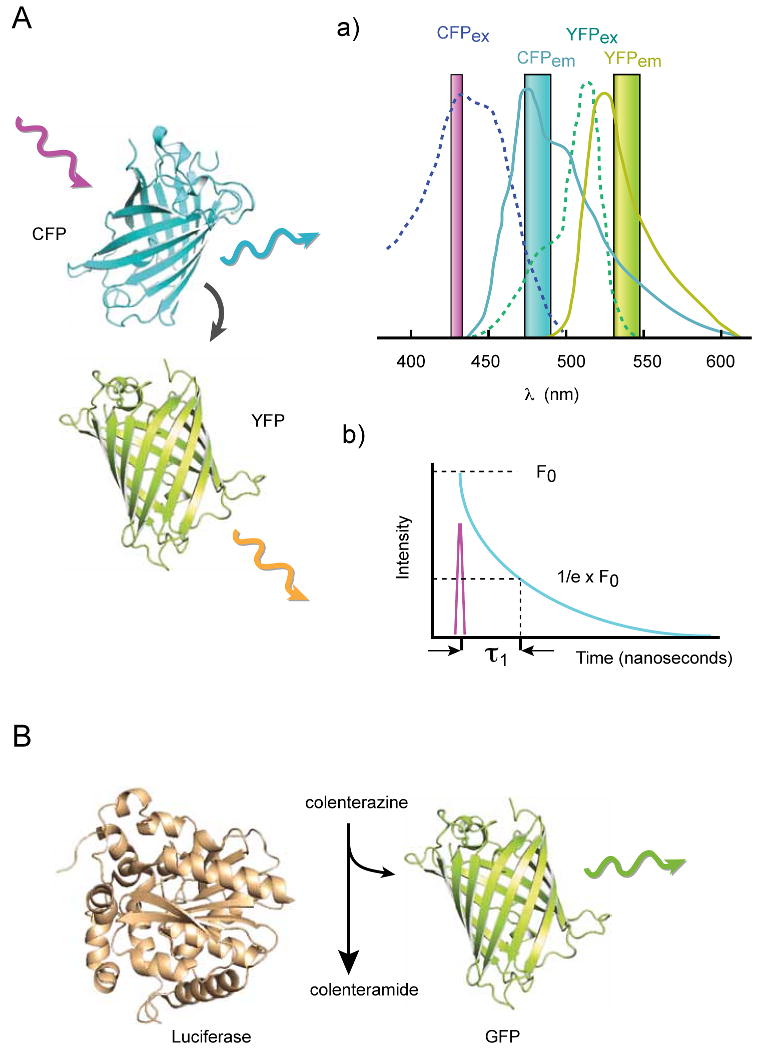
Förster resonance energy transfer (FRET) described by Theodor Förster 124 is a radiationless energy transfer between two fluorescent molecules or between a donor fluorescent molecule and a “quencher” molecule. FRET occurs when the two molecules are in close proximity and in proper dipole orientation. Since FRET efficiency decreases with the 6th power of the distance between the two partners, this principle has great potential in determining molecular proximity in the 1-10 nm range that is beyond the resolution of microscopes 125. As shown in Figure I, when two different fluorescent molecules are used for FRET (A) the emission spectra of the donor (solid cyan line in i)) has to show significant overlap with the excitation spectra of the acceptor (green dotted line). When the donor molecule is excited at its optimal wavelength and an acceptor molecule is within FRET distance, the excited donor transfers its energy directly to the acceptor instead of emitting photons. The so energized acceptor then emits photons with an energy spectrum characteristic of the acceptor. The extent of FRET can be assessed in a number of ways: in the so-called sensitized emission (i), the donor is excited (magenta bar) and the emissions of both the donor (cyan bar) and the acceptor (yellow bar) are monitored simultaneously. When the two fluorophores are within FRET distance, the donor emission decreases while the acceptor emission increases. The ratio of the two emissions is a good and simple indicator of the FRET changes. To calculate the absolute FRET values, corrections have to be made for the direct-excitation of the acceptor by the donor excitation and for the bleed-through of the two fluorophores in their respective emission channels. In the case of acceptor photobleaching, the acceptor fluorophore is photobleached and this results in an increased fluorescence of the donor if the two molecules are in FRET distance. This method is simple, but requires a strong illumination for complete photobleaching and cannot follow changes in FRET as a function of time.
A more accurate way of assessing FRET is the use of fluorescence lifetime imaging (FLIM) (ii). This technique is based on the principle that the half-life of the excited state of the donor molecule is significantly influenced by the close presence of an acceptor. The de-excitation of the excited fluorophores can occur by several pathways and the non-radiation energy transfer to an acceptor is one efficient way to depopulate the donor's excited state. Therefore, FRET results in the reduction of the donor's fluorescence lifetime. FLIM analyzes the change in lifetime of the donor fluorophore caused by the presence of an acceptor. The advantage of this method is that it is not sensitive to bleed-through since only the donor is excited and only the donor emission is analyzed. However, this method requires a special advanced microscope that may not be available. More on these techniques can be found in several excellent reviews 126, 127.
Among the genetically encoded fluorescent proteins CFP and YFP have been the most widely used donor acceptor pairs. Since GFP and these variants have a slight dimerization tendency, their monomeric versions (A206K) are recommended for these applications. YFP was replaced with the improved (less) pH sensitive and brighter Venus or Citrine while CFP with Cerulean and a plethora of new fluorescent proteins of various colors is now available as optimal FRET pairs (see 11 for a practical guide to choosing fluorescent proteins and Snapp in this issue). Another form of FRET can occur between the same fluorophore molecules (homo-FRET or energy migration). This can be estimated by time-resolved fluorescence anisotropy, which monitors any process that changes the polarization of the emitted fluorescence during the excited state such as the homo-energy transfer that occurs when the two fluorophores are close together as part of a dimer or multimer 34.
Bioluminescence energy transfer (BRET) (B) is a naturally occurring phenomenon in several marine organisms such as the jellyfish A. Victoria. Here a luciferase enzyme catalytically oxidizes a substrate (coelenterazine to colelenteramide) yielding bioluminescent light. The energy from the enzymatic reaction can be very efficiently transferred to an acceptor GFP or YFP molecule if the enzyme and the fluorophore molecule are within BRET distance (similarly to FRET) causing emission characteristic of the acceptor 128. The advantage of BRET is that no excitation light is needed and hence, the emitted photons are measured against “zero” background, and that no correction is necessary for fluorescent cross-excitation or bleed-through. However, the light emission is very low and therefore, the method is mostly used in cell population and not microscopic settings and it is not suitable to follow very rapid kinetics.
Measuring the activation state of GPCRs
GPCRs undergo a conformational change upon binding of agonist-ligands (Figure 2A). This conformational change is the result of the repositioning of the transmembrane helices that eventually affect regions in the inner side of the protein. One such change is the movement of intracellular (IC) loops (usually but not exclusively the 3rd IC loop) that affects the interaction with heterotrimeric G proteins and perhaps with other proteins such as the G protein receptor kinases (GRKs) 26. Another well-documented change is the exposure of the receptor's tail region that usually undergoes phosphorylation followed by interaction with arrestins 27. Ligand activation and the ensuing conformational change can elicit a FRET response in GPCRs tagged with a pair of fluorescent molecules (such as CFP and YFP), one placed within one of the intracellular loops and the other in the tail of GPCRs (Fig. 2B). This method was first introduced using α2-adrenergic receptors with CFP and YFP molecules added in the 3rd intracellular loop and at the end of the tail, respectively 28. Although attachment of a GFP molecule to the tails of GPCRs is well tolerated by most GPCRs, placement of a fluorescent protein of 27 kDa or so within the intracellular loops is expected to affect the receptors' ability to interact with G proteins or other downstream effectors. In the case of the α2-adrenergic receptors introducing a GFP within the region had relatively small effect on coupling to G proteins because of the large size of the 3rd intracellular loop 28. This, however, is not the case with other GPCRs. To overcome this problem, a small tetracysteine tag reacted with the arsenide fluorophore, FlAsH, instead of YFP, was introduced and proven to be a much better tolerated modification 29 (Fig. 2C). In all of these studies determining the ligand binding and coupling properties of the tagged receptors is a necessity. Such analysis showed that the binding affinity is usually well preserved, in contrast to coupling properties, which can significantly change thereby requiring fine-tuning of the placement of the fluorescent tags. Nevertheless, this method has allowed kinetic analysis of ligand-induced conformational transition-states of GPCRs in intact cells and defined differences in the conformational states evoked by agonists, antagonists or inverse agonists 30, 31. One disadvantage of these methods, beyond the possibly altered functionality of the tagged proteins, is that they require expression of a significant number of the modified receptors into cells creating a receptor density that usually does not occur in normal cells.
Figure 2. Schematics of the designs of fluorescent probes to follow GPCR and G-protein activation.

(A) Early signaling from GPCRs. In quiescent cells the receptor is associated with the heterotrimeric G protein complex composed of an α-subunit and a tightly associated βγ heterodimer. Ligand binding induces a conformational change in the receptor leading to the dissociation of Gα- and Gβγ subunits. The GDP/GTP exchange on the α-subunit results in a Gα that can activate a number of downstream effectors, such as adenylate cyclases, but the freed Gβγ dimmer is also capable of stimulating effectors molecules (B) GPCRs tagged at the C-terminus and within the 3rd intracellular loop with properly matched fluorescent proteins can detect the ligand-induced conformational change in the form of change in FRET efficiency. However, such designs can severely affect coupling of the tagged receptors to G proteins. Black arrow indicates direction of energy transfer. (C) Using smaller fluorescent tags in the 3rd loop such as the tetracysteine (‘CC…CC’) tag reacted with FlAsH, can alleviate this problem. Black arrow indicates direction of energy transfer. (D) Dissociation and/or conformational change of heterotrimeric G proteins can be monitored by FRET. Here one fluorophore is placed on the N- or C-terminus of either the Gβ or the Gγ subunits. The placement of the fluorescent molecule within the Gα subunit is a more delicate task, but successful FRET was achieved when GFP was placed between the A and B α-helices. It is important that the fluorescent protein does not interfere with the lipid modification and hence, membrane attachment of the heterotrimeric complex 116. Black arrow indicates direction of energy transfer. (E) Active (GTP-bound) forms of small GTP binding proteins can be detected by recruitment of fluorescent fusion proteins containing a recognition domain such as the RBD of Raf-1. This approach poorly detects endogenous Ras activation but has been used to monitor the activation of overexpressed Ras proteins. (F). The FRET probes to monitor activation of small GTP binding proteins are based on the design that incorporates both the small G protein and a domain recognizing its GTP-bound form sandwiched in between the two fluorescent proteins. This probe is then targeted to a membrane of interest where it registers the change in the sum of GEF and GAP activities. See text for original citations.
Similar experiments using intermolecular FRET have also been done to determine homo- or heterodimerization of GPCRs (or receptor tyrosine kinases) or their association with other proteins. However, the BRET method has gained more popularity for such studies because of its applicability for cell population measurements as opposed to imaging 32, 33 (see Box-2). Homo-dimerization of GPCRs were also studied with homo-FRET (see Box-2) between two of the same fluorophores (only one construct needs to be transfected) 34, but the measurements of fluorescence anisotropy decay needed for homo-FRET analysis requires special instrumentation.
Additional methods to determine the kinetics and conformational transitions of GPCRs have been based on environmentally sensitive fluorescent-malleimide-derivatives conjugated to cysteines placed at different positions in a receptor in which all other reactive cysteines were mutated to alanines 35, 36. This method, however, required purified receptors labeled with the respective fluorophores and did not allow studies of in situ receptors within the intact cell.
Probes to test the activation status of G-proteins
Heterotrimeric G proteins
G-protein coupling and activation is almost inseparable from GPCR functions. Heterotrimeric G proteins are membrane-associated transducing modules that consist of a larger α-subunit that is palmitoylated and smaller β and γ subunits that form a stable dimer and which is also anchored to membranes by lipid modification 37. It has long been postulated that activated GPCRs cause a dissociation of Gα and Gβγ subunits and allow the exchange of GDP to GTP within the Gα subunits, which represents the active conformation ready to engage different effector proteins 38(Fig. 2A). It is now understood that free βγ subunits can also activate several effectors including enzymes and ion channels (#2164}. What remains ambiguous is how the G-protein heterotrimer interacts with the receptor in the resting state and which of the subunits has a more important role in this interaction 39. Also debated is the question of what “dissociation” of the three subunits really means: can the dissociated subunits diffuse further away in the membrane (or even leave the membrane) or do they stay together with only their conformations being affected. The first imaging tool to visualize the distribution of activated G proteins along the cell membrane was used in Dictyostelium, where FRET between Gα and Gβγ subunits tagged with CFP and YFP, respectively, was monitored during chemotaxis 40, 41 (Fig. 2D). Similar studies used mammalian Gαi subunits tagged with YFP within the helical domains paired either with Gβ1 tagged at its N-terminus with CFP or with a Gγ2 subunit tagged either at the C- or N-terminus with CFP 42. These studies concluded that a rearrangement rather than a full dissociation takes place between these subunits during receptor stimulation. These tools have been used in combination with tagged GPCRs to monitor the “dissociation” of the G subunits from the receptors 43, but most likely the FRET changes reported in these studies only reflect a conformational change occurring between the molecular elements of the receptor-G protein complex.
Monomeric G proteins
In the first attempts to detect activation of the small GTP binding protein Ras, the Ras binding domain (RBD) of Raf-1 was fused to GFP to detect active Ras within the cells 44, 45. The RBD had already been widely used as a GST fusion protein to pull down the GTP-bound form of Ras from cell lysates as it recognizes the active Ras conformation. Unfortunately, the amount of endogenous Ras in most cells is too low to be clearly detected by these translocation-based probes, but the activation state of overexpressed Ras has been successfully monitored in live cells with them 44, 46(Fig. 2E). These studies revealed the presence of active Ras not only in the plasma membrane, but also in intracellular compartments, most prominently in the Golgi 44. In our studies the RBD of Raf-1 was not sufficient to detect active Ras alone, but required the adjacent cysteine-rich domain to work as a useful probe 45. An alternative approach to monitor Ras activation was introduced by the Matsuda group who created an intramolecular FRET probe comprising of Ras itself and the RBD linked together and tagged at the two ends with the CFP/YFP pairs 47. This probe, named Raichu, was then targeted to the plasma membrane to successfully monitor Ras activation (Fig. 2F). Raichu detects the balance of Ras-GEF and Ras-GAP activities but only in the particular cellular location where the probe is targeted and cannot report on the activation of Ras in any other cellular locations unless specifically targeted there. A great number of probes have been developed for other small GTP binding proteins using very similar principles. In the case of Rac1 the earliest studies used intermolecular (rather than single molecule intramolecular-) FRET between the G protein and its interacting effector domain tagged with the appropriate fluorophores 48 This principle was also used to monitor Rab5 activation 49. In most subsequent studies the single chain FRET sensors were preferred that used the small G-protein in question with one of its effector modules sandwiched between the two fluorophores. These included various Rab proteins 50 Rac1and Cdc42 51 or Rho 52 and many others. A detailed discussion of the advantages and disadvantages of the various designs can be found in 53.
A very different approach to monitor small G-protein activation was used by the Hahn laboratory. They employed environmentally sensitive fluorophores that were conjugated to appropriate sites in recombinant G proteins or their effectors and injected these sensors into live cells (see Fig. 1D for this principle). This method was used to image activated Cdc42 54 and RhoA 55 during cell migration. The advantage of this method is that it is more sensitive than the FRET-based probes and small amount of injected proteins is sufficient to detect the activation of the G protein without distortion of the biology. The disadvantage of the method is that it requires conjugation of the fluorophore to recombinant proteins at specific sites that can be challenging and the need for injection of the protein into cells.
Probes to measure Ca2+, cAMP, or InsP3 dynamics
The use of the fluorescent Ca2+ indicators introduced by the Tsien lab 14, 56 has revolutionized research on Ca2+ signaling and set the standard for the development of new probes for monitoring kinetic changes in other second messengers at the single cell level. In fact, it was the design of genetically encoded single molecule FRET Ca2+ sensors from the same group that has inspired the design of most of the FRET sensors used today. These probes, named cameleons, used the Ca2+ induced molecular rearrangement of the MLCK peptide, M13 as it was bound to calmodulin (CaM) 57 to change FRET between CFP and YFP (Fig. 3A). These Ca2+ probes were fine-tuned for different Ca2+ affinities 57 and allowed their expression in whole organisms or in specific cell-types 58. Moreover, these indicators were targeted to subcellular organelles such as the ER or Golgi lumen or into the mitochondrial matrix (reviewed in 59). These probes went through significant evolution that changed the fluorophores 22, 57 or replaced calmodulin/M13 with troponin C as the Ca2+ binding module 60. Although somewhat counterintuitive, one of the best genetically encoded Ca2+ probes, GCaMP2 (or pericam), consists of only one fluorophore – a circularly permutated EGFP – CaM and the M13 peptide, yet Ca2+ binding causes a significant spectral change in its fluorescence 21, 22. How the rearrangement of the Ca2+ binding module leads to changes in fluorescence has just begun to unfold as the crystal structure of this probe was recently solved in its Ca2+ -free and –bound states 61. Other single fluorophore-based Ca2+ sensors contain a Ca2+ binding EF-hand placed between the β-strands of the fluorophore barrel have also been used with some success 62 (see Fig. 1E for this principle). Another Ca2+-sensor specifically designed to track the ER luminal Ca2+ was based on the Ca2+/calreticulin-induced conformation of the kringle domain of apo(A) 63. This probe has the advantage of not buffering Ca2+ as it does not contain a Ca2+ binding site, but it still can sequester Ca2+/calreticulin. Detailed description and comparison of most of these probes can be found in recent reviews 58, 59.
Figure 3.

Schematics of the designs of fluorescent probes to follow small molecule second messengers, protein kinase activities and membrane phospholipids. Throughout, Black arrows indicates direction of energy transfer (A) The original design of the “cameleons”, containing calmodulin (CaM) and the M13 peptide of MLCK placed between CFP and YFP. Ca2+ binding makes the peptide bind to CaM evoking the conformational change detected by a FRET change. This design served as template for many subsequently generated probes. (B) cAMP detection based on Epac. Here the truncated regulatory domain of Epac (Reg) binds a small peptide sequence (red) in a cAMP-dependent manner, which, in turn, relieves the inhibition by an inhibitory domain (In) of the (catalytically inactivated) guanine-nucleotide exchange domain (GEF) 67. This rearrangement can be detected as a FRET change when the two fluorescent proteins are placed at the two ends of the reporter. (C) Ins(1,4,5)P3 binding to the ligand binding domain of the InsP3 receptor [that consists of helical (H) and β-trefoil (B) domains] induces a conformational change that can be read as a FRET decrease between the two fluorophores attached at each end of the domain. (D) Protein kinase activity reporters use a consensus peptide sequence (green) specific for the particular kinase and a relatively low specificity and -affinity phosphopeptide recognizing domain (yellow) paired in the form of a FRET sensor. Phosphorylation causes binding of the phosphopeptide to the binding domain inducing a conformational transition that is detected as a FRET change. More specific and higher affinity phosphopeptide binding modules tend to protect the peptide from dephosphorylation making the probes less sensitive to detect the termination of the event. (E) Changes in membrane lipids can be monitored by specific lipid binding modules fused to GFP. Because the regulatory lipids are in higher abundance than proteins, such simple probes can detect lipid changes by changing their distribution between the membranes and the cytosol. The PH domain of PLCδ1 can monitor the amounts of PtdIns(4,5)P2 in the membrane, while the C1a domain of PKC (or some other proteins) will detect the formation of DAG. For example, during PLC activation, the PLCδ1-PH domain falls off the membrane as the amount of PtdIns(4,5)P2 decreases and concomitantly, the PKC-C1 domain will be recruited to the membrane from the cytosol as DAG is produced. Such probes have been developed to follow changes in a number of different phosphoinositides. See text for original citations.
Although cAMP was the first second messenger described (beyond Ca2+), it took some time before probes were developed to follow cAMP changes in living cells. The first cAMP probe took advantage of the cAMP-induced dissociation of the regulatory and catalytic domains of PKA as the readout by measuring decreasing FRET between these molecules induced by cAMP64. However, in the initial reports the production of recombinant proteins and fluorescent labeling in vitro was required and injection of the purified proteins into cells 64. Soon this approach was simplified by using the CFP/YFP pairs to tag the catalytic and regulatory subunits, respectively, which allowed expression of these proteins within the cell 65. Because of the relatively slow dissociation of these subunits, however, more useful probes to follow rapid cAMP kinetics were developed using the cAMP binding segment of the cAMP-sensitive Rap1 nucleotide exchange factor, Epac 66-68. These single molecule FRET-based cAMP sensors gave a whole new dimension to cAMP research and significant efforts were committed to optimize their performance 69. Comparison of the signals obtained with these cAMP probes with those that record the activity of the PKA enzyme (see below) helped to highlight the importance of compartmentalized signal transmission 70. A similar development led from an original, PKG-based intramolecular sensor for cGMP 71 to a newer sensor based on the isolated nucleotide binding domain of phosphodiesterase 5 72.
For those who have studied the mechanism of action of Ca2+ mobilizing hormones, the discovery of Ins(l,4,5)P3 as being the link between phosphoinositide turnover and Ca2+ mobilization 5 has been a defining moment. Ever since its discovery, there has been a desire to monitor Ins(l,4,5)P3 changes in individual cells. This has become possible only after cloning of the Ins(l,4,5)P3 receptors and understanding the features of their Ins(l,4,5)P3 binding domain 73-75. The minimal Ins(1,4,5)P3 binding region was then used sandwiched between YFP and CFP as an InsP3 sensor by several groups 76-78 including ours 79. Some of these constructs showed better responses than others because of the varying affinities to Ins(l,4,5)P3 and the best of these, called IRIS was the result of thorough optimization 78. Several studies also suggested that the Ins(1,4,5)P3-induced displacement of the PLCδ1PH domain from membrane PtdIns(4,5)P2 (see below) could be used as an Ins(1,4,5)P3 reporter 80. Although the PLCδ1PH domain translocation from the membrane to the cytosol is a good reflection of PLC activation, it is not a reliable probe to follow strictly the Ins(1,4,5)P3 changes (see 81 for discussion of this problem).
Probes to measure protein kinase or phosphatase activities
Protein phosphorylation cascades are the ultimate means of information flow along the various signaling pathways 6. The principle for analysis of kinase activities in single cells is again based on FRET changes elicited when phosphorylation of a peptide induces binding to one of the downstream effector proteins 82. This phosphorylation-dependent binding can be translated to changes in FRET using the usual CFP/YFP pairs of fluorophores. In the case of PKA the first such reporter, AKAR (A-kinase activity reporter) contained a peptide with a PKA consensus phosphorylation site and the 14-3-3 protein as the phosphopeptide binding module placed between the two fluorescent proteins 83. Nuclear targeting or tethering of this reporter to A-kinase itself clearly showed kinetic differences of PKA activation emphasizing the impact of compartmentalized substrate placement 83. Because of the tight binding of 14-3-3 to the phosphopeptide, the AKAR reporter interfered with dephosphorylation and was slow to register decrease in PKA activity. An improved version of the reporter (AKAR2) was then made by substituting the 14-3-3 module with the forkhead associated domain 1 (FHA1), a low specificity phosphothreonine binding domain with submicromolar binding affinity. Additionally, the peptide sequence was optimized for better interaction with FHA184. Based on this general design similar reporters were developed for PKC 85, 86, PKB/Akt 87, 88, PKD 89. Another Akt activity reporter used bioluminescence complementation in which the FHA1-peptide module was placed between two halves of the firefly luciferase. Here, Akt activation separates the luciferase halves causing a decrease in bioluminescence 90. An advantage of all of these indicators is that they can be targeted to different cellular or membrane compartments where they report significant differences between their activation patterns 86, 91.
The first tyrosine kinase reporters were designed with similar principles using specific SH2 domains as phosphotyrosyl recognition domains for EGFR and Src and the whole CRK molecule for Abl, in each case placed between the CFP/YFP pairs of fluorophores 92. Since the early Src reporter showed poor specificity, an improved version was made using a peptide sequence from p130cas as the phosphate acceptor module 93. Targeting of this Src reporter to “raft” and “non-raft” regions of the plasma membrane revealed dramatic differences in their speed and extent of activation after growth factor stimulation 94.
Similar FRET-based probes are also being developed to follow phosphatase activation. A recent report has shown a calcineurin activity probe based on a truncated version of the transcription factor NFAT1, containing its N-terminal regulatory domain 95. This reporter, called CaNAR1 shows promise and will probably be followed by other phosphatase reporters, although the limited specificity of phosphatases against phosphorylated target sequences makes this task more challenging than in the case of kinases.
Making lipid messengers visible
Although the importance of lipid messengers in cell regulation has long been established, studying lipids has always been more difficult than that of proteins. Lipids require special extraction and separation procedures, they are mostly detected by isotope incorporation with complex labeling kinetics and are not as easily detectable by antibodies as proteins. However, the importance of phosphoinositides, serving not only as precursors of important messengers such as DAG and Ins(1,4,5)P3, but also as membrane-bound regulators and organizers of signaling domains 96 has made these lipids the focus of enormous interest. The highly compartmentalized production and actions of phosphoinositides demanded the development of new methods for their visualization. This was achieved by simple protein modules originating from proteins that specifically recognize and respond to lipid changes fused to GFP variants.
DAG
Diacylglycerol is one of the most important lipid second messengers generated from phosphoinositides by PLC activation, or indirectly from phosphatidylcholine by PLD and phosphatidic acid phosphohydrolase. DAG imaging was based on DAG binding to C1 domains found in several proteins, such as PKC, PKD, and many others 97, and several such sensors have been introduced 98-100. Most of them report on DAG production by recruitment from the cytosol to the site of DAG formation, mostly the plasma membrane (Fig. 3E), but FRET-based sensors also using C1 domains and targeted to different membranes have also been reported 101.
Phosphatidic acid (PtdA)
There are several protein domains that bind PtdA 102, such as the PX domain of p47phox 103, a PtdA-recognizing domain of Raf-1 104 and protein phosphatase-1γ 105. Imaging PtdA distribution in live cells have been reported using the GFP-fused PtdA binding domain of the yeast Spo20p protein 106. However, not enough reports have been published with this probe to judge its general utility for PtdA imaging, even though many investigators have expressed desire to find a reliable probe to monitor PtdA changes inside the cell.
Phosphoinositides
Phosphoinositide imaging was made possible after the discovery of the phosphoinositide binding of pleckstrin homology (PH) domains 107, followed by the identification of other phosphoinositide recognizing domains such as the FYVE domains 108 or PX domains 109. GFP-fused PH domains have been used to image PtdIns(4,5)P2, PtdIns3P, PtdIns(3,4)P2 and PtdIns4P (see 13 for a detailed list and original citations). There are published reports on PtdIns5P and PtdIns(3,5)P2 recognizing proteins 13 but imaging of these lipids has not been as successful as with the other lipid species. Similarly, no success has been reported as yet on imaging of PtdIns itself. The successful inositol lipid probes again report on lipid production by translocation from the cytosol to the site where the lipid accumulates (Fig. 3E), but in some instances the localization of the probe to the membrane also depends on other membrane components (usually active small GTP binding proteins). This is especially true for domains that recognize mono-phosphorylated inositides. This dual recognition and the inhibitory effect of the domains at high expression levels on trafficking and signaling limit their usefulness. There have been successful attempts to use FRET for phosphoinositide detection. In the simplest approach, two versions of the probes one tagged with CFP, the other with YFP were co-transfected into cells and FRET was detected only when the probes were recruited to the membranes 110. It is not easy to design a single molecule FRET probe for lipid detection as PH domains usually do not undergo a large confromational change upon lipid binding. To overcome this problem single molecule FRET probes were designed where the Akt PH domain was combined with a basic “pseudo ligand” peptide or protein sequence that presumably occupied the PtdIns(3,4,5)P3 binding site in the absence of the lipid but got displaced upon lipid binding inducing the conformational change that could be monitored by FRET 87, 111. This design, however, has not been generally applied to inositide imaging. Still, these tools have helped advance the field tremendously. Detailed description of phosphoinositide imaging tools including technical notes have appeared in several recent publications 112, 113.
Concluding Remarks
The progress in signal transduction research in the last 40 years has been breathtaking. It is noteworthy, however, that the diversity of cell surface receptors and the complexity of the kinase cascades is contrasted with the relatively few second messenger mechanisms. In a majority of signaling cascades cAMP or Ca2+ serve as second messengers raising the question of why cells need the variety of receptors if most of them couple to either one of these second messengers. The answer must lie in the compartmentalization and channeling of these signals to specific downstream effector pathways. It is increasingly evident that cells organize their signal transduction molecules into signaling complexes in which the molecular interactions are pointed and are linked to functionally distinct outcomes. The plethora of A-kinase anchoring proteins (AKAPs) that serve as scaffolds to link A-kinases and cAMP degradation to specific cellular responses is a good example 114 as is the scaffolding of the MAPK pathways 115. Paradoxically, low affinity interactions suit these forms of organizations better as they only respond to messengers that are locally generated thereby reaching high local levels necessary for activation of the effector in the complex, and which will not respond to the overall elevations measured in the cytoplasm. By the same token, the specificity of the signaling pathways probably works best at low levels of stimulation and the maximal stimulation that is often used, because it generates a measurable signal, may largely mask specificity. All of these considerations suggest that we need to further refine our research tools in order to be able to study signals during moderate stimulation and without a lot of distortion by the reporters that we use. This is a challenging task as we already find that most reporters only give reliable results when used at such low expression levels that require the best microscopes with the highest sensitivity to follow fluorescence. This leaves a lot of room for improvement both on the side of chemistry and molecular biology of fluorescent reporters and the sensitivity of microscopes. Nevertheless, the tools listed in this brief review are testaments to the resolve and commitment of many scientists to this cause and guarantees continued progress not only in what signaling events we see but also how we comprehend the principles that govern their organization.
Acknowledgments
The research of TB is supported by the Intramural Research Program of the Eunice Kennedy Shriver National Institute of Child Health and Human Development of the National Institutes of Health.
Footnotes
Publisher's Disclaimer: This is a PDF file of an unedited manuscript that has been accepted for publication. As a service to our customers we are providing this early version of the manuscript. The manuscript will undergo copyediting, typesetting, and review of the resulting proof before it is published in its final citable form. Please note that during the production process errors may be discovered which could affect the content, and all legal disclaimers that apply to the journal pertain.
References
- 1.Carnegie GK, et al. A-kinase anchoring proteins: from protein complexes to physiology and disease. IUBMB Life. 2009;61:394–406. doi: 10.1002/iub.168. [DOI] [PMC free article] [PubMed] [Google Scholar]
- 2.Kok K, et al. Regulation of phosphoinositide 3-kinase expression in health and disease. Trends Biochem Sci. 2009;34:115–127. doi: 10.1016/j.tibs.2009.01.003. [DOI] [PubMed] [Google Scholar]
- 3.Bezprozvanny I. Calcium signaling and neurodegenerative diseases. Trends Mol Med. 2009;15:89–100. doi: 10.1016/j.molmed.2009.01.001. [DOI] [PMC free article] [PubMed] [Google Scholar]
- 4.Sutherland EW, Rall TW. Fractionation and characterization of a cyclic adenine ribonucleotide formed by tissue particles. J Biol Chem. 1958;232:1077–1091. [PubMed] [Google Scholar]
- 5.Streb H, et al. Release of Ca2+ from a nonmitochondrial intracellular store in pancreatic acinar cells by inositol-1,4,5-trisphosphate. Nature. 1983;306:67–68. doi: 10.1038/306067a0. [DOI] [PubMed] [Google Scholar]
- 6.Greengard P. Phosphorylated proteins as physiological effectors. Science. 1978;199:146–152. doi: 10.1126/science.22932. [DOI] [PubMed] [Google Scholar]
- 7.Sala GB, et al. Adrenocorticotropin action in isolated adrenal cells. The intermediate role of cyclic AMP in stimulation of corticosterone synthesis. J Biol Chem. 1979;254:3861–3865. [PubMed] [Google Scholar]
- 8.Rich TC, et al. A uniform extracellular stimulus triggers distinct cAMP signals in different compartments of a simple cell. Proc Natl Acad Sci U S A. 2001;98:13049–13054. doi: 10.1073/pnas.221381398. [DOI] [PMC free article] [PubMed] [Google Scholar]
- 9.Leroy J, et al. Spatiotemporal dynamics of beta-adrenergic cAMP signals and L-type Ca2+ channel regulation in adult rat ventricular myocytes: role of phosphodiesterases. Circ Res. 2008;102:1091–1100. doi: 10.1161/CIRCRESAHA.107.167817. [DOI] [PubMed] [Google Scholar]
- 10.Lemmon MA. Membrane recognition by phospholipid-binding domains. Nat Rev Mol Cell Biol. 2008;9:99–111. doi: 10.1038/nrm2328. [DOI] [PubMed] [Google Scholar]
- 11.Shaner NC, et al. A guide to choosing fluorescent proteins. Nat Methods. 2005;2:905–909. doi: 10.1038/nmeth819. [DOI] [PubMed] [Google Scholar]
- 12.Lippincott-Schwartz J, et al. Monitoring the dynamics and mobility of membrane proteins tagged with green fluorescent protein. Methods Cell Biol. 1999;58:261–281. doi: 10.1016/s0091-679x(08)61960-3. [DOI] [PubMed] [Google Scholar]
- 13.Balla T, Varnai P. Visualization of cellular phosphoinositide pools with GFP-fused protein-domains. Curr Protoc Cell Biol. 2009;Chapter 24(Unit 24 24) doi: 10.1002/0471143030.cb2404s42. [DOI] [PMC free article] [PubMed] [Google Scholar]
- 14.Grynkiewicz G, et al. A new generation of Ca2+ indicators with greatly improved fluorescence properties. J Biol Chem. 1985;260:3440–3450. [PubMed] [Google Scholar]
- 15.Adams SR, et al. New biarsenical ligands and tetracysteine motifs for protein labeling in vitro and in vivo: synthesis and biological applications. J Am Chem Soc. 2002;124:6063–6076. doi: 10.1021/ja017687n. [DOI] [PubMed] [Google Scholar]
- 16.Keppler A, et al. A general method for the covalent labeling of fusion proteins with small molecules in vivo. Nat Biotechnol. 2003;21:86–89. doi: 10.1038/nbt765. [DOI] [PubMed] [Google Scholar]
- 17.Reck-Peterson SL, et al. Single-molecule analysis of dynein processivity and stepping behavior. Cell. 2006;126:335–348. doi: 10.1016/j.cell.2006.05.046. [DOI] [PMC free article] [PubMed] [Google Scholar]
- 18.Szent-Gyorgyi C, et al. Fluorogen-activating single-chain antibodies for imaging cell surface proteins. Nat Biotechnol. 2008;26:235–240. doi: 10.1038/nbt1368. [DOI] [PubMed] [Google Scholar]
- 19.Baird GS, et al. Circular permutation and receptor insertion within green fluorescent proteins. Proc Natl Acad Sci U S A. 1999;96:11241–11246. doi: 10.1073/pnas.96.20.11241. [DOI] [PMC free article] [PubMed] [Google Scholar]
- 20.Ohkura M, et al. Genetically encoded bright Ca2+ probe applicable for dynamic Ca2+ imaging of dendritic spines. Anal Chem. 2005;77:5861–5869. doi: 10.1021/ac0506837. [DOI] [PubMed] [Google Scholar]
- 21.Nagai T, et al. Circularly permuted green fluorescent proteins engineered to sense Ca2+ Proc Natl Acad Sci U S A. 2001;98:3197–3202. doi: 10.1073/pnas.051636098. [DOI] [PMC free article] [PubMed] [Google Scholar]
- 22.Nagai T, et al. Expanded dynamic range of fluorescent indicators for Ca(2+) by circularly permuted yellow fluorescent proteins. Proc Natl Acad Sci U S A. 2004;101:10554–10559. doi: 10.1073/pnas.0400417101. [DOI] [PMC free article] [PubMed] [Google Scholar]
- 23.Llopis J, et al. Measurement of cytosolic, mitochondrial, and Golgi pH in single living cells with green fluorescent proteins. Proc Natl Acad Sci U S A. 1998;95:6803–6808. doi: 10.1073/pnas.95.12.6803. [DOI] [PMC free article] [PubMed] [Google Scholar]
- 24.Miyawaki A, Tsien RY. Monitoring protein conformations and interactions by fluorescence resonance energy transfer between mutants of green fluorescent protein. Methods Enzymol. 2000;327:472–500. doi: 10.1016/s0076-6879(00)27297-2. [DOI] [PubMed] [Google Scholar]
- 25.Allen MD, et al. Dynamic visualization of signaling activities in living cells. Sci Signal. 2008;1:pt6. doi: 10.1126/scisignal.137pt6. [DOI] [PubMed] [Google Scholar]
- 26.Rosenbaum DM, et al. The structure and function of G-protein-coupled receptors. Nature. 2009;459:356–363. doi: 10.1038/nature08144. [DOI] [PMC free article] [PubMed] [Google Scholar]
- 27.Moore CA, et al. Regulation of receptor trafficking by GRKs and arrestins. Annu Rev Physiol. 2007;69:451–482. doi: 10.1146/annurev.physiol.69.022405.154712. [DOI] [PubMed] [Google Scholar]
- 28.Vilardaga JP, et al. Measurement of the millisecond activation switch of G protein-coupled receptors in living cells. Nat Biotechnol. 2003;21:807–812. doi: 10.1038/nbt838. [DOI] [PubMed] [Google Scholar]
- 29.Hoffmann C, et al. A FlAsH-based FRET approach to determine G protein-coupled receptor activation in living cells. Nat Methods. 2005;2:171–176. doi: 10.1038/nmeth742. [DOI] [PubMed] [Google Scholar]
- 30.Zurn A, et al. Fluorescence resonance energy transfer analysis of alpha 2a-adrenergic receptor activation reveals distinct agonist-specific conformational changes. Mol Pharmacol. 2009;75:534–541. doi: 10.1124/mol.108.052399. [DOI] [PubMed] [Google Scholar]
- 31.Lohse MJ, et al. Optical techniques to analyze real-time activation and signaling of G-protein-coupled receptors. Trends Pharmacol Sci. 2008;29:159–165. doi: 10.1016/j.tips.2007.12.002. [DOI] [PubMed] [Google Scholar]
- 32.Bouvier M, et al. BRET analysis of GPCR oligomerization: newer does not mean better. Nat Methods. 2007;4:3–4. doi: 10.1038/nmeth0107-3. author reply 4. [DOI] [PMC free article] [PubMed] [Google Scholar]
- 33.Pfleger KD, Eidne KA. Illuminating insights into protein-protein interactions using bioluminescence resonance energy transfer (BRET) Nat Methods. 2006;3:165–174. doi: 10.1038/nmeth841. [DOI] [PubMed] [Google Scholar]
- 34.Gautier I, et al. Homo-FRET microscopy in living cells to measure monomer-dimer transition of GFP-tagged proteins. Biophys J. 2001;80:3000–3008. doi: 10.1016/S0006-3495(01)76265-0. [DOI] [PMC free article] [PubMed] [Google Scholar]
- 35.Gether U, et al. Agonists induce conformational changes in transmembrane domains III and VI of the beta2 adrenoceptor. Embo J. 1997;16:6737–6747. doi: 10.1093/emboj/16.22.6737. [DOI] [PMC free article] [PubMed] [Google Scholar]
- 36.Kobilka BK, Gether U. Use of fluorescence spectroscopy to study conformational changes in the beta 2-adrenoceptor. Methods Enzymol. 2002;343:170–182. doi: 10.1016/s0076-6879(02)43134-5. [DOI] [PubMed] [Google Scholar]
- 37.Gilman AG. G proteins transducers of receptor-generated signals. Annu Rev Biochem. 1987;56:615–649. doi: 10.1146/annurev.bi.56.070187.003151. [DOI] [PubMed] [Google Scholar]
- 38.Oldham WM, Hamm HE. Heterotrimeric G protein activation by G-protein-coupled receptors. Nat Rev Mol Cell Biol. 2008;9:60–71. doi: 10.1038/nrm2299. [DOI] [PubMed] [Google Scholar]
- 39.Rebois RV, et al. Elucidating kinetic and thermodynamic constants for interaction of G protein subunits and receptors by surface plasmon resonance spectroscopy. Methods Enzymol. 2002;344:15–42. doi: 10.1016/s0076-6879(02)44703-9. [DOI] [PubMed] [Google Scholar]
- 40.Janetopoulos C, et al. Receptor-mediated activation of heterotrimeric G-proteins in living cells. Science. 2001;291:2408–2411. doi: 10.1126/science.1055835. [DOI] [PubMed] [Google Scholar]
- 41.Janetopoulos C, Devreotes P. Monitoring receptor-mediated activation of heterotrimeric G-proteins by fluorescence resonance energy transfer. Methods. 2002;27:366–373. doi: 10.1016/s1046-2023(02)00095-6. [DOI] [PubMed] [Google Scholar]
- 42.Bunemann M, et al. Gi protein activation in intact cells involves subunit rearrangement rather than dissociation. Proc Natl Acad Sci U S A. 2003;100:16077–16082. doi: 10.1073/pnas.2536719100. [DOI] [PMC free article] [PubMed] [Google Scholar]
- 43.Jensen JB, et al. Fluorescence changes reveal kinetic steps of muscarinic receptor-mediated modulation of phosphoinositides and Kv7.2/7.3 K+ channels. J Gen Physiol. 2009;133:347–359. doi: 10.1085/jgp.200810075. [DOI] [PMC free article] [PubMed] [Google Scholar]
- 44.Chiu VK, et al. Ras signalling on the endoplasmic reticulum and the Golgi. Nat Cell Biol. 2002;4:343–350. doi: 10.1038/ncb783. [DOI] [PubMed] [Google Scholar]
- 45.Bondeva T, et al. Structural determinants of Ras-Raf interaction analyzed in live cells. Mol Biol Cell. 2002;13:2323–2333. doi: 10.1091/mbc.E02-01-0019. [DOI] [PMC free article] [PubMed] [Google Scholar]
- 46.Bivona TG, et al. Analysis of Ras activation in living cells with GFP-RBD. Methods Enzymol. 2006;407:128–143. doi: 10.1016/S0076-6879(05)07012-6. [DOI] [PubMed] [Google Scholar]
- 47.Mochizuki N, et al. Spatio-temporal images of growth factor-induced activation of Ras and Rap1. Nature. 2001;411:1065–1068. doi: 10.1038/35082594. [DOI] [PubMed] [Google Scholar]
- 48.Kraynov VS, et al. Localized Rac activation dynamics visualized in living cells. Science. 2000;290:333–337. doi: 10.1126/science.290.5490.333. [DOI] [PubMed] [Google Scholar]
- 49.Galperin E, Sorkin A. Visualization of Rab5 activity in living cells by FRET microscopy and influence of plasma-membrane-targeted Rab5 on clathrin-dependent endocytosis. J Cell Sci. 2003;116:4799–4810. doi: 10.1242/jcs.00801. [DOI] [PubMed] [Google Scholar]
- 50.Kitano M, et al. Imaging of Rab5 activity identifies essential regulators for phagosome maturation. Nature. 2008;453:241–245. doi: 10.1038/nature06857. [DOI] [PubMed] [Google Scholar]
- 51.Itoh RE, et al. Activation of rac and cdc42 video imaged by fluorescent resonance energy transfer-based single-molecule probes in the membrane of living cells. Mol Cell Biol. 2002;22:6582–6591. doi: 10.1128/MCB.22.18.6582-6591.2002. [DOI] [PMC free article] [PubMed] [Google Scholar]
- 52.Yoshizaki H, et al. Activity of Rho-family GTPases during cell division as visualized with FRET-based probes. J Cell Biol. 2003;162:223–232. doi: 10.1083/jcb.200212049. [DOI] [PMC free article] [PubMed] [Google Scholar]
- 53.Pertz O, Hahn KM. Designing biosensors for Rho family proteins--deciphering the dynamics of Rho family GTPase activation in living cells. J Cell Sci. 2004;117:1313–1318. doi: 10.1242/jcs.01117. [DOI] [PubMed] [Google Scholar]
- 54.Nalbant P, et al. Activation of endogenous Cdc42 visualized in living cells. Science. 2004;305:1615–1619. doi: 10.1126/science.1100367. [DOI] [PubMed] [Google Scholar]
- 55.Pertz O, et al. Spatiotemporal dynamics of RhoA activity in migrating cells. Nature. 2006;440:1069–1072. doi: 10.1038/nature04665. [DOI] [PubMed] [Google Scholar]
- 56.Tsien RY, et al. Calcium homeostasis in intact lymphocytes: cytoplasmic free calcium monitored with a new, intracellularly trapped fluorescent indicator. J Cell Biol. 1982;94:325–334. doi: 10.1083/jcb.94.2.325. [DOI] [PMC free article] [PubMed] [Google Scholar]
- 57.Miyawaki A, et al. Fluorescent indicators for Ca2+ based on green fluorescent proteins and calmodulin. Nature. 1997;388:882–887. doi: 10.1038/42264. [DOI] [PubMed] [Google Scholar]
- 58.Hires SA, et al. Reporting neural activity with genetically encoded calcium indicators. Brain Cell Biol. 2008;36:69–86. doi: 10.1007/s11068-008-9029-4. [DOI] [PMC free article] [PubMed] [Google Scholar]
- 59.McCombs JE, Palmer AE. Measuring calcium dynamics in living cells with genetically encodable calcium indicators. Methods. 2008;46:152–159. doi: 10.1016/j.ymeth.2008.09.015. [DOI] [PMC free article] [PubMed] [Google Scholar]
- 60.Mank M, et al. A genetically encoded calcium indicator for chronic in vivo two-photon imaging. Nat Methods. 2008;5:805–811. doi: 10.1038/nmeth.1243. [DOI] [PubMed] [Google Scholar]
- 61.Wang Q, et al. Structural basis for calcium sensing by GCaMP2. Structure. 2008;16:1817–1827. doi: 10.1016/j.str.2008.10.008. [DOI] [PMC free article] [PubMed] [Google Scholar]
- 62.Zou J, et al. Developing sensors for real-time measurement of high Ca2+ concentrations. Biochemistry. 2007;46:12275–12288. doi: 10.1021/bi7007307. [DOI] [PubMed] [Google Scholar]
- 63.Osibow K, et al. A new type of non-Ca2+-buffering Apo(a)-based fluorescent indicator for intraluminal Ca2+ in the endoplasmic reticulum. J Biol Chem. 2006;281:5017–5025. doi: 10.1074/jbc.M508583200. [DOI] [PMC free article] [PubMed] [Google Scholar]
- 64.Adams SR, et al. Fluorescence ratio imaging of cyclic AMP in single cells. Nature. 1991;349:694–697. doi: 10.1038/349694a0. [DOI] [PubMed] [Google Scholar]
- 65.Zaccolo M, et al. A genetically encoded, fluorescent indicator for cyclic AMP in living cells. Nat Cell Biol. 2000;2:25–29. doi: 10.1038/71345. [DOI] [PubMed] [Google Scholar]
- 66.Nikolaev VO, et al. Novel single chain cAMP sensors for receptor-induced signal propagation. J Biol Chem. 2004;279:37215–37218. doi: 10.1074/jbc.C400302200. [DOI] [PubMed] [Google Scholar]
- 67.Ponsioen B, et al. Detecting cAMP-induced Epac activation by fluorescence resonance energy transfer: Epac as a novel cAMP indicator. EMBO Rep. 2004;5:1176–1180. doi: 10.1038/sj.embor.7400290. [DOI] [PMC free article] [PubMed] [Google Scholar]
- 68.DiPilato LM, et al. Fluorescent indicators of cAMP and Epac activation reveal differential dynamics of cAMP signaling within discrete subcellular compartments. Proc Natl Acad Sci U S A. 2004;101:16513–16518. doi: 10.1073/pnas.0405973101. [DOI] [PMC free article] [PubMed] [Google Scholar]
- 69.van der Krogt GN, et al. A comparison of donor-acceptor pairs for genetically encoded FRET sensors: application to the Epac cAMP sensor as an example. PLoS ONE. 2008;3:e1916. doi: 10.1371/journal.pone.0001916. [DOI] [PMC free article] [PubMed] [Google Scholar]
- 70.Dunn TA, et al. Imaging of cAMP levels and protein kinase A activity reveals that retinal waves drive oscillations in second-messenger cascades. J Neurosci. 2006;26:12807–12815. doi: 10.1523/JNEUROSCI.3238-06.2006. [DOI] [PMC free article] [PubMed] [Google Scholar]
- 71.Honda A, et al. Spatiotemporal dynamics of guanosine 3′,5′-cyclic monophosphate revealed by a genetically encoded, fluorescent indicator. Proc Natl Acad Sci U S A. 2001;98:2437–2442. doi: 10.1073/pnas.051631298. [DOI] [PMC free article] [PubMed] [Google Scholar]
- 72.Nikolaev VO, et al. Fluorescent sensors for rapid monitoring of intracellular cGMP. Nat Methods. 2006;3:23–25. doi: 10.1038/nmeth816. [DOI] [PubMed] [Google Scholar]
- 73.Furuichi T, et al. Primary structure and functional expression of the inositol 1,4,5-trisphosphate-binding protein P400. Nature. 1989;342:32–38. doi: 10.1038/342032a0. [DOI] [PubMed] [Google Scholar]
- 74.Yoshikawa F, et al. Mutational analysis of the ligand binding site of the inositol 1,4,5-trisphosphate receptor. J Biol Chem. 1996;271:18277–18284. doi: 10.1074/jbc.271.30.18277. [DOI] [PubMed] [Google Scholar]
- 75.Bosanac I, et al. Structure of the inositol 1,4,5-trishphosphate receptor binding core in complex with its ligand. Nature. 2002;420:696–700. doi: 10.1038/nature01268. [DOI] [PubMed] [Google Scholar]
- 76.Tanimura A, et al. Fluorescent biosensor for quantitative real-time measurements of inositol 1,4,5-trisphosphate in single living cells. J Biol Chem. 2004;279:38095–38098. doi: 10.1074/jbc.C400312200. [DOI] [PubMed] [Google Scholar]
- 77.Remus TP, et al. Biosensors to measure inositol 1,4,5-trisphosphate concentration in living cells with spatiotemporal resolution. J Biol Chem. 2006;281:608–616. doi: 10.1074/jbc.M509645200. [DOI] [PubMed] [Google Scholar]
- 78.Matsu-ura T, et al. Cytosolic inositol 1,4,5-trisphosphate dynamics during intracellular calcium oscillations in living cells. J Cell Biol. 2006;173:755–765. doi: 10.1083/jcb.200512141. [DOI] [PMC free article] [PubMed] [Google Scholar]
- 79.van Zeijl L, et al. Regulation of connexin43 gap junctional communication by phosphatidylinositol 4,5-bisphosphate. J Cell Biol. 2007 doi: 10.1083/jcb.200610144. [DOI] [PMC free article] [PubMed] [Google Scholar]
- 80.Hirose K, et al. Spatiotemporal dynamics of inositol 1,4,5-trisphosphate that underlies complex Ca2+ mobilization patterns. Science. 1999;284:1527–1530. doi: 10.1126/science.284.5419.1527. [DOI] [PubMed] [Google Scholar]
- 81.Varnai P, Balla T. Live cell imaging of phosphoinositide dynamics with fluorescent protein domains. Biochim Biophys Acta. 2006;1761:957–967. doi: 10.1016/j.bbalip.2006.03.019. [DOI] [PubMed] [Google Scholar]
- 82.Ni Q, et al. Analyzing protein kinase dynamics in living cells with FRET reporters. Methods. 2006;40:279–286. doi: 10.1016/j.ymeth.2006.06.013. [DOI] [PubMed] [Google Scholar]
- 83.Zhang J, et al. Genetically encoded reporters of protein kinase A activity reveal impact of substrate tethering. Proc Natl Acad Sci U S A. 2001;98:14997–15002. doi: 10.1073/pnas.211566798. [DOI] [PMC free article] [PubMed] [Google Scholar]
- 84.Zhang J, et al. Insulin disrupts beta-adrenergic signalling to protein kinase A in adipocytes. Nature. 2005;437:569–573. doi: 10.1038/nature04140. [DOI] [PubMed] [Google Scholar]
- 85.Violin JD, et al. A genetically encoded fluorescent reporter reveals oscillatory phosphorylation by protein kinase C. J Cell Biol. 2003;161:899–909. doi: 10.1083/jcb.200302125. [DOI] [PMC free article] [PubMed] [Google Scholar]
- 86.Gallegos LL, et al. Targeting protein kinase C activity reporter to discrete intracellular regions reveals spatiotemporal differences in agonist-dependent signaling. J Biol Chem. 2006;281:30947–30956. doi: 10.1074/jbc.M603741200. [DOI] [PubMed] [Google Scholar]
- 87.Sasaki K, et al. Fluorescent indicators for Akt/protein kinase B and dynamics of Akt activity visualized in living cells. J Biol Chem. 2003;278:30945–30951. doi: 10.1074/jbc.M212167200. [DOI] [PubMed] [Google Scholar]
- 88.Kunkel MT, et al. Spatio-temporal dynamics of protein kinase B/Akt signaling revealed by a genetically encoded fluorescent reporter. J Biol Chem. 2005;280:5581–5587. doi: 10.1074/jbc.M411534200. [DOI] [PMC free article] [PubMed] [Google Scholar]
- 89.Kunkel MT, et al. Calcium-dependent regulation of protein kinase D revealed by a genetically encoded kinase activity reporter. J Biol Chem. 2007;282:6733–6742. doi: 10.1074/jbc.M608086200. [DOI] [PMC free article] [PubMed] [Google Scholar]
- 90.Zhang L, et al. Molecular imaging of Akt kinase activity. Nat Med. 2007;13:1114–1119. doi: 10.1038/nm1608. [DOI] [PubMed] [Google Scholar]
- 91.Gao X, Zhang J. Spatiotemporal analysis of differential Akt regulation in plasma membrane microdomains. Mol Biol Cell. 2008;19:4366–4373. doi: 10.1091/mbc.E08-05-0449. [DOI] [PMC free article] [PubMed] [Google Scholar]
- 92.Ting AY, et al. Genetically encoded fluorescent reporters of protein tyrosine kinase activities in living cells. Proc Natl Acad Sci U S A. 2001;98:15003–15008. doi: 10.1073/pnas.211564598. [DOI] [PMC free article] [PubMed] [Google Scholar]
- 93.Wang Y, et al. Visualizing the mechanical activation of Src. Nature. 2005;434:1040–1045. doi: 10.1038/nature03469. [DOI] [PubMed] [Google Scholar]
- 94.Seong J, et al. Visualization of Src activity at different compartments of the plasma membrane by FRET imaging. Chem Biol. 2009;16:48–57. doi: 10.1016/j.chembiol.2008.11.007. [DOI] [PMC free article] [PubMed] [Google Scholar]
- 95.Newman RH, Zhang J. Visualization of phosphatase activity in living cells with a FRET-based calcineurin activity sensor. Mol Biosyst. 2008;4:496–501. doi: 10.1039/b720034j. [DOI] [PubMed] [Google Scholar]
- 96.Di Paolo G, De Camilli P. Phosphoinositides in cell regulation and membrane dynamics. Nature. 2006;443:651–657. doi: 10.1038/nature05185. [DOI] [PubMed] [Google Scholar]
- 97.Newton AC. Lipid activation of protein kinases. J Lipid Res. 2009;50(Suppl):S266–271. doi: 10.1194/jlr.R800064-JLR200. [DOI] [PMC free article] [PubMed] [Google Scholar]
- 98.Oancea E, et al. Green fluorescent protein (GFP)-tagged cystein-rich domains from protein kinase C as a fluorescent indicators for diacylglycerol signaling in living cells. J Cell Biol. 1998;140:485–498. doi: 10.1083/jcb.140.3.485. [DOI] [PMC free article] [PubMed] [Google Scholar]
- 99.Meyer T, Oancea E. Protein kinase C as a molecular machine for decoding calcium and diacylglycerol signals. Cell. 1998;95:307–318. doi: 10.1016/s0092-8674(00)81763-8. [DOI] [PubMed] [Google Scholar]
- 100.Dries DR, et al. A single residue in the C1 domain sensitizes novel protein kinase C isoforms to cellular diacylglycerol production. J Biol Chem. 2007;282:826–830. doi: 10.1074/jbc.C600268200. [DOI] [PubMed] [Google Scholar]
- 101.Sato M, et al. Imaging diacylglycerol dynamics at organelle membranes. Nat Methods. 2006;3:797–799. doi: 10.1038/nmeth930. [DOI] [PubMed] [Google Scholar]
- 102.Wang X, et al. Signaling functions of phosphatidic acid. Prog Lipid Res. 2006;45:250–278. doi: 10.1016/j.plipres.2006.01.005. [DOI] [PubMed] [Google Scholar]
- 103.Karathanassis D, et al. Binding of the PX domain of p47phox to phosphatidylinositol 3,4-bisphosphate and phosphatidic acid is masked by an intramolecular interaction. EMBO J. 2002;21:5057–5068. doi: 10.1093/emboj/cdf519. [DOI] [PMC free article] [PubMed] [Google Scholar]
- 104.Rizzo MA, et al. The recruitment of Raf-1 to membranes is mediated by direct interaction with phosphatidic acid and is independent of association with Ras. J Biol Chem. 2000;275:23911–23918. doi: 10.1074/jbc.M001553200. [DOI] [PubMed] [Google Scholar]
- 105.Jones JA, et al. Identification of a novel phosphatidic acid binding domain in protein phosphatase-1. Biochemistry. 2005;44:13235–13245. doi: 10.1021/bi0505159. [DOI] [PubMed] [Google Scholar]
- 106.Zeniou-Meyer M, et al. Phospholipase D1 production of phosphatidic acid at the plasma membrane promotes exocytosis of large dense-core granules at a late stage. J Biol Chem. 2007;282:21746–21757. doi: 10.1074/jbc.M702968200. [DOI] [PubMed] [Google Scholar]
- 107.Cohen GB, et al. Modular binding domains in signal transduction proteins. Cell. 1995;80:237–248. doi: 10.1016/0092-8674(95)90406-9. [DOI] [PubMed] [Google Scholar]
- 108.Kutateladze TG, et al. Phosphatidylinositol 3-Phosphate recognition by the FYVE domain. Mol Cell. 1999;3:805–811. doi: 10.1016/s1097-2765(01)80013-7. [DOI] [PubMed] [Google Scholar]
- 109.Kanai F, et al. The PX domains of p47phox and p40phox bind to lipid products of PI(3)K. Nat Cell Biol. 2001;3:675–678. doi: 10.1038/35083070. [DOI] [PubMed] [Google Scholar]
- 110.van Der Wal J, et al. Monitoring Phospholipase C activation kinetics in live cells by FRET. J Biol Chem. 2001;276:15337–15344. doi: 10.1074/jbc.M007194200. [DOI] [PubMed] [Google Scholar]
- 111.Ananthanarayanan B, et al. Signal propagation from membrane messengers to nuclear effectors revealed by reporters of phosphoinositide dynamics and Akt activity. Proc Natl Acad Sci U S A. 2005;102:15081–15086. doi: 10.1073/pnas.0502889102. [DOI] [PMC free article] [PubMed] [Google Scholar]
- 112.Komander D, et al. Structural insights into the regulation of PDK1 by phosphoinositides and inositol phosphates. Embo J. 2004;23:3918–3928. doi: 10.1038/sj.emboj.7600379. [DOI] [PMC free article] [PubMed] [Google Scholar]
- 113.Varnai P, Balla T. Live cell imaging of phosphoinositides with expressed inositide binding protein domains. Methods. 2008;46:167–176. doi: 10.1016/j.ymeth.2008.09.019. [DOI] [PMC free article] [PubMed] [Google Scholar]
- 114.Beene DL, Scott JD. A-kinase anchoring proteins take shape. Curr Opin Cell Biol. 2007;19:192–198. doi: 10.1016/j.ceb.2007.02.011. [DOI] [PMC free article] [PubMed] [Google Scholar]
- 115.Kolch W. Coordinating ERK/MAPK signalling through scaffolds and inhibitors. Nat Rev Mol Cell Biol. 2005;6:827–837. doi: 10.1038/nrm1743. [DOI] [PubMed] [Google Scholar]
- 116.Hynes TR, et al. Cellular localization of GFP-tagged alpha subunits. Methods Mol Biol. 2004;237:233–246. doi: 10.1385/1-59259-430-1:233. [DOI] [PubMed] [Google Scholar]
- 117.Lippincott-Schwartz J, Manley S. Putting super-resolution fluorescence microscopy to work. Nat Methods. 2009;6:21–23. doi: 10.1038/nmeth.f.233. [DOI] [PMC free article] [PubMed] [Google Scholar]
- 118.Chi KR. Super-resolution microscopy: breaking the limits. Nat Methods. 2009;6:15–18. [Google Scholar]
- 119.Betzig E, et al. Imaging intracellular fluorescent proteins at nanometer resolution. Science. 2006;313:1642–1645. doi: 10.1126/science.1127344. [DOI] [PubMed] [Google Scholar]
- 120.Hess ST, et al. Ultra-high resolution imaging by fluorescence photoactivation localization microscopy. Biophys J. 2006;91:4258–4272. doi: 10.1529/biophysj.106.091116. [DOI] [PMC free article] [PubMed] [Google Scholar]
- 121.Bates M, et al. Multicolor super-resolution imaging with photo-switchable fluorescent probes. Science. 2007;317:1749–1753. doi: 10.1126/science.1146598. [DOI] [PMC free article] [PubMed] [Google Scholar]
- 122.Klar TA, et al. Fluorescence microscopy with diffraction resolution barrier broken by stimulated emission. Proc Natl Acad Sci U S A. 2000;97:8206–8210. doi: 10.1073/pnas.97.15.8206. [DOI] [PMC free article] [PubMed] [Google Scholar]
- 123.Kner P, et al. Super-resolution video microscopy of live cells by structured illumination. Nat Methods. 2009;6:339–342. doi: 10.1038/nmeth.1324. [DOI] [PMC free article] [PubMed] [Google Scholar]
- 124.Förster T. Zwushenmolekulare Energiewanderung und Fluoreszenz. Ann Physik. 1948;2:55–75. [Google Scholar]
- 125.Edidin M. Fluorescence resonance energy transfer: techniques for measuring molecular conformation and molecular proximity. Curr Protoc Immunol. 2003;Chapter 18(Unit 18 10) doi: 10.1002/0471142735.im1810s52. [DOI] [PubMed] [Google Scholar]
- 126.van Munster EB, Gadella TW. Fluorescence lifetime imaging microscopy (FLIM) Adv Biochem Eng Biotechnol. 2005;95:143–175. doi: 10.1007/b102213. [DOI] [PubMed] [Google Scholar]
- 127.Wallrabe H, Periasamy A. Imaging protein molecules using FRET and FLIM microscopy. Curr Opin Biotechnol. 2005;16:19–27. doi: 10.1016/j.copbio.2004.12.002. [DOI] [PubMed] [Google Scholar]
- 128.Hastings JW. Chemistries and colors of bioluminescent reactions: a review. Gene. 1996;173:5–11. doi: 10.1016/0378-1119(95)00676-1. [DOI] [PubMed] [Google Scholar]