Abstract
During cardiac arrest (CA), myocardial perfusion is solely dependent on cardiopulmonary resuscitation (CPR) although closed-chest compressions only provide about 10–20% of normal myocardial perfusion. The study was conducted in a whole animal CPR model to determine whether CPR-generated oxygen delivery preserves or worsens mitochondrial function. Male Sprague-Dawley rats (400–450 g) were randomly divided into four groups: 1) BL (instrumentation only, no cardiac arrest), 2) CA15 (15 min cardiac arrest without CPR), 3) CA25 (25 min cardiac arrest without CPR) and 4) CPR (15 min cardiac arrest, followed by 10 min CPR). The differences between groups were evaluated by measuring mitochondrial respiration, electron transport chain (ETC) complex activities and mitochondrial ultrastructure by transmission electron microscopy (TEM). The CA25 group had the greatest impairment of mitochondrial respiration and ETC complex activities (I–III). In contrast, the CPR group was not different from the CA15 group regarding all measures of mitochondrial function. Complex I was more susceptible to ischemic injury than the other complexes and was the major determinant of mitochondrial dysfunction. Observations of mitochondrial ultrastructure by TEM were compatible with the biochemical results. The findings suggest that, despite low blood flow and oxygen delivery, CPR is able to preserve heart mitochondrial function and viability during ongoing global ischemia. Preservation of complex I activity and mitochondrial function during cardiac arrest may be an important mechanism underlying the beneficial effects of CPR which have been shown in clinical studies.
Introduction
With a low survival rate ranging from 5 to 18 percent, sudden cardiac arrest is a leading cause of death in the United States and is responsible for more than 300,000 deaths every year [1]. The most recent guidelines for cardiopulmonary resuscitation (CPR) and emergency cardiovascular care as published by the American Heart Association [2] emphasize the importance of good quality CPR to improve perfusion to vital organs. However, due to the low flow, even good quality CPR is inadequate to support the normal functioning heart. Extensive results from both animal experiments and clinical experience have shown that the blood flow generated by closed-chest compressions can only supply 10–20% of normal myocardial perfusion [3]. Therefore, hearts with cardiac arrest and successful CPR usually undergo a two-stage reperfusion: the “low flow” period during CPR and then full reperfusion with the return of spontaneous circulation (ROSC). This two-stage reperfusion phenomenon makes CPR distinct from the ischemia/reperfusion scenario of acute myocardial infarction, in which opening of an occluded coronary artery results in immediate full flow of the ischemic region.
The concept that hearts initially reperfused with low flow reperfusion, as in cardiac arrest and CPR, behave differently from hearts with conventional ischemia/reperfusion was supported in our previous study using isolated buffer-perfused hearts. Hearts with 15 min of global ischemia, followed by 5 min of 10% baseline flow and then full flow reperfusion, showed improved post-ischemic contractile function and bioenergetic capacity compared to hearts with 20 min of global ischemia and full reperfusion [4]. These findings suggest that CPR-type low flow reperfusion, although insufficient to meet the oxygen demand and sustain full contractility of the ischemic heart, may be able to alleviate further injury caused by ischemia and improve post-resuscitation cardiac function at full reperfusion.
Mitochondria are thought to be progressively damaged during ischemia and injured further when full flow reperfusion resumes (reviewed by Lesnefsky et al [5]). However, very little is known about the effects of CPR on mitochondrial function. Recently, Rea et al [6] proposed the concept that the low flow generated by CPR may not only slow the ischemic injury but may also attenuate reperfusion injury by “priming” the heart with oxidative substrates which activate protective mechanisms. The proposed beneficial effects of CPR might be directly or indirectly linked to mitochondria, since they play a pivotal role in determining cardiac function. In the present study, we hypothesize that CPR preserves mitochondrial function during cardiac arrest. Mitochondrial function following cardiac arrest with and without CPR in a whole animal rat cardiac arrest model was determined by measuring respiration and the activities of electron transport chain (ETC) complexes. Western blotting of mitochondrial ETC proteins was performed to determine if changes in complex activity were related to alterations in protein expression. Finally, morphological changes of mitochondria were examined by transmission electron microscopy (TEM).
Methods
The animal CPR model
Male Sprague-Dawley rats (400–450 g), purchased from Harlan Laboratories (Indianapolis, IN), were cared for in accordance with the National Institutes of Health (NIH) guidelines and with approval of the Institutional Animal Care and Use Committee. Animals were orally intubated after an i.p. injection of ketamine/xylazine (70/10 mg/kg), followed by mechanical ventilation (model 683, Harvard Apparatus, Holliston, MA) with room air at a rate of 35 strokes/min, a tidal volume of 8 ml/kg, and a positive end expiratory pressure (PEEP) of 3 cm H2O. The right femoral artery and right jugular vein were cannulated with 24-gauge catheters for arterial pressure monitoring (HPA-210a, Digi-Med, Louisville, KY) and drug administration, respectively. The core body temperature was maintained at 37 °C by a thermistor-controlled heat lamp and peripheral oxygenation was evaluated by pulse oximetry (NPB-40, Nellcor, Boulder, CO). Cardiac rhythm was acquired using a three lead ECG with electrocardiograph leads inserted subcutaneously into the chest wall (Lifepak 9, Physio-Control, Redmond, WA).
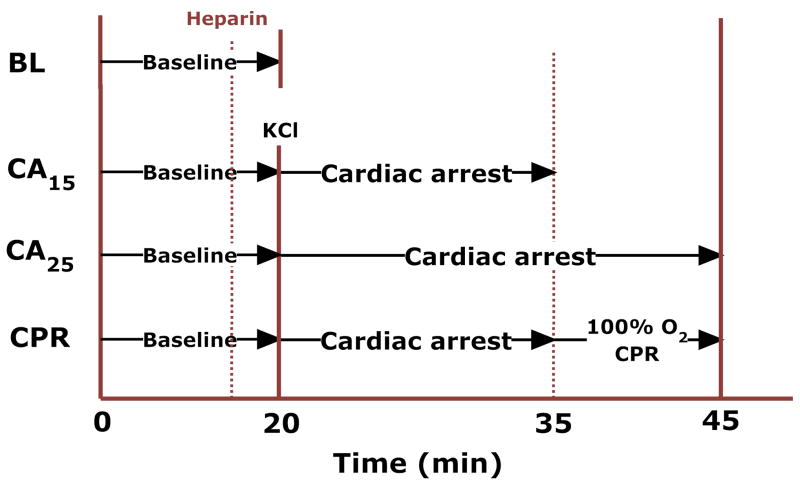
Immediately following 20 min of instrumentation, animals were randomly divided into four groups (Fig. 1): 1) BL (instrumentation only, no cardiac arrest), 2) CA15 (15 min cardiac arrest without CPR), 3) CA25 (25min cardiac arrest without CPR) and 4) CPR (15 min cardiac arrest, followed by 10 min CPR). Heparin (1000 U/kg, i.v.) was administered to prevent blood coagulation in all groups. Cardiac arrest was induced by a bolus injection of KCl (0.07 mg/g) via the jugular vein and ventilation was stopped. In the CPR group, chest compressions were initiated at 15 min cardiac arrest by a pneumatic rodent thumper (Michigan Instruments, Grand Rapids, MI) at a rate of 200–240/min and a compression depth of 17–20 mm. This depth represented 40–50% of the anterior-posterior diameter of the animal’s chest. During CPR, the ventilation rate was at 60% of baseline with 100% O2 and no PEEP. At the end of experiment, the heart was excised and mitochondria were immediately isolated for further analysis.
Figure 1.
The experimental protocol.
Isolation of heart mitochondria
Mitochondrial isolation was based on Costa et al [7] with some modifications. All isolation procedures were performed at 0–4 °C. The excised heart was trimmed and washed in isolation buffer (250 mM sucrose, 10 mM HEPES and 1 mM EGTA, pH 7.2). The left ventricle with the interventricular septum was selected and minced thoroughly in 1 ml isolation buffer containing 1 mg protease (type XXIV, Sigma-Aldrich, St. Louis, MO). The suspension was then added to 7 ml isolation buffer containing 2 mg/ml of bovine serum albumin (BSA) and homogenized with a motorized Teflon pestle. The homogenate was centrifuged at 1500 g for 3 min twice and both supernatants were added together and centrifuged at 9000 g for 10 min. This crude mitochondrial pellet was washed and re-suspended in 10 ml isolation buffer without BSA. The suspension underwent another centrifugation of 2300 g for 3 min and the supernatant was decanted and centrifuged again at 9000 g for 10 min. The final pellet was re-suspended in isolation buffer and the protein concentration was determined by the Lowry method [8]. Mitochondrial yield, expressed as mg mitochondrial protein/g wet tissue, was determined by dividing the product of protein concentration and total volume by tissue wet weight. Fresh mitochondrial samples were used for respiration and cytochrome a assay. Part of the mitochondrial preparation was stored immediately at 80 °C for immunoblotting analysis and spectrophotometric assays.
Measurement of cytochrome a
The content of cytochrome a was assayed to determine relative mitochondrial purity between groups. One hundred microliters of mitochondrial protein were incubated with 400 μl assay buffer (50 mM Tris, 0.3% deoxycholate, 0.3% KCl, pH 8.0) in a quartz cuvette. After being fully oxidized by addition of 1 μl 100 mM K3Fe(CN)6, the baseline absorbance spectrum (500–650 nm) was measured on a Shimadzu 2401 UV/VIS spectrophotometer (Columbia, MD). A few grains of solid sodium dithionite were then added to fully reduce the cytochromes of mitochondria and the absorbance spectrum was measured again. The concentration of cytochrome a was determined by the difference in absorbance at 605 nm with an extinction coefficient of 12 mM−1cm−1 [9].
Mitochondrial respiration
The oxygen consumption of fresh isolated mitochondria was measured by a Clark-type oxygen electrode (Apollo 4000, World Precision Instruments, Sarasota, FL) in a closed chamber with magnetic stirring. Five hundred micrograms of mitochondrial protein were incubated in 1 ml respiration buffer (225 mM sucrose, 5 mM MgCl2, 10 mM KH2PO4, 20 mM KCl, 10 mM Tris and 5 mM HEPES, pH 7.4) at 30 °C. After one minute of equilibration, respiration substrates for complex I (glutamate/malate: 10 mM/5 mM) or complex II (succinate/rotenone: 6 mM/1.2 μM) were added to the respiration buffer to initiate state 2 respiration. The rates of state 3 and state 4 respiration were measured after the addition of 300 nmol ADP and following the depletion of ADP, respectively. The respiratory control ratio (RCR) was then calculated from the ratio of state 3 to state 4 respiration. For measuring the mitochondrial respiration under the condition of uncoupling, 0.5 μM carbonylcyanide-p-trifluoromethoxy-phenylhydrazone (FCCP) was used in the study.
Spectrophotometric assays of electron transport chain (ETC) complex activity
The activities of ETC complexes were assayed spectrophotometrically using sonicated, thawed mitochondria samples at room temperature as detailed by Han et al [10] and Chen et al [11].
Complex I (NADH-ubiquinone reductase) activity assay
The electron transfer activity of complex I was assayed by ubiquinone-stimulated NADH oxidation. Twenty-five micrograms of mitochondrial protein were mixed with 500 μl assay buffer (20 mM potassium phosphate buffer, 2 mM NaN3, 0.8% sodium cholate, 0.15 mM NADH, pH 8.0) in a quartz cuvette. The reaction was initiated by the addition of 0.1 mM ubiquinone-1 (Q1) and the change of absorbance for NADH was measured at 340 nm (ε = 6.22 mM−1cm−1). The specificity of the assay was validated by rotenone-sensitive inhibition. Complex I activity was expressed as the oxidation rate of NADH (nmol NADH oxidized/min/mg protein).
NADH-ferricyanide reductase (NFR) activity assay
NFR activity was measured to estimate the function of flavin protein domain of complex I. In the assay mixture, 0.5 mM K3Fe(CN)6 was used to replace ubiquinone-1 as the electron acceptor in the assay mixture and the decrease of ferricyanide absorbance was recorded at 420 nm (ε = 1.0 mM−1cm−1) [12]. The enzyme-mediated reaction was not sensitive to rotenone and NFR activity was expressed as the reduction rate of ferricyanide (nmol ferricyanide reduced/min/mg protein).
Complex II (succinate-ubiquinone reductase) activity assay
Complex II activity was analyzed by ubiquinone-2 (Q2) stimulated dichlorophenolindophenol (DCPIP) reduction. Ten micrograms of mitochondrial protein were incubated at 30 °C for 10 min with 500 μl assay buffer (50 mM phosphate buffer, 20 mM sodium succinate, 0.1 mM EDTA, 75 μM DCPIP, pH 7.4) to fully activate complex II [13]. The reaction was initiated by adding 50μM Q2 and the decrease of absorbance at 600 nm (ε = 21 mM−1cm−1) was measured. Inhibition of the reaction by the thenoyltrifluoroacetone (TTFA) was used to confirm the specificity of assay. Complex II activity was expressed as the reduction rate of DCPIP (nmol DCPIP reduced/min/mg protein).
Complex III (ubiquinol-cytochrome c reductase) activity assay
Complex III activity was evaluated by ubiquinol-mediated ferricytochrome c reduction at 550 nm (ε = 18.5 mM−1cm−1) upon addition of 2 μg protein to 500 μl assay buffer (50 mM phosphate buffer, 1mM EDTA, 50 μM cytochrome c, 0.1% sodium cholate, 0.1 mM KCN and 25 μM ubiquinol-2, pH 7.0). Inhibition of the assay with Antimycin A was used to verify the specificity of assay. Complex III activity was expressed as the reduction rate of ferricytochrome c (nmol ferricytochrome c reduced/min/mg protein).
Complex IV (cytochrome c oxidase) activity assay
Ten micrograms of mitochondrial protein were added to 600 μl assay buffer. The assay buffer contained 50 mM phosphate buffer and 60 μM ferrocytochrome c (pH 7.4). Complex IV activity was determined by the decrease in the rate of absorbance of ferro-cytochrome c at 550 nm (ε = 18.5 mM−1cm−1). Potassium cyanide was used as the inhibitor to validate the assay. Complex IV activity was expressed as the oxidation rate of ferrocytochrome c (nmol ferrocytochrome c oxidized/min/mg protein).
Western blotting of mitochondrial ETC complex proteins
To prevent unexpected degradation of mitochondrial proteins by residual proteases, 1 mM phenylmethylsulphonyl fluoride (PMSF, dissolved in isopropanol) was added in the homogenization step during mitochondrial isolation to block protease activity. The samples (100 μg) were pretreated with dithiothreitol (DTT) for disruption of protein disulfide bonds and then loaded on a pre-cast NuPAGE 4–12% Bis-Tris gel (Invitrogen, Carlsbad, CA) for SDS-PAGE. After electrophoresis, protein bands were transferred to a nitrocellulose membrane. The membrane was first stained with Ponceau S to verify the success of protein transfer and then blocked with 5% nonfat dry milk in Tween-Tris Buffered Saline (TTBS) for 1 hr. Following blocking, the blots were incubated overnight at 4 °C with the primary antibody of interest. The antibodies included in-house generated anti-complex I 51 kDa, anti-complex II 70 kDa [14], anti-OxPhos Complex III FeS subunit, anti-OxPhos Complex IV subunit I (Invitrogen, Carlsbad, CA) and anti-superoxide dismutase 2 (FL-222, Santa Cruz Biotechnology, Santa Cruz, CA). The membrane was then washed with TTBS three times for 10 min each, followed by incubation with HRP-conjugated secondary antibody for 1 hr at room temperature. Secondary antibodies were removed by three 10 min washes of TTBS and the labeled proteins were identified using Amersham ECL Western blotting reagents (GE Healthcare, Buckinghamshire, UK) for chemiluminescence detection.
Transmission electron microscopic studies
To investigate the mitochondrial damage in situ between groups, we examined the ultrastructure of myocardium by transmission electron microscopy (TEM). A small piece (< 1 cubic millimeter) of subendocardial tissue was excised from the left ventricle at the end of the experiment and fixed in 2% glutaraldehyde (0.1 M phosphate buffer, pH 7.4) for three hours. Each specimen was post-fixed in 1% OsO4 for one hour and dehydrated through a graded ethanol series (50–100%). After treatment of propylene oxide, the specimen was embedded in Eponate 12 resin, sectioned at a thickness of 80 nm, and stained by 2% aqueous uranyl acetate followed by lead citrate. The grids were then observed in a Technai G2 Spirit transmission electron microscope (FEI Company, Hillsboro, OR). Mitochondria were imaged at 6800X, 18500X and 68000X. For the morphometric analysis, total mitochondria in five micrographs (18500X) per group were counted and the mitochondrial disruption rate was calculated. Relative matrix density (normalized to the density of myofibrils) and mitochondrial size were analyzed from 100 mitochondria randomly delineated in 5–8 micrographs (6800X and 18500X) per group by NIH ImageJ software.
Data analysis
All data were expressed as mean ± SEM. Statistical analyses were carried out with one-way ANOVA and followed by Tukey’s post hoc test where appropriate. Significance was assigned at P < 0.05.
Results
Quality of CPR
In the CPR group, there was a slow, steady decline of aortic end-diastolic pressure in the 10 min CPR period. The aortic end-diastolic pressure during CPR was 28.7 ± 3.6, 18.7 ± 0.9 and 15.7 ± 2.0 mmHg at 1, 5, 9 min, respectively. All animals had some organized electrical activity during CPR but none achieved return of spontaneous circulation (ROSC).
Mitochondrial yield and cytochrome a content of isolated mitochondria
The results suggested that as the ischemia time increased, mitochondrial yield reciprocally decreased (Table 1). The baseline group had the highest yield while the CA25 group had the lowest yield which was less than half of the baseline. Hearts from the CPR groups had about the same mitochondrial yield as those from the CA15 group, suggesting that intervention with CPR preserved mitochondrial integrity. In a different set of experiments (n = 3/group), the citrate synthase activity, as an indicator of mitochondrial mass, was assayed to estimate the extraction and breakage ratios of mitochondria among groups. We found that the CA25 group did have a significantly lower mitochondrial extraction ratio and a higher breakage ratio compared with other groups (supplemental data). The findings imply that mitochondria in the CA25 group sustained more disruption and that less mitochondria could be recovered during the isolation process. However, the cytochrome a content was similar between groups, indicating that the relative purity of mitochondrial preparation was unaffected by isolation process or treatment (Table 1).
Table 1.
Mitochondrial yield and cytochrome a content in different groups. Mitochondrial yields were statistically different among groups
| Groups | Mitochondrial yield(mg/gm wet tissue) | Cytochrome a content (pmol/mg protein) |
|---|---|---|
| BL | 20.26 ± 0.82 | 768 ± 17 |
| CA15 | 13.43 ± 0.38 * | 749 ± 14 |
| CA25 | 8.54 ± 0.54 *† | 712 ± 12 |
| CPR | 13.40 ± 0.77 *‡ | 734 ± 18 |
BL vs. CA15, BL vs. CA25, BL vs. CPR: p < 0.001,
CA15 vs. CA25: p < 0.001,
CA25 vs. CPR, p < 0.001.
However, there was no significant group difference (p > 0.05) in terms of cytochrome a content, indicating that the purity of mitochondrial samples was consistent among groups. (Data expressed as mean ± SEM, n = 8/group)
Respiration parameters in isolated mitochondria
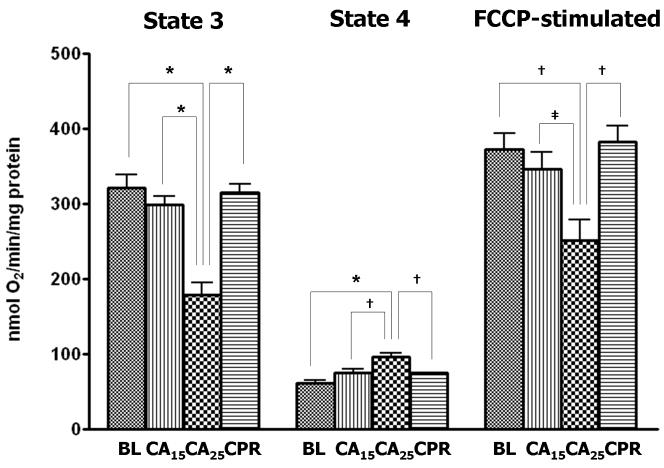
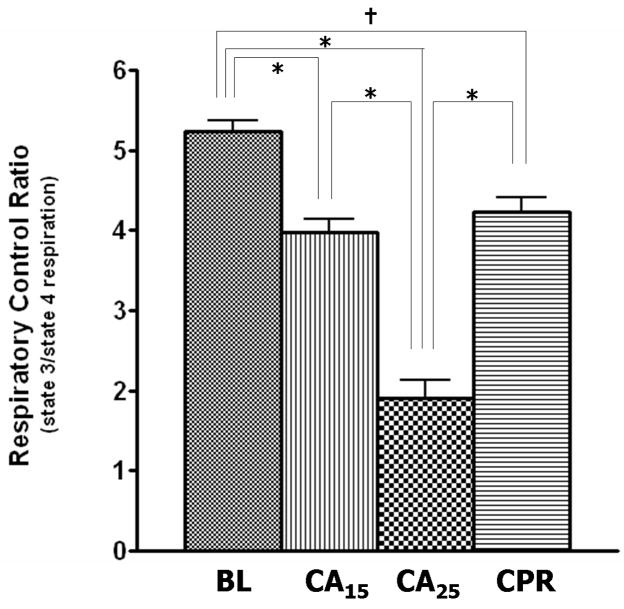
When glutamate/malate (10 mM/5 mM) was used as complex I substrates for NAD-linked respiration in isolated heart mitochondria, the rates of state 3 and FCCP-stimulated respiration (uncoupling conditions) in the CA25 group were significantly lower when compared with the other three groups (Fig. 2A). The CA25 group also had the highest state 4 respiration of all groups (Fig. 2A, middle), which contributed to a further decline of the respiratory control ratio (RCR: state 3/4 respiration) in the CA25 group (36% of baseline, Fig. 2B). In contrast, mitochondrial function in the CPR group was not significantly different from those of the BL and CA15 groups in regard to state 3, state 4 and FCCP-stimulated respiration (Fig. 2A). When succinate/rotenone (6 mM/1.2 μM) was used to measure the FAD-linked respiration, the results showed a very similar pattern (Table 2). The RCR, state 3 and FCCP-stimulated respiration were all markedly depressed in the CA25 group (p < 0.001), but preserved in the CPR group. No significant difference in state 4 respiration was found between groups.
Figure 2.
Parameters of mitochondrial respiration in isolated mitochondria. Glutamate (10mM) and malate (5mM) were used as respiration substrates. (A) State 3, state 4 and FCCP-stimulated respiration (nmol O2 consumed/min/mg protein) in isolated mitochondria. The CA25 group had significantly lower state 3 and FCCP-stimulated respiration but higher state 4 respiration than the other three groups. (B) Respiratory control ratio (RCR: state 3/state 4 respiration). The CA25 group had the lowest RCR, while the CPR group, not different from the CA15 group, had a higher RCR than the CA25 group. (Data expressed as mean ± SEM, n=8/group, *p < 0.001, †p < 0.01, ‡p < 0.05)
Table 2.
Parameters of mitochondrial respiration using succinate/rotenone (6 mM/1.2 μM) as respiration substrates. The pattern is the same as seen in Fig. 2. The CA25 group had significantly lower state 3, FCCP-stimulated respiration and RCR than the other three groups
| Groups | State 3 | State 4 | FCCP-stimulated | RCR |
|---|---|---|---|---|
| BL | 289.8 ± 7.6 | 115.7 ± 2.6 | 293.1 ± 12.8 | 2.51 ± 0.09 |
| CA15 | 263.9 ± 15.2 | 128.9 ± 10.0 | 279.3 ± 15.2 | 2.08 ± 0.09 |
| CA25 | 115.5 ± 16.1*† | 113.3 ± 7.1 | 147.4 ± 17.2*† | 1.00 ± 0.11*† |
| CPR | 270.7 ± 12.5‡ | 126.1 ± 3.8 | 289.5 ± 14.0‡ | 2.16 ± 0.11‡ |
BL vs. CA25: p < 0.001,
CA15 vs. CA25: p < 0.001,
CA25 vs. CPR: p < 0.001.
No significant difference of state 4 respiration was found among groups. Data are expressed as mean ± SEM (nmol O2/min/mg protein), n = 8/group.
Mitochondrial ETC complex activities
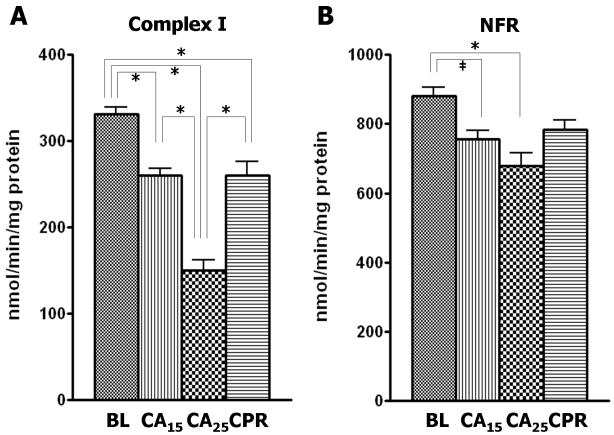
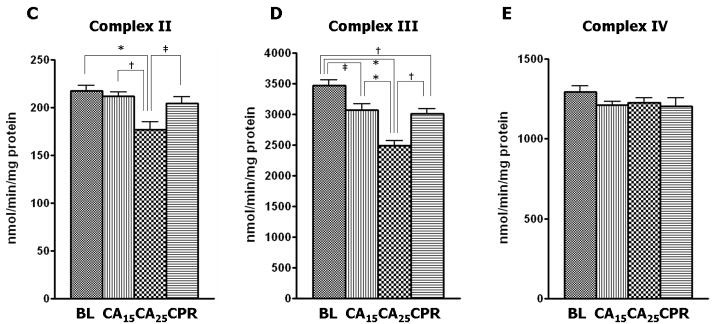
Complex I activity was depressed approximately 55% from baseline in the CA25 group compared with 21% depression in the CA15 and CPR groups (Fig. 3A). Similarly, the CA25 group had the most severe impairment in the other three enzymatic activities, including a 23% reduction from baseline in NADH-ferricyanide reductase (NFR) activity (Fig. 3B), a 19% reduction from baseline in complex II activity (Fig. 3C) and a 28% reduction from baseline in complex III activity (Fig. 3D). However, the CPR group showed less injury in the ETC activities than the CA25 group and was not different from the CA15 group (Fig. 3B–3D). There were no significant differences in the enzymatic activity of complex IV among all four groups in our study (Fig. 3E).
Figure 3.
ETC complex activities in isolated mitochondria. The CA25 group had the lowest activity for complex I–III in all groups. The CA15 and CPR groups were not significantly different from each other. (A) Complex I activity (nmol NADH oxidized/min/mg protein) in the CA25 group had a 55% reduction from baseline and the CA15 and CPR groups had only about a 21% reduction from baseline. (B) The NADH-ferricyanide reductase (NFR) activity (nmol ferricyanide reduced/min/mg protein) in the CA25 group showed a 23% reduction from baseline. (C) Complex II activity (nmol DCPIP reduced/min/mg protein) in the CA25 group had a 19% reduction from baseline. (D) Complex III activity (nmol cytochrome c reduced/min/mg protein) in the CA25 group had a 28% reduction from baseline. (E) Complex IV activity (nmol ferrocytochrome c oxidized/min/mg protein) was not statistically different between groups. (Data expressed as mean ± SEM, n=8 in all groups, *p < 0.001, †p < 0.01, ‡p < 0.05)
Western blotting of mitochondrial complexes
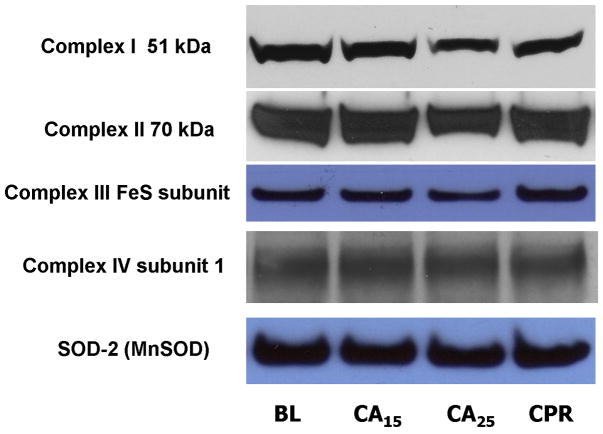
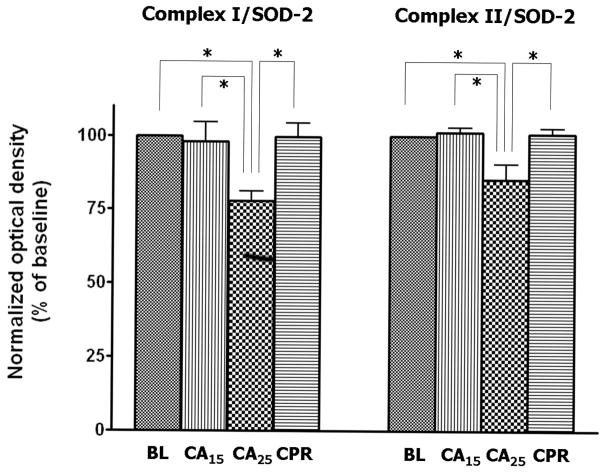
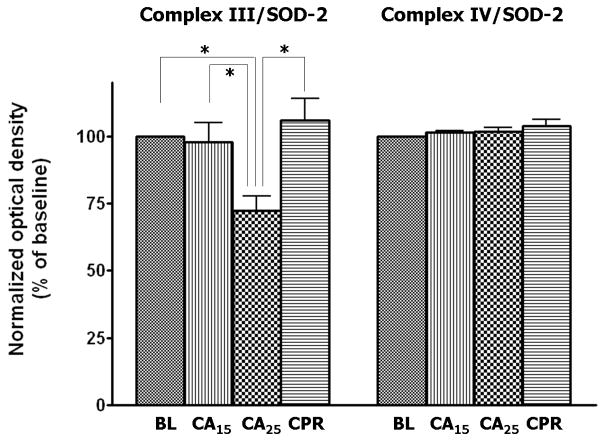
Mitochondrial samples were probed with antibodies against the ETC complexes to determine the level of protein expression. Superoxide dismutase-2 (SOD-2, MnSOD) was used as the loading control for Western blotting (Fig. 4A) due to its stability in the tissue homogenates from normal, ischemic, and post-ischemic myocardium (data not shown). The blots were scanned and analyzed by NIH ImageJ software and all densitometric measurements were normalized to baseline. The CA25 group showed a weaker signal of immunoblotting for all complexes except complex IV (Fig. 4A). After normalization to SOD-2, the CA25 group had a 22% loss of complex I 51kDa subunit (p < 0.05, Fig. 5B), a 15% loss of complex II 70 kDa subunit (p < 0.05, Fig. 4B) and a 28% loss of complex III FeS subunit (p < 0.05, Fig. 4C) when compared to the BL group. In contrast, the signal intensity of the CA15 or CPR group was not significantly different from that of the BL group in regard to all probed proteins, thus supporting the hypothesis of preservation of ETC complexes by CPR (Fig. 4B & 4C).
Figure 4.
Western blot and densitometry of isolated mitochondria in different groups.
(A) Western blot of mitochondrial proteins probed for ETC complexes. There was less complex I 51 kDa subunit, complex II 70 kDa subunit and complex III FeS subunit in the CA25 group than the other groups. (B&C) Densitometry of western blots (normalized to SOD-2) showed approximately 22% loss of complex I 51 kDa subunit, 15% loss of complex II 70 kDa subunit and 28% loss of complex III FeS subunit in the CA25 group compared to baseline. There was no difference in complex IV protein expression between groups. (Data expressed as mean ± SEM, n = 4/group, *p < 0.05)
Figure 5.
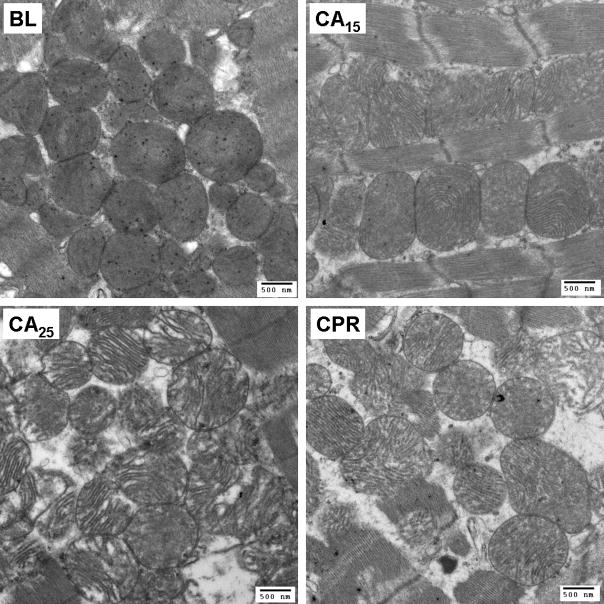
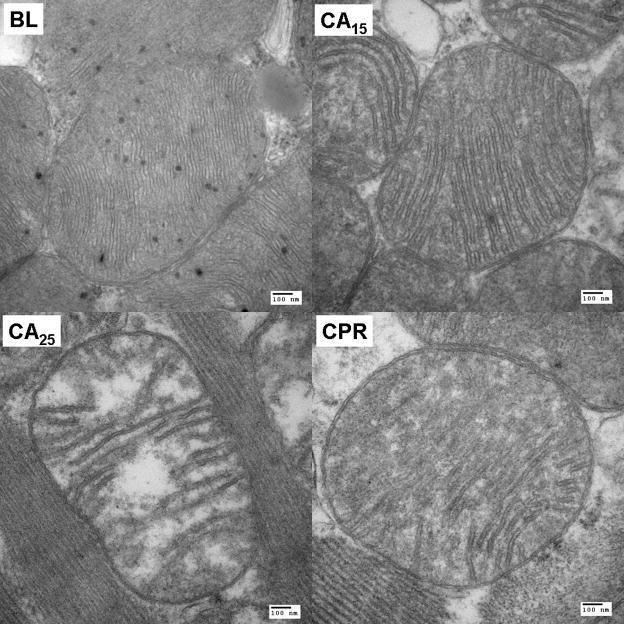
Representative electron micrographs of subendocardial mitochondria. (A) Ultrastructural changes of mitochondria, including swelling, decreased matrix density and cristae disintegration, were more discernible in the CA25 group (magnification at 18500X, scale bar = 500 nm). (B) A close look at single mitochondrion of each group (magnification at 68000X, scale bar = 100 nm).
TEM analysis of in situ mitochondria
TEM images of subendocardial mitochondria with 18500X and 68000X magnification are shown in Fig. 5A & 5B, respectively. Mitochondria of the BL group were compact, with a higher matrix density and multiple visible matrix dense granules. After 15 min of cardiac arrest, we observed the swelling of mitochondria, which was accompanied with the decrease of matrix density and separation of cristae. The morphological changes of mitochondria were more significant in the CA25 group. Swollen mitochondria with substantial clear areas inside were noted and the cristae were disintegrated. Some mitochondria were disrupted, with irregular shapes and loss of outer and inner membranes. Mitochondria in the CPR group exhibited a modest damage pattern. The severity of mitochondrial disruption, cristae separation and matrix clearing of the CPR group was between that of the CA15 and CA25 groups. Except in the BL group, the matrix dense granules were rarely seen in mitochondria from the other three groups.
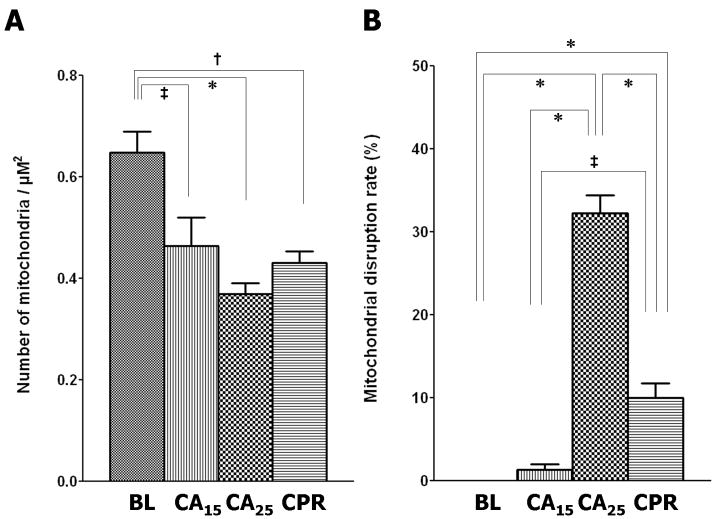
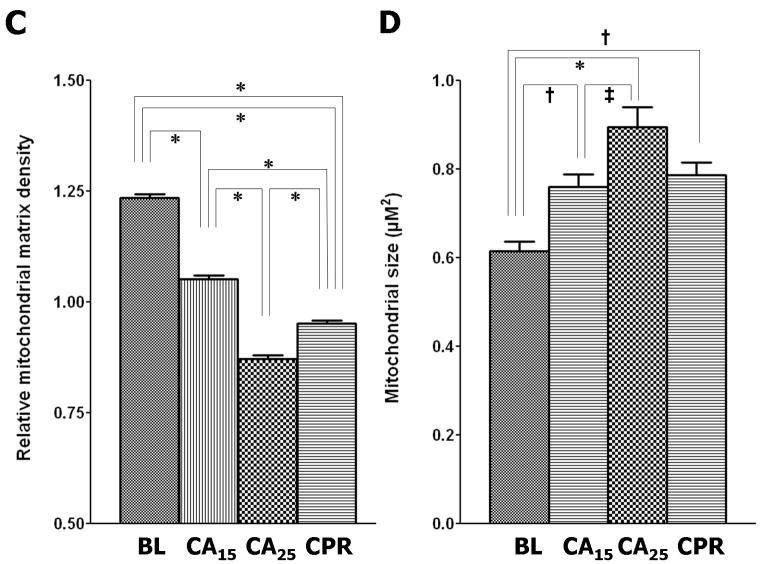
Morphometric analysis of the electron micrographs further supported our visual impression. Four quantitative parameters were used to assess mitochondrial injury; mitochondrial population density (Fig. 6A), disruption rate (Fig. 6B), relative matrix density (Fig. 6C) and size (Fig. 6D). In the CA15 group, the population density declined (72% of baseline, p < 0.05), the disruption rate increased (1.3%, p > 0.05), the relative matrix density decreased (85% of baseline, p < 0.001) and the average size increased (124% of baseline, p < 0.01). The CA25 group had the greatest injury profile, including the lowest population density (57% of baseline, p < 0.001) and relative matrix density (71% of baseline, p< 0.001), the highest disruption rate (31.8%, p < 0.001) and the largest average size (146% of baseline, p < 0.001). In the CPR group the values of mitochondrial population density (66% of baseline, p < 0.01), disruption rate (10.0%, p < 0.001), relative matrix density (77% of baseline, p < 0.001) and average size (128% of baseline, p < 0.01) were all intermediary between the CA15 and CA25 groups.
Figure 6.
Morphometric analysis of TEM images. (A) Mitochondrial population density, calculated from total mitochondria in 5 different micrographs (6800X) per group. (B) Mitochondrial disruption rate, calculated from total mitochondria in 5 different micrographs (6800X) per group. (C) Relative mitochondrial matrix density (normalized to the electron density of myofibrils), analyzed from 100 random mitochondria in 5–8 micrographs (6800X and 18500X) per group. (D) Mitochondrial size, analyzed from 100 random mitochondria in 5–8 micrographs (6800X and 18500X) per group. (Data expressed as mean ± SEM, *p < 0.001, †p < 0.01, ‡p < 0.05)
Discussion
In the current study using a rodent CPR model, we have demonstrated that 10 min of CPR following an untreated 15 min cardiac arrest (25 min total) maintains mitochondrial function at the level seen with 15 min cardiac arrest alone. Preservation of mitochondrial function during the CPR period is further supported by the preservation of mitochondrial morphology seen with TEM. Despite the low blood flow and oxygen supply with CPR, the mitochondrial injury induced by 15 min of ischemia did not progress further during the 10 min CPR period. This was in sharp contrast to the significant decrease in mitochondrial function and altered morphology seen after 25 min of cardiac arrest without CPR. These findings suggest that CPR is sufficient to interrupt or slow the ongoing ischemic insult imposed on mitochondria, and possibly extend the viability of the myocardium during cardiac arrest.
Mitochondrial function has been shown to decline progressively during ischemia. This dysfunction following ischemia is mainly associated with impaired complex I activity [15–19]. In isolated perfused hearts, complex I activity begins to deteriorate after 15 min of ischemia, and the onset of irreversible myocardial damage occurs at around 30 min of ischemia [5]. Consistent with these previous studies, we found that complex I activity is more susceptible to ischemia than the other ETC complexes. Twenty-five minutes of ischemia caused about 55% reduction of complex I activity and 23% loss of NFR activity, which could be mitigated with the intervention of CPR. In addition, the immunoblotting analysis showed that a 22% reduction of the hydrophilic 51 kDa flavoprotein subunit, which is the first component of complex I to accept the electrons from NADH through flavin mononucleotide (FMN) [20]. This reduction was similar to the degree of impairment seen in NFR activity. Since the decrease of NFR activity (23%) and protein expression of 51 kDa subunit (22%) only accounts for 40% of the decline of complex I activity (55%), there must be other factors contributing to the reduction of complex I activity during ischemia. These factors may include the loss of FMN [17], tissue acidosis and ATP depletion [21], reactive oxygen species and cardiolipin damage [18], and conformational change from active form to a “de-active” form [22]. Furthermore, it has been reported that the dissociation of flavoprotein from complex I can be induced in vitro under an acidic environment [23,24]. Ischemic acidosis which develops during cardiac arrest might also facilitate the process of flavoprotein dissociation, which, in turn, hinders electron transfer and impairs complex I activity. Damage to the iron-sulfur protein fraction and/or hydrophobic protein fraction of complex I could be another factor associated with the decline of complex I activity during cardiac arrest. Whether these potential contributing factors contribute to the beneficial effects of CPR remains to be explored.
In support of our hypothesis that mitochondrial function is positively related to complex I activity, we observed an excellent linear relationship (adjusted R2 = 0.985, supplemental Fig. S-2) between mitochondrial RCR (Fig. 2B) and complex I activity (Fig. 3A). Intervention at complex I, such as blockade of electron transfer either by rotenone, amobarbital [19], or nitrite [25] has been investigated as a strategy to preserve mitochondrial function during ischemia. Considering the possible factors associated with the loss of complex I activity, development of a combinatory approach may increase the chance of ROSC and survival. A strategy to preserve complex I activity during cardiac arrest and CPR, might include the use of reversible complex I blockers and antioxidants to synergistically prevent more mitochondrial damage.
Compared with complex I, the injuries of complex II and III in the current study were found to be less severe after 25 min of ischemia. In addition, the decreases of enzymatic activity (complex II: 19%; complex III: 28%) are accompanied with comparable levels of depression in protein expression (complex II: 15%; complex III: 28%). Rouslin [15] has reported no change of complex II activity and a 26% decrease of complex III activity in hearts subjected to 60 min of autolysis. Others have reported a 20% reduction of complex III activity in isolated buffer-perfused hearts subjected to 25–30 min of ischemia [26,27]. The discrepancy in our complex II activity may be related to the full activation by pre-incubation with succinate, which was not performed in Rouslin’s protocol. It has been shown in vitro that the oxidative injury of complex II impairs the protein-protein interaction with complex III [14], which interaction is also expected to be affected by damaged complex III. That may help explain why, in our study, the depression of FAD-linked respiration was about the same as the depression of NAD-linked respiration in the CA25 group although the level of complex II injury was less severe than that of complex I.
Observations from the TEM images of in situ mitochondria were in agreement with the biochemical results. The ultrastructural changes of subendocardial mitochondria, including swelling, loss of matrix density and cristae disintegration, correlated well with the time of cardiac arrest, which was compatible with previous work [28]. With the intervention of CPR, the ischemic damage to mitochondria was ameliorated in every aspect of morphological features. These visual findings were confirmed by the morphometric analysis, which exhibited a similar pattern. Twenty-five minutes of cardiac arrest resulted in significant mitochondrial loss (represented by population density and disruption rate) and swelling (represented by matrix density and average size). In contrast, all parameters were improved in the CPR group, indicating the preservation of mitochondrial quantity and morphology. It has been suggested that the functional recovery during reperfusion correlates with mitochondrial morphological grading [28]. Thus, it is reasonable to assume that the CPR group would have a better functional recovery than the CA25 group.
Our study was limited by the absence of outcome data to show if preserved mitochondrial function could be translated into improved myocardial function following successful resuscitation. By using the isolated blood-perfused heart model, our preliminary data suggests that hearts undergoing 15 min of ischemia and 10 min of 10% baseline flow had an improved recovery of rate pressure product at 1 hr of reperfusion compared to those undergoing 25 min of ischemia (unpublished). Additional work is needed to elucidate the relationship between mitochondrial preservation, ROSC rate and post-resuscitation cardiac function. Another potential limitation in extrapolating our results to clinical cardiac arrest is the use of the KCl-induced cardiac arrest model, which likely has different mitochondrial oxygenation implications than the ventricular fibrillation or asphyxia models of cardiac arrest. However, the KCl-arrested heart does simulate clinical asystole and pulseless electrical activity (PEA) cardiac arrest, which now constitutes greater than 50% of out-of-hospital cardiac arrests [29]. The strength of this model is the ability to study mitochondrial changes under actual in vivo cardiac arrest conditions.
In conclusion, our results show that, despite the inherent low oxygen delivery, CPR after prolonged cardiac arrest preserves heart mitochondrial function and morphology. It demonstrates the beneficial effects of CPR from a subcellular perspective for the first time. Preservation of mitochondrial function is reflected by improved mitochondrial respiration, ETC complex activities, preservation of the ETC proteins. Additionally, complex I is the most sensitive ETC complex to ischemic injury and its activity is positively correlated with mitochondrial respiration. Future work is needed to address how preservation of complex I activity during cardiac arrest might further preserve mitochondrial function and possibly improve the current low success rate of clinical resuscitation.
Supplementary Material
Figure S-1. Extraction and breakage ratios of mitochondria during isolation process. The BL group had the highest extraction ratio and the least breakage ratio while the CA25 group showed the opposite findings. There was no difference between the CA15 and CPR groups in regard to both mitochondrial extraction and breakage. (Data expressed as mean ± SEM, n=3/group, *p < 0.001, †p < 0.01, ‡p < 0.05)
Figure S-2. Linear regression graph of complex I activity and RCR. The regression line was plotted with 95% confidence interval. Adjusted R2 = 0.985. The NIHMS has received the file ‘mmc1.tif’ as supplementary data. The file will not appear in this PDF Receipt, but it will be linked to the web version of your manuscript.
Acknowledgments
We thank Mr. Richard Montione from the OSU Campus Microscopy and Imaging Facility for TEM technical assistance. This study was supported by grants from the American Heart Association (60015791, Angelos) and the National Institutes of Health (HL083237, Chen).
Footnotes
Publisher's Disclaimer: This is a PDF file of an unedited manuscript that has been accepted for publication. As a service to our customers we are providing this early version of the manuscript. The manuscript will undergo copyediting, typesetting, and review of the resulting proof before it is published in its final citable form. Please note that during the production process errors may be discovered which could affect the content, and all legal disclaimers that apply to the journal pertain.
References
- 1.Ali B, Zafari AM. Narrative review: cardiopulmonary resuscitation and emergency cardiovascular care: review of the current guidelines. Ann Intern Med. 2007 Aug 7;147(3):171–9. doi: 10.7326/0003-4819-147-3-200708070-00006. [DOI] [PubMed] [Google Scholar]
- 2.ECC Committee, Subcommittees and Task Forces of the American Heart Association. American Heart Association guidelines for cardiopulmonary resuscitation and emergency cardiovascular care. Circulation. 2005 Dec 13;112(Suppl IV):IV-1–211. doi: 10.1161/CIRCULATIONAHA.105.166550. [DOI] [PubMed] [Google Scholar]
- 3.Kern KB. Coronary perfusion pressure during cardiopulmonary resuscitation. Best Practice & Research Clinical Anaesthesiology. 2000 Sep;14(3):591–609. [Google Scholar]
- 4.Klawitter PF, Murray HN, Clanton TL, Palmer BS, Angelos MG. Low flow after global ischemia to improve postischemic myocardial function and bioenergetics. Crit Care Med. 2002 Nov;30(11):2542–7. doi: 10.1097/00003246-200211000-00023. [DOI] [PubMed] [Google Scholar]
- 5.Lesnefsky EJ, Moghaddas S, Tandler B, Kerner J, Hoppel CL. Mitochondrial dysfunction in cardiac disease: ischemia--reperfusion, aging, and heart failure. J Mol Cell Cardiol. 2001 Jun;33(6):1065–89. doi: 10.1006/jmcc.2001.1378. [DOI] [PubMed] [Google Scholar]
- 6.Rea TD, Cook AJ, Hallstrom A. CPR during ischemia and reperfusion: a model for survival benefits. Resuscitation. 2008 Apr;77(1):6–9. doi: 10.1016/j.resuscitation.2007.10.010. [DOI] [PubMed] [Google Scholar]
- 7.Costa AD, Quinlan CL, Andrukhiv A, West IC, Jaburek M, Garlid KD. The direct physiological effects of mitoK(ATP) opening on heart mitochondria. Am J Physiol Heart Circ Physiol. 2006 Jan;290(1):H406–H415. doi: 10.1152/ajpheart.00794.2005. [DOI] [PubMed] [Google Scholar]
- 8.Lowry OH, Rosebrough NJ, Farr AL, Randall RJ. Protein measurement with the Folin phenol reagent. J Biol Chem. 1951 Nov;193(1):265–75. [PubMed] [Google Scholar]
- 9.Williams JN., Jr A method for the simultaneous quantitative estimation of cytochromes a, b, c1, and c in mitochondria. Arch Biochem Biophys. 1964 Sep;107:537–43. doi: 10.1016/0003-9861(64)90313-3. [DOI] [PubMed] [Google Scholar]
- 10.Han Z, Chen YR, Jones CI, III, Meenakshisundaram G, Zweier JL, Alevriadou BR. Shear-induced reactive nitrogen species inhibit mitochondrial respiratory complex activities in cultured vascular endothelial cells. Am J Physiol Cell Physiol. 2007 Mar;292(3):C1103–C1112. doi: 10.1152/ajpcell.00389.2006. [DOI] [PubMed] [Google Scholar]
- 11.Chen YR, Chen CL, Pfeiffer DR, Zweier JL. Mitochondrial complex II in the post-heart: oxidative injury and the role of protein S-glutathionylation. J Biol Chem. 2007 Nov 9;282(45):32640–54. doi: 10.1074/jbc.M702294200. [DOI] [PubMed] [Google Scholar]
- 12.Chen S, Guillory RJ. Studies of the ferricyanide reductase activities of the mitochondrial reduced nicotinamide adenine dinucleotide-ubiquinone reductase (complex I) utilizing arylazido-beta-alanyl NAD+ and arylazido-beta-alanyl NADP+ J Bioenerg Biomembr. 1985 Feb;17(1):33–49. doi: 10.1007/BF00744987. [DOI] [PubMed] [Google Scholar]
- 13.Barrientos A. In vivo and in organello assessment of OXPHOS activities. Methods. 2002 Apr;26(4):307–16. doi: 10.1016/S1046-2023(02)00036-1. [DOI] [PubMed] [Google Scholar]
- 14.Chen CL, Chen J, Rawale S, Varadharaj S, Kaumaya PP, Zweier JL, et al. Protein tyrosine nitration of the flavin subunit is associated with oxidative modification of mitochondrial complex II in the post-ischemic myocardium. J Biol Chem. 2008 Oct 10;283(41):27991–8003. doi: 10.1074/jbc.M802691200. [DOI] [PMC free article] [PubMed] [Google Scholar]
- 15.Rouslin W. Mitochondrial complexes I, II, III, IV, and V in myocardial ischemia and autolysis. Am J Physiol. 1983 Jun;244(6):H743–H748. doi: 10.1152/ajpheart.1983.244.6.H743. [DOI] [PubMed] [Google Scholar]
- 16.Flameng W, Andres J, Ferdinande P, Mattheussen M, Van Belle H. Mitochondrial function in myocardial stunning. J Mol Cell Cardiol. 1991 Jan;23(1):1–11. doi: 10.1016/0022-2828(91)90034-j. [DOI] [PubMed] [Google Scholar]
- 17.Rouslin W, Ranganathan S. Impaired function of mitochondrial electron transfer complex I in canine myocardial ischemia: loss of flavin mononucleotide. J Mol Cell Cardiol. 1983 Aug;15(8):537–42. doi: 10.1016/0022-2828(83)90329-2. [DOI] [PubMed] [Google Scholar]
- 18.Paradies G, Petrosillo G, Pistolese M, Di VN, Federici A, Ruggiero FM. Decrease in mitochondrial complex I activity in ischemic/reperfused rat heart: involvement of reactive oxygen species and cardiolipin. Circ Res. 2004 Jan 9;94(1):53–9. doi: 10.1161/01.RES.0000109416.56608.64. [DOI] [PubMed] [Google Scholar]
- 19.Chen Q, Camara AK, Stowe DF, Hoppel CL, Lesnefsky EJ. Modulation of electron transport protects cardiac mitochondria and decreases myocardial injury during ischemia and reperfusion. Am J Physiol Cell Physiol. 2007 Jan;292(1):C137–C147. doi: 10.1152/ajpcell.00270.2006. [DOI] [PubMed] [Google Scholar]
- 20.Brandt U. Energy converting NADH:quinone oxidoreductase (complex I) Annu Rev Biochem. 2006;75:69–92. doi: 10.1146/annurev.biochem.75.103004.142539. [DOI] [PubMed] [Google Scholar]
- 21.Rouslin W. Effects of acidosis and ATP depletion on cardiac muscle electron transfer complex I. J Mol Cell Cardiol. 1991 Oct;23(10):1127–35. doi: 10.1016/0022-2828(91)90202-w. [DOI] [PubMed] [Google Scholar]
- 22.Maklashina E, Sher Y, Zhou HZ, Gray MO, Karliner JS, Cecchini G. Effect of anoxia/reperfusion on the reversible active/de-active transition of NADH-ubiquinone oxidoreductase (complex I) in rat heart. Biochim Biophys Acta. 2002 Oct 3;1556(1):6–12. doi: 10.1016/s0005-2728(02)00280-3. [DOI] [PubMed] [Google Scholar]
- 23.Pharo RL, Sordahl LA, Vyas SR, Sanadi DR. Studies on dihydronicotinamide adenine dinucleotide ubiquinone reductase. I. Assay of ubiquinone reductase activity in submitochondrial particles and extracts. J Biol Chem. 1966 Oct 25;241(20):4771–80. [PubMed] [Google Scholar]
- 24.Chen YR, Chen CL, Zhang L, Green-Church KB, Zweier JL. Superoxide generation from mitochondrial NADH dehydrogenase induces self-inactivation with specific protein radical formation. J Biol Chem. 2005 Nov 11;280(45):37339–48. doi: 10.1074/jbc.M503936200. [DOI] [PubMed] [Google Scholar]
- 25.Dezfulian C, Shiva S, Pendyal A, Alekseyenko A, Anderson SA, Gladwin MT. Abstract P34: Nitrite Therapy upon Resuscitation from Cardiac Arrest Reversibly Inhibits Mitochondrial Complex I Reducing ROS Burst and Improving Cardiac Function and Survival. Circulation. 2008 Oct 28;118:S_1452. 18_MeetingAbstracts. [Google Scholar]
- 26.Petrosillo G, Ruggiero FM, Di VN, Paradies G. Decreased complex III activity in mitochondria isolated from rat heart subjected to ischemia and reperfusion: role of reactive oxygen species and cardiolipin. FASEB J. 2003 Apr;17(6):714–6. doi: 10.1096/fj.02-0729fje. [DOI] [PubMed] [Google Scholar]
- 27.Lesnefsky EJ, Gudz TI, Migita CT, Ikeda-Saito M, Hassan MO, Turkaly PJ, et al. Ischemic injury to mitochondrial electron transport in the aging heart: damage to the iron-sulfur protein subunit of electron transport complex III. Arch Biochem Biophys. 2001 Jan 1;385(1):117–28. doi: 10.1006/abbi.2000.2066. [DOI] [PubMed] [Google Scholar]
- 28.Edoute Y, van der ME, Sanan D, Kotze JC, Steinmann C, Lochner A. Normothermic ischemic cardiac arrest of the isolated working rat heart. Effects of time and reperfusion on myocardial ultrastructure, mitochondrial oxidative function, and mechanical recovery. Circ Res. 1983 Nov;53(5):663–78. doi: 10.1161/01.res.53.5.663. [DOI] [PubMed] [Google Scholar]
- 29.Nichol G, Thomas E, Callaway CW, Hedges J, Powell JL, Aufderheide TP, et al. Regional variation in out-of-hospital cardiac arrest incidence and outcome. JAMA. 2008 Sep 24;300(12):1423–31. doi: 10.1001/jama.300.12.1423. [DOI] [PMC free article] [PubMed] [Google Scholar]
Associated Data
This section collects any data citations, data availability statements, or supplementary materials included in this article.
Supplementary Materials
Figure S-1. Extraction and breakage ratios of mitochondria during isolation process. The BL group had the highest extraction ratio and the least breakage ratio while the CA25 group showed the opposite findings. There was no difference between the CA15 and CPR groups in regard to both mitochondrial extraction and breakage. (Data expressed as mean ± SEM, n=3/group, *p < 0.001, †p < 0.01, ‡p < 0.05)
Figure S-2. Linear regression graph of complex I activity and RCR. The regression line was plotted with 95% confidence interval. Adjusted R2 = 0.985. The NIHMS has received the file ‘mmc1.tif’ as supplementary data. The file will not appear in this PDF Receipt, but it will be linked to the web version of your manuscript.


