

Abstract
Improved understanding of the etiology of ERα-negative and PR-negative breast cancers may permit improved risk prediction. In vitro studies implicate DNA hypermethylation of the ERα and PR promoters in the pathogenesis of ERα-negative and PR- negative tumors, but results are not definitive. We evaluated 200 invasive breast cancers selected from a population-based case-control study. DNA extracted from fixed tumor tissue cores was tested using MethyLight to assess DNA methylation at 4 CpG islands: ESR1 promoter A and B; PGR promoter A and B; and a CpG shore, ESR1 promoter C. DNA methylation results were compared to levels of ERα, PR, tumor characteristics, and breast cancer risk factors. We observed mild to moderate DNA methylation levels in most tumors for ESR1 promoters A and B and PGR promoter B, and a few tumors showed mild methylation in PGR promoter A. In contrast, ESR1 promoter C showed a wide range of methylation and was weakly correlated with lower expression levels of ERα (β=−0.26; p<0.0001) and PR (β=−0.25; p<0.0001). The percentage of tumors with methylated PGR promoters A and B was significantly higher for tumors with low ERα (A, Fisher’s test p=0.0001; B, p=0.033) and PR levels (A, p=0.0006; B, p=0.001). Our data suggest that the relationships between DNA methylation of ESR1 and PGR promoters and protein expression are weak and unlikely to represent a predominant mechanism of receptor silencing. In contrast to CpG-islands, ESR1 promoter C showed a wider range of methylation levels and inverse associations with ERα and PR expression.
INTRODUCTION
In the United States, the majority of breast cancers are diagnosed among post-menopausal women and express estrogen- and progesterone- receptors (i.e., ERα-positive, PR-positive) (1–3). In contrast to ERα-negative tumors, studies of ERα-positive tumors have identified etiologic associations that suggest potential strategies for risk reduction (1, 3–5). Specifically, controlling post-menopausal obesity, limiting the use of hormone replacement medications and chemoprevention with selective estrogen receptor modulators represent promising avenues for reducing risk for ERα-positive tumors, but would have minimal impact on ERα-negative cancers (5). Accordingly, efforts to increase our knowledge about the pathogenesis of ERα-negative tumors are important, especially because these tumors disproportionately affect young women and African-American women (6).
Among the mechanisms that have been linked to the development of receptor negative tumors, DNA hypermethylation of CpG islands in promoters of the ERα and PR genes has received the greatest attention (7). In experimental systems, DNA hypermethylation of gene promoter regions represents a somatically heritable mechanism for expression silencing (8). In particular, studies of some, but not all breast cancer cell lines have demonstrated that methylation is associated with decreased expression of ERα mRNA and protein (9–12), and that treatment with demethylating agents results in restoration of expression (13). However, translating these findings to human tumors has proven to be more complex. Although several studies have found statistically significant associations between the frequency of DNA promoter methylation and ERα status (14–16), data generally suggest that methylation is not restricted to ERα-negative tumors (12, 15) and some studies have found null associations between methylation and protein expression (17).
Most studies of the relationship between DNA methylation and gene expression of ERα and PR have been based on small sets of clinical samples without detailed annotation or selection criteria (7, 12–20). Analyses of large, representative samples of breast cancer cases are important to more fully define the relationships between DNA methylation and hormone receptor expression, tumor characteristics, and risk factors. Accordingly, we performed an analysis of 200 breast cancer cases ascertained in a population-based case-control study to examine the relationship between DNA methylation of ESR1 and PGR and these factors.
METHODS
Study Population
Cases were identified in a large population-based case-control study, conducted among women aged 20 to 74 years residing in two Polish cities, Warsaw and Lodz from 2000–2003 as described in detail elsewhere (21). Eligible cases were women diagnosed with incident histologically-confirmed in situ or invasive breast cancer identified through a rapid identification system. Controls included women randomly identified in population lists who had not been diagnosed with breast cancer, frequency-matched to cases by city and age. Institutional Review Board approval was obtained from all participating institutions, and signed informed consent was obtained for all respondents. A total of 2,386 cases (79% of the 3,037 eligible cases identified) and 2,502 controls (69% of the 3,639 eligible controls identified) were enrolled.
Enrollment Procedures
Trained interviewers queried participants about known or suspected breast cancer risk factors (21). Women were considered pre-menopausal if still menstruating at the time of interview, post-menopausal if periods had stopped, and unclear menopausal status if menopausal hormone replacement therapy (HRT) was initiated before cessation of natural periods. Body mass index (BMI) was calculated using measured (during the time of the interview) weight (kg) divided by standing height (m) squared. For about 5% of subjects with missing information, BMI was calculated from self-reported information. Women who reported having had a benign breast biopsy one year prior to cancer diagnosis (cases) or interview (controls) were considered to have had a history of benign breast disease.
Pathology
Histopathologic features including histologic type, grade, tumor size, and axillary lymph node metastases were assessed using clinical reports and independent evaluation by the study pathologist (M.E.S). Results of ERα and PR assays (negative vs. positive) performed for clinical management primarily using immunohistochemical stains of whole sections were available for 77% of cases.
Routinely prepared formalin-fixed, paraffin-embedded tissue blocks from 900 invasive breast cancers were used to construct 5 tissue microarrays (TMA) blocks with 3-fold representation as 0.6-mm diameter cores (Beecher Instruments, Silver Spring, MD). Tissue sections of 5 µm thickness were placed on glass slides using a tape-transfer system (Instrumedics, Inc., Hackensack, NJ) with ultraviolet cross-linking, dipped in paraffin, and stored at room temperature under nitrogen to help preserver antigenicity. TMAs were analyzed for ERα and PR using Automated Quantitative Analysis (AQUA), an automated quantitative immunofluorescent assay (22, 23), as previously described (24). In an earlier set of TMAs from the study, ERα and PR expression, as measured independently by AQUA and by visual assessment of conventional immunostains were highly correlated (r2>0.80). In addition, AQUA scores were significantly higher for cases with positive clinical tests for ERα and PR as compared to those that were negative (both comparisons, p<0.0001) (24). The 200 cases studied herein were represented in a new set of TMAs. One case had a missing AQUA value for expression of PR.
Tumor Sampling Pilot Study for MethyLight Analysis
To determine the number of tissue cores required to determine DNA methylation status, we conducted a pilot study of 12 tumors. First, we examined hematoxylin and eosin stained sections of the tumors to identify corresponding areas of essentially pure cancer in each block. Then, using a 1.0-diameter TMA needle, we removed 3 cores of tissue scattered within these regions for testing. In between tumor core sampling, the TMA needle was “cleaned” by punching an empty paraffin block three times. DNA extracted from each fixed core (see DNA Extraction protocol below), quantified, and assessed using a DNA ladder. Cores yielded DNA of sufficient quantity for MethyLight assays, consisting mainly of 500–1500bp fragments. DNA was bisulfite modified and used to perform MethyLight analysis for ESR1 and PGR promoter regions (see Bisulfite Conversion and DNA DNA methylation Analysis). The DNA methylation results expressed as percentage of methylated reference (PMR) relative to a standard of 100% methylated DNA were assessed categorically (0, >0–5, >5–50, >50) for 5 DNA methylation markers related to ESR1 and PGR. The percentage of the 12 tumors that gave exact agreement between the 3 cores for the 5 loci tested ranged from 60–80%. Cases never had more than one discordant core, which always varied by one category from the other two (data not shown). Therefore, we concluded that one core was adequate for testing.
MethyLight Analysis at Five Loci Related to ESR1 and PGR of Breast Cancers Cases
We randomly selected 200 eligible cases who were not taking postmenopausal hormones at baseline and who previously were included in a tissue microarray (see Pathology). Single tumor-enriched cores (removed as noted above) were used for DNA extraction, bisulfite treatment, and MethyLight assays (see Bisulfite Conversion and DNA Methylation Analysis). We randomly tested 10 empty cores prepared to “clean” the TMA needle between core sampling for the presence of DNA; all were negative. Two cores were extracted for 20 cases to provide duplicate samples for MethyLight analysis.
DNA Extraction from Tissue Cores
Tumor-enriched DNA cores were deparaffinized by incubation in 1.0 ml of xylene at room temperature for 30 min, removing the fluid after centrifugation, and repeating the deparaffinization procedure. The resulting DNA was then treated twice with two rinses of 0.5 ml of 100% ethanol and air dried. We extracted DNA from the tissues by incubating the tubes overnight at 50°C in 50 µl of lysis buffer (100mM Tris, 1mM EDTA, 0.05% SDS, 1.5mg/ml Proteinase K, 0.05 mg/ml tRNA), followed by inactivation of Proteinase K by heating for 8 min at 95°C.
Bisulfite Conversion and DNA Methylation Analysis
DNA-containing tissue lysates were subjected to bisulfite modification using the EZ DNA Methylation Kit (Zymo Research, Orange, CA) following the protocol suggested by the manufacturer. After bisulfite conversion the quantity of DNA to be used for MethyLight analysis was assessed by testing a small aliquot of the recovered bisulfite-converted DNA by real time PCR using the ALU-based bisulfite specific, methylation-independent control reaction (see details about this reaction in Supplemental Table 1). MethyLight reactions were designed for three of the multiple alternative promoters of the ESR1 gene (promoters A, B, and C) (25), and the two PGR alternative promoters (promoters A and B) (26) (Supplemental Figure 1). Except for the CpG shore (27) near ESR1 promoter C, all the other promoters were located in CpG islands (28, 29). The primer/probe sequences for these reactions are detailed in the Supplemental Table 1. MethyLight analyses for the five ESR1 and PGR isoforms gene promoters were performed as previously described (30, 31). MethyLight results measure the level of DNA methylation at specific loci in test samples compared to a completely methylated DNA reference, yielding percentage of fully methylated reference (PMR) for specific CpGs of target genes (32).
Statistical Analysis
PMR values were assessed in two ways: as continuous log-transformed values approximating a normal distribution and as categorical measures. For consistency across publications using MethyLight, we used the categories and description of PMR values as previously defined (32, 33): no methylation (0 PMR); “mild” (>0–5 PMR); “moderate” (5–50 PMR), and “heavy methylation” (>50 PMR). ERα and PR expression was measured based on AQUA scores. AQUA values for each protein were centered on the mean and then log-transformed. In statistical models, AQUA values were treated as continuous measures and categorized into positive (higher levels) and negative (lower levels) expression based on the distribution (separately by study site) of previous findings (34). The following breast cancer risk factors were treated as continuous variables when possible: education, parity, age at first birth (per 5 year increase), age at menarche, age at menopause (per 5 year increase), menopausal status, premenopausal and postmenopausal BMI (per 5 unit increase), family history of breast cancer, and history of benign breast disease.
To assess whether the cases selected for analysis were representative of all Polish cancers, we compared the distribution of subject characteristics for the subset of 200 subjects to that of all other cases using chi-square tests. To assess reproducibility, we compared DNA methylation PMR values for duplicate cores of 20 samples using the kappa statistic for categorical variables and Spearman correlation for continuous variables. Relationships between categorical variables were assessed using Fischer’s exact test. Spearman correlation coefficients were calculated to estimate the association between continuous exposure and outcome variables. To assess determinants of DNA methylation, we used linear regression models with continuous PMR values as the outcome and continuous AQUA values and risk factor data as the explanatory variables. Age and study site were included in crude models and multivariable models also included all risk factors under study. Associations between protein expression of ERα (categorized) and DNA methylation (categorized) of PR and vice versa were assessed using the Cochran Mantel-Haenszel test. To investigate whether the relationship between ERα expression and DNA methylation varied by PR status, we evaluated linear regression models that included a cross-product term of PMR values (continuous) and ERα expression (continuous).
RESULTS
Study Population
The 200 cases selected for this study were similar to the larger population-based sample of cases with respect to most, but not all epidemiologic risk factors (Supplemental Table 2). Cases in the present study were more likely to be from Lodz than in the complete study population. The tumors of cases in the present study were more likely to be poorly differentiated and have multiple nodal metastases (Supplemental Table 2), which was explained by differences in the characteristics of available tumor blocks in Lodz compared to Warsaw (data not shown). Of the 200 cases in the present analysis, 55 (27.5%) had chemotherapy, while none had radiotherapy or hormone therapy, prior to surgery to remove the tumor.
Univariate Distribution of PMR Values
Six of the 200 cases were excluded because of low DNA quantity as assessed by high ALU C(t) values (>21). DNA methylation (PMRs>0) was evident for 84.7% of breast tumors at ESR1 promoter A, 98.0% at ESR1 promoter B, 100% at ESR1 promoter C, 7.7% at PGR promoter A, and 92.3% at PGR promoter B. The range of PMR values (0–31) was limited for each CpG region with the exception of ESR1 promoter C, which ranged from 1.8% to 362.6% with only one sample exceeding 100%. The outlier was not removed from the analysis because further examination of the DNA quantity (as measured by ALU C(t)) and assay performance did not suggest a measurement artifact and may be an indicator of multiple copies of the gene. Given the range of values, ESR1 promoter C PMR values were treated as both categorical and continuous variables. Correlation between 20 duplicate DNA methylation measurements for ESR1 promoter C was strong (r2=0.60, p-value= 0.081). Given the more limited range of the remaining CpG regions, the PMR values at these sites were categorized. Agreement between duplicate scoring of PMR values was 95% for ESR1 promoter A, 85% for ESR1 promoter B, 90% for PGR promoter A, and 75% for PGR promoter B. Greater DNA methylation was weakly significantly correlated at most CpG regions in ESR1 and PGR; however, DNA methylation at ESR1 promoter A was not correlated with DNA methylation at PGR promoter A or PGR promoter B, and DNA methylation at two PGR promoter regions was not correlated (Supplemental Table 3). Medians and categories of PMR values for the 5 CpG regions did not differ among tumors that received chemotherapy before surgery compared to tumors that did not receive treatment before surgery (p-values >0.25 for the non-parametric equality of means and chi-square tests, respectively; data not shown).
Categorical Analysis of DNA methylation at ESR1 and PGR Promoters and Expression of ERα
DNA methylation at ESR1 promoter A was unrelated to protein expression (Table 1), whereas DNA methylation at promoters B and C showed borderline associations with lower ERα protein expression (for B, p=0.055; for C, p=0.068; Table 1). In contrast, DNA methylation at PGR promoters was more strongly related to lower ERα levels. Specifically, statistically significant relationships were found for lower ERα levels with DNA methylation at PGR promoter A (p=0.00012) and promoter B (p=0.033), although these data were driven by relatively small differences in the number of cases per DNA methylation category. Of 15 cancers without detectable DNA methylation at PGR promoter B, 13 (87%) showed high ERα expression, whereas only 72 (40%) of 179 with detectable DNA methylation had high levels (Table 1).
Table 1.
Relationships between DNA Methylation PMR values1 and AQUA ERα Protein Expression2, 200 breast cancer cases from the Polish Breast Cancer Study, 2000–2003
| Promoters | Low ERα Expression (n=74) | High ERα Expression (n=120) | ||||
|---|---|---|---|---|---|---|
| PMR Values | N | % | N | % | p-value3 | |
| ESR1 Promoter A | ||||||
| 0 | 10 | 13.5 | 18 | 15.0 | ||
| >0–5 | 64 | 86.5 | 102 | 85.0 | ||
| >5–50 | 0 | 0.0 | 0 | 0.0 | ||
| >50 | 0 | 0.0 | 0 | 0.0 | 0.84 | |
| ESR1 Promoter B | ||||||
| 0 | 0 | 0.0 | 4 | 3.3 | ||
| >0–5 | 54 | 73.0 | 98 | 81.7 | ||
| >5–50 | 20 | 27.0 | 18 | 15.0 | ||
| >50 | 0 | 0.0 | 0 | 0.0 | 0.055 | |
| ESR1 Promoter C | ||||||
| 0 | 0 | 0.0 | 0 | 0.0 | ||
| >0–5 | 2 | 2.7 | 7 | 5.8 | ||
| >5–50 | 56 | 75.7 | 101 | 84.2 | ||
| >50 | 16 | 21.6 | 12 | 10.0 | 0.068 | |
| PGR Promoter A | ||||||
| 0 | 61 | 82.4 | 118 | 98.3 | ||
| >0–5 | 10 | 13.5 | 2 | 1.7 | ||
| >5–50 | 3 | 4.1 | 0 | 0.0 | ||
| >50 | 0 | 0.0 | 0 | 0.0 | 0.00012 | |
| PGR Promoter B | ||||||
| 0 | 2 | 2.7 | 13 | 10.8 | ||
| >0–5 | 69 | 93.2 | 106 | 88.3 | ||
| >5–50 | 3 | 4.1 | 1 | 0.8 | ||
| >50 | 0 | 0.0 | 0 | 0.0 | 0.033 | |
MethyLight results measure the level of DNA methylation at specific loci in test samples compared to a completely methylated DNA reference, yielding percentage of fully methylated reference (PMR) for specific CpGs of target genes (32). PMR values were categorized as previous defined (32): no methylation (0 PMR); mild (>0–5 PMR); moderate (5–50 PMR), and heavy methylation (>50 PMR)
Tissue microarray of breast tumors were analyzed for ERα, PR, and HERΑ-2/neu using Automated Quantitative Analysis (AQUA), an automated quantitative immunofluorescent assay (22,23), as previously described and categorized as in a previous PBCS publication (24)
Fischer’s exact test.
Categorical Analysis of DNA methylation at ESR1 and PGR Promoters and Protein Expression of PR
DNA methylation at ESR1 promoters was not significantly related to expression of PR (Table 2). However, DNA methylation at PGR promoter A (p=0.00057) and promoter B (p=0.0013) were related to low levels of PR protein. Of 15 tumors without detectable DNA methylation at PGR promoter B, 14 (93%) were classified as having high levels of PR, whereas 93 (52%) of 178 tumors that showed detectable DNA methylation at this promoter had high levels of PR protein (Table 2).
Table 2.
Relationships between DNA Methylation PMR values1 and AQUA PR Protein Expression2, 200 breast cancer cases from the Polish Breast Cancer Study, 2000–2003
| Promoters | Low PR Expression (n=86) |
High PR Expression (n=107) |
||||
|---|---|---|---|---|---|---|
| N | % | N | % | p-value3 | ||
| ESR1 Promoter A | ||||||
| 0 | 14 | 16.3 | 13 | 12.1 | ||
| >0–5 | 72 | 83.7 | 94 | 87.9 | ||
| >5–50 | 0 | 0.0 | 0 | 0.0 | ||
| >50 | 0 | 0.0 | 0 | 0.0 | 0.53 | |
| ESR1 Promoter B | ||||||
| 0 | 0 | 0.0 | 4 | 3.7 | ||
| >0–5 | 65 | 75.6 | 86 | 80.4 | ||
| >5–50 | 21 | 24.4 | 17 | 15.9 | ||
| >50 | 0 | 0.0 | 0 | 0.0 | 0.094 | |
| ESR1 Promoter C | ||||||
| 0 | 0 | 0.0 | 0 | 0.0 | ||
| >0–5 | 3 | 3.5 | 6 | 5.6 | ||
| >5–50 | 65 | 75.6 | 91 | 85.0 | ||
| >50 | 18 | 20.9 | 10 | 9.3 | 0.066 | |
| PGR Promoter A | ||||||
| 0 | 73 | 84.9 | 105 | 98.1 | ||
| >0–5 | 11 | 12.8 | 1 | 0.9 | ||
| >5–50 | 2 | 2.3 | 1 | 0.9 | ||
| >50 | 0 | 0.0 | 0 | 0.0 | 0.00057 | |
| PGR Promoter B | ||||||
| 0 | 1 | 1.2 | 14 | 13.1 | ||
| >0–5 | 82 | 95.3 | 92 | 86.0 | ||
| >5–50 | 3 | 3.5 | 1 | 0.9 | ||
| >50 | 0 | 0.0 | 0 | 0.0 | 0.0013 | |
MetMethyLight results measure the level of DNA methylation at specific loci in test samples compared to a completely methylated DNA reference, yielding percentage of fully methylated reference (PMR) for specific CpGs of target genes (32). PMR values were categorized as previous defined (32): no methylation (0 PMR); mild (>0–5 PMR); moderate (5–50 PMR), and heavy methylation (>50 PMR)
Tissue microarray of breast tumors were analyzed for ERα, PR, and HERΑ-2/neu using Automated Quantitative Analysis (AQUA), an automated quantitative immunofluorescent assay (22,23), as previously described and categorized in a previous PBCS publication (24)
Fischer’s exact test.
Analysis of DNA methylation at ESR1 Promoter C as a Continuous Measure and Expression of ERα and PR
In contrast to the other promoters studied, the wide range of DNA methylation PMR values for ESR1 promoter C was amenable to analysis as a continuous variable. Using linear regression models, DNA methylation at ESR1 promoter C was inversely associated with the degree of ERα (β= −0.26, p= <0.0001) and PR (β= −0.25, p= <0.0001) expression (Figure 1). Controlling for age and site did not significantly alter the relationship between ESR1 promoter C DNA methylation and protein expression (data not shown). In a model further adjusted by tumor characteristics (tumor size, grade, and nodal involvement) and tumor marker expression (ERα, PR, and HERΑ-2/neu), elevated ESR1 promoter C DNA methylation remained a significant predictor of expression of ERα (β= −0.18, p= 0.033). In this model, tumor size was the strongest predictor of promoter C methylation (β= −0.38, p= 0.002) (other β estimates from the full model are not shown). The inverse relationship between ERα expression and DNA methylation of ESR1 promoter C was similar among PR-positive tumors (β= −0.23, p= 0.035) and PR-negative tumors (β= −0.17, p= 0.062; p for interaction=0.45) (figures not shown). PR expression, however, was only associated with ESR1 promoter C DNA methylation among ERα-positive tumors (β= −0.18, p= 0.034) but not among ERΑ-negative tumors (β= −0.05, p= 0.68), although the interaction term was not statistically significant (p=0.40) (figures not shown).
Figure 1.
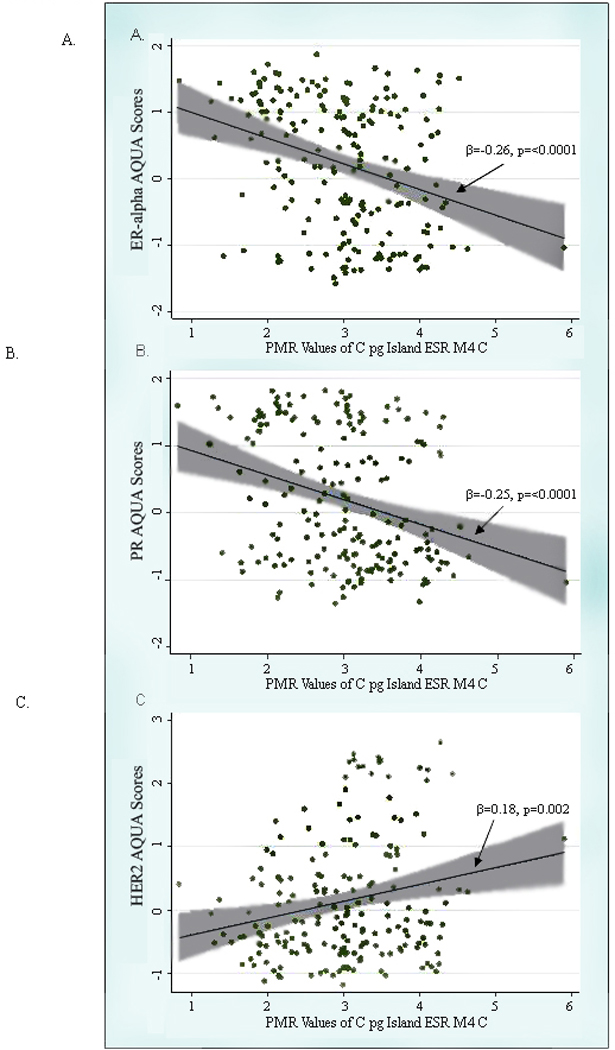
Scatterplot of PMR values of the CpG Island ESR1 M4 C and AQUA scores of a.) ERα, b.) PR, and C.) HER2-neu overlaid with the fitted linear regression line (beta coefficient and corresponding p-value provided) and the 95% confidence interval (shaded in grey).
DNA methylation, Tumor Characteristics, and Epidemiologic Risk Factors
DNA methylation at ESR1 or PGR promoters was not associated with tumor size or nodal status (data not shown). Risk factors for breast cancer were not related to DNA methylation data when analyzed categorically (data not shown). When DNA methylation results for ESR1 promoter C were analyzed as a continuous measure, age at first full-term birth (per 5 years) was weakly associated with degree of DNA methylation (multivariable β=−0.08, 95% CI=−0.15,−0.01; Table 3). After adjustment for levels of ERα expression, the beta coefficient for age at first birth remained similar but the result was no longer statistically significant (β=−0.07, 95% CI=−0.14, 0.003; other β estimates not shown). Other risk factors under study were not related to DNA methylation at ESR1 promoter C (Table 3).
Table 3.
Crude1 and multivariable-adjusted2 linear regression between known breast cancer risk factors and PMR DNA methylation values3 for ESR1 Promoter C, 200 breast cancer cases from the Polish Breast Cancer Study, 2000–2003
| Crude Model1 | Multivariable-adjusted Model2 | |||||
|---|---|---|---|---|---|---|
| Risk Factor | beta | (95% CI) | p-value | beta | (95% CI) | p-value |
| Number of full-term births | 0.03 | (−0.07, 0.13) | 0.51 | 0.09 | (−0.02, 0.20) | 0.12 |
| Age at first birth (per 5 year increase) | −0.06 | (−0.12, 0.01) | 0.14 | −0.08 | (−0.15, −0.01) | 0.030 |
| Age at menarche | −0.04 | (−0.11, 0.03) | 0.31 | −0.02 | (−0.10, 0.05) | 0.51 |
| Age at menopause (per 5 year increase) | 0.01 | (−0.02, 0.04) | 0.45 | 0.02 | (−0.13, 0.16) | 0.80 |
| Menopause | 0.16 | (−0.19, 0.50) | 0.38 | 0.52 | (−1.55, 2.59) | 0.62 |
| Current BMI among premenopausal, per 5 unit increase | −0.03 | (−0.29, 0.23) | 0.79 | 0.10 | (−0.18, 0.38) | 0.47 |
| Current BMI among postmenopausal, per 5 unit increase | −0.13 | (−0.27, 0.02) | 0.083 | −0.12 | (−0.27, 0.03) | 0.12 |
| Family history of cancer | 0.04 | (−0.36, 0.45) | 0.83 | 0.03 | (−0.41, 0.46) | 0.91 |
| History of benign breast disease | −0.06 | (−0.35, 0.22) | 0.67 | −0.12 | (−0.42, 0.17) | 0.41 |
Crude models were adjusted for age (5-year categories) and site (Warsaw, Lodz)
The multivariable-adjusted model included all the variables in the table as well as age, site, and education (less than high school graduate, high school graduate, and some college, professional training, or college graduate
MethyLight results measure the level of DNA methylation at specific loci in test samples compared to a completely methylated DNA reference, yielding percentage of fully methylated reference (PMR) for specific CpGs of target genes (32). PMR values were categorized as previous defined (32): no methylation (0 PMR); mild (>0–5 PMR); moderate (5–50 PMR), and heavy methylation (>50 PMR).
DISCUSSION
Our analyses, based on unselected breast cancers ascertained in a population-based study, demonstrate that DNA methylation at CpG islands in ESR1 (promoters A and B) and PGR (promoters A and B) is common in invasive breast cancer, but generally weak. DNA methylation at PGR promoters was most strongly related to decreased protein expression of ERα and PR. We also found that DNA methylation levels varied widely at ESR1 promoter C, which contains a CpG shore (27) and has not been well studied.
ERα transcription is controlled by seven promoters in ESR1 (35), of which two, promoters A and B contain CpG islands. In cell lines, hypermethylation of these promoters is associated with lack of ERα expression (9, 10, 12), whereas treatment with the demethylation agent, 5-aza-2’-deoxycytidine, results in re-expression of ERα (13). However, methylation patterns in cell lines and human breast tumors may differ (11).
Previous analyses that used methylation-specific restriction enzymes in combination with Southern blotting or PCR (MSP) have suggested that methylation of promoter A is more frequent in ERα-negative than ERα-positive tumors (7, 14); however, results have varied. Using MSP with 6 different primer sets, Lapidus and colleagues (18) detected DNA methylation in all 32 breast cancer tumors tested, irrespective of ER and PR status. However, a post hoc analysis based on subjective scoring of gels found “substantial methylation” in all 13 ERα-negative/PR-negative tumors, 8 of 11 (72.7%) ERα-positive and PR-negative tumors and 4 of 11 (36.4%) ERα-negative/ PR-negative tumors. Parrella and colleagues (19) were unable to confirm the aforementioned results using MSP and three of the same primer sets; they found DNA methylation at ESR1 in 13 of 27 (48.1%) ERα-positive, 4 of 5 (80.0%) ER weakly positive and 12 of 16 (75.0%) ERα-negative tumors. In an MSP analysis of frozen tumors, Li et al found DNA methylation at ESR1 in 49 of 54 (90.7%) ERα-negative tumors as compared to 108 of 134 (80.6%) ERα-positive tumors (p=0.04); relationships were similar for PR expression. However, DNA methylation at ESR1 was not significantly related to ERα protein levels, assessed biochemically. Finally, Hori et al (17), in an analysis of 124 breast tumors using competitive PCR, found that methylation at two ESR1 sites was unrelated to ER or PR status; however, methylation was associated with ERα-positive /PR-negative tumors.
Analyses using Southern blotting have also demonstrated that DNA methylation occurs more frequently among ERα-negative as compared to ERα-positive tumors, although the method is less sensitive and the results have been inconsistent (13, 15, 16). Yoshida et al (12) shows figures suggesting that DNA methylation was detectable in some ERα-positive tumors. Fabianowske (16) reported that 45 of 62 (72%) tumors with detectable DNA methylation were ERα-negative. Similarly, Iwase (15) detected DNA methylation in 24 of 27 (89%) ERα-negative cancers as compared to 17 of 29 (59%) ERα-positive tumors. Finally, Lapidus et al (13) found methylation in only 9 of 39 (23%) ERα-negative tumors and none of 53 ERα-positive tumors analyzed.
In summary, studies relating DNA methylation at ESR1 promoter A to ERα status have been inconsistent, possibly reflecting differences in patient or tumor characteristics or the assays used for assessing DNA methylation or ERα status. For example, studies based on frozen tissues are often skewed towards larger tumors. In addition, most methylation assays are non-quantitative. (36); although our data suggest that the range of methylation levels is narrow (30). Overall, our data like the literature overall, suggest that ESR1 promoter A is frequently (~85%), weakly methylated in breast cancer regardless of ER status (13, 15, 16, 18, 19, 37). These findings are consistent with the MethyLight study of Widschwendter et al that found methylation of ESR1 promoter A was (median PMR=0.8) and showed a marginally significant association with ER status in 148 breast tumors (p=0.03) (33).
PGR (chr.11q22–23) encodes two isoforms, PR-A and PR-B that are transcribed from two alternative promoters, A and B with different functions; in cell lines, PR-B is required for the proliferative effect of progesterone and estrogen, whereas inactivation of PR-A contributes to repression of PR-B-mediated transcription (38–40). In our study, PGR promoter A was methylated in 7.7% and PGR promoter B in 92.2% of breast cancers and DNA methylation at each promoter was significantly associated with reduced expression of total PR. Similarly, a study of 57 breast cancers using three methylation-specific enzymes with Southern blot analysis, found that DNA methylation at any of the sites was associated with PR-negative status (13). Another report found that DNA methylation of PGR promoter B was related to PR-negative status by immunohistochemistry (p=0.03) (20). However, unlike our analysis, a previous study using MethyLight, did not find that methylation of PGR promoter B was associated with PR status (p=0.18), although overall levels of methylation were similarly weak (median PMR=0.6) (33). The reasons for the inconsistency are unknown.
In vitro data suggest that hypermethylation at PGR promoter regions may be a marker of sustained suppression of ERα expression (41). In Leu et al. (41), repressed ERα expression in MCF-7 cells was associated with DNA methylation of PGR and reduced PR-A and PR-B transcripts. However, PGR hypermethylation occurred 36 hours after repression of ERα, suggesting that it was a late event that followed clonal expansion. Re-activation of PR expression required both re-expression of ERα and PGR demethylation. Our data support these observations. We found that methylation of the promoter regions of PR-A and PR-B was more common among tumors with low expression of ERα (17.6% vs. 1.7% and 97% vs. 89.1%, respectively). Similarly, Widschwendter and colleagues found that DNA methylation at PGR promoter B was the strongest predictor, among 35 markers, of ER status (p=0.0010) (33). Limited data suggest that ESR1 promoter B methylation is more common in ERα-negative compared to ERα-positive tumors (12, 15), which is weakly supported in our study.
In addition, to evaluating CpG islands in ESR1, we also evaluated methylation at a CpG shore in promoter C. Levels varied widely at this locus and were statistically significantly, associated with lower expression of ERα and PR. Confounding by age is an unlikely explanation for this result, given that methylation generally increases with age, and we observed a relationship with ERα-negative tumors, a disease more common among younger women. Few studies have examined the function of ERα promoter C (formerly referred to as promoter or the distal promoter) in controlling transcription. In small studies, up-regulation of transcription via promoter C was associated with increased levels of ERα protein in cell lines and human tumors (42) and methylation was related to down-regulation of transcription (12). Although one study has demonstrated that promoter C related transcripts are detectable in normal breast tissue (42), these data were not evaluated in relation to methylation status. Although the exact role of hypermethylation of CpG shores is not confirmed, they have recently been shown to be highly conserved across species and to play a role in transcription of alternative start sites (27). However, our results for this locus should be interpreted cautiously until additional data are available on the relationship between methylation status and protein expression in normal and diseased breast tissues.
Environmental factors are hypothesized to alter DNA methylation of specific genes (43–45), thus modifying breast cancer risk (44). This view is supported by the observation that as monozygotic twins age or spend more time apart, greater epigenetic differences emerge (46). We observed an association between older age at first birth and lower levels of hypermethylation of ESR1 promoter C, which persisted after controlling for ERα expression. This result is consistent with data showing that acute estrogen exposure in animal models (47) and in humans (48) triggers DNA methylation of hormone-responsive genes and studies suggesting that delayed childbearing is more strongly linked to ERα-positive than ERα-negative tumors. This study requires confirmation, but supports a possible role of environmental influences on epigenetic modifications (43).
In our study, hypermethylation of ESR1 and PGR were unrelated to tumor size and nodal involvement, consistent with previous findings (15, 19, 37). Although ERα and PR expression are positively related to each other, our methylation analysis did not shed conclusive light on these findings (49).
Strengths of our study include use of tumors from a population-based study, extraction of tumor-rich DNA, validation of our tissue sampling methods and demonstration of assay reproducibility. While we found consistent DNA methylation patterns within tumors, it is possible that random sampling error may explain some of our null results.
In conclusion, we found that methylation of ESR1 and PGR was common, generally weak and unlikely to account solely for the majority of ERα- and PR-negative breast tumors. We also found a preliminary suggestion that older age at first birth was more strongly associated with lower levels of hypermethylation of ESR1 promoter C than with ERα expression, suggesting that DNA hypermethylation may be used to define some of the etiological heterogeneity in breast cancer. However, to increase our knowledge of methylation in breast cancers, further studies in well-characterized, population-based cases are needed with consideration given to assaying subpopulations of cells within individual tumors.
Supplementary Material
Acknowledgments
The authors are grateful to Dr. Sujata Patil of Memorial Sloan-Kettering Cancer Center (New York, NY) for her statistical consultation. The authors would also like to thank Neonila Szeszenia-Dabrowska of the Nofer Institute of Occupational Medicine (Lodz, Poland) and Witold Zatonski of the M. Sklodowska-Curie Cancer Center and Institute of Oncology (Warsaw, Poland) for their contribution to the Polish Breast Cancer Study. Anita Soni (Westat, Rockville, MD, USA) and Pei Chao (IMS, Silver Spring, MD, USA) have been invaluable to the management of the study. This work would not be possible without the dedicated efforts of the physicians, nurses, interviewers and study participants. This research was supported by funds from the intramural program of the National Cancer Institute, National Institutes of Health.
List of Abbreviations
- AQUA
automated quantitative analysis
- BMI
body mass index
- ER
estrogen receptor
- PBCS
Polish Breast Cancer Study
- PMR
percent
- PR
progesterone receptor
- TMA
tissue microarray
REFERENCES
- 1.Potter JD, Cerhan JR, Sellers TA, et al. Progesterone and estrogen receptors and mammary neoplasia in the Iowa Women's Health Study: how many kinds of breast cancer are there? Cancer Epidemiol Biomarkers Prev. 1995;4:319–326. [PubMed] [Google Scholar]
- 2.Tarone RE, Chu KC. The greater impact of menopause on ER− than ER+ breast cancer incidence: a possible explanation (United States) Cancer Causes Control. 2002;13:7–14. doi: 10.1023/a:1013960609008. [DOI] [PubMed] [Google Scholar]
- 3.Anderson WF, Chatterjee N, Ershler WB, Brawley OW. Estrogen receptor breast cancer phenotypes in the Surveillance, Epidemiology, and End Results database. Breast Cancer Res Treat. 2002;76:27–36. doi: 10.1023/a:1020299707510. [DOI] [PubMed] [Google Scholar]
- 4.Murphy N, Millar E, Lee CS. Gene expression profiling in breast cancer: towards individualising patient management. Pathology. 2005;37:271–277. doi: 10.1080/00313020500169586. [DOI] [PubMed] [Google Scholar]
- 5.Althuis MD, Fergenbaum JH, Garcia-Closas M, Brinton LA, Madigan MP, Sherman ME. Etiology of hormone receptor-defined breast cancer: a systematic review of the literature. Cancer Epidemiol Biomarkers Prev. 2004;13:1558–1568. [PubMed] [Google Scholar]
- 6.Schairer C, Mink PJ, Carroll L, Devesa SS. Probabilities of death from breast cancer and other causes among female breast cancer patients. J Natl Cancer Inst. 2004;96:1311–1321. doi: 10.1093/jnci/djh253. [DOI] [PubMed] [Google Scholar]
- 7.Giacinti L, Claudio PP, Lopez M, Giordano A. Epigenetic information and estrogen receptor alpha expression in breast cancer. Oncologist. 2006;11:1–8. doi: 10.1634/theoncologist.11-1-1. [DOI] [PubMed] [Google Scholar]
- 8.Laird PW. Cancer epigenetics. Hum Mol Genet. 2005;14(Spec No 1):R65–R76. doi: 10.1093/hmg/ddi113. [DOI] [PubMed] [Google Scholar]
- 9.Ferguson AT, Lapidus RG, Baylin SB, Davidson NE. Demethylation of the estrogen receptor gene in estrogen receptor-negative breast cancer cells can reactivate estrogen receptor gene expression. Cancer Res. 1995;55:2279–2283. [PubMed] [Google Scholar]
- 10.Ottaviano YL, Issa JP, Parl FF, Smith HS, Baylin SB, Davidson NE. Methylation of the estrogen receptor gene CpG island marks loss of estrogen receptor expression in human breast cancer cells. Cancer Res. 1994;54:2552–2555. [PubMed] [Google Scholar]
- 11.Ushijima T. Detection and interpretation of altered methylation patterns in cancer cells. Nat Rev Cancer. 2005;5:223–231. doi: 10.1038/nrc1571. [DOI] [PubMed] [Google Scholar]
- 12.Yoshida T, Eguchi H, Nakachi K, et al. Distinct mechanisms of loss of estrogen receptor alpha gene expression in human breast cancer: methylation of the gene and alteration of transacting factors. Carcinogenesis. 2000;21:2193–2201. doi: 10.1093/carcin/21.12.2193. [DOI] [PubMed] [Google Scholar]
- 13.Lapidus RG, Ferguson AT, Ottaviano YL, et al. Methylation of estrogen and progesterone receptor gene 5' CpG islands correlates with lack of estrogen and progesterone receptor gene expression in breast tumors. Clin Cancer Res. 1996;2:805–810. [PubMed] [Google Scholar]
- 14.Yan L, Yang X, Davidson NE. Role of DNA methylation and histone acetylation in steroid receptor expression in breast cancer. J Mammary Gland Biol Neoplasia. 2001;6:183–192. doi: 10.1023/a:1011308707512. [DOI] [PubMed] [Google Scholar]
- 15.Iwase H, Omoto Y, Iwata H, et al. DNA methylation analysis at distal and proximal promoter regions of the oestrogen receptor gene in breast cancers. Br J Cancer. 1999;80:1982–1986. doi: 10.1038/sj.bjc.6690631. [DOI] [PMC free article] [PubMed] [Google Scholar]
- 16.Fabianowska-Majewska K, Kordek R, Krawczyk B. Studies on the methylation status of CpG sequences located in promoters of selected tumour suppressor genes in breast cancer cells. Nucleosides Nucleotides Nucleic Acids. 2006;25:1025–1028. doi: 10.1080/15257770600890640. [DOI] [PubMed] [Google Scholar]
- 17.Hori M, Iwasaki M, Yoshimi F, Asato Y, Itabashi M. Hypermethylation of the Estrogen Receptor Alpha Gene Is Not Related to Lack of Receptor Protein in Human Breast Cancer. Breast Cancer. 1999;6:79–86. doi: 10.1007/BF02966912. [DOI] [PubMed] [Google Scholar]
- 18.Lapidus RG, Nass SJ, Butash KA, et al. Mapping of ER gene CpG island methylation-specific polymerase chain reaction. Cancer Res. 1998;58:2515–2519. [PubMed] [Google Scholar]
- 19.Parrella P, Poeta ML, Gallo AP, et al. Nonrandom distribution of aberrant promoter methylation of cancer-related genes in sporadic breast tumors. Clin Cancer Res. 2004;10:5349–5354. doi: 10.1158/1078-0432.CCR-04-0555. [DOI] [PubMed] [Google Scholar]
- 20.Mc Cormack O, Chung WY, Fitzpatrick P, et al. Progesterone receptor B (PRB) promoter hypermethylation in sporadic breast cancer: progesterone receptor B hypermethylation in breast cancer. Breast Cancer Res Treat. 2008;111:45–53. doi: 10.1007/s10549-007-9757-7. [DOI] [PubMed] [Google Scholar]
- 21.Garcia-Closas M, Brinton LA, Lissowska J, et al. Established breast cancer risk factors by clinically important tumour characteristics. Br J Cancer. 2006;95:123–129. doi: 10.1038/sj.bjc.6603207. [DOI] [PMC free article] [PubMed] [Google Scholar]
- 22.McCabe A, Dolled-Filhart M, Camp RL, Rimm DL. Automated quantitative analysis (AQUA) of in situ protein expression, antibody concentration, and prognosis. J Natl Cancer Inst. 2005;97:1808–1815. doi: 10.1093/jnci/dji427. [DOI] [PubMed] [Google Scholar]
- 23.Camp RL, Chung GG, Rimm DL. Automated subcellular localization and quantification of protein expression in tissue microarrays. Nat Med. 2002;8:1323–1327. doi: 10.1038/nm791. [DOI] [PubMed] [Google Scholar]
- 24.Sherman ME, Rimm DL, Yang XR, et al. Variation in breast cancer hormone receptor and HER2 levels by etiologic factors: a population-based analysis. Int J Cancer. 2007;121:1079–1085. doi: 10.1002/ijc.22812. [DOI] [PubMed] [Google Scholar]
- 25.Flouriot G, Griffin C, Kenealy M, Sonntag-Buck V, Gannon F. Differentially expressed messenger RNA isoforms of the human estrogen receptor-alpha gene are generated by alternative splicing and promoter usage. Mol Endocrinol. 1998;12:1939–1954. doi: 10.1210/mend.12.12.0209. [DOI] [PubMed] [Google Scholar]
- 26.Kastner P, Krust A, Turcotte B, et al. Two distinct estrogen-regulated promoters generate transcripts encoding the two functionally different human progesterone receptor forms A and B. EMBO J. 1990;9:1603–1614. doi: 10.1002/j.1460-2075.1990.tb08280.x. [DOI] [PMC free article] [PubMed] [Google Scholar]
- 27.Irizarry RA, Ladd-Acosta C, Wen B, et al. The human colon cancer methylome shows similar hypo- and hypermethylation at conserved tissue-specific CpG island shores. Nat Genet. 2009;41:178–186. doi: 10.1038/ng.298. [DOI] [PMC free article] [PubMed] [Google Scholar]
- 28.Feinberg AP, Tycko B. The history of cancer epigenetics. Nat Rev Cancer. 2004;4:143–153. doi: 10.1038/nrc1279. [DOI] [PubMed] [Google Scholar]
- 29.Gardiner-Garden M, Frommer M. CpG islands in vertebrate genomes. J Mol Biol. 1987;196:261–282. doi: 10.1016/0022-2836(87)90689-9. [DOI] [PubMed] [Google Scholar]
- 30.Eads CA, Danenberg KD, Kawakami K, et al. MethyLight: a high-throughput assay to measure DNA methylation. Nucleic Acids Res. 2000;28:E32. doi: 10.1093/nar/28.8.e32. [DOI] [PMC free article] [PubMed] [Google Scholar]
- 31.Weisenberger DJ, Siegmund KD, Campan M, et al. CpG island methylator phenotype underlies sporadic microsatellite instability and is tightly associated with BRAF mutation in colorectal cancer. Nat Genet. 2006;38:787–793. doi: 10.1038/ng1834. [DOI] [PubMed] [Google Scholar]
- 32.Eads CA, Lord RV, Wickramasinghe K, et al. Epigenetic patterns in the progression of esophageal adenocarcinoma. Cancer Res. 2001;61:3410–3418. [PubMed] [Google Scholar]
- 33.Widschwendter M, Siegmund KD, Muller HM, et al. Association of breast cancer DNA methylation profiles with hormone receptor status and response to tamoxifen. Cancer Res. 2004;64:3807–3813. doi: 10.1158/0008-5472.CAN-03-3852. [DOI] [PubMed] [Google Scholar]
- 34.Yang XR, Pfeiffer RM, Garcia-Closas M, et al. Hormonal markers in breast cancer: coexpression, relationship with pathologic characteristics, and risk factor associations in a population-based study. Cancer Res. 2007;67:10608–10617. doi: 10.1158/0008-5472.CAN-07-2142. [DOI] [PubMed] [Google Scholar]
- 35.Reid G, Denger S, Kos M, Gannon F. Human estrogen receptor-alpha: regulation by synthesis, modification and degradation. Cell Mol Life Sci. 2002;59:821–831. doi: 10.1007/s00018-002-8470-2. [DOI] [PMC free article] [PubMed] [Google Scholar]
- 36.Ogino S, Kawasaki T, Brahmandam M, et al. Precision and performance characteristics of bisulfite conversion and real-time PCR (MethyLight) for quantitative DNA methylation analysis. J Mol Diagn. 2006;8:209–217. doi: 10.2353/jmoldx.2006.050135. [DOI] [PMC free article] [PubMed] [Google Scholar]
- 37.Li S, Rong M, Iacopetta B. DNA hypermethylation in breast cancer and its association with clinicopathological features. Cancer Lett. 2006;237:272–280. doi: 10.1016/j.canlet.2005.06.011. [DOI] [PubMed] [Google Scholar]
- 38.Vegeto E, Shahbaz MM, Wen DX, Goldman ME, O'Malley BW, McDonnell DP. Human progesterone receptor A form is a cell- and promoter-specific repressor of human progesterone receptor B function. Mol Endocrinol. 1993;7:1244–1255. doi: 10.1210/mend.7.10.8264658. [DOI] [PubMed] [Google Scholar]
- 39.Conneely OM, Jericevic BM, Lydon JP. Progesterone receptors in mammary gland development and tumorigenesis. J Mammary Gland Biol Neoplasia. 2003;8:205–214. doi: 10.1023/a:1025952924864. [DOI] [PubMed] [Google Scholar]
- 40.Mulac-Jericevic B, Lydon JP, DeMayo FJ, Conneely OM. Defective mammary gland morphogenesis in mice lacking the progesterone receptor B isoform. Proc Natl Acad Sci U S A. 2003;100:9744–9749. doi: 10.1073/pnas.1732707100. [DOI] [PMC free article] [PubMed] [Google Scholar]
- 41.Leu YW, Yan PS, Fan M, et al. Loss of estrogen receptor signaling triggers epigenetic silencing of downstream targets in breast cancer. Cancer Res. 2004;64:8184–8192. doi: 10.1158/0008-5472.CAN-04-2045. [DOI] [PubMed] [Google Scholar]
- 42.Hayashi S, Imai K, Suga K, Kurihara T, Higashi Y, Nakachi K. Two promoters in expression of estrogen receptor messenger RNA in human breast cancer. Carcinogenesis. 1997;18:459–464. doi: 10.1093/carcin/18.3.459. [DOI] [PubMed] [Google Scholar]
- 43.Jaenisch R, Bird A. Epigenetic regulation of gene expression: how the genome integrates intrinsic and environmental signals. Nat Genet. 2003;33 Suppl:245–254. doi: 10.1038/ng1089. [DOI] [PubMed] [Google Scholar]
- 44.Bjornsson HT, Fallin MD, Feinberg AP. An integrated epigenetic and genetic approach to common human disease. Trends Genet. 2004;20:350–358. doi: 10.1016/j.tig.2004.06.009. [DOI] [PubMed] [Google Scholar]
- 45.Jirtle RL, Skinner MK. Environmental epigenomics and disease susceptibility. Nat Rev Genet. 2007;8:253–262. doi: 10.1038/nrg2045. [DOI] [PMC free article] [PubMed] [Google Scholar]
- 46.Fraga MF, Ballestar E, Paz MF, et al. Epigenetic differences arise during the lifetime of monozygotic twins. Proc Natl Acad Sci U S A. 2005;102:10604–10609. doi: 10.1073/pnas.0500398102. [DOI] [PMC free article] [PubMed] [Google Scholar]
- 47.Jost JP, Saluz HP. Steroid hormone dependent changes in DNA methylation and its significance for the activation or silencing of specific genes. EXS. 1993;64:425–451. doi: 10.1007/978-3-0348-9118-9_19. [DOI] [PubMed] [Google Scholar]
- 48.Ho SM, Tang WY, Belmonte de Frausto J, Prins GS. Developmental exposure to estradiol and bisphenol A increases susceptibility to prostate carcinogenesis and epigenetically regulates phosphodiesterase type 4 variant 4. Cancer Res. 2006;66:5624–5632. doi: 10.1158/0008-5472.CAN-06-0516. [DOI] [PMC free article] [PubMed] [Google Scholar]
- 49.Konecny G, Pauletti G, Pegram M, et al. Quantitative association between HER-2/neu and steroid hormone receptors in hormone receptor-positive primary breast cancer. J Natl Cancer Inst. 2003;95:142–153. doi: 10.1093/jnci/95.2.142. [DOI] [PubMed] [Google Scholar]
Associated Data
This section collects any data citations, data availability statements, or supplementary materials included in this article.