Abstract
A procedure has been developed for directly depositing membrane fragments derived from bacterial (chromatophores from Rhodopseudomonas sphaeroides) and mammalian cells (μ-opioid receptor- and MC4 receptor-transfected HEK cells, and rat trigeminal ganglion cells) onto the silica surface of a plasmon-waveguide resonance (PWR) spectrometer. Binding of ligands (cytochrome c2 for the chromatophores, the peptide agonists DAMGO and Melanotan-II that are specific for the μ-opioid and MC4 receptors, and two non-peptide agonists that are specific for the CB1 receptor) to these membrane fragments has been observed and characterized with high sensitivity using PWR spectral shifts. The KD values obtained are in excellent agreement with conventional pharmacological assays and with prior PWR studies using purified receptors inserted into deposited lipid bilayer membranes. These studies provide a new tool for obtaining useful biological information about receptor-mediated processes in real biological membranes.
Keywords: G-protein coupled receptors, bacterial chromatophores, transfected HEK cells, rat trigeminal ganglion, μ-opioid receptor, cannabinoid CB1 receptor, melanocortin-4 receptor
Introduction
The vast majority of assays currently used in both pharmaceutical screening and biophysical studies involve some type of labeling (e.g. radioactive or fluorescent) of the target molecule or of a secondary reporter, to enable quantification of protein, DNA, small molecules, or cells. There are relatively few methods that allow detection of molecular and cellular interactions without using labels. Although labeling approaches can provide functional and kinetic information on the cellular consequences of target-compound interactions, including drug mechanism, efficacy, selectivity, and cytotoxicity, these methods tend to fail to generate information relating to the overall cellular responses. This is because of the complexity of cell function as well as the dependence of specific cell responses on the integration of a multitude of signaling pathways. In addition, because of possible structural or functional perturbations, the use of either labels or artificial manipulations could contribute in an adverse way to elucidating the cellular physiology of the targets studied.
One such label-free method is plasmon-waveguide resonance (PWR) spectroscopy (1), which has been developed and utilized in this laboratory as a tool for elucidating structure-function relationships involving integral membrane proteins incorporated into a solid-supported lipid bilayer membrane (2–4). As an extension of surface plasmon resonance (SPR), PWR provides a procedure for obtaining ligand binding affinities, and extends SPR by having higher sensitivity (20–50 fold) and by allowing conformational and mass density changes to be distinguished and characterized (1, 5, 6). Heretofore, major limitations of these studies have been the use of “artificial” lipid bilayer membranes comprised of one or more purified lipid components, rather than a “real” biomembrane, and the requirement for at least partial purification of the membrane protein to be studied and storage in a detergent-containing buffer until bilayer insertion via detergent dilution. In this communication, we describe a protocol for directly depositing membrane fragments onto the silica surface of a PWR resonator, either isolated from biological materials in which they normally reside or from cells into which the desired receptors have been cloned and overexpressed. As a proof-of-concept, we have used chromatophore membranes obtained from a photosynthetic bacterium (Rhodopseudomonas spheroides), in an extension of PWR experiments we have previously reported (7) on cytochrome c2 binding to purified reaction centers from this organism. In addition, we have used membranes obtained from HEK cells into which the human μ-opioid (hMOR) and melanocortin-4 (hMC4) receptors have been stably transfected, as well as native membrane fragments derived from trigeminal ganglia of a single rat. We present here measurements of the spectral changes that result from membrane deposition and ligand binding, including evaluation of binding constants. Our description of other results, especially those involving analysis of mass density and structural changes based on spectra obtained with two different excitation light polarizations, will be primarily qualitative; a more quantitative presentation will require further studies, which are presently underway (see below for further discussion).
The use of membrane fragments (or even whole cells) deposited directly on the outer surface of the PWR sensor is based on many previous observations showing that both lipid vesicles and whole cells adhere well and spread easily at silica surfaces. Investigation of the interaction of solid (usually hydrophilic) surfaces with vesicles was pioneered by McConnell’s group (8, 9), and both experimental (10–19) and theoretical (20–23) efforts have been devoted to understanding the driving forces involved in adsorption, using optical imaging techniques (24–26) as well as optical biosensors (27–30). The current picture emerging from these studies can be summarized as follows. Cells initially interact with a solid surface by adsorption, followed subsequently by morphological changes known as spreading – a process during which the cells increase their area in contact with the surface. Similar processes occur with vesicles leading to their rupturing and the formation of solid-supported lipid bilayers. Calcium ions have been shown to strongly enhance these processes (19).
As will be shown below, membrane immobilization on the silica surface of a PWR sensor, and spectral observation of subsequent ligand binding, has been quite successful and opens a wide range of possible future studies on other membrane systems under a variety of conditions.
Experimental
PWR spectroscopy
The details of both the principles and procedures for PWR measurement and data analysis have been described elsewhere (2–4). Briefly, polarized light (λ = 632.8 nm) from a CW laser incident upon the back surface of a thin silver film (~50 nm) overcoated with a layer of silica (~500 nm) and deposited on the surface of a right angle prism excites plasmon and waveguide modes. This generates an evanescent electromagnetic field on the silica surface. Molecules immobilized on this surface interact with this field and influence the resonance excitation process, thereby generating changes in a plot of the reflected light intensity as a function of incident angle, which constitutes a PWR spectrum. The resonator surface is in contact with an aqueous buffer into which molecules that interact with the immobilized material can be introduced, causing further changes in the PWR spectrum. The resonance shifts are proportional to mass density, and thus by plotting spectral shifts as a function of added material, a binding constant can be determined. It should be noted that the amount of ligand bound is small compared to the concentration of added ligand due to the approximately 1000-fold difference in the sample cell volume (~0.5 mL) and the volume of the deposited membrane fragments.
Preparation and deposition of membrane fragments
The membrane fragments used in these studies correspond to chromatophores isolated from the photosynthetic bacterium Rhodopseudomonas spheroides, and to fragments prepared from transfected HEK cells and from trigeminal ganglia obtained from a single rat. These were obtained and characterized by standard procedures as follows.
Chromatophores
R. sphaeroides 2.4.1 cells were grown aerobically using Sistrom’s medium, and harvested by centrifugation, the pellet then being washed once with 50 mM MOPS pH 7.0, 100 mM KCl, resuspending each time in a volume ~ 4 times the cell pellet weight. Cells were disrupted by French press (~20,000 psi), then centrifuged at 30,000g for 30 minutes. The supernatant was then centrifuged at 200,000g for 90 minutes. The resulting pellet was resuspended in the above buffer, plus 25 % (v/v) glycerol, to a concentration of 25 mg/mL total protein (as measured by BCA assay, Pierce), and stored at −80°C until needed.
Reduced Rhodobacter capsulatus cytochrome (cyt) c2 was isolated and purified according to Caffrey et al. (31).
HEK cells expressing hMOR
The cDNA encoding the hMOR (GENBANK accession no.: L25119, generous gift from Dr. J.B. Wang) was inserted into a pHβApr-1-neo mammalian expression vector, and stably transfected into human embryonic kidney (HEK) cells using the Superfect transfection reagent (Qiagen, CA). Recombinant HEK cells expressing the hMOR were grown and maintained in MEM medium (Invitrogen, Carlsbad, CA) containing 10% fetal calf serum, 100 U/mL penicillin, 100 μg/mL streptomycin and 700 μg/mL of the antibiotic G418 (Invitrogen, Carlsbad, CA), at 37°C in a 5% CO2 humidified atmosphere. Untransfected HEK cells (control) were grown in the same medium as above in the absence of G418.
Expression of the receptor was monitored by radioligand saturation analysis using [3H] diprenorphine, and indicated high affinity (KD = 0.9 ± 0.6 nM) binding to transfected HEK cell membrane preparations with a Bmax of 1.9 pmol/mg protein. The assay procedure used was as follows. The fresh crude membrane pellet as prepared above was resuspended in assay buffer (50 mM Tris, pH 7.4, containing 50 μg/mL bacitracin, 30 μM bestatin, 10 μM captopril, 100 μM phenylmethylsulfonyl fluoride (PMSF), 1 mg/mL BSA, pH 7.4). In a saturation binding experiment, approximately 50 μg of membrane preparation was incubated with [3H] diprenorphine (0.1–10 nM) (PerkinElmer Life and Analytical Sciences, Boston, MA) for 90 min at 30 °C in assay buffer. The reaction was terminated by rapid filtration through Whatman GF/B glass fiber filters using a Brandel Cell Harvester (Brandel Inc., Gaithersburg, MD). The filters were rinsed five times with 4 ml of ice-cold saline containing 0.01% BSA. Filter-bound radioactivity was measured in EcoLite scintillation cocktail (MP Biomedicals, Irvine, CA) using a Beckman LS 6000SC liquid scintillation counter (Beckman Coulter, Fullerton, CA). Nonspecific binding was determined in the presence of 10 μM naltrexone (Tocris, Ellisville, MO). The reaction was filtered using a Brandel Cell Harvester through Whatman GF/B glass fiber filters (Brandel Inc., Gaithersburg, MD).
Membrane fragment preparation for PWR
Both untransfected and recombinant HEK cells expressing hMOR were grown to confluency. The confluent cell monolayers were then washed with Ca2+, Mg2+-deficient phosphate-buffered saline and harvested in the same buffer containing 0.02% EDTA. After centrifugation at 1500g for 10 min, the cells were homogenized in ice-cold 10 mM Tris-HCl and 1 mM EDTA, pH 7.4 buffer. A crude membrane fraction was collected by centrifugation at 40,000g for 20 min at 4°C, and stored at −80°C until use. Prior to the PWR experiment, the membrane fraction was resuspended in 20 mM Tris-HCl, pH 7.4 buffer by mild homogenization. Protein concentration was determined by using a Bradford assay. The μ-selective opioid receptor agonist, ([D-Ala2, NMe-Phe4, Gly-ol5]-enkephalin) DAMGO, used in the PWR experiments was purchased from Tocris, Ellisville, MO.
HEK cells expressing hMC4R
The cDNA sequence encoding hMC4R was obtained from the University of Missouri, Rolla cDNA resource center. The cDNA was subcloned into pcDNA3.1 His/myc A. All plasmids were verified by DNA sequencing by the Biotechnology Computing Facility at the University of Arizona.
For stable transfection, HEK293 cells were grown on a 3 cm plate in MEM (Invitrogen, CA) with Earle’s Salts, supplemented with 10% (vol/vol) heat-inactivated fetal bovine serum, penicillin G (100U/mL) and streptomycin (100 μg/mL), at 37°C, in a humidified atmosphere containing 95% air 5% CO2 to 80–90% confluence. The cells were transfected with 0.2 μg cDNA using the Lipofectamine or FuGene 6, from Roche Diagnostics (Indianapolis, IN) in Opti-MEM medium (Invitrogen, CA), according to the manufacturer’s instructions. Stably transfected cells were selected by the addition of antibiotic (G418) 24 hr after the transfection, and stabilized for two months. Whole cell binding and functional assays were performed to screen the highest expression monoclone, following a previously described method (32, 33). Cells were seeded on 96 well plates (50,000 cells/well), 48 hours before the assay. For the assay, the medium was removed and cells were washed twice with freshly prepared MEM containing 25 mM HEPES (pH 7.4), 0.2% bovine serum albumin, 1 mM 1,10-phenanthroline, 0.5 mg/L leupeptin, 200 mg/L bacitracin. The cells were then incubated with 0.14 nM [125I]-[Nle4, D-Phe7]-α-MSH (PerkinElmer Life Science, 50,000 cpm/well) in the presence of increasing concentrations of the unlabeled peptides for 40 min at 37°C. The medium was subsequently removed and the cells were washed twice with the assay buffer and lysed using 100 μL 0.1 NaOH and 100 μL 1% Triton X-100. The radioactivity was measured using a Microbeta (PerkinElmer Life Science, Boston, MA). The data were analyzed using Graphpad Prism 4.0 software (San Diego, CA).
The agonist mediated cellular response was measured via cAMP assay. Stably transfected HEK 293 cells were seeded onto 96 well plates 48 hours before assay (50,000 cells/well). For the assay, the medium was removed and the cells were rinsed with 1 mL of MEM buffer. An aliquot (0.1 mL) of Earle’s balanced salt solution was placed in each well along with isobutylmethylxanthine (IBMX; 5 μL; 0.5 mM) for 1 min at 37°C. Varying concentrations of the MC4 agonist Melanotan-II (MTII; Ac-Nle-c[Asp-His-DPhe-Arg-Trp-Lys]-NH2) (34) were added and the cells incubated for 3 min at 37°C, and then treated with trypsin for 30 sec. The reaction was stopped by aspirating the buffer and adding ice cold Tris/EDTA buffer to each well (0.06 mL) and then placing the plates in a boiling water bath for 15 min. The cell lysates were centrifuged for 5 min (2,300g), the supernatant (0.05 mL) was transferred to another 96 well plate and placed with 0.05 mL [3H] cAMP and 0.1 mL of protein kinase A in the ice bath for 2–3 hours. The incubation buffer was transferred to the MultiScreen 96-filtered plate (Millipore) and the cAMP content was measured in the Microbeta (PerkinElmer Life Science, Boston, MA). The expression level of hMC4R was determined by radio-ligand saturation analysis using [125I]-[Nle4, D-Phe7]-α-MSH and indicated high affinity (KD = 1 ± 0.1 nM) for MTII binding hMC4R; the cAMP level stimulated by MTII at hMC4R showed EC50 = 2.2 ± 0.1 nM. Values represent the mean of duplicate experiments performed in triplicate, and were determined by fitting the data using a nonlinear least squares analysis, with the help of Graphpad Prism 4.0 (Graphpad Software, San Diego, CA). Data are expressed as mean±SEM.
Membrane fragment preparation for PWR
Stably transfected cells were grown to 95% confluency in five 150 mm diameter plates and harvested in 50 mM Tris/HCl with 200mM KCl buffer, pH 7.5 containing protease inhibitor (Sigma). The cell suspension was homogenized with a Teflon homogenizer and centrifuged at 31,200g for 20 min. The membrane pellet was washed in 50 mM Tris-Cl buffer, and then resuspended in cold 50mM Tris-Cl, 200mM KCl, buffer with protease inhibitor.
Rat trigeminal ganglion membrane fragments
Trigeminal ganglia from one male Sprague-Dawley rat (200–250 g) were dissected and placed in ice-cold PWR buffer (10 mM Tris-HCl, 1 mM EDTA, pH 7.4). The sheath and blood vessels were removed from the ganglia under a dissection microscope. The ganglia were homogenized in 5 ml buffer using a Teflon pestle and centrifuged at 30,000g for 15 min at 4°C. The membrane pellet was re-suspended in 2 ml of buffer, homogenized and divided into 500 μl aliquots. The ligands used with the rat brain fragments were DAMGO and two small non-peptide agonists known to be specific for the cannabinoid CB1 receptor, CP 55,940 and WIN 55,212-2 (35).
Deposition of membrane fragments onto PWR resonator
Approximately 25 μL of a stock solution of membrane fragments suspended in 100 mM phosphate buffer (containing 100 mM KCl and 5 mM CaCl2), were placed on the silica surface of the PWR sensor and allowed to settle for 30 min at room temperature. Subsequent to this the sensor was mounted into the sample compartment of the spectrometer (Proterion Corp.), and was washed with a buffer solution to remove excess membranes and calcium ions. PWR spectra were measured before and after such deposition. Microliter aliquots of a stock solution of ligand were then added to the sample cell and PWR spectra were recorded.
Results and discussion
PWR spectral characteristics of the deposited membranes
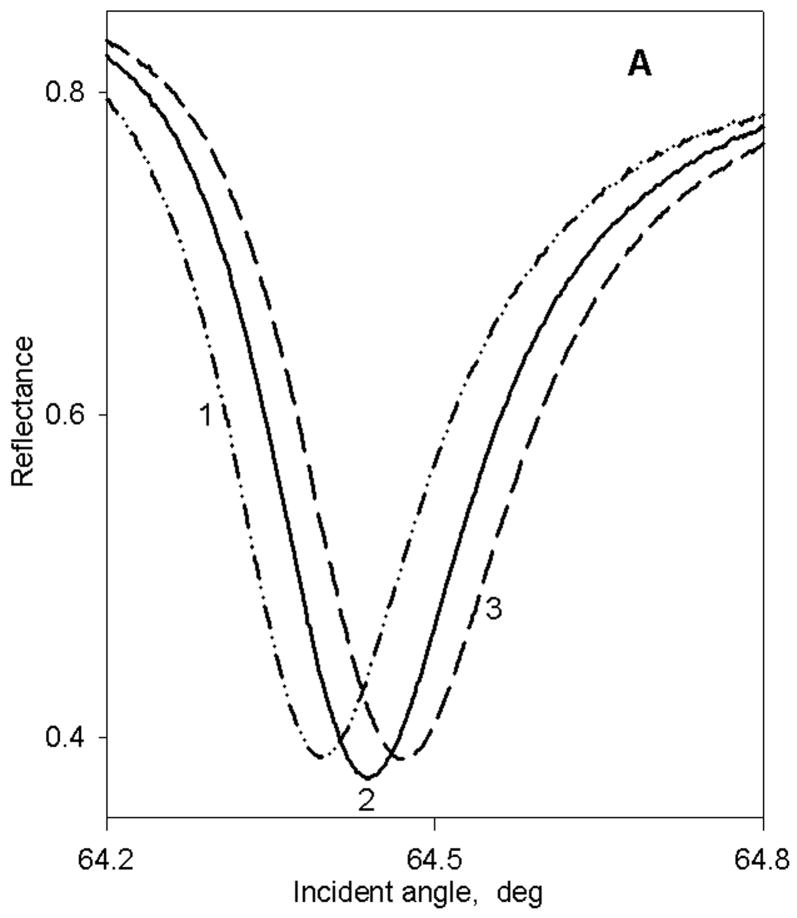
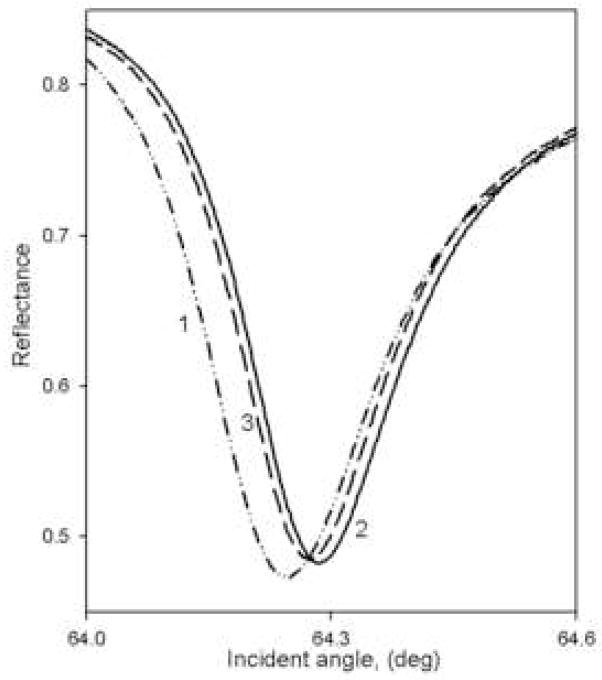
Figure 1A,B shows a series of PWR spectra obtained with p-polarized excitation using two of the four membrane systems described above (similar results were obtained with s-polarization; not shown). As illustrated by these results, in all cases a large positive shift (curve 2 vs. curve 1) in the PWR spectrum, as well as a change in the spectral width, was obtained upon membrane deposition, indicating the immobilization of a significant amount of mass on the sensor surface. Furthermore, in all cases, the spectral shifts for p-polarization were appreciably larger than those for s- polarization, resulting in an s:p ratio of 0.6 to 0.8 depending on sample type. This result indicates a strong anisotropy in the deposited mass within the two dimensional thin layer of membrane fragments on the sensor surface, with a larger mass density along the perpendicular to the surface than parallel to the sensor surface. This demonstrates that the membrane fragments were at least partially oriented on the surface, rather than randomly distributed. These anisotropy results are quite similar to our previous data obtained with single lipid bilayer membranes, which are known to be uniaxially deposited on the resonator surface (36). Further studies are presently underway to quantify the total mass deposited and the mass distribution.
Figure 1.
Typical p-polarized PWR spectra obtained with either a bare sensor in contact with an aqueous buffer (dashed-dotted line; curve 1), after membrane fragment deposition and washing (solid line; curve 2), and after addition of ligand to the sample compartment at a saturating ligand concentration (dashed line; curve 3; see Figs. 2–5). Panel A: chromatophore membrane fragments with and without added cyt c2; binding curves shown in Figure 2A. Panel B: rat trigeminal ganglion membrane fragments with and without added CP; binding curves shown in Figure 4A.
In order to determine the strength of the interaction between the resonator surface and the membrane fragments, the changes in resonance position shift after washing the sample compartment cell with fresh buffer were monitored. The results demonstrated that after 4 washings approximately 65% of the membrane fragments adhered to the silica surface strongly enough to remain immobilized, and that an equilibrium value of 55% was reached after 10–12 washes. All of the spectra shown in Figure 1 and the results discussed below have been obtained after such washing processes.
Receptor-ligand interactions
Subsequent addition of aliquots of a ligand solution after membrane deposition caused further changes in the resonance angle and the spectral shape (illustrated in Figure 1A,B; curves 3), demonstrating binding of the ligand to the membrane fragments. The changes in resonance position with ligand concentration allow us to obtain hyperbolic ligand binding curves yielding apparent binding constants (KD). It is important to point out that the magnitude of the ligand-induced PWR spectral shifts, in these and in the experiments reported below, are approximately proportional to the mass density of membrane fragments deposited on the resonator surface, the latter estimated from the magnitude of spectral shifts obtained (data not shown).
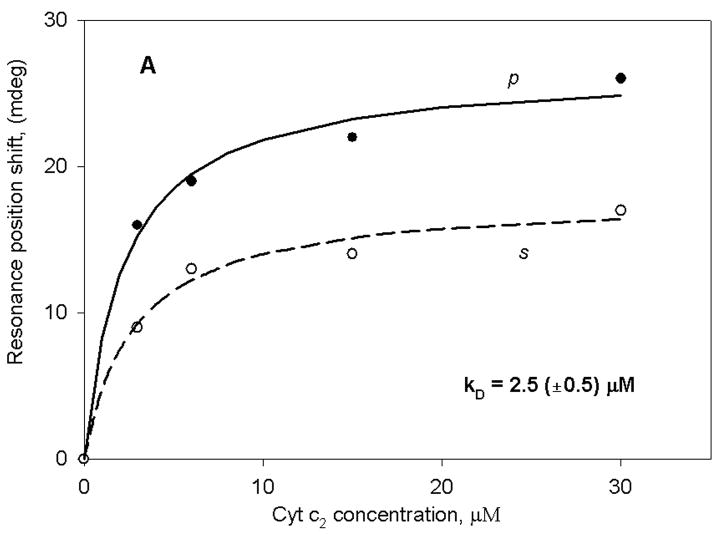
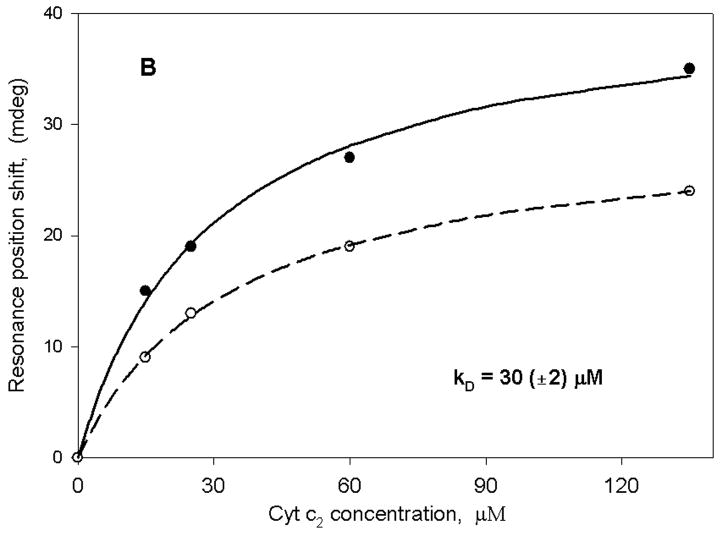
Figure 2 shows the binding curve of reduced cyt c2 to either membrane fragments obtained from R. sphaeroides chromatophores (panel A) or to a bare sensor surface (panel B). In both cases, as expected for the chromatophores and for a highly positively charged protein on a silica surface, immobilization of cyt c2 occurred. However, the binding was approximately 10-fold weaker in the case of the bare sensor. As is evident, a single hyperbolic curve adequately fits the data in both cases. Furthermore, the s:p ratio obtained with the bare sensor and the chromatophore fragments is approximately the same as observed in membrane deposition (~0.65). We have also performed a control experiment in which cyt c2 was replaced by bovine serum albumin with the chromatophore fragments. In this case, we did not observe any measurable changes in the spectral position up to 100 μM protein. These experiments clearly demonstrate the fact that molecules of cyt c2 interact specifically with the chromatophore membranes with an apparent binding constant of 2.5 μM, and non-specifically with the silica surface of the PWR resonator with an apparent binding constant of 30 μM. The KD value obtained with the chromatophores is approximately the same as that obtained in PWR studies with a purified cytochrome bc1 complex from a photosynthetic bacterium inserted into an egg phosphatidylcholine bilayer deposited onto the PWR resonator surface (37). Thus, despite the additional complexity of intact chromatophores (i.e. they contain reaction centers and cytochrome oxidase, in addition to bc1) the results indicate that in both cases we are observing a similar interaction. It should be noted that the KD values in Figure 2, as well as those presented below, were obtained from a minimum of three separate experiments. In all cases, the error values given correspond to those resulting from the hyperbolic fits; these were generally equal to or larger than the errors obtained by averaging the values from the various experiments.
Figure 2.
PWR spectral position minimum for both p (solid line) and s (dashed line) polarized excitation light plotted as a function of the concentration of cyt c2 in the sample cell compartment. (A) addition of cyt c2 to sample cell with chromatophore membrane fragments deposited on the sensor surface and (B) addition of cyt c2 to sample cell with a bare sensor surface (without the membrane fragments).
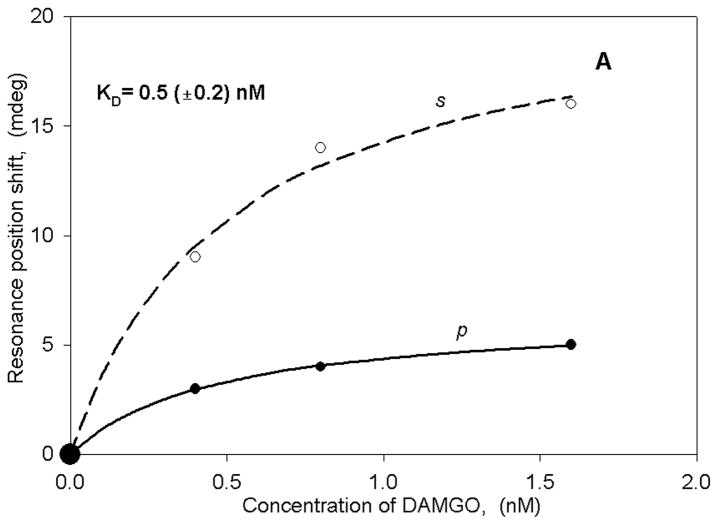
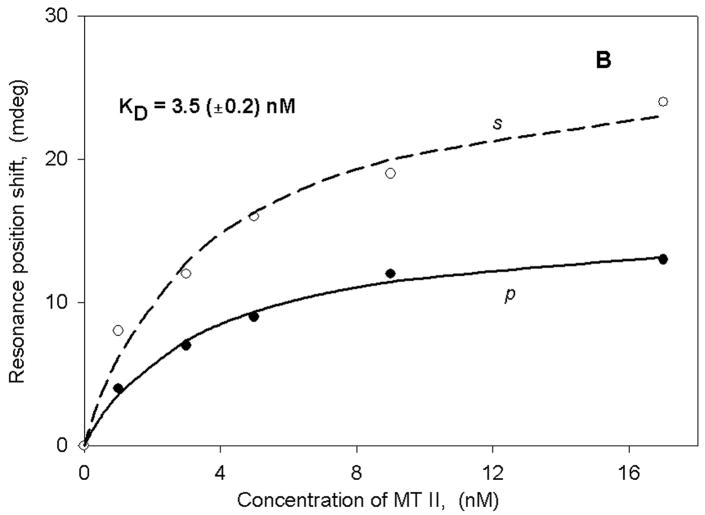
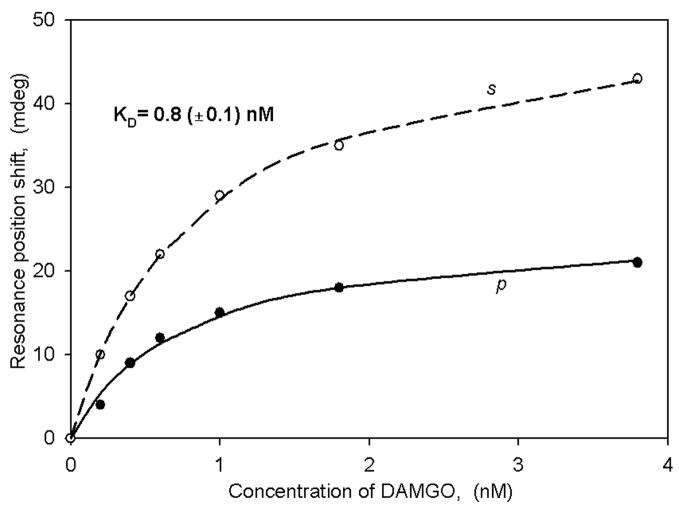
Figure 3A,B shows the binding curves obtained with membrane fragments isolated from hMOR- and MC4-transfected HEK cells using both light excitation polarizations. Panel A demonstrates an interaction between hMOR and a small peptide agonist ligand DAMGO, whereas panel B shows the interaction between the MC4 receptor and a potent melanotropin agonist Melanotan-II. In both cases there are rather large spectral shifts resulting in nM-range binding constants that are very similar to those obtained with radioligands for these receptor systems (32, 33, 38). It is also important to point out that the shifts obtained with the different polarizations are quite dissimilar, resulting in an s:p ratio of close to 2. This is in striking contrast to the anisotropy value obtained after membrane fragment deposition and cyt c2 binding to chromatophores (see above). Such a high ratio indicates a significant anisotropy in mass rearrangement as a consequence of ligand binding. Based on our previous experience with single lipid bilayer membranes, we can conclude that both the large magnitude of the resonance shifts and the anisotropy changes cannot be explained by a simple addition of mass using such small peptides as ligands. This suggests that ligand binding to the receptor triggers other processes besides structural changes in the receptor, for example mass movement within the membrane fragments. The nature of these processes cannot be specified at the present time, but they could include G-protein binding and activation as well as other downstream signaling events. Further studies will be required in order to obtain a clearer understanding of these events.
Figure 3.
Binding curves (as described in Figure 2) for either DAMGO (panel A) or MTII (panel B) obtained with HEK membrane fragments transfected either with hMOR (panel A) or MC4 (panel B) receptors.
It is important to note that we have performed two control experiments with these systems. First, we have examined ligand interaction with a bare PWR sensor surface, and second we have probed the interaction between the ligands and non-transfected HEK cell fragments. In both cases, no significant spectral shifts indicating no measurable binding to either the bare sensor or the membrane in the nM range of ligand concentration were observed, confirming that the spectral shifts observed with transfected cells are indeed related to the receptor-ligand interactions.
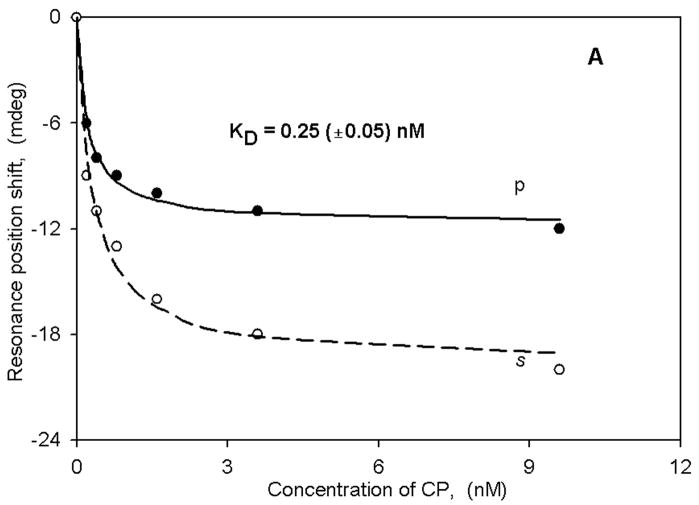
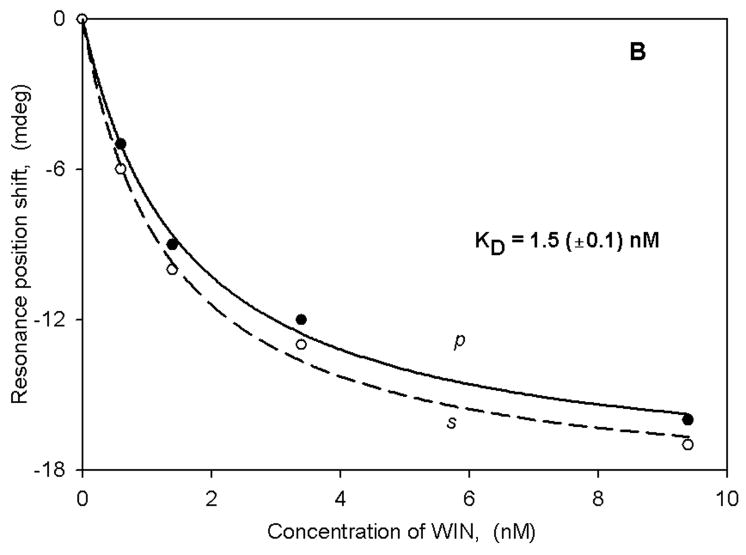
The large spectral shifts observed with membrane fragments obtained from transfected HEK cells indicated to us that we might be able to use native (non-transfected) membrane fragments to observe spectral changes triggered by ligand binding with a receptor known to be present. An example of such an experiment is given in Figure 4A,B in which we have used native neuronal membrane fragments obtained from rat trigeminal ganglia. These are known to contain the cannabinoid (CB1) receptor (39), and thus we challenged them with two structurally distinct cannabinoid agonists (CP 55,940 and WIN 55,212–2). Note that the shifts are negative for both polarizations and for both ligands. The binding results yield KD values that are in excellent agreement with both those from radioligand binding experiments as well as with our recent lipid bilayer PWR studies (35). Furthermore, the s:p ratios obtained with these two ligands are different, indicating that different mass rearrangements are occurring as a consequence of ligand binding. The negative shifts also indicate that mass density is decreasing upon ligand binding, whereas in the other cases described above the mass density is increasing. It is also noteworthy that, in the CB1 receptor- lipid bilayer experiments these two ligands also produced different structural changes (35).
Figure 4.
Binding curves for either CP (panel A) or WIN (panel B) obtained with native (non-transfected) rat trigeminal ganglion membrane fragments.
Since rat trigeminal ganglion cells are also known to contain the MOR (40), we performed experiments using DAMGO as the ligand. In this case we also observed large spectral shifts (Figure 5) in the positive direction, with a KD value similar to that obtained with the transfected cell membranes described above. Thus, ligand binding to both the CB1 receptor and the MOR can be observed in the same membrane preparation.
Figure 5.
Binding curves of DAMGO obtained with native (non-transfected) rat trigeminal ganglion membrane fragments.
Conclusions
The results presented in these experiments clearly demonstrate that receptor-ligand interactions can be observed using PWR spectroscopy in both native membrane preparations and in membranes derived from cells that have been stably transfected with specific receptors. This opens the door to studies in which receptor activation levels (as judged by spectral shift sizes), ligand-induced mass density and distribution changes (as judged by shift directions and anisotropies) and receptor properties (as judged by KD values) can be observed to change in response to prior treatments of membrane fragments, cells or even whole organisms, such as exposure to drugs or inhibitors or genetic modifications.
The results also indicate that the PWR responses are monitoring both ligand binding events and downstream processes involving proteins other than the receptor itself. This might prove useful in mapping such downstream events via inhibitor studies or genetic modifications. Taken together, these studies appear to offer a powerful new tool for obtaining useful biological information about receptor-mediated processes.
Acknowledgments
This work was supported in part by grants from the NIH: DA06284 (to V.J. Hruby); DA13449 (to V.J. Hruby); and GM21277(to M.A. Cusanovich).
Abbreviations used
- PWR
plasmon-waveguide resonance
- SPR
surface plasmon resonance
- HEK
human embryonic kidney
- hMC4R
human melanocortin-4 receptor
- hMOR
human μ-opioid receptor
- CB1
cannabinoid-1
- DAMGO
[D-Ala2, NMe-Phe4, Gly-ol5]-enkephalin)
- MTII
Melanotan-II, Ac-Nle-c[Asp-His-DPhe-Arg-Trp-Lys]-NH2
Footnotes
Publisher's Disclaimer: This is a PDF file of an unedited manuscript that has been accepted for publication. As a service to our customers we are providing this early version of the manuscript. The manuscript will undergo copyediting, typesetting, and review of the resulting proof before it is published in its final citable form. Please note that during the production process errors may be discovered which could affect the content, and all legal disclaimers that apply to the journal pertain.
References
- 1.Salamon Z, Macleod HA, Tollin G. Coupled plasmon-waveguide resonators: a new spectroscopic tool for probing proteolipid film structure and properties. Biophys J. 1997;73:2791–2797. doi: 10.1016/S0006-3495(97)78308-5. [DOI] [PMC free article] [PubMed] [Google Scholar]
- 2.Salamon Z, Tollin G. Plasmon resonance spectroscopy: probing molecular interactions at surfaces and interfaces. Spectroscopy. 2001;15:161–175. doi: 10.1016/s0968-0004(99)01394-8. [DOI] [PubMed] [Google Scholar]
- 3.Salamon Z, Brown MF, Tollin G. Plasmon resonance spectroscopy: probing interactions within membranes. Trends Biochem Sci. 1999;24:213–219. doi: 10.1016/s0968-0004(99)01394-8. [DOI] [PubMed] [Google Scholar]
- 4.Salamon Z, Tollin G, Alves ID, Hruby VJ. Plasmon resonance methods in membrane protein biology: applications to GPCR signalling. Methods in Enzymology. 2008 doi: 10.1016/S0076-6879(09)05406-8. in press. [DOI] [PubMed] [Google Scholar]
- 5.Salamon Z, Cowell S, Varga E, Yamamura HI, Hruby VJ, Tollin G. Plasmon resonance studies of agonist/antagonist binding to the human δ-opioid receptor: new structural insights into receptor-ligand interactions. Biophys J. 2000;79:2463–2474. doi: 10.1016/S0006-3495(00)76489-7. [DOI] [PMC free article] [PubMed] [Google Scholar]
- 6.Salamon Z, Devanathan S, Alves ID, Tollin G. Plasmon-waveguide resonance studies of lateral segregation of lipids and proteins into microdomains (rafts) in solid-supported bilayers. J Biol Chem. 2005;280:11175–11184. doi: 10.1074/jbc.M411197200. [DOI] [PubMed] [Google Scholar]
- 7.Devanathan S, Salamon Z, Tollin G, Fitch J, Meyer TE, Cusanovich MA. Binding of oxidized and reduced cytochrome c2 to photosynthetic reaction centers: plasmon-waveguide resonance spectroscopy. Biochemistry. 2004;43:16405–16415. doi: 10.1021/bi0481904. [DOI] [PubMed] [Google Scholar]
- 8.Watts TA, Brian AA, Kappler JW, Marrack P, McConnell HM. Antigen presentation by supported planar membranes containing affinity-purified I-Ad. Proc Natl Acad Sci USA. 1984;81:7564–7568. doi: 10.1073/pnas.81.23.7564. [DOI] [PMC free article] [PubMed] [Google Scholar]
- 9.McConnell HM, Watts TH, Weis RM, Brian AA. Supported planar membranes in studies of cell-cell recognition in the immune system. Biochim Biophys Acta. 1986;864:95–106. doi: 10.1016/0304-4157(86)90016-x. [DOI] [PubMed] [Google Scholar]
- 10.Nollert P, Kiefer H, Jahnig F. Lipid vesicle adsorption versus formation of planar bilayers on solid surfaces. Biophys J. 1995;69:1447–1455. doi: 10.1016/S0006-3495(95)80014-7. [DOI] [PMC free article] [PubMed] [Google Scholar]
- 11.Radler J, Strey H, Sackmann E. Phenomenology and kinetics of lipid bilayer spreading on hydrophilic surfaces. Langmuir. 1995;11:4539–4548. [Google Scholar]
- 12.Keller CA, Kasemo B. Surface specific kinetics of lipid vesicle adsorption measured with a quartz crystal microbalance. Biophys J. 1998;75:1397–1402. doi: 10.1016/S0006-3495(98)74057-3. [DOI] [PMC free article] [PubMed] [Google Scholar]
- 13.Cremer PS, Boxer SG. Formation and spreading of lipid bilayers on planar glass supports. J Phys Chem B. 1999;103:2554–2559. [Google Scholar]
- 14.Jass J, Tjarnhage T, Puu G. From liposomes to supported lipid bilayer structures on hydrophilic and hydrophobic surfaces: an atomic force microscopy study. Biophys J. 2000;79:3153–3163. doi: 10.1016/S0006-3495(00)76549-0. [DOI] [PMC free article] [PubMed] [Google Scholar]
- 15.Keller CA, Glasmaster K, Zhdanov VP, Kasemo B. Formation of supported membranes from vesicles. Phys Rev Lett. 2000;84:5443–5446. doi: 10.1103/PhysRevLett.84.5443. [DOI] [PubMed] [Google Scholar]
- 16.Reviakine I, Brisson A. Formation of supported phospholipid bilayers from unilamellar vesicles investigated by atomic force microscopy. Langmuir. 2000;16:1806–1815. [Google Scholar]
- 17.Johnson JM, Taekijp H, Chu S, Boxer SG. Early steps of supported bilayer formation probed by single vesicle fluorescence assays. Biophys J. 2002;83:3371–3379. doi: 10.1016/S0006-3495(02)75337-X. [DOI] [PMC free article] [PubMed] [Google Scholar]
- 18.Reimhult E, Hook F, Kasemo B. Temperature dependence of formation of a supported phospholipid bilayer from vesicles on SiO2. Phys Rev E. 2002;66:051905. doi: 10.1103/PhysRevE.66.051905. [DOI] [PubMed] [Google Scholar]
- 19.Richter R, Mukhopadhyay A, Brisson A. Pathways of lipid vesicle deposition on solid surfaces: a combined QCM-D and AFM study. Biophys J. 2003;85:3035–3047. doi: 10.1016/S0006-3495(03)74722-5. [DOI] [PMC free article] [PubMed] [Google Scholar]
- 20.Lipowsky R, Seifert U. Adhesion of vesicles and membranes. Mol Cryst Liq Cryst. 1991;202:17–25. [Google Scholar]
- 21.Seifert U. Configuration of fluid membranes and vesicles. Adv Phys. 1997;46:13–137. [Google Scholar]
- 22.Zhdanov VP, Keller CA, Glasmaster K, Kasemo B. Simulation of adsorption kinetics of lipid vesicles. J Chem Phys. 2000;112:900–909. [Google Scholar]
- 23.Zhdanov VP, Kasemo B. Comments on rupture of adsorbed vesicles. Langmuir. 2001;17:3518–3521. [Google Scholar]
- 24.Braun D, Fromherz F. Fluorescence interface-contrast microscopy of cell adhesion on oxidized silicon. Appl Phys A. 1997;65:341–348. [Google Scholar]
- 25.Bereiter-Hahn J, Fox CH, Thoell B. Quanttitative reflection contrast microscopy of living cells. J Cell Biol. 1979;82:769–779. doi: 10.1083/jcb.82.3.767. [DOI] [PMC free article] [PubMed] [Google Scholar]
- 26.Truskey GA, Burmeister JS, Grapa E, Reichert WM. Total internal reflection fluorescence microscopy (TIRFM): topological mapping of relative cell/substratum distances. J Cell Sci. 1992;103:491–499. doi: 10.1242/jcs.103.2.491. [DOI] [PubMed] [Google Scholar]
- 27.Ramsden JJ, Li SY, Prenosil JE, Heinzle E. Kinetics of adhesion and spreading of animal cells. Biotechnol Bioeng. 1994;43:939–945. doi: 10.1002/bit.260431007. [DOI] [PubMed] [Google Scholar]
- 28.Horath R, Pedersen HC, Skivesen N, Selmeczi D, Larsen NB. Monitoring of living cell attachment and speading using reverse symmetry waveguide sensing. Appl Phys Lett. 2005;86:1135–1145. [Google Scholar]
- 29.Giebel KF, Bechinger C, Herminhaus S, Riedel M, Leiderer P, Weiland U, Bastmeyer M. Imaging of cell/substrate contacts of living cells with surface plasmon resonance microscopy. Biophys J. 1999;76:509–516. doi: 10.1016/s0006-3495(99)77219-x. [DOI] [PMC free article] [PubMed] [Google Scholar]
- 30.Fang Y, Ferrie AM, Fontaine NH, Mauro J, Balakrishnan J. Resonant waveguide grating biosensor for living cell sensing. Biophys J. 2006;91:1925–1940. doi: 10.1529/biophysj.105.077818. [DOI] [PMC free article] [PubMed] [Google Scholar]
- 31.Caffrey MS, Daldal F, Holden HM, Cusanovich MA. Importance of conserved hydrogen-bonding network in cytochromes c to their redox potentials and stabilities. Biochemistry. 1991;30:4119–4125. doi: 10.1021/bi00231a002. [DOI] [PubMed] [Google Scholar]
- 32.Cai M, Cai C, Mayorov AV, Xiong C, Cabello CM, Soloshonok VA, Swift JR, Trivedi D, Hruby VJ. Biological and conformational study of beta-substituted prolines in MT-II template: steric effects leading to human MC5 receptor selectivity. J Peptide Res. 2004;63:116–131. doi: 10.1111/j.1399-3011.2003.00105.x. [DOI] [PubMed] [Google Scholar]
- 33.Cai M, Mayorov AV, Cabello C, Stankova M, Trivedi D, Hruby VJ. Novel 3D pharmacophore of alpha-MSH/gamma-MSH hybrids leads to selective human MC1R and MC3R analogues. J Med Chem. 2005;48:1839–1848. doi: 10.1021/jm049579s. [DOI] [PubMed] [Google Scholar]
- 34.Al-Obeidi F, Hadley ME, Pettitt BM, Hruby VJ. Design of a new class of superpotent α-melanotropins based on quenched dynamic simulations. J Am Chem Soc. 1989;111:3413–3416. [Google Scholar]
- 35.Georgieva T, Devanathan S, Stropova D, Park ChK, Salamon Z, Tollin G, Hruby VJ, Roeske WR, Yamamura HI, Varga E. Unique agonist-bound cannabinoid CB1 receptor conformations indicate agonist specificity in signaling. Eur J Pharmacol. 2008;581:19–29. doi: 10.1016/j.ejphar.2007.11.053. [DOI] [PMC free article] [PubMed] [Google Scholar]
- 36.Salamon Z, Tollin G. Optical anisotropy in lipid bilayer membranes: coupled plasmon-waveguide resonance measurements of molecular orientation, polarizability, and shape. Biophys J. 2001;80:1557–1567. doi: 10.1016/S0006-3495(01)76128-0. [DOI] [PMC free article] [PubMed] [Google Scholar]
- 37.Devanathan S, Salamon Z, Tollin G, Fitch JC, Meyer TE, Berry EA, Cusanovich MA. Plasmon waveguide resonance spectroscopic evidence for differential binding of oxidized and reduced Rhodobacter capsulatus cytochrome c2 to the cytochrome bc1 complex mediated by the conformation of the Rieske iron-sulfur protein. Biochemistry. 2007;46:7138–7145. doi: 10.1021/bi602649u. [DOI] [PMC free article] [PubMed] [Google Scholar]
- 38.Raynor K, Kong H, Chen Y, Yasuda K, Yu L, Bell GI, Reisine T. Pharmacological characterization of the cloned κ-, δ-, and μ-opioid receptors. Mol Pharmacol. 1994;45:330–334. [PubMed] [Google Scholar]
- 39.Price TJ, Helesic G, Parghi D, Hargreaves KM, Flores CM. The neuronal distribution of cannabinoid receptor type 1 in the trigeminal ganglion of the rat. Neuroscience. 2003;120:155–62. doi: 10.1016/S0306-4522(03)00333-6. [DOI] [PMC free article] [PubMed] [Google Scholar]
- 40.Li JL, Ding YQ, Li YQ, Li JS, Nomura S, Kaneko T, Mizuno N. Immunocytochemical localization of mu-opioid receptor in primary afferent neurons containing substance P or calcitonin gene-related peptide. A light and electron microscope study in the rat. Brain Res. 1998;794:347–52. doi: 10.1016/s0006-8993(98)00332-1. [DOI] [PubMed] [Google Scholar]


