Abstract
Measuring in vivo spinal cord injury and repair remains elusive. Using MRS we examined brainstem N-acetyl-aspartate as a surrogate for spinal cord injury in two mouse strains with different reparative phenotypes following virus-induced demyelination. SJL mice progressively demyelinate with axonal loss. FVB mice demyelinate similarly but eventually remyelinate coincident with functional recovery. Brainstem NAA levels drop in both but recover in FVB mice. Chronically infected SJL mice lost 30.5% of spinal cord axons compared to FVB mice (7.3%). In remyelination-enhancing or axon-preserving clinical trials, brainstem MRS may be a viable endpoint to represent overall spinal cord dysfunction.
INTRODUCTION
New, non-invasive technologies to evaluate spinal cord injury and repair are needed. Proton magnetic resonance spectroscopy (MRS) is one ideal method; however, because the spinal cord is small and surrounded by bone, direct spectroscopy has been limited. During retrograde labeling studies of demyelinated spinal cord axons, we observed a reduction in neuron cell bodies in the brainstem labeled with fluorescent markers indicating death or dysfunction1. This led to the concept that neuron health measured at the brainstem with MRS may reflect the integrity of many ascending and descending spinal cord pathways. By following virus induced spinal cord disease in two strains of mice, we show that chronic demyelination with axonal loss and remyelination with axonal preservation result in different brainstem MRS signatures. This provides proof in principle that assessment of brainstem MRS in humans may serve as a surrogate marker of spinal cord axonal health or injury.
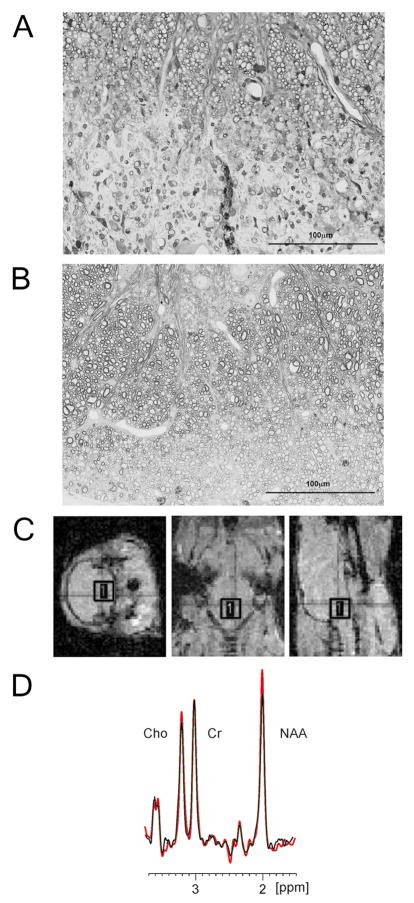
TMEV infection in susceptible strains of mice results in immune-mediated chronic CNS demyelination and is an excellent model for MS2. Histopathology includes focal demyelinated lesions, inflammation, axonal damage, glial scars and rarely remyelination. Infection of SJL mice results in chronic demyelination with very little remyelination, whereas infection of FVB mice results in similar extent of demyelination followed by almost complete remyelination (Figure 1). Retrograde labeling demonstrated significant injury to axons and their corresponding neurons in the brainstem in SJL mice but only limited injury in FVB mice3.
Figure 1. SJL and FVB mouse strains differ in the extent of remyelination in the chronic stages of TMEV induced demyelinating disease. Is this based on a difference in axon preservation and can MRS at the brainstem be used in a correlative study?
A) Example of a demyelinated lesion in a SJL mouse at 270 days post infection. B) Example of a remyelinated lesion in a FVB mouse at 270 days post infection (Scale: 100 μm). C) Positioning of the region of interest (ROI) voxel over a mouse brainstem. A very short tripilot MRI scan was used to obtain images in three orthogonal planes in order to position the (2.5×2.5×2.5) mm3 voxel according to anatomic landmarks. D) A 300MHz, 1H overlapping spectra collected at the mouse brainstem. Red colored spectrum is from healthy uninfected mouse and black is from an infected mouse. Choline (Cho), creatine (Cr) and N-acetyl-aspartate (NAA) are the dominant peaks. The spectra are referenced to the residual water peak at 4.7 ppm and normalized to creatine peak
Proton MR spectroscopy (1H-MRS) is a non-invasive method that enables in vivo quantification of metabolites in the brainstem. Important MRS peaks in nervous tissue are N-acetyl aspartate (NAA), myo-inositol, creatine/phosphocreatine (Cr) and choline-containing compounds (Cho). NAA is the most abundant free amino acid in nervous tissue4. NAA concentration is considered to reflect primarily neuronal and axonal integrity because NAA is almost exclusively restricted to neurons. The MR spectral profile of purified CNS cells indicates that NAA signal amplitude is predominant in neurons. NAA signal amplitude in purified cultures of oligodendrocytes or astrocytes was 5% and 10% of the neuron signal, respectively 5. In the MRS spectrum, the dominant NAA peak occurs at 2.02 ppm, originating from 3 N-acetyl methyl group protons 4. The area under the MRS peak is proportional to the number of spins in the group and can be converted into molar concentration, after proton number normalization6. NAA decreases in neurons after injury and is a marker of integrity. A decrease of NAA concentration occurs early in disease in normal-appearing white matter of MS patients7–10. Of importance, the relative NAA concentration correlates with the neurologic disability in MS patients11. In this study, we use brainstem MRS as a surrogate marker for spinal cord neuronal integrity in strains of mice with different phenotypes of virus-induced demyelinating disease.
MATERIALS AND METHODS
Mice
SJL/J (Swiss Jim Lambert) and FVB/NJ (Friend Virus B) mice (Jackson Laboratories, Bar Harbor, ME) were housed and bred in Mayo Clinic’s animal care facility. Animal protocols were approved by the Mayo Clinic Institutional Animal Care and Use Committee.
Theiler’s virus model of demyelination
Demyelinating disease was induced in 6- to 8-week-old mice by intracerebral injection of TMEV (Theiler’s murine encephalomyelitis virus). See supplementary methods for more details on virus infection. Axon injury and loss begin three months after infection correlating with neurologic dysfunction12.
Magnetic Resonance Spectroscopy
MRS was performed using a Bruker Avance 300MHz (7T) vertical bore NMR spectrometer (Bruker Biospin, Billercia, MA) equipped with mini- and micro-imaging accessories. During data acquisition, animal core temperature was maintained at 37°C by a flow of warm air. Inhalational isoflurane anesthesia 1.5–2.5 % in oxygen was delivered via nose cone. MRS data were obtained from a (2.5×2.5×2.5) mm3 voxel, placed over the brainstem (Figure 1C) and (3×3×3.5) mm3 voxel placed over the striatum as a control (Supplementary Figure 1A). Spectra were processed and analyzed with TOPSPIN, Bruker Biospin’s proprietary software. NAA was quantified by comparing the areas under NAA peaks from the brainstem with the area under the same peak in a test phantom standard with known concentration, recorded under identical conditions, as explained in detail in supplementary methods. Overlapping spectra from a healthy and infected mouse are shown (Figure 1D).
Spinal cord pathology and axonal counts
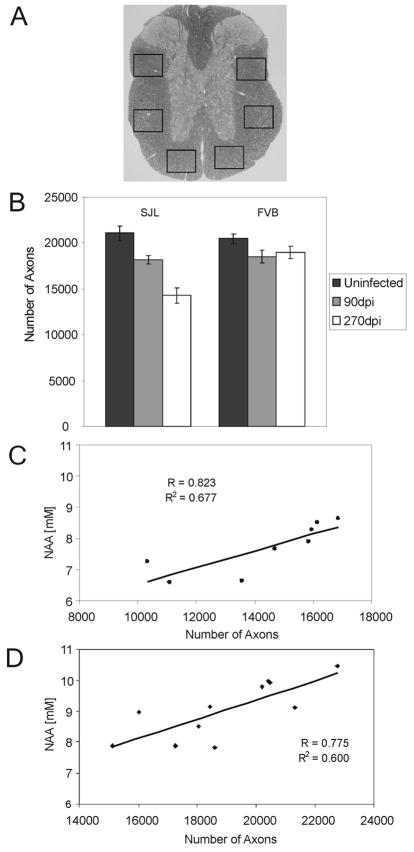
Mice were perfused and spinal cords embedded in araldite plastic (see supplementary methods for details on morphology). An Olympus Provis AX70 microscope that was fitted with a DP70 digital camera and a 60x oil-immersion objective was used to capture six sample areas of normal-appearing white matter containing a relative absence of demyelination from each cross section, according to the sampling scheme in Figure 3A. Approximately 400,000 μm2 of white matter was sampled from each mouse. Absolute myelinated axon numbers were calculated as previously reported13. Methods for brain pathology scores are described in supplementary data.
Figure 3. The absolute number of myelinated axons at the T6 level of the spinal cord is greater in chronically TMEV infected FVB mice compared to infected SJL mice. A).
A) Demonstration of the sampling scheme used to collect images to calculate number of myelinated axons from a mid-thoracic section of each animal. Images of six sample areas of normal-appearing white matter containing a relative absence of demyelination were collected from a cross section, converted to black and white and complete circular objects counted using a macro written in Matlab (The Mathworks, Nattick, MA). Approximately 400,000 μm2 of white matter was sampled from each mouse. Axons were counted in the normal-appearing white matter because this provided a global representation of the axon loss from multiple, randomly distributed demyelinated lesions throughout the spinal cord. B) The absolute number of axons in uninfected and 90 and 270-day post infected SJL and FVB mice. Bars represent the means of the group with standard error the mean. In SJL mice there were fewer axons present at 270 days post infection compared to uninfected age matched controls (p<0.001). In FVB mice axons present at 270 days post infection were no different than in uninfected controls (p=0.134). C and D) Positive correlation between brain stem NAA concentrations and number of axons in chronically infected SJL mice (C) and FVB mice (D).
Statistics
Data were compared by Student’s T test if normally distributed or by Mann-Whitney Rank sum test if non-normally distributed. More than two groups were compared by ANOVA. P<0.05 was considered significant.
RESULTS
Cross-Sectional Mouse Strain Comparison
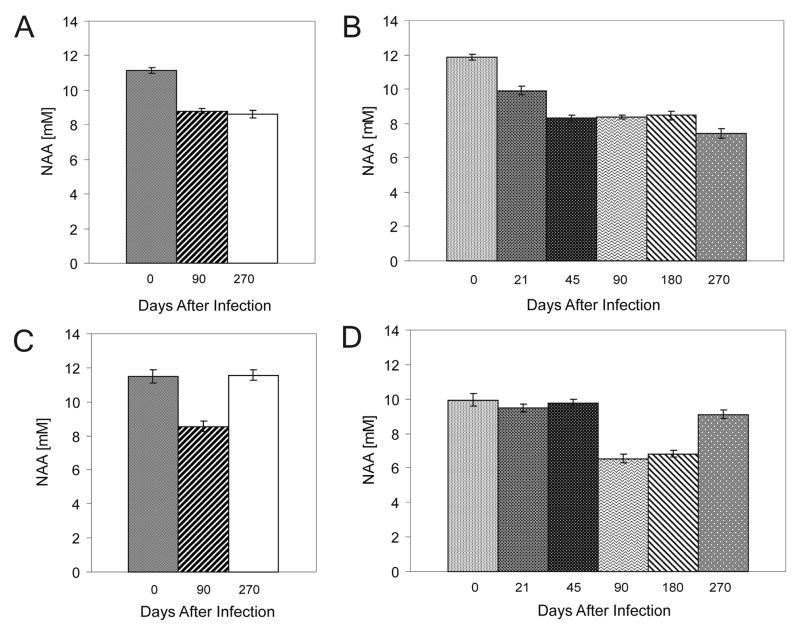
MRS was collected from 3 groups of SJL and FVB mice (n=8–10): normal uninfected, 90 days post-infection and 270 days post-infection. At 90 days post-infection brainstem NAA concentrations decreased in both strains compared to uninfected controls (Figure 2A and C). At 270 days post infection, NAA concentrations in SJL mice remained low, while NAA levels recovered in FVB mice. This is consistent with histopathology and disease phenotype SJL––mice developed axon loss following demyelination12 whereas FVB mice repair1.
Figure 2. NAA concentrations detected at the brainstem by MRS used to follow spinal cord demyelinating disease progression in a virus-mediated mouse model of multiple sclerosis.
A and C) MRS cross-sectional study was used to compare groups of 8 to 10 infected and uninfected SJL and FVB mice. The NAA concentration was significantly decreased in both SJL and FVB mice at 90 days post-infection compared to uninfected mice of the same strains (p<0.0001). Bars represent the means of absolute NAA concentrations of the group with standard error the mean. At this time both strains present with an equivalent extent of spinal cord demyelination. At 270 days post-infection, NAA concentrations in SJL mice remained low, while in FVB mice the NAA concentration recovered to normal. At this time FVB mice are completely remyelinated and neurologic deficits are reversed. We interpret this study to show that MRS at the brainstem is detecting a difference in axon preservation that correlates with disability. B and D) Longitudinal time course study was used to better define the temporal changes in brainstem NAA levels. Individuals from groups of 15 SJL and FVB mice were monitored prior to TMEV infection and repeatedly as disease progressed out to 270 days post infection. Bars represent the means of NAA concentrations of the group with standard error the mean. Changes in NAA concentration were consistent with those recorded in the previous study (Figures 2A and C). In both mouse strains NAA concentration decreased through 180 days post infection. NAA concentrations remained low in infested SJL mice, but recovered in FVB mice at the 270-day time point to a level comparable to that prior to infection. Comparison of NAA concentrations for SJL, (day 0 vs day 21 through day 270, p<0.001) and for FVB (day 0 vs. day 90, p<0.001; day 0 vs day 270, p=0.071; day 90 vs day 270, p<0.001). We interpret this study to indicate that more axons are preserved in FVB mice so that a larger population is available as a substrate for remyelination. Remyelinated axons regain function and reversed NAA concentrations in the brainstem.
Longitudinal Changes in Brainstem NAA
To characterize the temporal changes in NAA concentrations through disease in individual mice, MRS was collected from groups of SJL and FVB mice (n=15) prior to TMEV infection and at 21, 45, 90, 180 and 270 days after infection (Figure 2). Confirming our first study, NAA concentrations fell in both strains at 90 days after infection and remained low 90 days later. Again, at the 270 days post infection, NAA levels recovered close to baseline in FVB mice but remained low in SJL mice (Figure 2B and D). In a separate cohort of SJL and FVB mice at 0, 90 and 270dpi MRS was collected over the striatum as a control for the brain stem values. No differences were found in NAA concentrations in the striatum (Supplementary Figure 1B). In the same cohort of infected mice, hemispheric and brain stem MRI was performed, showing no lesions (Supplementary Figure 2A–H). Brain pathology assessment did not reveal significant difference between the two strains p=0.216 (Supplementary Figure 2I and J)
Axon Loss in Chronically Diseased Mice
At the end of the longitudinal study, axons were counted in the normal-appearing spinal cord white matter at T6 in each mouse (Figure 3B). There were 30.5% fewer axons in SJL mice at 270dpi compared to age-matched uninfected controls (p<0.001). In contrast, there were 7.3% fewer axons in FVB mice at 270dpi, which was not different from uninfected controls (p=0.134). We found positive correlation between brain stem NAA concentrations and axon counts in both mouse strains (Figure 3C and D). For SJL mice r=0.823 (p=0.012) and for FVB mice r=0.775 (p=0.005).
DISCUSSION
Infection of susceptible strains of mice with TMEV induces inflammatory demyelination in the spinal cord 3. In SJL mice, demyelination begins several weeks after infection with minimal remyelination and progressive neurologic deficits. FVB mice are similar in ancestry to SJL mice14 but differ at the MHC H-2 locus. By three months after infection, spinal cord demyelination is equivalent in the two stains. However, three months post infection, the disease progression diverges. SJL remain demyelinated, whereas FVB mice completely remyelinate and recover neurologic function3.
Retrograde labeling at the T6 level of the spinal cord with the fluorescent tracer Fluoro-Gold 1 shows that demyelination in SJL mice is accompanied by axonal loss, detected as a decrease of fluorescent brainstem neurons. Most lesions occur at the cervical and thoracic level. Therefore, a reduction in the number of labeled brainstem cells occurs because of disturbed retrograde transport or axonal degeneration12. When compared to uninfected controls, chronically infected SJL mice show >70% reduction in retrograde-labeled brainstem cells. At 270 days after infection, the brainstem is not demyelinated by electron microscopy; thus, the changes in MRS in brainstem are a result of retrograde injury from the spinal cord
Magnetic resonance spectroscopy is widely used in models of neurologic disease. To our knowledge, this is the first study using MRS at the brainstem as a surrogate marker for axonal injury and demyelination throughout the spinal cord. Two possible explanations for the recovery of NAA levels in FVB mice are: 1) brainstem neurons are only injured—not destroyed—during demyelination and regain function as repair progresses; or 2) brainstem neurons are lost, but later replaced by precursor cells. Because disability in human MS patients is often determined primarily by spinal cord lesion load, MRS at the brainstem may predict disease progression. MRS at the brainstem may also be a viable endpoint in clinical trials designed to preserve or protect axons in the spinal cord.
Supplementary Material
Acknowledgments
Disclosure: This work was supported by grants from the NIH (NS R01 24180, NS R0132129, NS048357) and grants from the National Multiple Sclerosis Society (RG 3172 and CA 1011A8). We also wish to thank the Applebaum and Hilton Foundations for their support.
We appreciate the editorial assistance of Lea Dacy.
References
- 1.Ure D, Rodriguez M. Extensive injury of descending neurons demonstrated by retrograde labeling in a virus-induced murine model of chronic inflammatory demyelination. J Neuropathol Exp Neurol. 2000;59:664–678. doi: 10.1093/jnen/59.8.664. [DOI] [PubMed] [Google Scholar]
- 2.Pirko I, Johnson A, Gamez J, et al. Disappearing “T1 black holes” In an animal model of multiple sclerosis. Front Biosci. 2004;9:1222–1227. doi: 10.2741/1322. [DOI] [PubMed] [Google Scholar]
- 3.Bieber AJ, Ure DR, Rodriguez M. Genetically dominant spinal cord repair in a murine model of chronic progressive multiple sclerosis. J Neuropathol Exp Neurol. 2005;64:46–57. doi: 10.1093/jnen/64.1.46. [DOI] [PubMed] [Google Scholar]
- 4.Govindaraju V, Young K, Maudsley AA. Proton nmr chemical shifts and coupling constants for brain metabolites. NMR Biomed. 2000;13:129–153. doi: 10.1002/1099-1492(200005)13:3<129::aid-nbm619>3.0.co;2-v. [DOI] [PubMed] [Google Scholar]
- 5.Manganas LN, Zhang X, Li Y, et al. Magnetic resonance spectroscopy identifies neural progenitor cells in the live human brain. Science. 2007;318:980–985. doi: 10.1126/science.1147851. [DOI] [PMC free article] [PubMed] [Google Scholar]
- 6.Drost DJ, Riddle WR, Clarke GD. Proton magnetic resonance spectroscopy in the brain: Report of aapm mr task group #9. Med Phys. 2002;29:2177–2197. doi: 10.1118/1.1501822. [DOI] [PubMed] [Google Scholar]
- 7.Filippi M, Tortorella C, Bozzali M. Normal-appearing white matter changes in multiple sclerosis: The contribution of magnetic resonance techniques. Mult Scler. 1999;5:273–282. doi: 10.1177/135245859900500414. [DOI] [PubMed] [Google Scholar]
- 8.Rooney WD, Goodkin DE, Schuff N, et al. 1h mrsi of normal appearing white matter in multiple sclerosis. Mult Scler. 1997;3:231–237. doi: 10.1177/135245859700300403. [DOI] [PubMed] [Google Scholar]
- 9.Roser W, Hagberg G, Mader I, et al. Proton mrs of gadolinium-enhancing ms plaques and metabolic changes in normal-appearing white matter. Magn Reson Med. 1995;33:811–817. doi: 10.1002/mrm.1910330611. [DOI] [PubMed] [Google Scholar]
- 10.Tourbah A, Stievenart JL, Iba-Zizen MT, et al. In vivo localized nmr proton spectroscopy of normal appearing white matter in patients with multiple sclerosis. J Neuroradiol. 1996;23:49–55. [PubMed] [Google Scholar]
- 11.De Stefano N, Matthews PM, Fu L, et al. Axonal damage correlates with disability in patients with relapsing-remitting multiple sclerosis. Results of a longitudinal magnetic resonance spectroscopy study. Brain. 1998;121 (Pt 8):1469–1477. doi: 10.1093/brain/121.8.1469. [DOI] [PubMed] [Google Scholar]
- 12.McGavern DB, Murray PD, Rivera-Quinones C, et al. Axonal loss results in spinal cord atrophy, electrophysiological abnormalities and neurological deficits following demyelination in a chronic inflammatory model of multiple sclerosis. Brain. 2000;123(Pt 3):519–531. doi: 10.1093/brain/123.3.519. [DOI] [PMC free article] [PubMed] [Google Scholar]
- 13.Howe CL, Adelson JD, Rodriguez M. Absence of perforin expression confers axonal protection despite demyelination. Neurobiol Dis. 2007;25:354–359. doi: 10.1016/j.nbd.2006.10.001. [DOI] [PMC free article] [PubMed] [Google Scholar]
- 14.Beck JA, Lloyd S, Hafezparast M, et al. Genealogies of mouse inbred strains. Nat Genet. 2000;24:23–25. doi: 10.1038/71641. [DOI] [PubMed] [Google Scholar]
Associated Data
This section collects any data citations, data availability statements, or supplementary materials included in this article.


