Abstract
Although the first reactive oxygen species (ROS) formed during irradiation of photosensitized cells is almost invariably singlet molecular oxygen (1O2), other ROS have been implicated in the phototoxic effects of photodynamic therapy (PDT). Among these are superoxide anion radical (•O2 −), hydrogen peroxide (H2O2) and hydroxyl radical (•OH). In this study, we investigated the role of H2O2 in the pro-apoptotic response to PDT in murine leukemia P388 cells. A primary route for detoxification of cellular H2O2 involves the peroxisomal enzyme catalase. Inhibition of catalase activity by 3-amino-1,2,4-triazole led to an increased apoptotic response. PDT-induced apoptosis was impaired by addition of an exogenous recombinant catalase analog (CAT-skl) that was specifically designed to enter cells and more efficiently localize in peroxisomes. A similar effect was observed upon addition of 2,2′-bipyridine, a reagent that can chelate Fe+2, a co-factor in the Fenton reaction that results in the conversion of H2O2 to •OH. These results provide evidence that formation of H2O2 during irradiation of photosensitized cells contributes to PDT efficacy.
INTRODUCTION
Photodynamic therapy (PDT) involves the irradiation of photosensitized cells and tissues, leading to the formation of cytotoxic reactive oxygen species (ROS). Promotion of PDT efficacy is expected to lead to improved tumor eradication. This can be useful, e.g. if light penetration is impaired or the concentration of the photosensitizer is suboptimal at some tumor loci. The anti-apoptotic protein Bcl-2 is a known target for PDT, and we previously described the ability of Bcl-2 antagonists to promote photokilling at low PDT doses (1). PDT can also lead to enhanced autophagy, a survival process that can offer protection from photodamage, resulting in a “shoulder” on the dose–response curve (2). In this study, we examined the role of H2O2 formed during PDT as a factor in the net phototoxic response. These studies were carried out in P388 murine leukemia cells, using the photosensitizer termed “benzoporphyrin derivative” (BPD). BPD is readily available and is known to catalyze an apoptotic response (3) to PDT.
During the photodynamic process, a variety of ROS is produced including 1O2, H2O2 and •OH (4). This study was designed to explore the role of H2O2 in the phototoxicity of PDT. To this end, we used two procedures to modulate intracellular H2O2 levels during the irradiation of photosensitized cells. Both involve altering the level of intracellular catalase activity. This enzyme is involved in a major detoxification pathway for H2O2, catalyzing conversion of this ROS to O2 + H2O. Catalase activity can be significantly inhibited by the irreversible antagonist 3-amino-1,2,4-triazole (3-AT). An exogenous cell-permeable catalase derivative was used to promote H2O2 degradation. For this purpose, we used the enzyme analog termed CAT-skl that efficiently traffics to the peroxisome, where catalase activity normally resides (5–7). An estimate of the intracellular H2O2 concentration was provided by the fluorescent probe dihydrorhodamine (DHR) (8,9), a product that is converted to a fluorescent analog upon oxidation by H2O2. Other analytical procedures were used to monitor catalase concentrations and activity, phototoxicity and apoptosis, a common death mode after PDT.
A reaction between H2O2 and ferrous iron results in the formation of a much more reactive ROS species: hydroxyl radical (•OH). This reaction was first described by Fenton (10):
To examine the effect of decreased conversion of H2O2 to •OH, we used 2,2′-bipyridyl (BIP), a product that can chelate Fe+2 (11) and thereby prevent formation of •OH via the Fenton reaction.
MATERIALS AND METHODS
Reagents
BPD was purchased from VWR. Stock solutions (10 mm) were prepared in dimethyl formamide and stored at 4°C in the dark. Amino acids, tissue culture media and chemicals were provided by Sigma-Aldrich (St. Louis, MO); sterile horse serum by Atlanta Biologicals (Laurenceville, GA); DHR and DEVD-R110 by Invitrogen (Molecular Probes; Eugene, OR). Recombinant CAT-skl was prepared as described before (5,12).
Cell culture
Murine leukemia P388 cells were grown in sealed flasks filled to <30% of their capacity. The growth medium used was a modification of the ±-MEM formulation (2), supplemented with 10% horse serum, 1 mm glutamine and 1 mm mercaptoethanol. For the experiments described here, exponentially-growing cells (7 mg mL−1, 3.5 × 10⁶ mL−1) were incubated in growth medium with 25 mm HEPES buffer pH 7.4 replacing NaHCO3. This modified medium, termed FHS, permits maintenance of a near-neutral pH at high cell densities.
Photodynamic therapy
Cell suspensions were incubated for 30 min at 37°C with 2 µm BPD. After this loading incubation, the cells were washed, resuspended in fresh medium at 15°C and irradiated. The light source was a 600 W quartz-halogen lamp with IR radiation attenuated by a 10 cm layer of water. The wavelength of irradiation was limited to 690 ± 10 nm by an interference filter (Oriel, Stratford, CT). CAT-skl or 3-AT was present during this loading incubation, if specified.
Survival measurements
Clonogenic assays were used to determine PDT efficacy. Cells were photosensitized as described above, then irradiated (20–200 mJ cm−2). Serial dilutions of the suspensions were then plated on soft agar in triplicate. After a 7- to 9-day growth interval, colonies were counted and compared with untreated controls. The plating efficiency of control (untreated) cell cultures was ~70%.
BPD transport
Cells were incubated with a 2 µm concentration of BPD for 30 min at 37°C, then collected by centrifugation. Samples of both the supernatant fluid and the cell pellet were dispersed in a 10 mm solution of the nonionic detergent Triton X-100 and the resulting fluorescence (695–700 nm) was determined upon excitation at 400 nm. The distribution ratio (BPD concentration in cells/medium) was then calculated. Effects of concurrent treatment with 3-AT, BIP or CAT-skl were similarly assessed.
BPD localization
Cells were examined by fluorescence microscopy after incubation with 2 µm BPD for 30 min at 37°C using 400 ± 20 nm excitation and assessing fluorescence at wavelengths >650 nm. Where specified, 3-AT (30 mm) or CAT-skl (1000 U) was also present.
Fluorescence microscopy
Fluorescence images were acquired using a Nikon Eclipse E600 microscope and a CoolSnap HQ CCD camera (Photometrics, Tucson, AZ). Images were subsequently processed using MetaMorph software (Universal Imaging, Downington, PA). A Uniblitz shutter was used to control exposure of the stage to the excitation source. This was designed to open and close with the camera shutter, thereby minimizing photobleaching of samples. For photographs shown in Fig. 2, a stack of 20 images was acquired using a Prior ProScan Z-drive. These were subject to 3-D deconvolution using AutoQuant Deblur software (Media Cybernetics Inc., Bethesda, MD).
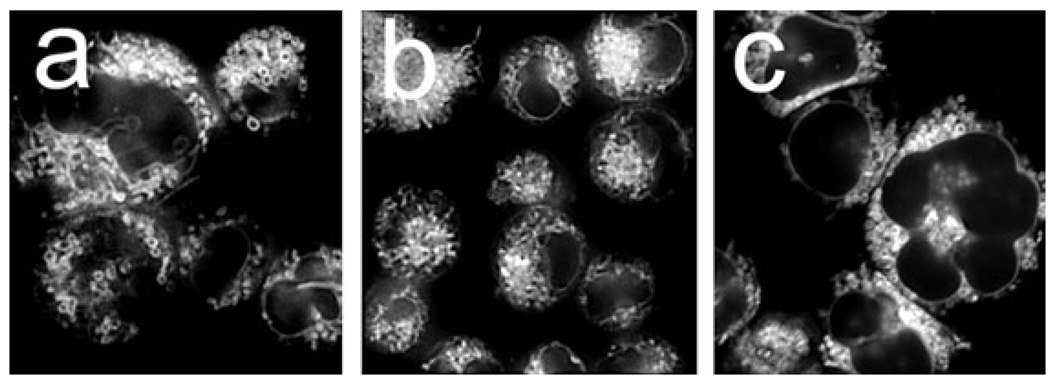
Figure 2.
Fluorescence microscopy demonstrating the localization of benzoporphyrin derivative (BPD) in P388 cells. Cells were incubated with a 2 µm concentration of the sensitizer for 30 min at 37°C and images acquired as described in the text. a = BPD alone; b = BPD + 30 mm 3-AT; c = BPD + 1000 U CAT-skl.
Chromatin labeling
To assess apoptotic (condensed) chromatin in cell nuclei (1,2), P388 cells were incubated with 1 µm HO33342 (HO342) for 5 min at 37°C, washed once and examined by fluorescence microscopy using 360–390 nm excitation. The system was configured to detect fluorescence at 400–450 nm.
Fluorimetric detection of H2O2 in cell culture
P388 cell suspensions (2 × 10⁶ cells mL−1) were incubated for 30 min at 37°C with 2 µm BPD + 5 µm DHR along with specified additions: 3-AT (30 mm), 1000 U of pure recombinant CAT-skl (provided as a solution containing 148 000 U mg−1 protein) or 2 µm BIP. The cells were then resuspended in fresh medium, adding back 3-AT, CAT-skl or BIP if these were initially present, then irradiated at 20°C (690 ± 10 nm, 100 mJ cm−2). Fluorescence of the DHR oxidation product was measured using a multi-channel analyzer using 490 nm excitation and recording the fluorescence emission at the optimum (525 ± 3 nm).
The fluorogenic interaction between H2O2 and DHR could also be measured in real time during irradiation using an SLM 48000 series fluorometer modified by ISS (Champaign, IL). Cell cultures were prepared as outlined above, then resuspended in 3 mL of fresh medium in 1 × 1 × 3 cm glass cuvettes. The temperature was maintained at 20°C by a Peltier system and the contents were gently stirred throughout. Irradiation was carried out using light from a 690 nm diode laser (1 mW cm−2) directed at the top surface of the cuvette via a 400 μ fiber, using a GRIN (graded-index) lens to focus the beam to a 0.9 cm diameter circle. Fluorescence emission from oxidized DHR (525 nm) was monitored using 490 mn excitation with 2 nm slit widths for both excitation and emission monochromators. The “slow kinetic” mode was used for data acquisition with data points collected every 4 for 180 s. The influence of the 690 nm irradiating light on the emission photomultiplier detector was minimized by insertion of a 550 nm low-pass filter into the emission beam.
DEVDase assays
Cells were incubated as outlined above, irradiated as specified, then lysed in 100 µL of buffer containing 50 mm Tris pH 7.2, 0.03% Nonidet P-40 and 1 mm DTT. The lysates were briefly sonicated and the debris removed by centrifugation at 10 000 g for 1 min. The supernatant fluid (50 µL) was mixed with 40 µm DEVD-R110, 10 mm HEPES pH 7.5, 50 mm NaCl and 2.5 mm DTT in a total volume of 100 µL. The rate of an increase in fluorescence emission, resulting from the release of rhodamine-110 from the fluorogenic substrate (13), was measured for more than 30 min at room temperature with a fluorescence plate reader. DEVDase activity is reported in terms of nmol product min−1 mg−1 protein. Control determinations were made on extracts of untreated cells. Each assay was performed in triplicate. The Lowry method was used to determine protein concentrations.
Catalase activity
Catalase activity can be monitored by spectrophotometry. Activity is defined in terms of conversion of H2O2 to H2O + O2, a reaction that results in the loss of H2O2 absorbance at 240 nm. One unit of catalase is defined as the amount needed to convert 1.0 mol of H2O2 to O2 + H2O per minute at pH 7.0 and 23°C. In our initial studies, cell extracts (40 µL) were added to quartz cuvettes containing 3 mL of 50 mm phosphate buffer pH7 and 20 mm H2O2. The initial optical density was ~0.5. Loss of absorbance was then determined over 30 s intervals. Accurate timing can be difficult, so we later adopted a different assay procedure. This measures the loss of H2O2 as a result of catalase activity by assessing the absorbance of a yellow complex formed upon the reaction between peroxide and acidified titanium sulfate (14,15). A mixture of H2O2 + cell lysate is incubated for 30 min at room temperature. A solution of TiOSO4 in 1 N H2SO4 is then added, with the optical density at 405 nm determined after 15 min.
Western blots
Conversion of pro-caspase-3 to the active form, along with the ability of CAT-skl to enhance the catalase level in cells was assessed via Western blots. After specified treatments, cells were lysed in SDS-PAGE buffer, and the lysate heated to 100°C for 5 min. Aliquots containing 40 g of protein per well were used for Western blot analyses as described previously (2). Anti- mouse/human antibodies to caspase-3 and catalase were obtained from BD-Pharmingen (San Jose, CA). Actin analysis was carried out to insure equal loading of proteins. Western blot densitometry was performed using Metamorph software (Molecular Devices, Downington, PA). The total region was analyzed and a mean gray-scale value ± SD was determined (white = 0, black = 255).
RESULTS
PDT dose–response information
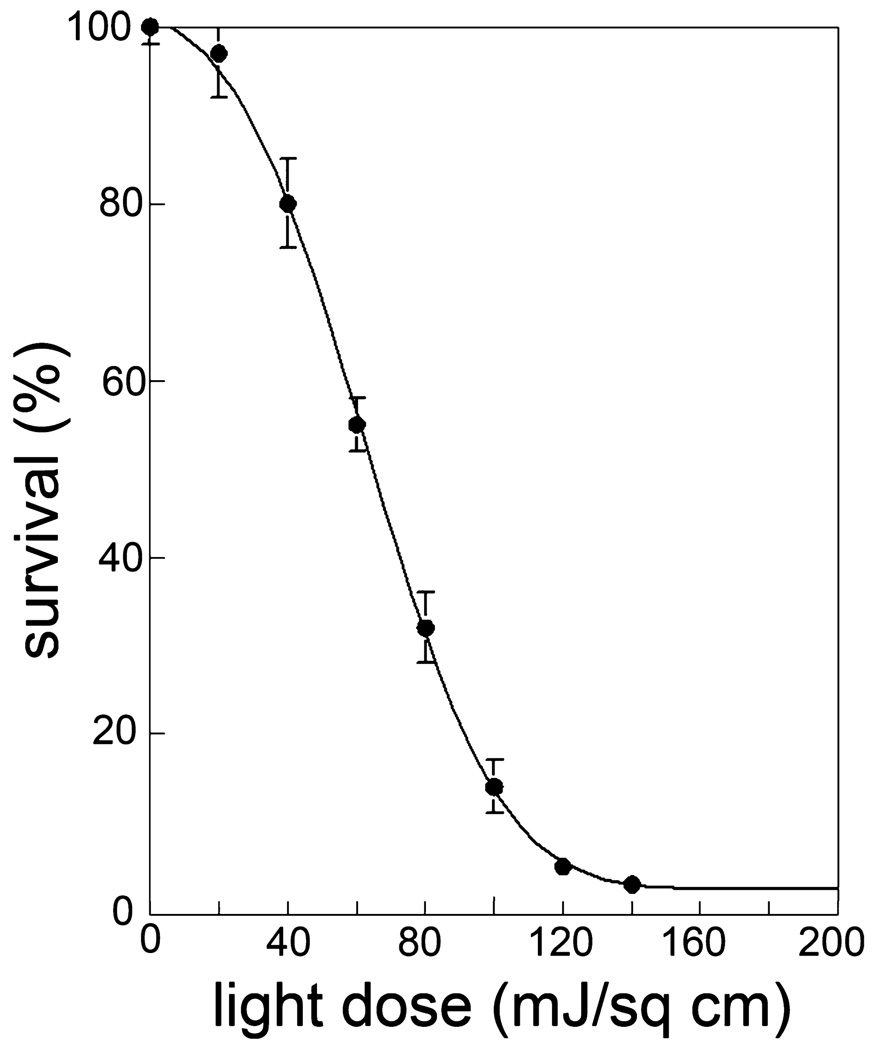
The effect of varying the light dose on BPD-induced cytotoxicity, as assessed by clonogenic studies, is shown in Fig. 1. This study demonstrates the fairly steep dose–response curve typical of PDT. This figure indicates a 50% loss of viability at a light dose of ~60 mJ cm−2. Effects of selected additions are shown in Table 1.
Figure 1.
P388 cells were photosensitized with benzoporphyrin derivative (2 µm) and irradiated at varying light doses. Viability was determined by clonogenic assays.
Table 1.
Effects of CAT-skl and 3-AT on PDT-induced effects.
| Controls* | Irradiated cells† | ||||||
|---|---|---|---|---|---|---|---|
| Assay | +3-AT | +CAT-skl | +3-AT | +CAT-skl | +BIP | ||
| DEVDase | 0.3 ± 0.1‡ | 0.4 ± 0.07 | 0.3 ± 0.09 | 5.1 ± 1.2 | 7.6 ± 1.3 | 3.9 ± 1.3 | 4.5 ± 0.9 |
| Catalase | 6.23 ± 0.42§ | 0.93 ± 0.12 | 26.2 ± 1.3 | 6.12 ± 0.62 | 0.99 ± 0.17 | 24.4 ± 0.84 | 5.8 ± 0.4 |
| DHR | < 100‖ | < 100 | < 100 | 953 ± 25 | 2053 ± 41 | 356 ± 14 | 901 ± 34 |
| LD50 | 61 ± 3¶ | 47 ± 2 | 72 ± 3 | 66 ± 4 | |||
Data indicate mean ± SD for three determinations. 3-AT = 3-amino-1,2,4-triazole; PDT = photodynamic therapy; BIP = 2,2′-bipyridyl.
Cells were incubated for 30 min with no additions or in the presence of 30 mM 3-AT or 1000 U of CAT-SKL.
Cells were incubated with 2 µM BPD plus specified additions (30 mM 3-AT, 1000 U of CAT-SKL or 2 µM BIP) for 30 min, then irradiated using an LD90 PDT dose.
nmol product min−1 mg−1 protein.
µmol H2O2 metabolized min−1 mg−1 protein.
Fluorescence units using a CCD detector to acquire a complete emission spectrum in 2 s.
Light dose (mJ cm−2) required to result in a 50% decrease in viability.
BPD transport
Incubation of cells with a 2 µm concentration of the photo-sensitizer BPD resulted in a drug distribution ratio of 21.4 ± 1.5 (three determinations). This was not significantly affected by the presence of 3-AT, BIP or CAT-skl at concentrations specified in the legend to Table 1.
BPD localization
The pattern of BPD localization suggests affinity for mitochondria > ER. This result is consistent with data shown in a previously published report (16). This pattern was not altered when cells were incubated with BPD + 3-AT or CAT-skl (Fig. 2) or BIP (data not shown).
Effects of 3-AT and CAT-skl in the dark
While 3-AT and CAT-skl had significant effects on catalase activity in control cells, neither induced activation of DEVDase. The multichannel analyzer could not detect a significant change in levels of H2O2 in cells that were not photosensitized and irradiated (Table 1, columns 2–4) as indicated by the lack of a significant DHR oxidation to a fluorescent product.
Catalase modulation and PDT-induced effects
Using an LD90 PDT dose, we found that there was a significant degree of DEVDase activation 30 min after irradiation of photosensitized cells. This effect was enhanced by 3-AT and impaired with CAT-skl. The overall level of catalase activity was not significantly altered by the photodynamic process. The presence of the ferrous iron chelating agent BID resulted in a decrease in the level of DEVDase activity and in the LD50 light dose, suggesting a role for •OH, derived from H2O2 in the overall pro-apoptotic effect of PDT (Table 1).
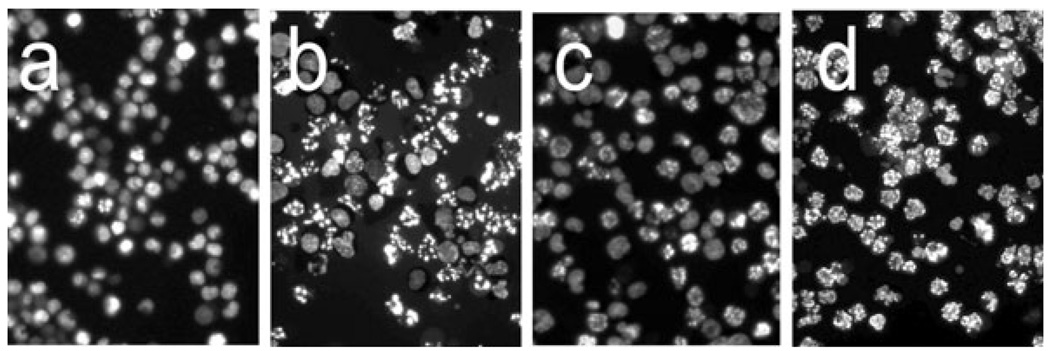
In agreement with the DEVDase values shown in Table 1, addition of CAT-skl decreased numbers of apoptotic nuclei observed 60 min after irradiation, while addition of 3AT had the opposite effect (Fig. 3).
Figure 3.
Effects of photodynamic therapy (PDT) on P388 chromatin as indicated by HO342 labeling using fluorescence microscopy. a = control (untreated) cells; b–d = cells 60 min after receiving an LD90 PDT dose; c = 1000 U of CAT-skl present; d = 30 mm 3-AT added as specified in the text.
Numbers of apoptotic nuclei determined in three such fields indicated >1% in untreated cells, 58 ± 4% in cultures after PDT, 31 ± 5% in cells treated with PDT in the presence of CAT-skl and 88 ± 3% in cells treated with PDT + 3-AT. These differences were found to be significant differences using the t-test (P < 0.01). Consistent with the DEVDase activity changes, CAT-skl offered protection from photokilling, while 3-AT had the opposite effect (Table 1).
An increase in DEVDase activity is expected to be accompanied by conversion of procaspase-3 to the active form. Western blots (Fig. 4) confirm this assumption. Using LD50 and LD90 PDT doses, we found that 3-AT increased the conversion of procaspase-3 (32 kDa) to the active form (17 kDa). Morphometric analysis indicated an increase in the mean density of the caspase-3 blots: controls, 5 ± 2; PDT 60 mJ cm−2, 43 ± 12; PDT + 3-AT, 109 ± 8; PDT 100 mJ cm−2, 67 ± 4; PDT+3-AT, 150 ± 7.
Figure 4.
Activation of caspase-3 as indicated by Western blots using extracts of cells obtained 30 min after irradiation. A, controls (no light); B–E, cells treated with 2 µm BPD and irradiated (60 mJ cm−2: B,C; or 100 mJ cm−2: D,E). 3-AT is present in (C) and (E).
Intracellular catalase activity enhanced by CAT-skl
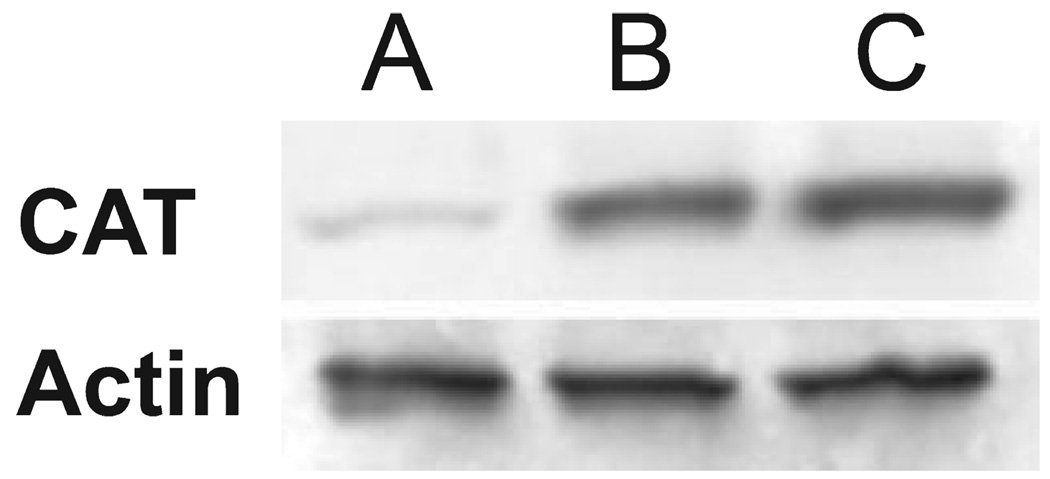
To confirm that treatment of P388 cells with 1000 U of CAT-skl did indeed lead to an increase in the intracellular level of catalase protein, we carried out a Western blot analysis (Fig. 5). A substantial increase in intracellular catalase was observed, and there was only a slight change when the incubation time was prolonged from 30 to 60 min. Densitometry readings for the Western blots indicated gray-scale values of 31 ± 6 (control cells), 134 ± 12 (30 min exposure to CAT-skl) and 151 ± 8 (60 min exposure).
Figure 5.
Western blots for catalase showing control levels (A) and enhanced intracellular levels of the protein after treatment of P388 cells with CAT-skl (1000 U/ 5 mg of cells) for 30 min (B) or 60 min (C) at 37°C.
Detection of H2O2 in cell cultures
Exposure of DHR to H2O2 results in conversion of this probe to a fluorescent product, a reaction that is greatly enhanced in the presence of peroxidases (17). The system used was not sufficiently sensitive to detect H2O2 formation in P388 cells in the absence of PDT, but could readily detect fluorescence produced directly after irradiation (Table 1). The fluorogenic reaction was enhanced by the presence of 3-AT and decreased when CAT-skl was used to enhance the catalase concentration. BIP did not have a statistically significant effect. These data were obtained using a multichannel analyzer and CCD device, permitting acquisition of fluorescence emission spectra averaged over 2 s. Fluorescence at the emission maximum (525 nm) was recorded.
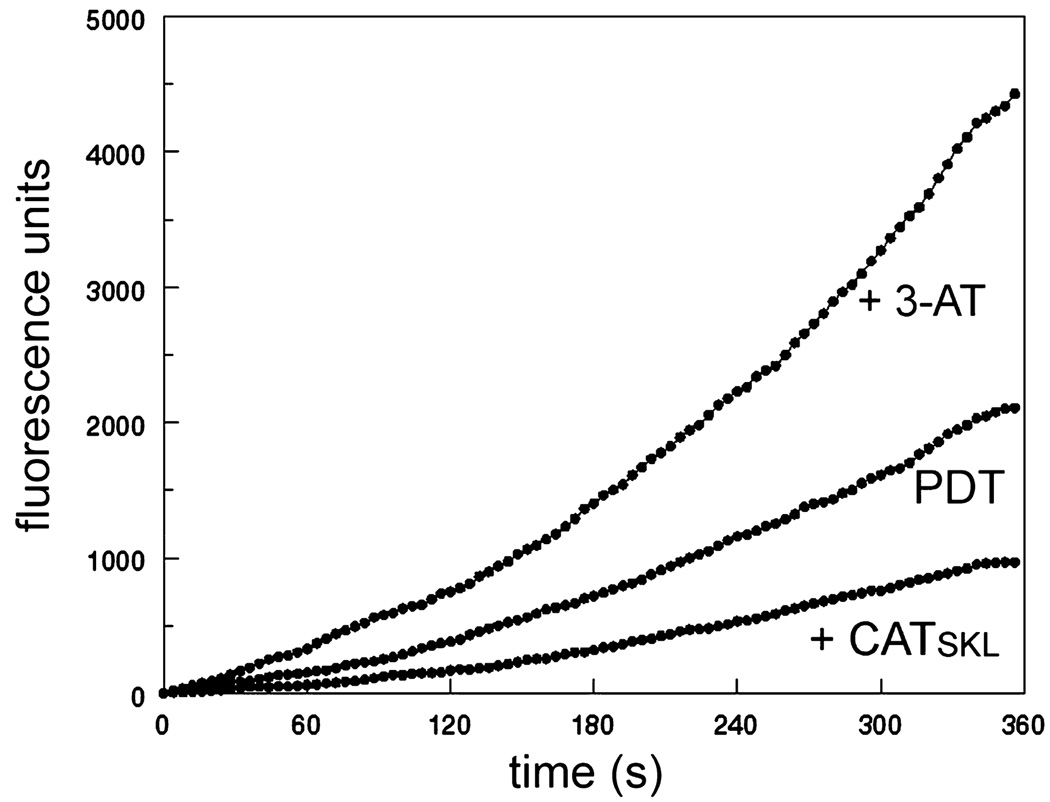
Using a different detection system we monitored the fluorogenic effect of PDT on DHR oxidation. Data shown in Fig. 6 were obtained during the irradiation of photosensitized cell cultures, showing the effects of prior treatment with 3-AT or CAT-skl. The fluorogenic reaction was enhanced by treatment with 3-AT and impaired after exposure of cells to CAT-skl. Data were acquired as a function of time, using a photomultiplier detector in the single-photon mode. Excitation = 490 nm; emission was monitored at 525 nm every 4 s using 0.3 s time interval for each data point.
Figure 6.
Fluorescence of P388 cells loaded with 1 µm DHR + 2 µm BPD (with 30 mm 3-AT or 1000 U of CAT-skl present where specified) and irradiated at 690 nm for 360 s. During this time, the fluorescence signal from oxidized DHR at 525 nm was acquired using 490 nm excitation with a steady-state fluorometer. These curves represent data for a typical experiment. Essentially the same patterns were obtained during two repetitions of this study.
Statistical considerations
Analysis using the independent groups t-test indicated that differences in values shown in columns 2–4 of Table 1 were statistically different (P < 0.01) for all values analyzed. This was also true for data shown in Table 1 with the exception of the comparison between controls and cells treated with BIP. Chelation of Fe+ + appears to offer a consistent protection from PDT-induced phototoxicity and appearance of DEVDase activity, but the differences do not reach the 90% confidence level.
DISCUSSION
The dose–response curve for BDP-PDT (Fig. 1) demonstrates that a small increase in the light dose can result in a substantial increase in phototoxicity. From these data, we conclude that even an apparently minor increase in PDT efficacy can therefore lead to an amplified effect on tumor eradication. This study was designed to assess the role of alterations in H2O2 formation during PDT as a factor in the pro-apoptotic response to PDT.
Apoptosis is considered to be an irreversible process leading to cell death, and has been shown to be a predominant form of direct cell kill after PDT (18). 1O2 is widely assumed to be the initial toxic ROS produced during PDT. A recent report (19), using only a photosensitizer + cytochrome c, indicated that there were oxidation products that could not be explained by the action of 1O2 alone. While a solution containing a photosensitizer and a protein may not accurately mimic the conditions that occur in cells or tissues, results reported in this study indicate that even in a simple system, multiple ROS can be detected. Kochevar et al., using HL-60 cells, reported that altering the irradiation conditions, so that the photosensitizer rose bengal produced either 1O2 or radical species, resulted in apoptosis only under the former conditions (20). Assuming that this phenomenon is also pertinent to the cell line and photosensitizing agent used here, it appears that radical-initiated photodamage alone may be insufficient to induce apoptosis, but might amplify the phototoxic effect(s) of 1O2.
Figure 3 demonstrates that the apoptotic response to PDT, as indicated by the appearance of condensed chromatin in cell nuclei, is enhanced by the action of 3-AT and decreased when the intracellular concentration of catalase is enhanced. Changes in the apoptotic response were reflected in the conversion of procaspase-3 to the active form (Fig. 4). Additional studies were carried out with BIP, a reagent that chelates Fe+2 and is therefore expected to antagonize formation of •OH via the Fenton reaction. These data are summarized in Table 1.
The ability of the CAT-skl preparation to augment the cellular level of catalase is demonstrated by studies involving Western blot densitometry. In the context of these studies, it is important to consider that CAT-skl was specifically designed as an exogenous source of catalase activity that would migrate to the peroxisome where this enzyme is normally found (5–7). Use of unmodified catalase could result in the appearance of enzyme activity in the cytosol where it is normally not found, with possible effects on signaling pathways or other unexpected phenomena.
Using the fluorescent probe DHR, we were able to obtain an estimate of H2O2 formation during irradiation of photosensitized P388 cells (Fig. 5). As expected, the increase in fluorescence intensity was impaired by the presence of CAT-skl and enhanced in cells previously treated with 3-AT. The fluorescence values shown in Fig. 5 were measured in a photomultiplier-based fluorometer that permits data accrual at a single wavelength, while results shown in Table 1 were obtained with a multichannel analyzer and a CCD device. The numerical values are therefore different.
In these studies, we observed no significant alteration in the level of catalase activity when photosensitized cells were irradiated. This differs from results reported by Luo et al. (21) who observed a significant decrease when keratinocytes were treated with Photofrin and then irradiated. This result could be attributed to the fact that Photofrin is a complex mixture of porphyrin monomers, dimers and higher oligomers that may localize quite differently than BPD.
It has been reported that H2O2 can promote autophagy (22) via oxidation of an amino acid on one of the proteins involved in the autophagic process. As autophagy is expected to protect cells from low-dose PDT (2), enhanced autophagy resulting from H2O2 formation might have been expected to decrease overall PDT efficacy, although results shown in Table 1 indicate otherwise. Further studies using cell lines lacking the capacity for autophagy will be needed to provide information on the potential role of H2O2-induced autophagy in the overall phototoxic effect.
What conclusions can be drawn from these studies? Verma et al. proposed some new strategies for the promotion of PDT effects (23). One of these involves combination therapies with a view toward increasing susceptibility of cells to PDT. We had previously shown that concurrent treatment with PDT + Bcl-2 antagonists resulted in enhanced photokilling (1). The present study suggests that, in addition to the well-established effects of 1O2 on such critical targets as anti-apoptotic Bcl-2 family proteins (24,25) and on lysosomes (26), H2O2 formed during PDT may also play a role in photokilling. As indicated by Fig. 1, any phenomenon that produces even a minor promotion in PDT efficacy can have a marked effect on tumor eradication.
Acknowledgements
We thank Ann Marie Santiago for excellent technical assistance during the preparation of this manuscript. This work was supported by grant CA 23378 from the National Cancer Institute, NIH. Michael Price is partially supported by grant GM058905-11 from the NIH.
REFERENCES
- 1.Kessel D. Promotion of PDT efficacy by a Bcl-2 antagonist. Photochem. Photobiol. 2008;84:809–814. doi: 10.1111/j.1751-1097.2007.00267.x. [DOI] [PMC free article] [PubMed] [Google Scholar]
- 2.Kessel D, Arroyo AS. Apoptotic and autophagic responses to Bcl-2 inhibition and photodamage. Photochem. Photobiol. Sci. 2007;6:1290–1295. doi: 10.1039/b707953b. [DOI] [PMC free article] [PubMed] [Google Scholar]
- 3.Granville DJ, Levy JG, Hunt DW. Photodynamic therapy induces caspase-3 activation in HL-60 cells. Cell Death Differ. 1997;4:623–628. doi: 10.1038/sj.cdd.4400286. [DOI] [PubMed] [Google Scholar]
- 4.Girotti AW. Lipid hydroperoxide generation, turnover, and effector action in biological systems. J. Lipid Res. 1998;39:1529–1542. [PubMed] [Google Scholar]
- 5.Koepke JI, Nakrieko KA, Wood CS, Boucher KK, Terlecky JL, Walton PA, Terlecky SR. Restoration of peroxisomal catalase import in a model of human cellular aging. Traffic. 2007;8:1590–1600. doi: 10.1111/j.1600-0854.2007.00633.x. [DOI] [PubMed] [Google Scholar]
- 6.Terlecky SR, Koepke JI. Drug delivery to peroxisomes: Employing unique trafficking mechanisms to target protein therapeutics. Adv. Drug Deliv. Rev. 2007;59:739–747. doi: 10.1016/j.addr.2007.06.005. [DOI] [PubMed] [Google Scholar]
- 7.Terlecky SR, Koepke JI, Walton PA. Peroxisomes and aging. Biochim. Biophys. Acta. 2006;1763:1749–1754. doi: 10.1016/j.bbamcr.2006.08.017. [DOI] [PMC free article] [PubMed] [Google Scholar]
- 8.Qin Y, Lu M, Gong X. Dihydrorhodamine 123 superior to 2,7-dichlorodihydrofluorescein diacetate and dihydrorhodamine 6G in detecting intracellular hydrogen peroxide tumor cells. Cell Biol. Int. 2008;32:224–228. doi: 10.1016/j.cellbi.2007.08.028. [DOI] [PubMed] [Google Scholar]
- 9.Crow JP. Dichlorodihydrofluorescein and dihydrorhodamine 123 are sensitive indicators of oxynitrite in vitro: Implications for intracellular measurement of reactive nitrogen and oxygen species. Nitric Oxide. 1997;1:145–157. doi: 10.1006/niox.1996.0113. [DOI] [PubMed] [Google Scholar]
- 10.Fenton HJH. Oxidation of tartaric acid in presence iron. J. Chem. Soc. Trans. 1984;65:899–911. [Google Scholar]
- 11.Breuer W, Epsztejn S, Cabantchik ZI. Iron acquired from transferrin by K562 cells is delivered into a cytoplasmic pool of chelatable iron(II) J. Biol. Chem. 1995;270:24209–24215. doi: 10.1074/jbc.270.41.24209. [DOI] [PubMed] [Google Scholar]
- 12.Young CN, Koepke JI, Terlecky LJ, Borkin MS, Boyd SL, Terlecky SR. Reactive oxygen species tumor necrosis factor-alpha-activated primary human keratinocytes: Implications for psoriasis and inflammatory skin disease. J. Invest. Dermatol. 2008;128:2606–2614. doi: 10.1038/jid.2008.122. [DOI] [PMC free article] [PubMed] [Google Scholar]
- 13.Cai SX, Zhang H, Guastella J, Drewe J, Yang W, Weber E. Design and synthesis of rhodamine 110 derivative and caspase-3 substrate for enzyme and cell-based fluorescent assay. Bioorg. Med. Chem. Lett. 2001;11:39–42. doi: 10.1016/s0960-894x(00)00590-4. [DOI] [PubMed] [Google Scholar]
- 14.Storrie B, Madden EA. Isolation of subcellular organelles. Meth. Enzymol. 1990;182:203–225. doi: 10.1016/0076-6879(90)82018-w. [DOI] [PubMed] [Google Scholar]
- 15.Fujimoto S. Studies on estimation of catalase activity by the use of titanium sulfate. Cancer Res. 1965;25:534–538. [PubMed] [Google Scholar]
- 16.Runnels JM, Chen N, Ortel B, Kato D, Hasan T. BPD-MA-mediated photosensitization in vitro and in vivo: Cellular adhesion and β1 integrin expression in ovarian cancer cells. Br. J. Cancer. 1999;80:946–953. doi: 10.1038/sj.bjc.6690448. [DOI] [PMC free article] [PubMed] [Google Scholar]
- 17.Henderson LM, Chappell JB. Dihydrorhodamine 123: A fluorescent probe for superoxide generation? Eur. J. Biochem. 1993;217:973–980. doi: 10.1111/j.1432-1033.1993.tb18328.x. [DOI] [PubMed] [Google Scholar]
- 18.Oleinick NL, Morris RL, Belichenko I. The role of apoptosis in response to photodynamic therapy: What, where, why, and how. Photochem. Photobiol. Sci. 2002;1:1–21. doi: 10.1039/b108586g. [DOI] [PubMed] [Google Scholar]
- 19.Kim J, Rodriguez ME, Guo M, Kenney ME, Oleinick NL, Anderson VE. Oxidative modification of cytochrome c by singlet oxygen. Free Radic. Biol. Med. 2008;44:1700–1711. doi: 10.1016/j.freeradbiomed.2007.12.031. [DOI] [PMC free article] [PubMed] [Google Scholar]
- 20.Kochevar IE, Lynch MC, Zhuang S, Lambert CR. Singlet oxygen, but not oxidizing radicals, induces apoptosis in HL-60 cells. Photochem. Photobiol. 2000;72:548–553. doi: 10.1562/0031-8655(2000)072<0548:sobnor>2.0.co;2. [DOI] [PubMed] [Google Scholar]
- 21.Luo J, Li L, Zhang Y, Spitz DR, Buettner GR, Oberley LW, Domann FE. Inactivation of primary antioxidant enzymes in mouse keratinocytes by photodynamically generated singlet oxygen. Antioxid. Redox Signal. 2006;8:1307–1314. doi: 10.1089/ars.2006.8.1307. [DOI] [PubMed] [Google Scholar]
- 22.Scherz-Shouval R, Shvets E, Elazar Z. Oxidation as a post-translational modification that regulates autophagy. Autophagy. 2007;3:371–373. doi: 10.4161/auto.4214. [DOI] [PubMed] [Google Scholar]
- 23.Verma S, Watt GM, Mai Z, Hasan T. Strategies for enhanced photodynamic therapy effects. Photochem. Photobiol. 2007;83:996–1006. doi: 10.1111/j.1751-1097.2007.00166.x. [DOI] [PubMed] [Google Scholar]
- 24.Kim HR, Luo Y, Li G, Kessel D. Enhanced apoptotic response to photodynamic therapy after bcl-2 transfection. Cancer Res. 1999;59:3429–3432. [PMC free article] [PubMed] [Google Scholar]
- 25.Xue LY, Chiu SM, Oleinick NL. Photochemical destruction of the Bcl-2 oncoprotein during photodynamic therapy with the phthalocyanine photosensitizer Pc 4. Oncogene. 2001;20:3420–3427. doi: 10.1038/sj.onc.1204441. [DOI] [PubMed] [Google Scholar]
- 26.Reiners JJ, Jr, Caruso JA, Mathieu P, Chelladurai B, Yin XM, Kessel D. Release of cytochrome c and activation of pro-caspase-9 following lysosomal photodamage involves Bid cleavage. Cell Death Differ. 2002;9:934–944. doi: 10.1038/sj.cdd.4401048. [DOI] [PMC free article] [PubMed] [Google Scholar]


