

Abstract
Pre-mRNA splicing is catalyzed by a large ribonucleoprotein complex called the spliceosome. Previous electron microscopy reconstruction of C complex spliceosomes arrested between the chemical two steps of splicing revealed an averaged core structure consisting of three primary domains surrounding a central cavity. Here we characterize the involvement of pre-mRNA in this structured core of C complex by protection mapping. We find that the end of the cleaved 5′ exon and intron sequences flanking the branched lariat are buried in the complex. Upstream regions of the 5′ exon and the entire 3′ exon, including the mutant 3′ splice site are accessible and can be removed by nucleolytic cleavage. Furthermore, we show that the second step active site of the complex, which is arrested by a 3′ splice site mutation, can accept a normal 3′ splice site in trans to catalyze exon ligation. Removing the accessible exon regions alters the protein composition of the complex, but the core spliceosome proteins associated with the U2, U5, U6 snRNPs, the Prp19 complex as well as several other proteins remain intact. 2D averaged images of the exon-trimmed complex closely resemble the C complex assembled on a full-length pre-mRNA, supporting the hypothesis that the EM model of C complex reflects the core structure of a catalytically competent particle. Trimming the 3′ exon does, however, alter the distribution of particles that appear to be missing some density, suggesting that the exon plays a role in stabilizing C complex.
Keywords: pre-mRNA splicing, spliceosome, electron microscopy, mass spectrometry, C complex
INTRODUCTION
The spliceosome is the large and dynamic macromolecular complex responsible for pre-mRNA splicing, the nuclear process by which introns are removed and exons joined to generate functional mRNAs for protein translation. A significant portion of the spliceosome is made up of RNA in the form of uridine-rich small nuclear RNAs (U snRNAs) U1, U2, U4, U5 and U6. Understanding how the spliceosome positions RNA, both that of its own machinery and the substrate pre-mRNA, is important for delineating the fundamental mechanisms of splicing. The spliceosomal U snRNAs are highly structured and intimately involved in spliceosome assembly and function, participating in both RNA:RNA and RNA:protein interactions 1. However, no evidence has been presented to suggest that the pre-mRNA substrate is highly structured in the context of the spliceosome. Previous studies have shown extensive intermolecular interactions of pre-mRNA with snRNAs and with several proteins in the regions immediately flanking the splice sites and branch site in the catalytic complex 1; 2; 3; 4; 5. No additional interactions with exonic regions farther from these sites have been identified. A likely scenario is that the spliceosome assembles on the splicing consensus sequences, with the intron sequence looped out to bring the branchpoint and 5′ splice site together for the first step of splicing chemistry. The complex must then continue to grasp the free 5′ exon while positioning its 3′ end at the 3′ splice site for exon ligation. There is evidence for two separate active sites and a conformational change of the complex between the two steps of splicing 6; 7, but how that rearrangement impacts the path of the pre-mRNA through the spliceosome is unknown.
Several three-dimensional models of spliceosomes and their U snRNP subunits have been determined by electron microscopy and single particle analysis (reviewed in 8. All these structures exhibit limited resolution, likely due to a combination of conformational and compositional heterogeneity. Stark and colleagues showed evidence for multiple conformations of spliceosome domains in the tri-snRNP and pre-catalytic spliceosomes 9; 10; 11. For C complex spliceosomes, which are arrested between the first and second steps of chemistry, multiple conformations have not yet been described, although evidence for structural flexibility and/or substoichiometric association of several protein components exists. Previous and recent mass spectrometry analyses of C complex protein composition indicate that over 150 proteins are associated with the complex 12; 13. Yet, the combined mass of all these cannot be accommodated in the averaged EM structure, suggesting that only a subset of the associated proteins is ordered in the structure. In addition to proteins that associate with the complex substoichiometricly and are therefore not fully represented in the average structure, we hypothesize that a portion of the apparent “missing mass” correlates with flexible regions of the complex. If these flexible regions are unstructured relative to the core splicing machinery, they also would not be visualized in the averaged EM model. One potential source for flexibility in C complex spliceosomes is the pre-mRNA substrate on which the spliceosome is assembled. We built C complex on a relatively long pre-mRNA substrate (~400 nt) that provides potential binding sites for both splicing specific and non-specific RNA binding proteins. In fact, a large number of proteins in C complex that also associate with the pre-mRNA under conditions that do not support splicing have been identified, suggesting that these proteins do not contribute to the spliceosome 13; 14.
In order to explore the structure of the pre-mRNA in the context of the spliceosome, we mapped the accessible regions of pre-mRNA in C complex. We find that the part of the intron and the majority of exonic sequences are accessible to cleavage. Additionally the mutant 3′ splice site of the substrate is not protected from cleavage, suggesting that it may not be located in the active site of the complex. Consistent with these observations we find that our C complexes are capable of splicing to a 3′ exon provided in trans, indicating that the active site is available and competent for exon ligation. Release of the accessible exonic sequences (exon trimming) alters the protein composition of the complex but the U2, U5 and U6 snRNPs and the Prp19 complex proteins remain intact. EM image analysis shows that exon trimming does not significantly change the averaged core structure. This observation supports our hypothesis that much of the pre-mRNA in the complex is unstructured relative to the catalytic core and does not contribute to the averaged EM model. We do find, however, that removal of the 3′ exon enriches for particles missing a significant density domain allowing us to now differentiate between two conformations of C complex. Furthermore, this enrichment suggests that regions of the exon may serve to stabilize part of the C complex structure.
RESULTS
Protection mapping of C complex spliceosomes suggests a path for pre-mRNA
As previously described, we assembled C complex spliceosomes on a derivative of the AdML gene product that harbors an AG->GG mutation at the 3′ splice site along with an extended polypyrimidine tract 13. In an in vitro splicing reaction, this pre-mRNA will go through the first step of chemistry yielding a cleaved 5′ exon and lariat intermediate. However, the second step of splicing, exon ligation, is blocked due to the absence of a functional 3′ splice site, and a stable population of C complex spliceosomes accumulates. In order to gain insight into the structure of the pre-mRNA in blocked C complex spliceosomes, we employed an RNase H digestion assay to map protected and accessible regions of the pre-mRNA 15. RNase H cleaves RNA in DNA/RNA hybrids and, in concert with DNA oligo binding, can be used to probe RNA for stable structure and/or tightly bound proteins 16. Using a series of 15–18 nt DNA oligos that are complementary to sites along the entire length of the pre-mRNA substrate (421 nt, Supplementary Figure 1), we incubated an excess of each oligo individually with C complex spliceosomes assembled in nuclear extract. If a hybrid is formed, endogenous RNase H will cleave the pre-mRNA as evidenced by a decrease in intensity of the pre-mRNA band concomitant with appearance of lower running cleavage products in a denaturing gel (Figure 1). Demonstrating that the oligos we employed are able to stimulate digestion, we observe cleavage at every position of the unspliced pre-mRNA remaining in in vitro splicing reactions with the exceptions of the branch site and its flanking regions (Figure 1a). To confirm that the three oligos targeted to these positions are indeed capable of binding and mediating RNA cleavage, we repeated the protection assays for those oligos using naked pre-mRNA and exogenous RNase H and observe digested RNA (Figure 1b).
Figure 1.

RNase H protection mapping of pre-mRNA in C complex spliceosomes. (a) Denaturing gel of RNA extracted from in vitro splicing reaction. The first lane is from a 60′ reaction time point showing from top to bottom the positions of lariat intermediate, pre-mRNA and 5′ exon, as schematized at the left. Subsequent lanes are from reactions supplemented with DNA oligo targeting the pre-mRNA sequence at positions diagrammed at the top. Oligos 1–9 target the 5′ exon, oligos 10–15 target the intron up to the branch point, oligos 16–19 target the intron downstream of the branch point and lanes and oligos 20–21 target the 3′ exon. Arrowheads indicate the targeted splicing intermediate bands. Note that digestion products arise from both unspliced pre-mRNA and the first step products of splicing. The average percent cleavage efficiency of the targeted 5′ exon or lariat intermediate is graphed above the pre-mRNA schematic. (b) Control RNase H digest with oligos 16–18 using naked pre-mRNA.
Turning our attention to the first step splicing intermediates species (free 5′ exon and lariat intermediate) contained within C complex, we identified unprotected regions primarily by the decrease in band intensity of these species relative to control reactions with no cleavage oligo present (Figure 1a, lane U). Also, when digested within the lariat structure, the lariat intermediate shows a characteristic upward mobility shift in the gel, likely as a result of the Y-shape created by cleavage (Figure 1a, lanes 11–14). Note that often we cannot assess digestion of the splicing intermediates by production of cleavage products, as they co-migrate with some cleavage products derived from unspliced pre-mRNA. For each oligo position we confirmed the digest results by comparing the relative ratio of 5′ exon to lariat intermediate from three to five independent cleavage experiments to derive the average cleavage efficiency. We find that the first ~100 nt of the 5′ exon is largely unprotected (Figure 1a, lanes 1–6). There is an intermediate protection (47% average cleavage) centered 88 nt upstream of the 5′ splice site (Figure 1a, lane 3). We have not determined the identity of the potential RNA binding factor responsible for this protection, but analysis of the sequence with the Human Splicing Finder 17 shows that a consensus SF2/ASF binding site is contained within this region. In contrast to the upstream 5′ exon, the 30 nt region preceding the cleaved 5′ splice site is protected as evidenced by similar band intensity of first step intermediates relative to control reactions (Figure 1a, lanes 7–9) as previously shown 4; 13. Within the lariat intermediate, the central portion of the intron (Figure 1a, lanes 11–14) is unprotected although there is another intermediate protection (59% average cleavage) centered 44 nt upstream of the branchpoint (Figure 1a, lane 14). In contrast, the intron is protected over the 20 nt region downstream of the 5′ splice site (Figure 1a, lane 10), the 35 nt region upstream of the branch point sequence (Figure 1a, lanes 15–16), and a 21 nt region of the polypyrimidine tract directly downstream of the branch point (Figure 1a, lanes 17–18). Finally, the region from 12 nt upstream of the 3′ splice site through the entire 3′ exon (Figure 1a, lanes 19–21) is largely not protected (>75% cleavage). Intriguingly, lack of protection at the 3′ splice site was previously observed in spliceosomes blocked for the second step by heat-inactivating HeLa nuclear extract 18 as well as in S. cerevisiae spliceosomes blocked by Prp16 inactivation 19. When we repeated the protection assays with affinity-purified C complexes using exogenous RNase H, we see the same pattern of protections as with complexes in nuclear extract, with the exception of the protection we see at the polypyrimidine tract downstream of the branch point (T. Quan and M. Jurica, data not shown). The loss of a protection in the purified complexes at the polypyrimidine tract suggests that the spliceosome component(s) associated with that region are not stably bound under the conditions used for purification. Further experiments are necessary to identify this species and the parameters of its association with the polypyrimidine tract in C complex.
We interpret the protection mapping results to mean that the 3′ end of the 5′ exon participate in the spliceosome complex, as previously suggested 4. In that study, it was shown that Prp8, some EJC components and several other unidentified proteins crosslink to the 5′ exon in this region. The regions surrounding the branched structure of the intron including the 5′ end of the intron, which is coupled to the branchpoint adenosine by a 2′-5′ linkage, also appear to be buried in the complex. The source of these protections remains to be explored, although there are a number of likely candidates. Several proteins, including Prp8, p14 and KIAA560 (IBP160), have been crosslinked in the branchpoint region of C complex spliceosomes 2; 20.
We hypothesize that the unprotected portions of the pre-mRNA we observe (the majority of the 5′ exon, a central region of the intron upstream of the branchpoint and the entire 3′ exon) extend from the core complex. This interpretation suggests that boundaries between protected and unprotected regions represent the points where the pre-mRNA enters and exits the spliceosome. The lack of protection at the mutant 3′ splice site may indicate the necessity of a functional AG dinucleotide to bring or hold the 3′ exon in the active site of the spliceosome.
C complex blocked by mutant 3′ splice site is capable of exon ligation
Recently Bessonov et al. reported the composition of C complex spliceosomes assembled on a pre-mRNA lacking a 3′ exon which are catalytically competent for the second step of chemistry when provided with a 3′ exon in trans 12. Considering the similar composition of our C complex blocked by a 3′ splice site mutation 13 and our observation that the mutant 3′ splice site is unprotected and apparently not held tightly in the active site of the spliceosome, we tested whether C complex arrested for a 3′ splice site is also competent for bimolecular exon ligation. After assembling C complex in nuclear extract on a lightly radiolabeled pre-mRNA with a 3′ splice site mutation, we added a second highly radiolabeled RNA to serve as a trans second step substrate. The trans substrate is composed of the same 3′ exon as the pre-mRNA preceded by seven nt which includes a wild type 3′ splice site (CAG) followed by two additional nt (Figure 2a). Upon continued incubation of the reaction, we observe the formation of a band corresponding to the expected length of ligated exons (Figure 2b). We confirmed the identity of the band by gel purification followed by RT-PCR using exon specific primers, which resulted in amplification of a band of the appropriate length for mRNA (Figure 3a). Sequencing the RT-PCR product showed formation of the correct splice junction expected for the bimolecular splicing product, which contains a 3 nt insertion following the splice site relative to the mutant cis substrate (Figure 3b). Surprisingly, the sequencing results also revealed evidence for the production of an additional splice product with a second sequence signal appearing downstream of the splice junction. The sequence of this second mRNA can only be explained by splicing also occurring in cis at the mutant 3′ splice site following the first G of the GG mutation, the mRNA product of which would also be a target for the RT-PCR amplification. To confirm this supposition, we extracted RNA from a splicing reaction containing only the 3′ splice mutant pre-mRNA. Although, we again see no evidence of mRNA product by denaturing gel analysis, the more sensitive RT-PCR assay, using primers to the 5′ and 3′ exons, amplifies a weak mRNA band (Figure 3c). It is likely that cis splicing to the non-canonical splice site is very inefficient, but given the high local concentration of the tethered mutant cis 3′ splice site relative to the freely diffusing WT trans substrate in the biomolecular reaction, it is not surprising that we detect both products. We conclude that although the fidelity of the mutation blocked C complex may be slightly relaxed, the complex is capable of exon ligation.
Figure 2.

Bimolecular exon ligation by C-complex assembled on 3′ splice site mutant pre-mRNA. (a) Schematic of the bimolecular assay testing ligation of a trans second step substrate containing a wild type 3′ splice site. (b) Denaturing gel analysis of RNA extracted from in vitro splicing reactions using wild type (WT) pre-mRNA or 3′ splice site mutant pre-mRNA (MUT) at time points indicated. Schematized at the left are, from top to bottom, lariat intermediate, lariat intron, pre-mRNA, mRNA, 5′ exon, debranched intron and trans second step substrate. The plus sign (+) indicates reactions in which the trans second step substrate was added following the 30′ time point. To the far right is a longer exposure of the indicated lanes. The arrow indicates the mRNA ligation product. The asterisk denotes an exonucleolytic “chew back” product of the lariat intermediate.
Figure 3.
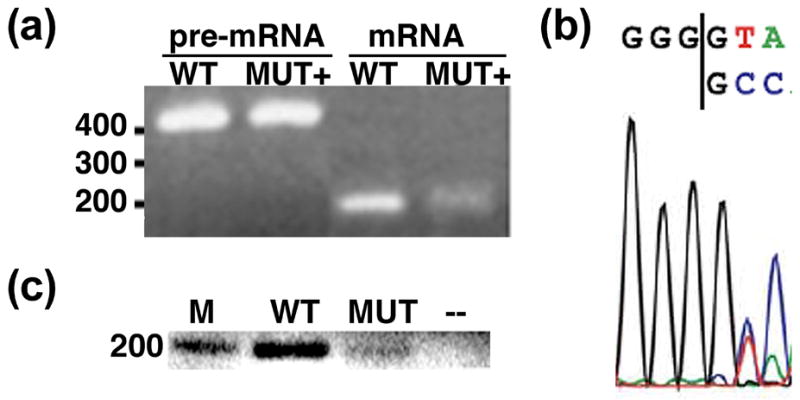
(a) Agarose gel analysis of RT-PCR reactions using 5′ and 3′ exon primers and RNA extracted from the indicated bands of the denaturing gel shown in Figure 2 as template. The positions of molecular weight markers are indicated on the left. (b) Sequencing read of the mRNA RT-PCR product at the exon junction. (c) Agarose gel analysis of RT-PCR reactions using RNA extracted from a splicing reaction containing a WT pre-mRNA substrate (WT), a 3′ splice site mutant pre-mRNA substrate (MUT) or no pre-mRNA substrate (--). Again, primers were directed to the 5′ and 3′ exons. M indicates a marker lane.
Extended exon sequences are tethered to the spliceosome through RNA
To explore the hypothesis that the unprotected regions of the exons are not integral to the structured core of C complex spliceosomes, we tested whether the exons remain associated with purified C complex following oligo-mediated RNase H cleavage near the protection boundaries. For the 5′ exon intermediate, we cleaved with an oligo centered at −54 nt upstream of the 5′ splice site resulting in two digestion products, a longer 5′ fragment and a shorter 3′ fragment. Following purification of the complex via an MS2-affinity tag located in the intron, we observe that the shorter downstream fragment is retained in the complex (Figure 4a). The upstream region of the 5′ exon is lost during the purification, indicating that its association with the complex is primarily mediated through the RNA and not through stable protein/RNA or RNA/RNA interactions. Cleavage with an oligo centered at the 3′ splice site results in a small downward shift in migration of the lariat intermediate (Figure 4a). Interestingly, the migration of this cleavage product resembles a 3′–5′ exonucleolytic decay product often detected with this splicing substrate 21. This observation further supports our hypothesis that the 3′ exon is accessible, and that the 3′ splice site is downstream of the pre-mRNA’s exit point from the spliceosome in the arrested C complex. The cleaved downstream 3′ exon, which lacks a protective cap structure, is rapidly degraded in the extracts and apparently not retained in the complex. In total, we “trimmed” 157 nt of exon sequences from the complex, leaving 165 nt of pre-mRNA plus the MS2 affinity-tag sequence. To confirm that removal of the flanking exon sequences does not disrupt the integrity of the core C complex, we used northern analysis to examine whether the spliceosomal U snRNAs remain associated with the exon-trimmed complexes. As with untrimmed C complex, in which the exons are intact, we detect U2, U5 and U6 snRNAs, indicating that the exon-trimmed complexes were not grossly disrupted (Figure 4b). Furthermore, EM images of negatively stained exon-trimmed spliceosomes (Figure 4c) show that the complexes have roughly the same size and appearance as untrimmed C complexes (Figure 4d).
Figure 4.

Flanking exon sequences do not contribute to C complex stability. (a) Denaturing gel analysis of pre-mRNA in C complex following exon cleavage. Following spliceosome assembly (untrimmed) oligos targeting the 5′ exon 54 nt upstream of the 5′ splice site (denoted by #), directly upstream of the 5′ splice site (*) and the 3′ splice site (&) are added to direct RNase H mediated cleavage (trimmed). Following size exclusion chromatography (load) the complexes are affinity purified via an MS2-MBP affinity tag (elution). RNA species are schematized at the left. (b) Northern analysis for the spliceosomal U snRNAs. Lanes are nuclear extract (NE) as a control for the position of the snRNAs, untrimmed C complex, 5′ exon trimmed C complex (5T) and double 5′ and 3′ exon trimmed C complex (dT). The arrow denotes the position of the radiolabled full length 5′ exon. (c) Electron micrograph of negatively stained untrimmed C complex. The bar is 100 nm. (d) Electron micrograph of negatively stained exon trimmed C complex.
Core spliceosome proteins remain with trimmed C complex
To confirm that removing the extended exons does not disrupt the core splicing machinery, we used mass spectrometry (MS) to analyze C complex spliceosomes from which the flanking exon sequences had been removed and compared the list of protein components identified in untrimmed C complex. The number of unique peptides identified for different spliceosome associated proteins by LC MS/MS is listed in Table 1. In both untrimmed and exon-trimmed C complex we find that most U2 and U5 snRNP proteins, along with the Prp19 complex-associated proteins and second step factors are present and represented by significant numbers of unique peptides. However, for the exon-trimmed complexes, we observe that on average peptide numbers identifying proteins are reduced, likely due to a difference in sample amounts. As previously noted 12, U2 SF3a 60 kd and 66 kd components and SF3b 49 kd are not consistently identified in C complex, suggesting that these proteins’ associations with the complex may be less stable during this stage of spliceosome assembly. Alternatively, our purification conditions may not support stable binding of SF3a to the spliceosome. A set of proteins that appear to be recruited to the spliceosome at B complex and remain throughout C complex were represented in both trimmed and untrimmed samples, some of which remain after 1 M salt treatment 12. We find that a number of proteins that appear only in C complex are still associated after exon trimming, although most of these appear to disassociate in the presence of 1M salt 12. Together, these data further define the core C complex spliceosome proteins.
Table 1.
Mass spectrometry identification of C complex proteins
LC-MS/MS analysis of C complex spliceosomes. Listed is the number of unique peptides identified in either untrimmed or exon-trimmed C complex spliceosomes analyzed in this work. Columns from left to right are the Entrez gene ID number, human protein name, S. cerevisiae homolog, molecular weight in kDa, C complex analyzed previously 13, C complex analyzed in this work (Cb), exon-trimmed C complex (Tr), and 1M salt resistant “core” C complex as reported in 12. An * denotes proteins detected in a separate mass spectrometry analysis of a much lower abundance sample of exon-trimmed complexes, but not in the run reported here.
| Entrez ID | Protein | S.c. | MW | Ca | Cb | Tr | core |
|---|---|---|---|---|---|---|---|
|
snRNP core protein | |||||||
| 6628 | SmB/B′ | Smb1p | 24 | • | 9 | 1 | • |
| 6632 | SmD1 | Smd1p | 13 | • | 6 | 3 | • |
| 6633 | SmD2 | Smd2p | 14 | • | 15 | 3 | • |
| 6634 | SmD3 | Smd3p | 14 | • | 7 | 1 | • |
| 6635 | SmE1 | Sme1p | 11 | • | 8 | 3 | |
| 6636 | SmF1 | Smf1p | 10 | • | 1 | • | |
| 6637 | SmG1 | Smg1p | 9 | • | 4 | • | |
|
U2 snRNP associated proteins | |||||||
| 6627 | U2-A′ | Lea1p | 28 | • | 16 | 2 | • |
| 6629 | U2-B″ | Msl1p | 26 | • | 9 | 2 | • |
| 51639 | p14 | Snu17p | 15 | 1 | 1 | • | |
| 23451 | SF3b155 | Hsh155p | 146 | • | 4 | 9 | • |
| 10992 | SF3b145 | Cus1p | 98 | • | 8 | 3 | • |
| 23450 | SF3b130 | Rse1p | 136 | • | 12 | 28 | • |
| 84844 | SF3b14b | Rds3p | 12 | 3 | 1 | • | |
| 10291 | SF3a120 | Prp21p | 89 | • | 6 | 8 | • |
| 1665 | hPRP43 | Prp43p | 93 | • | 3 | 6 | • |
|
U5 snRNP proteins | |||||||
| 10594 | PRP8 | Prp8p | 274 | • | 88 | 28 | • |
| 23020 | U5-200kD | Brr2p | 206 | • | 63 | 32 | • |
| 9343 | U5-116kD | Snu114p | 109 | • | 50 | 38 | • |
| 9416 | U5-100kD | Prp28p | 96 | • | 3 | 3 | |
| 9410 | U5-40kD | 39 | • | 19 | 5 | • | |
|
Second step factors | |||||||
| 9785 | PRP16 | Prp16p | 140 | • | 3 | 2 | • |
| 51362 | PRP17 | Prp17p | 66 | • | 23 | 5 | • |
| 10569 | SLU7 | Slu7p | 68 | • | 16 | 3 | • |
| 1659 | PRP22 | Prp22p | 139 | • | 40 | 10 | |
|
PRP19 complex associated | |||||||
| 27339 | PRP19 | Prp19p | 55 | • | 26 | 14 | • |
| 22938 | SKIP | Prp45p | 62 | • | 20 | 8 | • |
| 988 | CDC5 | Cef1p | 92 | • | 42 | 14 | • |
| 51340 | CRN | Clf1p | 99 | • | 89 | 44 | • |
| 57461 | ISY1 | Isy1p | 33 | • | 23 | 3 | • |
| 5356 | PRL1 | Prp46 | 58 | • | 14 | 10 | • |
| 55696 | RBM22 | Ecm2p | 47 | • | 10 | 6 | • |
| 10450 | PPIE | 33 | • | 16 | 3 | • | |
| 3312 | HSP73 | Ssa1p | 71 | • | 19 | 10 | |
| 9716 | IBP-160 | 171 | • | 73 | 24 | • | |
| 51645 | PPIL1 | 18 | • | 9 | 2 | • | |
| 25949 | GCIP-IP | Syf2p | 29 | • | 19 | 1 | • |
| 10286 | BCAS2 | Snt309p | 26 | 10 | 1 | • | |
|
Proteins present in B and C complexes | |||||||
| 57703 | KIAA1604 | Cwc22p | 57 | • | 24 | 10 | • |
| 8446 | DDX16 | Prp2 | 119 | • | 2 | 4 | |
| 23759 | PPIL2 | 59 | • | 3 | |||
| 84811 | BUD13 | Bud13p | 71 | 1 | 2 | • | |
| 10283 | SDCCAG10 | Cwc27p | 54 | • | 2 | ||
|
Proteins unique to C complexes | |||||||
| 60625 | DHX35 | 79 | • | 10 | 5 | • | |
| 51428 | DDX41 | 70 | • | 20 | 5 | ||
| 58509 | C19orf29 | 99 | • | 11 | 4 | ||
| 23398 | PPWD1 | 74 | • | 24 | 6 | ||
| 55094 | GPATCH1 | 103 | • | 6 | 1 | ||
| 51503 | HSPC148 | Cwc15p | 27 | • | 7 | 3* | • |
| 8896 | G10 | Cwc14p | 17 | 13 | 5* | • | |
| 53938 | PPIL3b | 18 | • | 8 | 1* | ||
|
Proteins in C complex not found after exon trimming | |||||||
| 151903 | CCDC12 | 19 | 8 | ||||
| 51759 | HSPC220 | 34 | • | 3 | |||
| 84292 | MORG1 | 34 | • | 4 | |||
| 8220 | DGSI | 53 | • | 5 | |||
| 9130 | XAP-5 | 40 | • | 8 | |||
| 51070 | NOSIP | 33 | • | 5 | |||
| 63932 | NKAP | 26 | • | 6 | |||
| 26017 | FAM32A | 13 | 10 | ||||
| 11100 | HNRPUL1 | 96 | 3 | ||||
|
EJC/mRNP proteins | |||||||
| 9775 | eIF4a-III | 47 | • | 14 | 2 | • | |
| 4116 | Magoh | 17 | • | 8 | 1 | • | |
| 9939 | Y14 | 20 | • | 3 | • | ||
| 6428 | SRp20 | 19 | • | 3 | |||
|
hnRNP proteins | |||||||
| 10949 | hnRNP A0 | 31 | 5 | ||||
| 3178 | hnRNP A1 | 39 | • | 10 | 3 | ||
| 3181 | hnRNPA2/B2 | 41 | • | 8 | 2 | ||
| 220988 | hnRNP A3 | 40 | • | 3 | |||
| 3183 | hnRNP C | 32 | • | 17 | 8 | • | |
| 27316 | hnRNP G | 47 | • | 4 | |||
| 4670 | hnRNP M | 78 | • | 5 | |||
| 10236 | hnRNP R | 71 | • | 8 | 2 | ||
| 22913 | RALY | 32 | • | 9 | • | ||
|
Pre-mRNA binding proteins | |||||||
| 22916 | CBP20 | Cbc2p | 18 | • | 1 | • | |
| 4686 | CBP80 | Cbc1p | 93 | • | 7 | • | |
| 3306 | HSP70-2 | Ssa2 | 70 | • | 4 | • | |
| 23517 | SKIV2L2 | Mtr4 | 118 | • | 3 | ||
| 8106 | PAB2 | 33 | • | 3 | 1 | ||
| 3608 | NF45 | 45 | • | 3 | 1 | ||
| 1655 | p68 | Dbp2p | 69 | • | 1 | ||
| 9584 | RNPC2 | 59 | • | 2 | |||
| 8531 | CSDA | 40 | • | 2 | |||
| 9782 | MAT3 | 95 | • | 1 | |||
| 4904 | YB-1 | 36 | • | 3 | |||
Although mass spectrometry analysis is not strictly quantitative, we find that a number of proteins shown to bind pre-mRNA in the absence of splicing are underrepresented in the exon-trimmed C complexes compared to untrimmed C complex. As expected, these proteins include nuclear cap binding proteins in addition to several hnRNP proteins. A number of proteins unique to C complex spliceosomes are also not detected in the exon-trimmed complexes. While it is unclear to what extent sample amounts contribute to the observed differences in protein detection, we note that these proteins are also lost after 1M salt treatment 12. Our data support the supposition that these proteins are located at the periphery of C complex and are not stable core components. Important for our structural analysis, the combined molecular weight of the proteins identified in the exon-trimmed C complexes (~ 4 megadaltons) is less than that of the untrimmed C complexes (~6 megadaltons). We point out that the total mass of the complexes as estimated by mass spectrometry represents an upper limit that is almost surely an overestimation because many of the identified are not stoichiometric. Therefore, it is likely that much less than 2 megadaltons of mass is removed with exon trimming. Nonetheless, the exon-trimmed complex mass is more in line with the mass encompassed in the continuous electron density map (~ 3 megadaltons). The remaining missing mass may be attributed to averaging out of additional flexible regions in C complex and/or transient or substoichiometric association of some spliceosome components. Additionally, artifacts arising from the missing cone of data present in the random conical tilt reconstruction of the structure could add to the discrepancy.
The average structure of exon-trimmed C complex is largely unchanged, but the distribution of complex conformations is altered
To further explore the effects of exon trimming on the structure of C complex we collected several thousand individual complex images by TEM and used standard image processing techniques to iteratively align and classify them into averaged views (Figure 5, bottom row). The averaged views show that the exon-trimmed complexes take on similar preferred orientations and, strikingly, are comparable to averaged views of untrimmed C complex at the gross structural level (Figure 5, top row). This result supports the hypothesis that the averaged structure observed for C complex can be attributed to the core components and not the extending exon sequences and their associated proteins. These images also indicate that in the untrimmed spliceosomes the exons are likely disordered relative to the core C complex structure.
Figure 5.
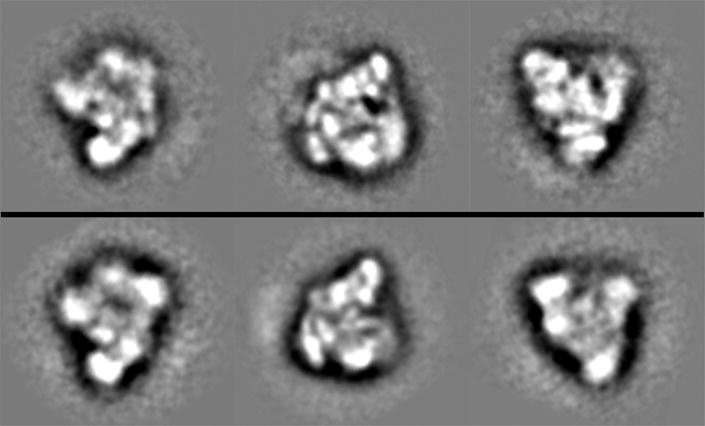
Representatives of independently derived class average views of C complex (top row) and exon-trimmed (bottom row) spliceosomes.
Closer inspection of the exon-trimmed and C complex class averages indicate that there may be some subtle differences, but we cannot state whether the differences are due to structural changes in the complexes, small changes in the preferred orientations or to variability associated with the heterogeneity of the sample. In order to map potential differences between the exon-trimmed and untrimmed C complexes we created a mixed data set containing roughly equal numbers of exon-trimmed and C complex images. After iteratively aligning and classifying the images to obtain averaged views, we could extract the C complex and exon-trimmed complex images into separate subclass-averaged views for comparison. We focused our analyses on two predominant views of the C complex previously observed in negative stain 13, which we term “claw” and “man” (Figure 6, left and right panels respectively). For the claw view, we easily discerned a class showing the typical claw features (Figure 6a, claw1 average). Surprisingly, when we compared the number of constituent C complex and exon-trimmed images we found that the distribution was skewed from the expected 1:1 relative ratio. Instead there were more C complex images with a relative ratio of 3.3:1 of C complex to exon-trimmed complexes. Averages of the extracted C complex and exon-trimmed images from the mixed are very similar with a cross-correlation coefficient of 0.92 and with little variance within the particle envelope for each average (Supplementary Data, Figure S2). Difference maps between these averages are relatively flat (Figure 6c) suggesting that there is no large difference between C complex and exon-trimmed complexes in this orientation. Displaying the statistically significant differences at a 3σ threshold reveals small difference peaks located near the center of the particle (Figure 6c). These differences may be attributable to the missing exon sequence, likely the regions proximal to the entry/exit site of the structured core C complex which are likely to be more constrained in their position than distal regions. Alternatively, the differences may correlate to small changes in C complex conformation resultant from removing the exon sequences.
Figure 6.

2D analysis of exon-trimmed particle images. Left panel shows the “claw view” and right panel shows the “man view”. (a) Class averaged views derived from a mixed data set of untrimmed C complex and exon-trimmed complex images. The white arrow indicates a variable density between two related views. (b) Averaged images of the subpopulations of C complex and exon-trimmed complex images from the mixed averages. The number of images making up each average is denoted in the lower left corner. (c) Difference analysis between the two subpopulation averages shown in (b). To the right is the difference map subtracting the exon-trimmed average from the C complex average, and to the left is an image thresholded to show statistically significant differences at the 3 σ level. (d) Difference analysis between the two related claw and man views. At the center is the difference map subtracting the claw2 and man2 average views from the claw1 and man1 average views respectively. To the left and right are thresholded images showing positive and negative statistically significant differences at the 5 σ level. The white arrow indicates the negative difference density that correlates to the variable density indicated in (a).
With further inspection of the mixed class averages, we found another that closely resembled the typical claw view, but that was missing a larger diffuse density to one side of the average (Figure 6a, claw2 average). In contrast to the previously examined class average, we found that this class is derived from more exon-trimmed complexes with a relative ratio of 0.6:1. However, like the previous class, the derivative C complex and exon-trimmed subclass averages were again similar (cross-correlation coefficient of 0.88) and showed only small statistically differences (Figure 6c, Supplementary Data Figure S2).
We hypothesized that the two class averages, which we termed claw1 and claw2, represent the same orientational view of C complex in different conformations. They have a relatively high cross-correlation coefficient of 0.78. Nevertheless, this value is significantly smaller than the correlation coefficients found for the subclass averages, indicating that the missing diffuse density represents a more significant difference between these two structures. Additionally, if we parse the mixed data set into fewer classes, we observe a single class average of the claw view. In this case, the average is composed of equal numbers of C complex and exon-trimmed images. The subclass average derived from constituent C complex images resembles the claw1 conformation and the exon-trimmed image average resembles the claw2 conformation (data not shown). This result indicates that the two averages are closely related because they will segregate into the same class. It also underscores the observation that the claw1 conformation is enriched for C complex, whereas claw2 is enriched for exon-trimmed complexes. However, re-examination of image processing results for a dataset containing just C complex images indicated the presence of class averages showing both claw1 and claw2 views. Because both averages can be obtained with C complex images alone, the difference between these conformations is not a direct result of exon trimming.
To more closely analyze the relationship of the claw1 and claw2 conformations, we aligned the two mixed class averages and calculated a difference map between them (Figure 6d). The maps thresholded for statistically significant differences show several strong features, even at a 5σ threshold. We can see a negative feature at the location of the missing diffuse density noted earlier. In addition there are negative differences located at the edges all around the particle. The positive density differences observed lay farther outside the particle within the stain shadow. We created a movie which transitions between the two views (Supplementary Data, Figure S3) and it appears that the differences arise from an apparent inward collapse of the complex, as if a supporting structure was lost.
With the other predominant view of C complex (man view), we also find two highly related views (man1 and man2, Figure 6a, right panel). In previous analysis of a dataset containing only C complex images, the man1 view was always presents as a prominent class average, while man2 was discounted as a badly behaving class with a low image population and poor statistics. With the mixed data set, the man2 class is a better class and easily recognizable as a variant of the man view in which the “arm” density is apparently missing. When we extracted the C complex and exon-trimmed images from the two man class averages (Figure 6b) we find that man1 is derived from a higher proportion of C complex images relative to exon-trimmed images (1.5:1). Conversely, man2, the class average lacking the arm density, is derived predominantly from exon-trimmed complexes (0.5:1). Again, cross-correlation coefficients between C complex and exon-trimmed averages derived from either the man1 or man 2 averages are high (0.93 and 0.89 respectively), and difference images between the subclass averages each show little to no significant peaks (Figure 6c). In contrast, the cross-correlation coefficient between aligned man1 and man2 class averages is 0.80, which, while still indicating the relatedness of the two views, is again lower than those between the subclass averages. As expected for the lower cross-correlation coefficient, the difference image between aligned man1 and man2 averages exhibits a significant negative peak located at the arm position that accounts (Figure 6d). Additionally, there is a positive density on the opposite side of the man view, which appears to arise from a rearrangement and/or disordering of that region in the man2 view. A movie that transitions between the man1 and man2 views also indicates that the differences are localized to the arm and backside of the complex (Supplementary Data, Figure S4).
We interpret these results to mean that there are two conformations of C complex spliceosomes, (1) with and (2) without a density region, which can be observed in both the claw and man views of the complex. Given that more untrimmed C complex images are present in averages of the first conformation for both views, and vice-versa that exon-trimmed complexes are enriched in averages of the second conformation, we hypothesize that removal of the exon sequences further destabilizes the density region and shifts the population towards the second conformation. We do not think the differences can be attributed to a small change in preferred orientation (such as a slight rotation to one side) between trimmed and untrimmed complexes. In that case we postulate that a minor global movement of the particle would result in smaller magnitude differences that distribute relatively evenly across the particle, rather than in the large localized difference that we observe.
Conformational changes in C complex are due to 3′ exon trimming
In order to determine whether the conformational change stabilized by exon trimming was due to trimming of either the 5′ or 3′ exons alone, we purified and imaged C complex from which only the 5′ exon was removed. We again created a mixed data set of untrimmed C complex and 5′ exon-trimmed complex images, which we iteratively aligned and classified. Inspection of the class averages again revealed the claw1 and claw2 views (Figure 7). When we compared the number of C complex vs. 5′ exon-trimmed images contributing to each view, we found relative ratios of 1:1.2 for both claw views. This is in contrast to complexes from which both exons had been removed, and indicates that the previously described skew towards the claw2 view is due to removing the 3′ exon. In addition, although the man1 view was present among the mixed classes, the man2 view was not apparent. This observation again supports the hypothesis that 3′ exon trimming is primarily responsible for the high population of particles contributing to the man2 view.
Figure 7.
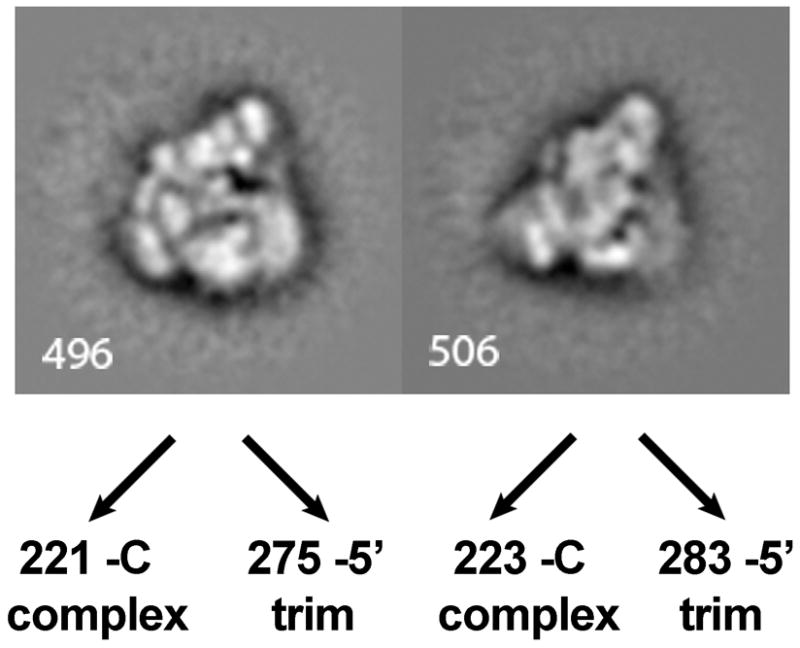
Two related conformations of the claw view derived from a mixed dataset of images of C complex and 5′ exon-trimmed complexes. The number of images contributing to each average for the two different complexes is indicated.
DISCUSSION
In this study we have characterized the role pre-mRNA plays in the structure of C complex spliceosomes. The data are consistent with a model in which the spliceosome engages the pre-mRNA substrate only near the splice sites such that the remainder of the intron loops out and flanking exonic regions extend away from the complex. The 3′ splice site is not protected in the complex, suggesting that the second step active site is at least partially open. This idea is further underscored by our finding that the complex can accommodate a 3′ splice site provided in trans and catalyze exon ligation. As expected for flanking exonic regions that are not incorporated into the core of C complex, we can remove them from the spliceosomes while the fundamental components (U2, U5, U6 snRNPs, Prp19 complex and second step factors) remain intact. Also, we still find an additional set of proteins that consistently associates with B and/or C complex spliceosomes. Some of these non-snRNP proteins have demonstrated links to splicing, such as the yeast homolog of DDX16, Prp2p, which is required for splicing prior to the first step of chemistry 22. However, a defined role in splicing for most of the additional proteins has not yet been demonstrated. Still, in these additional proteins we observe several common motifs, such as the DEAH/D motifs associated with ATP dependent alteration of RNA:RNA or RNA:protien interactions present in the proteins DHX35 and DDX41. There are also several potential prolyl cis-trans isomerases (PPIL2, SDCCAG10, and PPWD1). Together the presence of these proteins known to promote changes in molecular conformations suggests as yet uncharacterized dynamic steps that may be required for mammalian splicing.
Although the mass spectrometry analysis cannot be strictly construed as quantitative, we note that several proteins are not represented in the exon-trimmed C complexes. As we expected, these include the cap binding proteins as well as several other proteins shown to bind pre-mRNA in the absence of splicing, such as the hnRNP proteins. The proteins in this class that appear to remain bound after exon trimming, for example hnRNP C, may be binding to intronic sequences. As for the splicing specific proteins that appear to be lost after exon trimming, the mechanism of their association with the pre-mRNA and spliceosomes remains to be explored. It is interesting to note that nearly all of these proteins are also lost after 1 M salt treatment 12, further underscoring their likely location at the periphery of the complex.
In agreement with the protein composition, the structure of C complex as observed by EM and 2D averaging is largely unchanged by exon trimming, and we could not locate the positions of the 5′ and 3′ exon sequences removed with our trimming by difference mapping. Again, these observations strongly suggest that the core of C complex is structured and represents the densities observed by EM imaging while the unprotected exon regions are not well ordered. Interestingly, exon trimming of the 3′ exon does alter the distribution of particles between two related conformations of C complex, increasing the population of particles in a previously minor population. This altered distribution allowed us to recognize the second conformation in which a significant domain appears to be missing. We observe this altered conformation and loss of density in two distinct views of C complex (man and claw) and suggest that these differences have the same molecular identity. This supposition would be supported by matching differences of the man and claw views to the same location in the three dimensional structure of C complex. However the available RCT reconstruction of C complex was derived solely from images in the man orientation23, and it is limited by a missing cone of information. Currently, we cannot unequivocally determine how the claw view relates to the 3D model, and will be important to examine this issue when an improved structure of C complex is available.
We propose that density in question represents a domain with lower stability relative to the rest of the complex, and removing the 3′ exon further destabilizes its association. This hypothesis may suggest that the domain interacts with 3′ exon, however difference density we observe is located on the opposite face of the man view from where we previously localized the 5′ and 3′ exons by labeling24. There is region of the man view near the labeled exons that does change in the altered conformation, but we cannot explicitly attribute this difference directly to trimming as we also see this change in a small subset of untrimmed complexes. Future studies will be important for determining the identity of the domain and the critical region of the 3′ exon that is responsible for its stable association with the spliceosome.
MATERIALS AND METHODS
In vitro splicing and RNase H digestion
For RNase protection assays we used the modified HMS389 derivative of the AdML transcript described in 13 as a splicing substrate, which contains an AG=>GG mutation at the 3′ splice site. Employing T7 runoff transcription, G(5′)ppp(5′)G-capped radiolabeled substrate was synthesized and gel purified. The substrate was incubated for in vitro splicing at 10 nM concentration in 80 mM potassium glutamate, 2 mM magnesium acetate, 2 mM ATP, 5 mM creatine phosphate, 0.05 mg/ml tRNA, and 40% HeLa cell nuclear extract at 30°C for 60 minutes. Reactions were then supplemented with DNA oligos (10–16 nt) targeting consecutive regions of the pre-mRNA and incubated an additional 20 minutes (See Supplementary Figure 1 for oligo target sequences). RNA was then extracted with phenol/chloroform, ethanol precipitated and electrophoresed through a 15% denaturing acrylamide gel that was visualized with a phosphorimager (Molecular Dynamics).
Bimolecular exon ligation
For bimolecular exon ligation, we used the same full-length pre-mRNA substrate and a GMP initiated 3′ substrate that begins with the sequence GGUACAGGUA upstream of 3′ exon. As described above, lightly radiolabeled pre-mRNA substrate was subjected to in vitro splicing. After 30 minutes, highly radiolabeled 3′ substrate was added to a 50 nM concentration along with an additional 1 mM ATP and incubated for 60 more minutes. Reaction time points were analyzed by denaturing gel electrophoresis as described above.
RT analysis of splicing products
RNA bands cut out of denaturing gels were gel extracted and ethanol precipitated. The RNA was subjected to RT-PCR using primers complementary to the 3′ end of the 3′ exon (TATCGGATCCAAGTACTGG) and the 5′ end of the 5′ exon (GGGAGACCGGCAGATCAG), respectively. M-MLV (Promega) was used in the RT reaction according to the manufacturer’s protocol. PCR products were visualized with ethidium bromide on a 2% agarose gel and subsequently gel purified (Qiagen) and sequenced.
C complex purification and exon cleavage
C complex spliceosomes were assembled and purified as previously described 13. Trimmed complexes were assembled and purified a similar manner with one modification: we added DNA oligonucleotides targeting GCCATGGGGCAA centered at 54 nt upstream of the 5′ splice site and GAGAGAGAGACCGGTA at the 3′ splice site after 60 minutes of splicing and incubated the reactions additional 20 minutes before proceeding to size exclusion.
Northern blots
For northern blots, 60 fmol of purified complexes were electrophoresed through a denaturing 8% polyacrylamide gel, transferred to a nylon membrane, UV crosslinked, and hybridized with 32P-labeled probes complementary to the U snRNAs (Konarska & Sharp, 1987).
Mass Spectrometry
For peptide sequence analysis by mass spectrometry, approximately 500 fmol of purified complexes were separated by 10% SDS-PAGE and stained with Coomassie-G. The gel lane was cut into 10 sections, and each section subjected to in-gel tryptic digestion. Proteins were reduced with 10mM DTT for one hour at 55C, then free sulfhydryls were alkylated using iodoacetamide for one hour, after which proteins were digested overnight with 150ng Promega modified trypsin.
Samples were analyzed using two different mass spectrometry platforms, and then results were combined. Samples were analyzed by LC-MS/MS using a Thermo LTQ-Orbitrap and a MDS Sciex / Applied Biosystems QSTAR XL. One hour reverse-phase chromatography separations were carried out using an Eksigent nano-1D HPLC system attached to each mass spectrometer. Peptides were selected for fragmentation analysis as they eluted in a data-dependent fashion, and dynamic exclusion was employed to prevent repeated analysis of the same components.
Data was searched using Protein Prospector developmental version 4.25.4 (which was functionally similar to version 5.0 (Chalkley et al., 2008)) against the UniprotKB protein database downloaded on February 21st 2007. For Orbitrap data, precursor and fragment mass tolerances of 15ppm and 0.6 Da respectively were allowed, and for QSTAR data a precursor mass tolerance of 100ppm and fragment mass tolerance of 300ppm was considered. Cysteines were assumed to be carbamidomethylated, and methionine oxidation, protein N-terminal acetylation and pyroglutamate formation from N-terminal glutamine residues were all considered as possible modifications. A maximum expectation value of 0.1 was employed as a threshold for peptide identifications.
Electron Microscopy
Samples for electron microscopy were prepared by spotting 3ul of purified complexes onto carbon-coated copper grids followed by staining with 2% (w/v) uranyl acetate solution. Samples were analyzed using a JEOL 1230 microscope operating at 120kV. Micrographs were exposed under low-dose conditions at 60,000X magnification on a 4K × 4K Gatan Ultrascan CCD camera, resulting in micrographs sampled at 4.9 Å per pixel. Approximately 3,000 untrimmed C complex particles, 4,500 exon-trimmed C complex particles, and 4500 5′ exon trimmed complex particles were selected manually from micrographs using the EMAN program Boxer 25. Following 2×2 pixel averaging using SPIDER 26, particle images were band pass filtered, centered and iteratively aligned, classified and averaged using IMAGIC-5 27. Difference images, variance maps and thresholds were also generated with IMAGIC-5. For thresholded difference maps, we calculated the expected variance of the difference map using the variances of the two averages being compared and then displayed differences that lay above a given threshold sigma value.
Supplementary Material
Acknowledgments
We thank T. Quan for technical assistance and M. Moore (University of Massachusetts, Worchester) and N. Grigorieff (Brandeis University) for comments. This work was funded by National Institutes of Health grant 5R01GM72649 to M.S.J. R.J.C. and A.L.B. are supported by National Center for Research Resources grants RR001614, RR015804 and RR019934. J.I. is supported by a Center for Biomolecular Science and Engineering Graduate Diversity Fellowship sponsored by National Human Genome Research Institute.
Footnotes
Publisher's Disclaimer: This is a PDF file of an unedited manuscript that has been accepted for publication. As a service to our customers we are providing this early version of the manuscript. The manuscript will undergo copyediting, typesetting, and review of the resulting proof before it is published in its final citable form. Please note that during the production process errors may be discovered which could affect the content, and all legal disclaimers that apply to the journal pertain.
References
- 1.Brow DA. Allosteric cascade of spliceosome activation. Annu Rev Genet. 2002;36:333–60. doi: 10.1146/annurev.genet.36.043002.091635. [DOI] [PubMed] [Google Scholar]
- 2.Chiara MD, Gozani O, Bennett M, Champion-Arnaud P, Palandjian L, Reed R. Identification of proteins that interact with exon sequences, splice sites, and the branchpoint sequence during each stage of spliceosome assembly. Mol Cell Biol. 1996;16:3317–26. doi: 10.1128/mcb.16.7.3317. [DOI] [PMC free article] [PubMed] [Google Scholar]
- 3.Gozani O, Patton JG, Reed R. A novel set of spliceosome-associated proteins and the essential splicing factor PSF bind stably to pre-mRNA prior to catalytic step II of the splicing reaction. Embo J. 1994;13:3356–67. doi: 10.1002/j.1460-2075.1994.tb06638.x. [DOI] [PMC free article] [PubMed] [Google Scholar]
- 4.Reichert VL, Le Hir H, Jurica MS, Moore MJ. 5′ exon interactions within the human spliceosome establish a framework for exon junction complex structure and assembly. Genes Dev. 2002;16:2778–91. doi: 10.1101/gad.1030602. [DOI] [PMC free article] [PubMed] [Google Scholar]
- 5.Hastings ML, Krainer AR. Pre-mRNA splicing in the new millennium. Curr Opin Cell Biol. 2001;13:302–9. doi: 10.1016/s0955-0674(00)00212-x. [DOI] [PubMed] [Google Scholar]
- 6.Moore MJ, Sharp PA. Evidence for two active sites in the spliceosome provided by stereochemistry of pre-mRNA splicing. Nature. 1993;365:364–8. doi: 10.1038/365364a0. [DOI] [PubMed] [Google Scholar]
- 7.Konarska MM, Query CC. Insights into the mechanisms of splicing: more lessons from the ribosome. Genes Dev. 2005;19:2255–60. doi: 10.1101/gad.1363105. [DOI] [PubMed] [Google Scholar]
- 8.Jurica MS. Detailed close-ups and the big picture of spliceosomes. Curr Opin Struct Biol. 2008;18:315–20. doi: 10.1016/j.sbi.2008.05.005. [DOI] [PMC free article] [PubMed] [Google Scholar]
- 9.Boehringer D, Makarov EM, Sander B, Makarova OV, Kastner B, Luhrmann R, Stark H. Three-dimensional structure of a pre-catalytic human spliceosomal complex B. Nat Struct Mol Biol. 2004;11:463–8. doi: 10.1038/nsmb761. [DOI] [PubMed] [Google Scholar]
- 10.Sander B, Golas MM, Makarov EM, Brahms H, Kastner B, Luhrmann R, Stark H. Organization of core spliceosomal components U5 snRNA loop I and U4/U6 Di-snRNP within U4/U6.U5 Tri-snRNP as revealed by electron cryomicroscopy. Mol Cell. 2006;24:267–78. doi: 10.1016/j.molcel.2006.08.021. [DOI] [PubMed] [Google Scholar]
- 11.Hacker I, Sander B, Golas MM, Wolf E, Karagoz E, Kastner B, Stark H, Fabrizio P, Luhrmann R. Localization of Prp8, Brr2, Snu114 and U4/U6 proteins in the yeast tri-snRNP by electron microscopy. Nat Struct Mol Biol. 2008;15:1206–12. doi: 10.1038/nsmb.1506. [DOI] [PubMed] [Google Scholar]
- 12.Bessonov S, Anokhina M, Will CL, Urlaub H, Luhrmann R. Isolation of an active step I spliceosome and composition of its RNP core. Nature. 2008;452:846–50. doi: 10.1038/nature06842. [DOI] [PubMed] [Google Scholar]
- 13.Jurica MS, Licklider LJ, Gygi SR, Grigorieff N, Moore MJ. Purification and characterization of native spliceosomes suitable for three-dimensional structural analysis. Rna. 2002;8:426–39. doi: 10.1017/s1355838202021088. [DOI] [PMC free article] [PubMed] [Google Scholar]
- 14.Zhou Z, Licklider LJ, Gygi SP, Reed R. Comprehensive proteomic analysis of the human spliceosome. Nature. 2002;419:182–5. doi: 10.1038/nature01031. [DOI] [PubMed] [Google Scholar]
- 15.Le Hir H, Izaurralde E, Maquat LE, Moore MJ. The spliceosome deposits multiple proteins 20–24 nucleotides upstream of mRNA exon-exon junctions. Embo J. 2000;19:6860–9. doi: 10.1093/emboj/19.24.6860. [DOI] [PMC free article] [PubMed] [Google Scholar]
- 16.Gunzl A, Bindereif A. Oligonucleotide-targeted RNase H protection analysis of RNA-protein complexes. Methods Mol Biol. 1999;118:93–103. doi: 10.1385/1-59259-676-2:93. [DOI] [PubMed] [Google Scholar]
- 17.Desmet FO, Hamroun D, Lalande M, Collod-Beroud G, Claustres M, Beroud C. Human Splicing Finder: an online bioinformatics tool to predict splicing signals. Nucleic Acids Res. 2009 doi: 10.1093/nar/gkp215. [DOI] [PMC free article] [PubMed] [Google Scholar]
- 18.Sawa H, Shimura Y. Alterations of RNase H sensitivity of the 3′ splice site region during the in vitro splicing reaction. Nucleic Acids Res. 1991;19:3953–8. doi: 10.1093/nar/19.14.3953. [DOI] [PMC free article] [PubMed] [Google Scholar]
- 19.Schwer B. A conformational rearrangement in the spliceosome sets the stage for Prp22-dependent mRNA release. Mol Cell. 2008;30:743–54. doi: 10.1016/j.molcel.2008.05.003. [DOI] [PMC free article] [PubMed] [Google Scholar]
- 20.Hirose T, Ideue T, Nagai M, Hagiwara M, Shu MD, Steitz JA. A spliceosomal intron binding protein, IBP160, links position-dependent assembly of intron-encoded box C/D snoRNP to pre-mRNA splicing. Mol Cell. 2006;23:673–84. doi: 10.1016/j.molcel.2006.07.011. [DOI] [PubMed] [Google Scholar]
- 21.Moore MJ, Sharp PA. Site-specific modification of pre-mRNA: the 2′-hydroxyl groups at the splice sites. Science. 1992;256:992–7. doi: 10.1126/science.1589782. [DOI] [PubMed] [Google Scholar]
- 22.Kim SH, Lin RJ. Spliceosome activation by PRP2 ATPase prior to the first transesterification reaction of pre-mRNA splicing. Mol Cell Biol. 1996;16:6810–9. doi: 10.1128/mcb.16.12.6810. [DOI] [PMC free article] [PubMed] [Google Scholar]
- 23.Jurica MS, Sousa D, Moore MJ, Grigorieff N. Three-dimensional structure of C complex spliceosomes by electron microscopy. Nat Struct Mol Biol. 2004;11:265–9. doi: 10.1038/nsmb728. [DOI] [PubMed] [Google Scholar]
- 24.Alcid EA, Jurica MS. A protein-based EM label for RNA identifies the location of exons in spliceosomes. Nat Struct Mol Biol. 2008;15:213–5. doi: 10.1038/nsmb.1378. [DOI] [PMC free article] [PubMed] [Google Scholar]
- 25.Ludtke SJ, Baldwin PR, Chiu W. EMAN: semiautomated software for high-resolution single-particle reconstructions. J Struct Biol. 1999;128:82–97. doi: 10.1006/jsbi.1999.4174. [DOI] [PubMed] [Google Scholar]
- 26.Frank J, Radermacher M, Penczek P, Zhu J, Li Y, Ladjadj M, Leith A. SPIDER and WEB: processing and visualization of images in 3D electron microscopy and related fields. J Struct Biol. 1996;116:190–9. doi: 10.1006/jsbi.1996.0030. [DOI] [PubMed] [Google Scholar]
- 27.van Heel M, Harauz G, Orlova EV, Schmidt R, Schatz M. A new generation of the IMAGIC image processing system. J Struct Biol. 1996;116:17–24. doi: 10.1006/jsbi.1996.0004. [DOI] [PubMed] [Google Scholar]
- 28.Konarska MM, Sharp PA. Interactions between small nuclear ribonucleoprotein particles in formation of spliceosomes. Cell. 1987;49:763–774. doi: 10.1016/0092-8674(87)90614-3. [DOI] [PubMed] [Google Scholar]
- 29.Chalkley RJ, Baker PR, Medzihradszky KF, Lynn AJ, Burlingame AL. In-depth analysis of tandem mass spectrometry data from disparate instrument types. Mol Cell Proteomics. 2008;7:2386–2398. doi: 10.1074/mcp.M800021-MCP200. [DOI] [PMC free article] [PubMed] [Google Scholar]
Associated Data
This section collects any data citations, data availability statements, or supplementary materials included in this article.