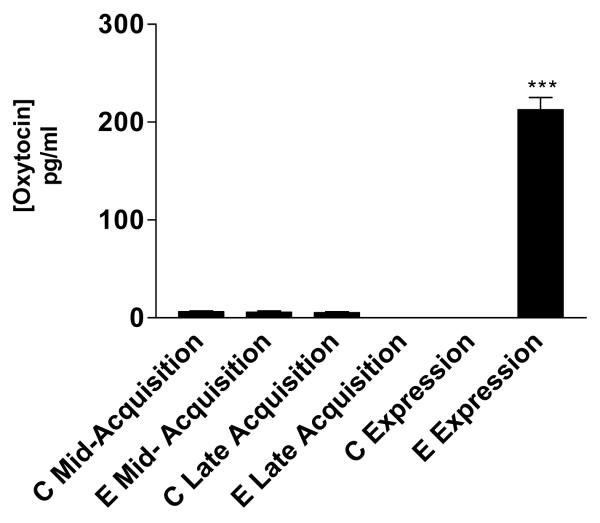
Figure 5. EIA of Oxytocin.
OT levels were measured during mid-acquisition (5 days), late acquisition (10 days) of cocaine conditioning and during the drug expression session (day12). OT was measured from NAc tissue rich punches and is expressed as pg/ml of total protein. There was a significant difference between C Expression and E Expression (*** p<0.001). The up regulation of OT found in the expression session confirms the up regulation of the mRNA in the arrays. Also, OT levels were found in other conditioning phase but not comparable to the array results. C= control, E= Experimental.

