Abstract
The carotid body (CB) is a polymodal chemosensor of arterial blood located next to the internal carotid artery. The basic chemosensing unit is composed of the neurotransmitter (NT)-containing glomus cells (GCs) and the sensory afferent fibers synapsing onto the GCs. Nicotinic and muscarinic receptors have been found on both the sensory afferent fibers and on the GCs. Neural output from the CB (CBNO) increases when arterial blood perfusing it is hypoxic, hypoglycemic, hypercapnic, or acidic. The increased CBNO due to GC release of excitatory NTs must be preceded by an entrance of calcium into the GCs. With repeated release of ACh from the GCs, cholinergic receptors could become desensitized, particularly nicotinic receptors which function as calcium channels. The purpose of the present study was to see if adenosine (ADO), known to alter receptor sensitivities, could attenuate or eliminate any desensitization of the nicotinic receptors occurring during the repeated application of ACh. Cat CBs were harvested with techniques approved by the University's Animal Care/Use Committee. The GCs were cultured and prepared for detecting [Ca++]i with standard techniques. Repeated application of ACh produced a progressively decreasing increase in [Ca++]i. With the use of ADO or an A2a ADO receptor agonist the decrease was avoided. Though ADO also increased GC [Ca++]i, the sum of ADO increase and ACh increase, when superfused separately, was less than the increase when they were both included in the same superfusion. This suggested the possible involvement of a new path in the action. Potential mechanisms to explain the phenomena are discussed.
Regulatory Systems: carotid body, intracellular calcium, ACh, adenosine, hexamethonium, atropine
1. Introduction
Obstructive Sleep Apnea produces repeated bouts of hypoxia intermittently. Hypoxia provokes the release of acetylcholine (ACh) within the carotid body (CB). ACh generates increased neural activity in the abutting sensory afferent nerves in several species, but also acts back on the GC from which it is released. In a previous conference we reported that ACh increased the intracellular calcium in the glomus cells (GCs) of the cat CB. In the present study we wished to see if GCs exposed to intermittent ACh challenges gave a consistent increase in the intracellular calcium ([Ca++]i). But there was concern that the cholinergic receptors on the GCs might become desensitized (Giniatullin, et al., 2005). It has been reported that adenosine (ADO) increased CB neural output (Monteiro, Ribeiro, 1987). That would indicate that ADO might act directly on the sensory afferent nerves, or facilitate the release of other excitatory neurotransmitters, or decrease the release of attenuating/inhibiting neurotransmitters (Fitzgerald, et al., 2004). We had previously reported that ADO did augment the hypoxia-induced increased release of ACh and reduced the hypoxia-induced increased release of catecholamines (dopamine [DA] and norepinephrine [NE]; Fitzgerald, et al., 2004). The former transmitter is generally accepted as excitatory in the cat and rat, while the latter transmitters are generally reported to be attenuating or inhibitory in cat and rat. Further, it has been recently reported that ADO increases intracellular calcium in the GCs of the rat (Xu, et al., 2006.).
The present study focuses on the interacting of ACh and ADO in the control of [Ca++]i in the GCs of the cat CB. Several questions were addressed: (1) Did repeated ACh challenges consistently increase GC intracellular calcium ([Ca++]i)? (2) What is the impact of ADO on the response to repeated ACh challenges? (3) What ADO receptors are involved? (4)What effect does ADO alone have on the [Ca++]i of the cat GCs? (5) Since both ACh and ADO will likely elevate [Ca++]i in the cat GCs, is their effect additive or more than additive? (6) Does ADO's effect have a cholinergic component?
2. Results
Introductory Note
The “A” component of the following figures is intended to provide the reader with a clearer picture of precisely when and how the agents were applied to the preparation. Component “B” presents the total [Ca++]i signal to the challenge maneuver while component “C” presents the increase above a common baseline.
Figure 1A shows the protocol in an experiment in which there was an intermittent/repeated application (superfusion) of 100 μM ACh on cat GCs. Figure 1B presents the maximum increase in the [Ca++]i signal within the GCs. ACh#2 is 90.6% of ACh#1; ACh#3, 86.2% of ACh#1. To see better the decline in the effect that 100 μM ACh had on the signal, the increase above the baseline is graphed (Figure 1C). Here ACh#2 is 63.8% of ACh#1; ACh#3, 49.1%. There are significant declines in the effect.
Figure 2A presents the protocol when 100μM ADO was included with the 100 μM of ACh in the second superfusion. Figure 2B shows no significant decline when the ADO was included in the second ACh challenge (ACh#2+ADO was 96.5% of ACh#1), but a significant decline with the third application of ACh (ACh#3, 88.9% of ACh#1). Figure 2C, showing the increases above the baseline, illustrates the effect of ADO more clearly. The increase with the ACh + ADO superfusion is 91.4% of that for ACh#1, whereas ACh#3 is only 72.7% of that for ACh#1.
Figure 3A shows the protocol when 100μM ADO was included with the 100μM ACh in the third superfusion. Figure 3B shows the maximum increase in [Ca++]i with the second superfusion declines significantly (93.9% of ACh#1), while ACh#3 +ADO is 104.4% of ACh#2 (a significant increase), but 98.0% of ACh#1 (no significant change). The effect is perhaps more clearly seen in the increases above baseline during the three superfusions (Figure 3C) where ACh#2 is 78.5% of ACh#1 and ACh#3 with ADO is 118.4% of ACh#2 and 92.9% of ACh#1 (not differeent). It is interesting that ADO, given during either the second or third superfusion, brings the maximum [Ca++]i signal back only to within 5% of the signal for ACh#1; the increase in the [Ca++]i signal comes back only to within 10% of that for ACh#1. Neither measure is statistically distinguishable from the [Ca++]i signal generated by the ACh#1 superfusion.
Figure 4A repeats the protocol of Figure 2A except that the ADO A1 receptor blocker, 1.3 – dipropyl-8-cyclopentylxanthine (DPCPX) is added with the ADO in this superfusion. Figure 4B demonstrates that the effects are the same here as in Figure 2B with a significant decline in the ACh#3 superfusion to 96.2% of ACh#1; ACh#2+ADO+DPCPX was 102.3% of ACh#1. Figure 4C shows that the increase for this superfusion was 107.2% of that for ACh#1 superfusion and statistically indistinguishable from it. ACh#3's increase is 87.8% of that for ACh#1.
Figure 5A shows the protocol for this superfusion using an A2A ADO receptor agonist, 2-p-(2-carboxyethyl)phenethylamino-5′-N-ethylcarboxamidoadenosine hydrochloride(CGS 21680) in the second superfusion. Figure 5B again shows the maximum [Ca++]i response of this procedure. The results repeat what has been seen in Figures 2B and 4B. Here the [Ca++]i signal during the perfusion of CGS21680, instead of ADO, being 101.3% of ACh#1; once again ACh#3 shows a significant decline to 94.5% of ACh#1. Figure 5C shows results similar to those in Figures 2C and 4C. The [Ca++]i signal for the increase being 103.1% of that for ACh#1, while that for ACh#3 is 87.4% of that for ACh#1.
The maximum ACh-induced [Ca++]i signal when ADO, ADO with an A1 ADO receptor blocker, or an A2A ADO receptor agonist was given during the second superfusion were normalized to their respective maximum ACh#1 responses to determine if any effect of an A1 ADO receptor could be detected. Figure 6A reveals no significant difference among the three analyses as determined initially by a Kruskal-Wallis One Way Analysis of Variance on Ranks (P = 0.272). Mann-Whitney Rank Sum Tests generated the P values. Figure 6B presents the increases of these three procedures normalized to their respective increases in responses to their ACh#1 superfusions.
Figure 7 A gives the protocol for the three superfusions of 100μM ADO to determine the effect of repeated ADO exposures on the [Ca++]i signal in cat GCs. Recording the RLU signal was sometimes extended since the pattern of response to ADO in the cat GCs was not known. But the pattern of providing solutions was as depicted in Figure 7A, and the maximum signal was recorded. Figure 7B shows the second superfusion is borderline significantly less (97.9%) than ADO#1. But the third superfusion is significantly greater than either ADO#2 (108.5%) or ADO#1 (106.3%). This pattern is the opposite of that seen for three superfusions of ACh seen in Figures 2B. The increases seen in Figure 7C are even more dramatic with the increase for ADO#2 being 80.5% of that for ADO#1, but ADO#3's increase being 159.8% of that for ADO#1 and 199.4% of that for ADO#2.
The data seen in Figures 2B,3B,4B,5B prompted an investigation of whether the [Ca++]i signal was the result of the sum of the ACh effect and the ADO effect. Or was a non-additive effect present? Figure 8 shows the results of a protocol that was identical to the previous superfusions. The superfusion of 100 μM ACh produced a bigger increase in the signal (0.380 RLU) than the superfusion signal (0.082 RLU) generated by 100μM ADO. When their two effects were added together, the Sum (0.477 RLU), not surprisingly, was greater than that of ACh. However, when ACh and ADO were both contained in the superfusing fluid, the increased [Ca++]i signal (0.631 RLU) was 132.3% of the Sum, significantly larger.
This prompted a study of whether or not ADO had some cholinergic effect besides its own direct A2A receptor-mediated effect. Since the cat GCs contain the α3, α4, and β2 subunits of the neuronal nicotinic receptor, hexamethonium (100μM) was used. Figure 9A shows the protocol for assessing the impact of ADO on the [Ca++]i signal in GCs with the neuronal nicotinic receptors blocked with 100 μM hexamthonium chloride. The value for the control (KRB + Hexamethonium) superfusion preceding the first superfusion with ACh + Hexamethonium was 0.625 RLU. The control value for the second, preceding the superfusion with ACh + ADO + Hexamthonium was 0.699 RLU. Control values after the ADO-containing superfusion were 0.738 RLU (ACh+Hex#3) and 0.777 RLU (ACh+Hex#4). These pre-stimulus control values differed significantly from each other. This was perhaps due to some nicotinic receptor-related factor. Hence, the maximum responses were first normalized to their own respective pre-stimulus control values (Fig.9B). Here the ACh+ADO+HEX was 96.3% of the firstACh+HEX superfusion (not significantly different); the third superfusion (ACh+HEX) was 81.7% of the first; and the last superfusion was 82.0% of the first. In Fig. 9C the increase was first normalized to its own pre-stimulus control value. The value for the first superfusion (0.760 RLU) is statistically indistinguishable for the second superfusion containing ADO (0.695RLU). Likewise superfusion #3 (0.448 RLU) is not distinguishable from superfusion #4 (0.443 RLU). This suggests that if ADO did have a cholinergic effect, it did not seem to operate via the nicotinic receptors.
Since the cat GCs also contain muscarinic receptors (M1 and M2; Shirahata, et al. 2004), atropine was used to test a possible muscarinic role for ADO. Figure 10A presents the protocol for this type of superfusion. Recording was extended out to 10 min (including the first part of the Rest period). In Figures 10B and 10C the protocol for ACh (4th superfusion) and for ACh + ADO (5th superfusion) is omitted since these protocols were used previously in the genesis of Figure 8. Figure 10B gives the maximum increase in this series of experiments where five superfusions were made, three with ADO, the second including the muscarinic blocker, atropine (1μM). The final two were made to see if ACh and ACh + ADO produced the same result as previously (Figure 8). When atropine was included (ADO#2+atropine), the [Ca++]i signal was significantly reduced to 94.7% of ADO#1. ADO#3 was significantly greater (102.8% of ADO#2+atropine), but still less than ADO#1 (97.0%). The superfusion with 100 μM ACh was 129.2% of ADO#3, and again ACh+ADO (100μM) was significantly larger at 115.9% of ACh. Once again the increases in the [Ca++]i signal show more clearly the effect of atropine (Fig. 10C). With atropine the increase was reduced to only 49.6% of ADO#1 and ADO#3 was 143.1% of the atropine-containing superfusion. The subsequent ACh superfusion increased the [Ca++]i signal to 412.6% of ADO#3; ACh+ADO was 153.2% of the [Ca++]i signal for the ACh superfusion. These last two superfusions suggested that the GCs in this series of experiments were responding as in previous experiments, and that a muscarinic cholinergic element seems to be involved in the [Ca++]i signal response to ADO.
Figure 11 presents the immunohistochemical positive signals for the A2A ADO receptor in the cat CB along with the negative control from a neighboring section. The preponderance of the positive signal seems to be localized in glomeruli (clusters of GCs). The other specks are difficult to identify. They could mark A2A presence on sensory afferent neurons coursing an undulating pathway through the CB, or single GCs in whole or in part.
Figures 1.
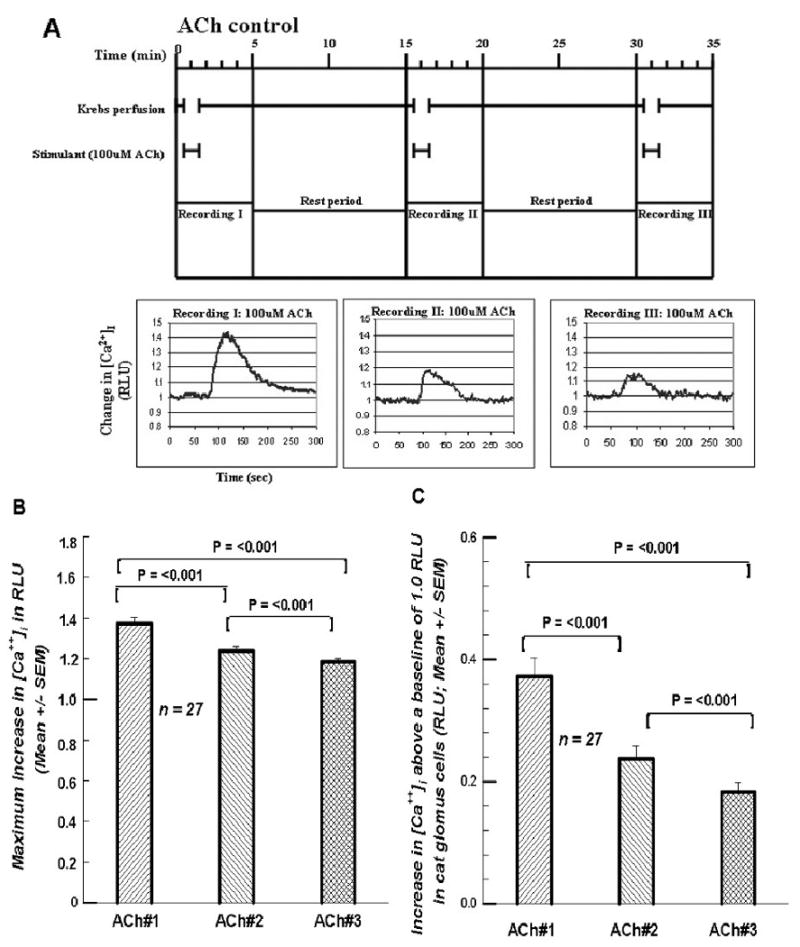
A. Top of figure shows paradigm for treating each cell. The Krebs perfusion is initiated and allowed to flow for 30 sec. At 30 sec the solution is switched to a Krebs solution containing 100 μM ACh which flows for 60 sec. At 90 sec the ACh-free Krebs starts again up to the 15 min mark. The cycle is then repeated. Recordings are taken for 5 min starting at time 0. Note time lag due to a voiding of the dead space volume in the perfusion plumbing. RLU = relative light units, indicative of intracellular calcium. Three successive exposures to 100 μM ACh generated decreasing RLU values (decreases in [Ca2+]i). 1B. Summary of the 27 cells investigated as in Figure 1A. The decline in [Ca2+]i over the three exposures is statistically significant. RLU-relative light units of intensity. 1C. Summary of the differences between the peak RLU value and the baseline value of 1.0. This value represents the increase due to the treatment. NOTE: Variability indices above all mean bars in the bar graphs of all figures (1-10) represent + 1 SEM.
Figures 2.
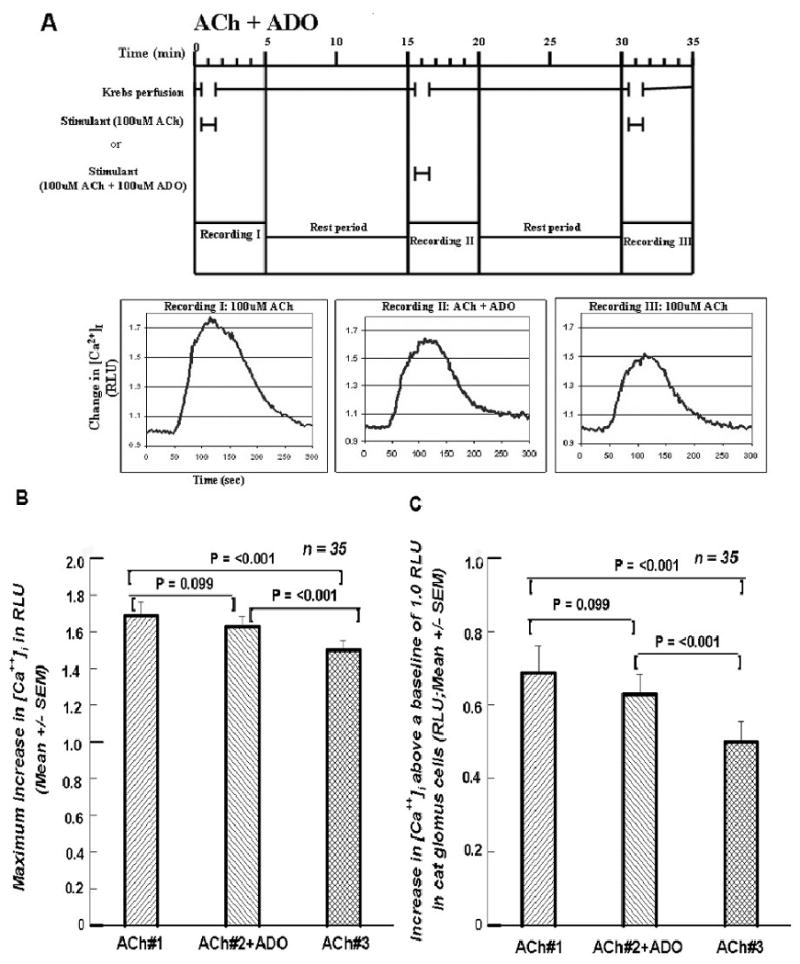
A. Format and paradigm same as in Figure 1A except that in the second exposure 100 μM of ADO was included with the 100 μM ACh. Compared to the second exposure in Figure 1A, the decline in [Ca2+]i in this second exposure seems to be much less. Cf. text. 2B. Summary of the 35 cells treated in the manner presented in Figure 2A. The decline in [Ca2+]i in the second challenge with the 100 μM ADO is not statistically significant, whereas the [Ca2+]i decline in the third exposure to ACh is significantly lower than either of the first two exposures. 2C. Summary of the increases between the peak RLU value above the baseline value of 1.0. As in Figure 2B the first two differences do not differ from each; both do from the third.
Figures 3.
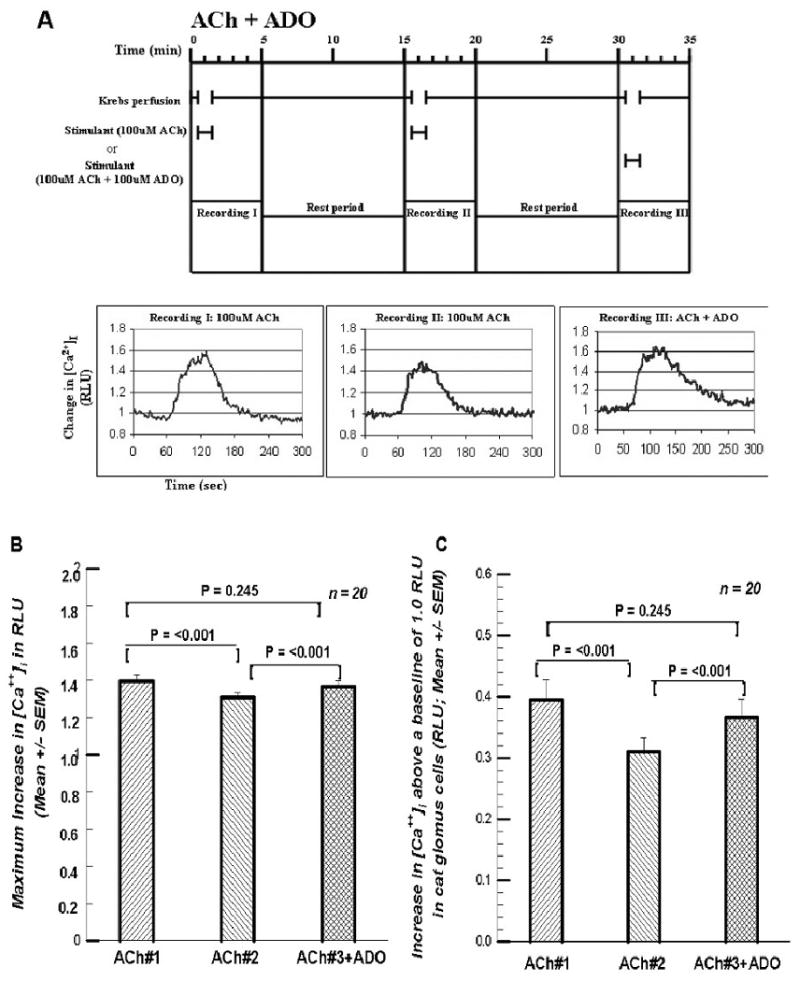
A. Format and paradigm same as in Figures 1A and 2A except that here the 100 μM ADO is provided in the third exposure to 100 μM ACh rather than in the second. [Ca2+]i in the third perfusion with 100 μM ACh seems to have regained the value of the first perfusion with ACh. Cf. text. 3B. Summary of the 20 cells treated in the manner of the cell presented in Figure 3A. There was a significant decline in the peak response of [Ca2+]i in the second exposure to KRB +ACh, but in the third exposure to 100 μM ACh along with the 100 μM ADO the peak response of [Ca2+]i was not significantly less than the first exposure to 100 μM ACh alone. 3C. Summary of the increases as in Figures 1C and 2C. The first and third increases are statistically indistinguishable.
Figures 4.
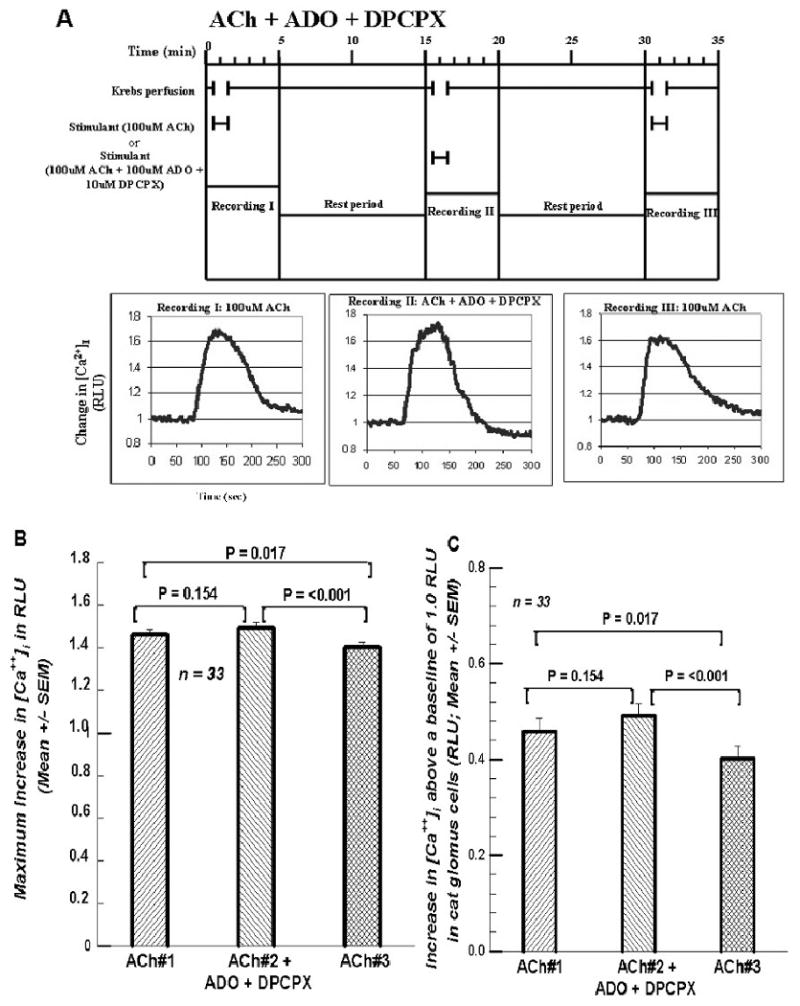
A. Format and paradigm same as in figures 1A, 2A, and 3A except that in the second exposure to 100 μM ACh both 100 μM ADO and 10 μM DPCPX, the A1 ADO receptor antagonist, were added. The peak responses of [Ca2+]i seem to be very similar. 4B. Summary of the 33 cells treated in the manner of the cell presented in Figure 4A. The maximum response of the [Ca2+]i with the inclusion of 100 μM ADO and 10 μM DPCPX was not significant. But the third exposure to ACh alone was significantly less than the first two. 4C. Summary of the increases between the peak RLU value above the baseline RLU value of 1.0. The first two differences are statistically indistinguishable; but both are significantly higher than the increase for ACh #3.
Figures 5.
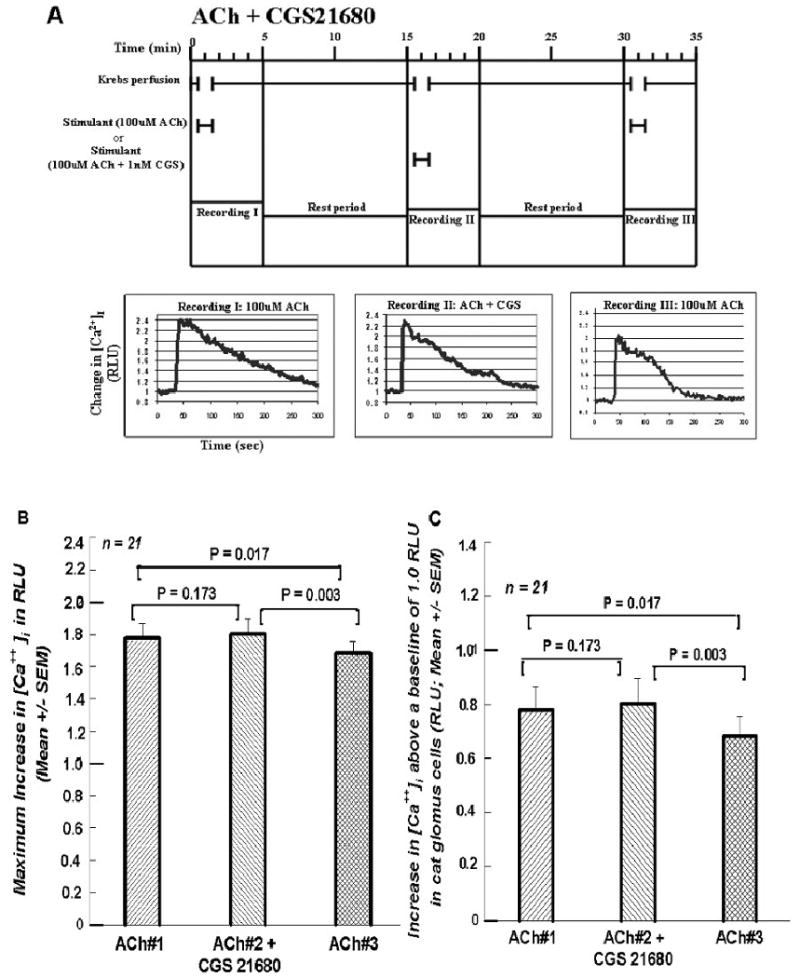
A. Format and procedure same as in Figures 1A, 2A, 3A, and 4A except that in the second exposure to 100 μM ACh 1nM CGS 21680, the A2A ADO receptor agonist, was included instead of ADO. 5B. Summary of the 21 cells treated in the manner of the cell presented in Figure 5A. The first two RLU responses to changes in [Ca2+]i were statistically indistinguishable. But in the third exposure to 100 μM ACh alone the peak RLU response was significantly less than the first two responses. 5C. Summary of the increases as in previous “C” plots.
Figures 6.
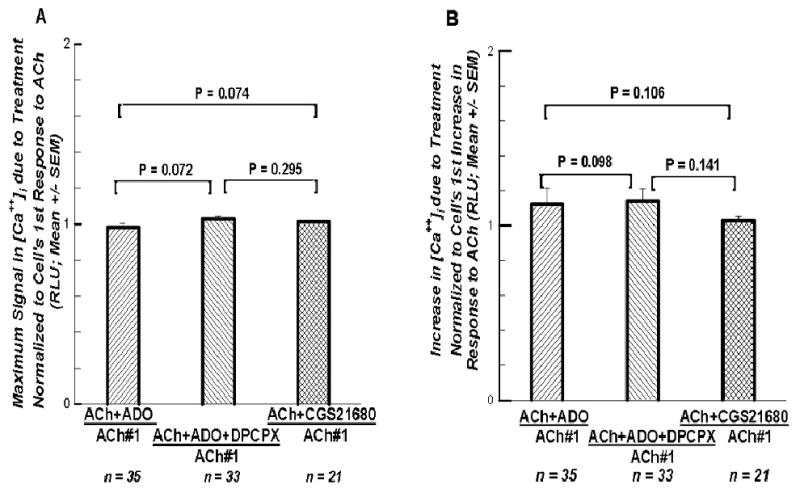
A. The maximum response to the second perfusion from three different sets of experiments are normalized, each to the maximum responses to their ACh#1 superfusions, in order to determine if there was any differences among the three ways of activating the A2A ADO receptor, or to see if the A1 ADO receptor had any impact. No significant differences among the three analyses suggests the A1 ADO receptor had no impact in this preparation. 6B. The increases in the response to the second perfusion from the same three different sets of experiments normalized each to its own increase seen in the first superfusion. Again no significant differences appear among these three analyses.
Figures 7.
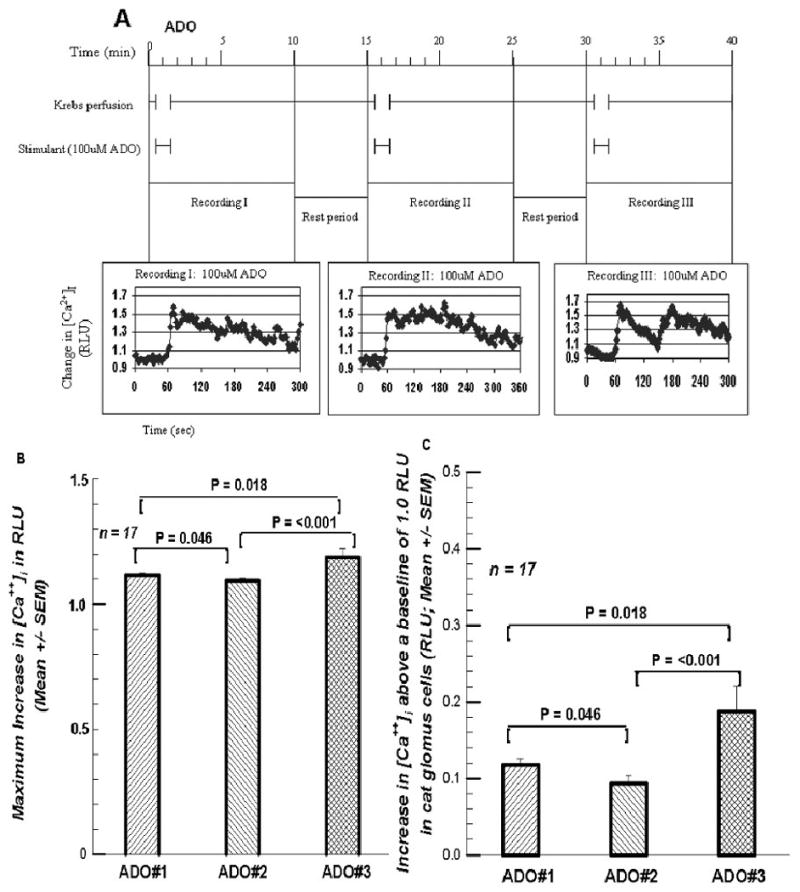
A. The protocol for three successive superfusions with 100 μM ADO, analogous to Figure 1A, the three successive superfusions of 100 μM ACh. 7B. presents the maximum response, revealing a significant increase in the [Ca++]i RLU signal in the third superfusion. 7C. presents the increases above baseline, showing more clearly the final increase in the RLU signal.
Figure 8.
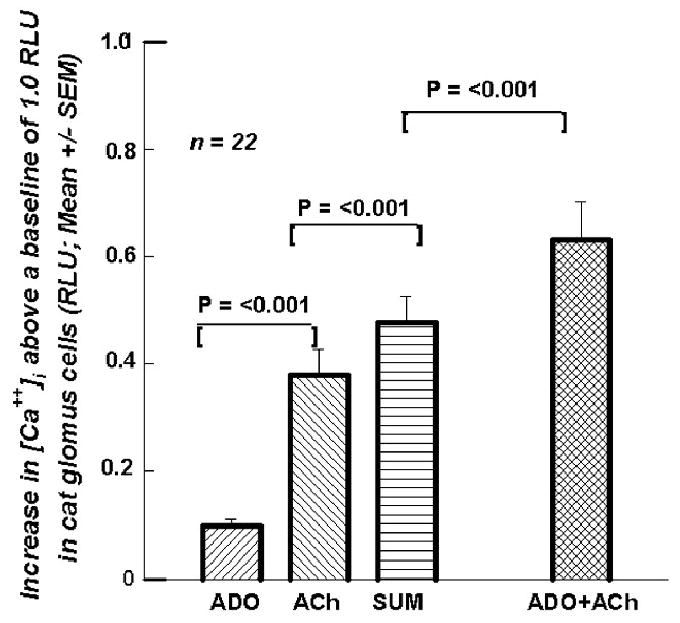
presents mean (+SEM; n=22) increase above baseline for a superfusion of ADO (0.083 RLU), for ACh (0.380 RLU), for the Sum of the two (0.477 RLU), and for the superfusion of ADO + ACh (0.631 RLU).
Figures 9.
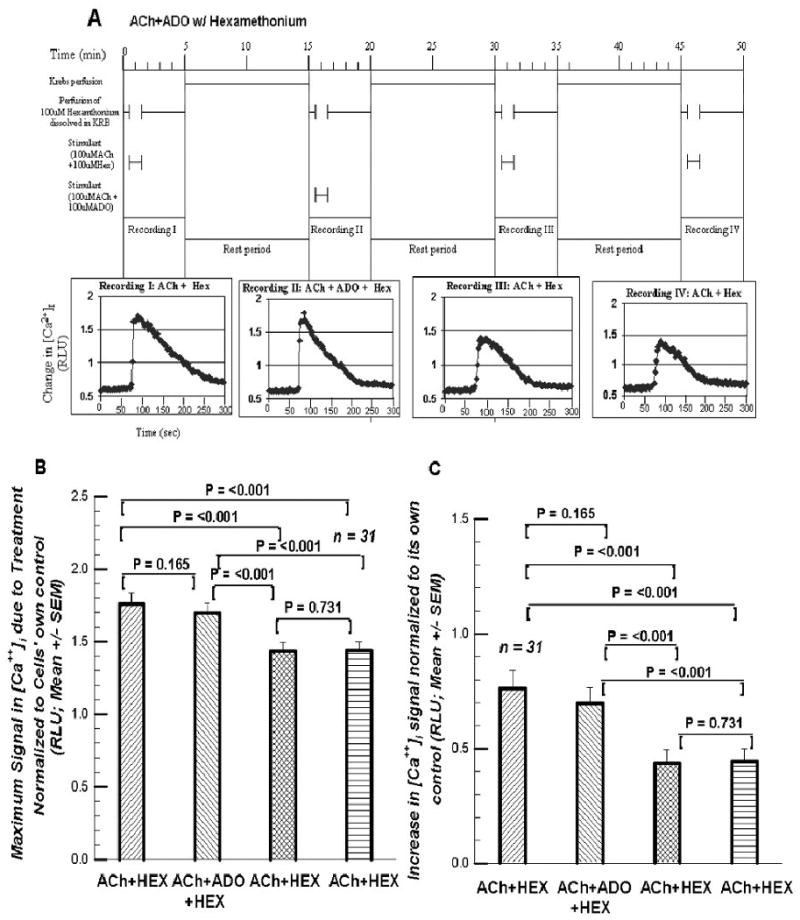
A. The protocol for the four superfusions involving 100 μM hexamethonium. 9B. presents the maximum RLU signal normalized to its preceding control value. Cf. Text. 9C. presents the increases in the RLU signal above its own control baseline.
Figures 10.
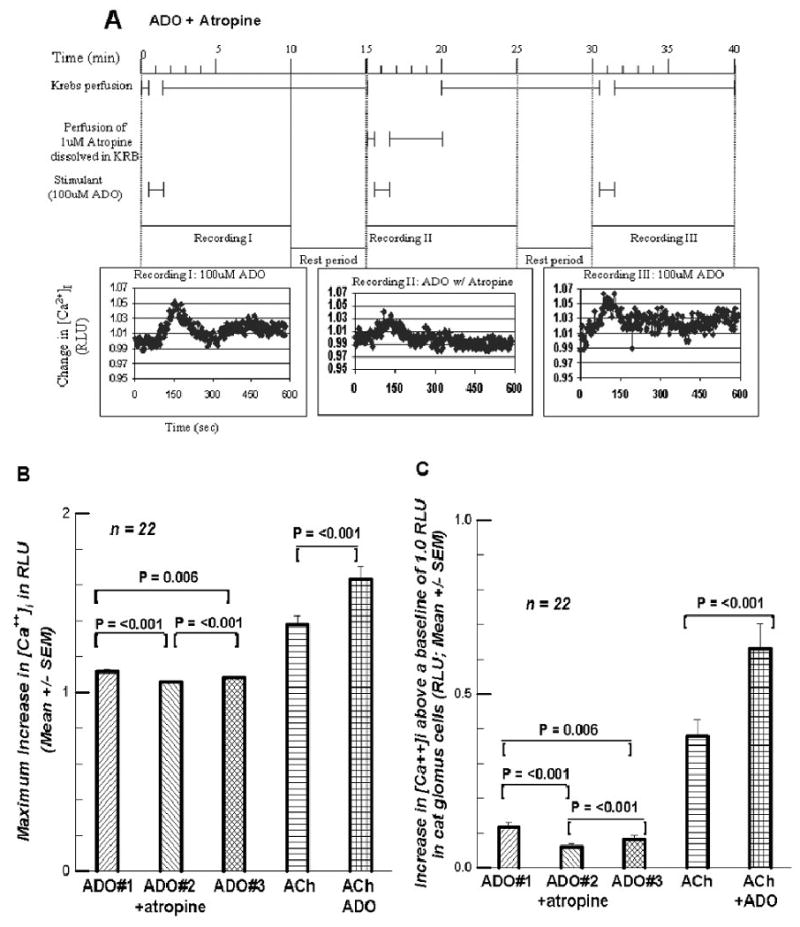
A. presents the protocol for the three supefusions containing 100 μM ADO with the second containing 1 μM atropine. The recording duration was extended. 10B. presents the maximum response of [Ca++]i to the three ADO-containing superfusions, as well as to subsequent perfusions of 100 μM ACh and of 100μM ACh + 100 μM ADO. 10C. presents the increases above the 1.0 RLU baseline for the five superfusions.
Figure 11.
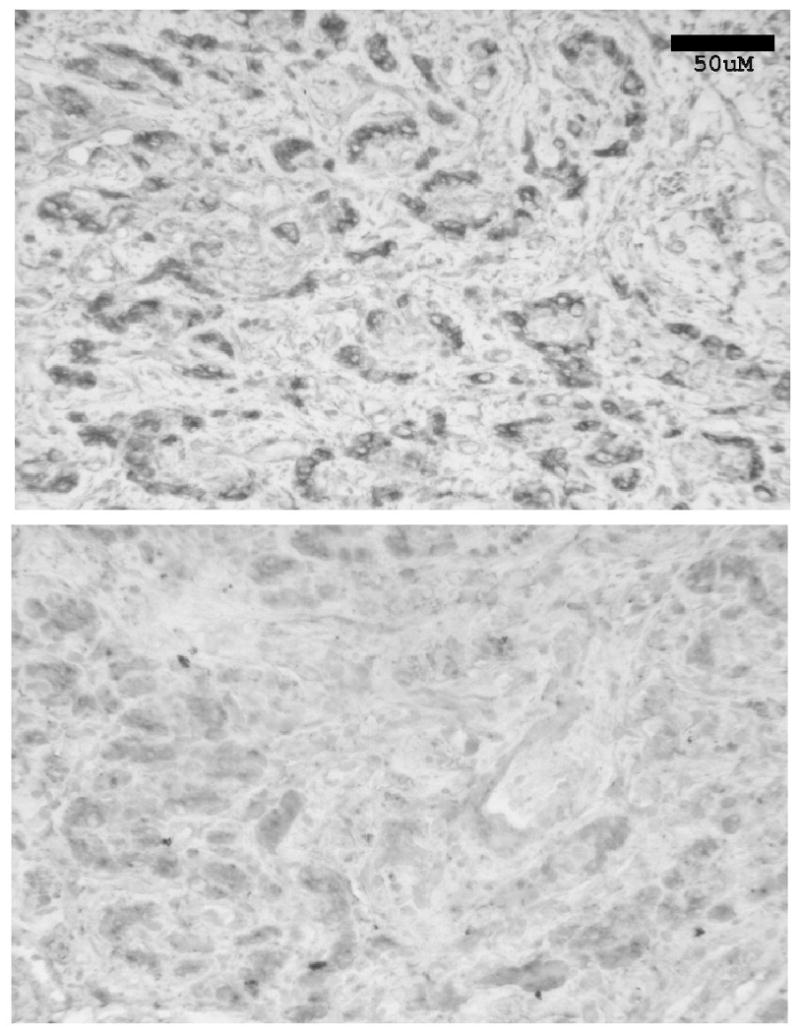
Top Panel. Section of the cat CB (4-5μm thick) demonstrating immunohistochemically the presence and location of the A2A ADO receptor on the glomus cells of the cat CB. The clustering of glomus cells in glomeruli is apparent. Bottom Panel. A section 80μm removed from the positive section, the negative control showing the results of incubating a CB slice with the A2A ADO receptor antibody which had been previously incubated with the antigen. Bar: 50μm.
3. Discussion
In summary and focusing on the questions presented in the Introduction: (1) Intermittent brief superfusions of GCs with 100 μM ACh produced an increase in [Ca++]i which deteriorated on each subsequent superfusion. The increase was not consistent in spite of an intervening 13.5 min of superfusion with Krebs solution. (2) Including 100 μM ADO with the 100μM ACh in the second superfusion abolished the decrease in the [Ca++]i signal. The response was indistinguishable from the first perfusion. If the ADO was included in the third ACh superfusion, the [Ca++]i signal was again returned to the size of the first ACh superfusion. (3) Because the A2A ADO receptor agonist, CGS 21680, had the same effect as ADO and blocking any A1 ADO receptor effect with DPCPX also produced the same effect as ADO, it seems reasonable to conclude that it is the A2A ADO receptors on the GCs which are mediating the effect of ADO in restoring the [Ca++]i signal strength to that of the original ACh superfusion. (4) The effect of three brief superfusions of 100 μM ADO on the [Ca++]i signal was quite the opposite of that generated by the three brief superfusions of 100 μM ACh; the second superfusion showed a small decrease in the signal (borderline significant; P=0.046) while the third superfusion significantly elevated the [Ca++]i signal. (5) The Sum of the increase in the [Ca++]i signal generated by ACh plus that generated by ADO was significantly less than the signal when the superfusion fluid contained both ACh and ADO. (6) This suggested the possibility that ADO might have an influence beyond that which was the result of ADO acting on the A2A receptor.
Ascribing with certainty a detailed, step-by-step mechanism responsible for the phenomena presented above is difficult since ADO receptors interact with so many other neurotransmitter systems potentially capable of elevating [Ca2+] i. For example, A2A ADO receptor interacts with other receptors (Ribeiro, 1999; Sebastiao, Ribeiro, 2000), including cholinergic nicotinic (Correia-de-Sa, Ribeiro, 1994) and muscarinic receptors (Oliveira, et al., 2002).
Curiously, ADO given with ACh in the second or third superfusion elevated the GCs' [Ca++]i signal back to the same level as the first ACh superfusion. The signal is statistically indistinguishable from the signal to the first ACh superfusion, neither more nor less. Since Giniatullin and his colleagues (Giniatullin, et al., 2005) had described α4β2 subunit- and α3β4 subunit-containing nicotinic receptors as being moderately or very prone to desensitization, and the cat CB GCs contains α3, α4, β2, and β4 subunits (Hirasawa, et al., 2002), we initially hypothesized that the effect of ADO was to attenuate or eliminate desensitization of the nicotinic receptors. The proposed mechanism for counteracting desensitization is based on a rise in [Ca++]i, followed by an activation of PKC and/or PKA which promotes recovery of the receptor (Giniatullin, et al., 2005). Some of our data was consistent with the possibility that the ADO was preventing any desensitization of the nicotinic receptors; ADO was simply restoring the GC to the initial status
On the other hand, hexamethonium would have taken the nAChRs out of the picture entirely. And ADO had the same impact on the [Ca++]i signal in the presence of hexamethonium as in the absence of hexamethonium, the drop in the signal post ADO. It would seem unlikely, then, that nAChR desensitization is involved since in this case they were blocked from the start. So ADO must be working on another system/pathway. However, ADO raised the GCs' [Ca++]i, and atropine significantly reduced the impact of ADO acting alone on the [Ca++]i signal. This suggested the possibility that ADO may exercise its cholinergic effect via a muscarinic pathway.
Kobayashi et al. (2000) using isolated GCs from the rat CB in whole cell voltage-clamp studies found that ADO inhibited the voltage-dependent Ca++ currents; the phenomenon was abolished by a selective A2A receptor antagonist. They also.showed that exogenously applied ADO significantly attenuated the hypoxia-induced increase in [Ca++]i.
However, Xu et al. (2006) found in the GCs of the rat that ADO, acting via the A2A ADO receptors, coupled to adenylate cyclase and the PKA pathway, reduced the background TASK-like K+ current to trigger depolarization and [Ca++]i rise. Perhaps this same system was functioning in the cat GCs.
But one could then ask why does atropine have the effect that it does on the ADO-generated [Ca++]i signal? If what happens in the rat GC also happens in the cat, then one could say that ADO acting on the A2A receptor depolarizes the GC, extracellular Ca++ enters, provoking the release of ACh which acts back on the GCs' M1 autoreceptors to release more ACh which acts on nicotinic autoreceptors. This enhances/prolongs the depolarization. More extracellular Ca++ enters. In the presence of atropine this second step is blocked.
Further, a process like this might also explain why ADO with ACh generates a larger [Ca++]i signal than the ADO signal summed with the ACh signal. The ADO-generated increase in [Ca++]i provokes the release of GC-contained ACh which, acting on GC M1 autoreceptors initiates a second influx of extracellular Ca++. Such a presynaptic influence by ADO on ACh release is consistent with the modulation by ADO of both muscarinic M1-facilitated and M2-inhibition of ACh release from rat phrenic nerve terminals (Oliveira et al., 2002).
Vandier and colleagues (Vandier, et al.,1999) suggest the possibility of a different mechanistic cascade altogether. They report that ADO inhibits 4-AP-sensitive K+ current in isolated type I cells of the rat CB. They observed that depolarization of Type I cells produced an outward current that was significantly decreased by 10 μM ADO. Zero calcium also decreased outward current, and zero calcium plus ADO reduced it even further. 4-AP abolished the effect of ADO. They thought it was the A2A ADO receptor which was involved. This receptor is widely accepted as being coupled to GS protein which stimulates adenylyl cyclase activity. Elevations in cAMP levels have been shown to decrease 4-AP-sensitive outward current. Hence ADO in the present study, acting on the A2A ADO receptor, may be acting to decrease outward flow of K+ through the channels, and promoting depolarization and an increase in [Ca 2+] i
A definitive mechanistic schema to explain the above results seems to require further experimentation, perhaps with different concentrations of ADO. To our knowledge, however, this report presents for the first time the negative impact of a muscarinic antagonist on the impact of ADO on the [Ca++]i signal in the rat or cat GCs.
Pursuing the interelationships among the transmitters and modulators in response to brief intermittent exposures to hypoxia or hypoxia plus hypercapnia might reveal some therapeutic strategies helpful in managing Obstructive Sleep Apnea, a condition in which apneic episodes can occur as frequently as 10-15 times per hour. And insofar as the CB is the sentinel arousing the OSA subject to capture a breath due to the hypoxic/hypercapnic-induced release of ACh (and ATP), with subsequent sensory nerve excitation, it is important to know that the presence of ADO from ATP breakdown or otherwise prevents the deterioration of ACh's effect on the GCs' [Ca++]i signal, an effect that may have a muscarinic component. The autocrine/paracrine action of the slower excitatory activity of serotonin release on the GCs would also be affected, as would be the modulating actions of GABA on the GCs.
4. Experimental Procedures
A. Tissue Collection and cell culture
The purpose-bred cats were purchased from Liberty Laboratory, and used for tissue harvesting as described below. All animal protocols were approved by the Animal Care and Use Committee of The Johns Hopkins University.
CBs were harvested from 3-4 month-old cats of either sex and GCs cultured. The method has been described previously (Shirahata, et al., 1994). In brief, each cat was anesthetized with ketamine (50mg/kg), and an intravenous injection of heparin (40mg) followed. The cat was then sacrificed with pentobarbital sodium (∼100mg/kg); the head was rapidly removed and the carotid arteries flushed with ice-cold L-15 media (Sigma). The CBs were isolated, cleaned of connective tissue, and washed with ice-cold L-15 media. A 45min incubation of the CBs in 0.2% collagenase (Sigma-Aldrich; a-Aldrich, P.O. Box 932594, Atlanta, GA 31193-2594; sigma-aldrich.com/order)) followed. This was followed by, and then replaced with, cell culture medium containing 1:1 mixture of Dulbecco's modified Eagle's medium and Ham's F-12 medium supplemented with bovine serum albumin, bovine transferring, bovine insulin, sodium selenite, 7s-nerve growth factor, and pyruvate (Sigma-Aldrich). The CBs were incubated for 1hr and gently triturated using 20-30G needles. The cells were divided into 7 wells which consisted of plastic cylinders (5mm in diameter) set on round cover slips (25mm in diameter). The cells were cultured in medium and kept in incubators (21% O2/5% CO2) at 37°C for more than 48hrs or until used in experiments.
B. Fluorescent imaging for [Ca2]i measurement
Cells cultured on a glass coverslip were incubated with Fura-w/AM (Molecular Probes; 2μM) for 90 min. The coverslip with cells was then moved to the recording chamber on an inverted microscope and washed for 5-10 min by superfusing Krebs solution at a flow of 1.5ml/minute. The composition of Krebs solution was (in mM): NaC1, 118; KC1, 4.7; CaCl2, 2.2; MgSO4-7H2O, 1.2; KH2PO4,1.2; NaHCO3, 25; EDTA, 0.0016; and glucose, 11.1; pH was 7.4 equilibrated with 5% CO2/air at 37°C. Every 2.5 sec images were collected through a 510 nm interference filter with a cooled CCD camera (Photometrics Tucson, AZ) during alternate excitations at 340 nm and 380 nm. A PC based computer and ImageMaster software (Photon Technology International Inc. Birmingham, NJ) were used for the acquisition of the data. Several cells or clusters in one frame were selected. After subtracting background (taken from the area without cells) data for each cell or cluster of cells was analyzed by averaging the fluorescent ratio values in all pixels within the selected field. Relative changes from the control value (defined as “1”) were used for describing [Ca2+]i changes.
During the 30 second control period preceding each challenge there were 12 such measurements; all were virtually identical with the initial ratio, 1, except when hexamethonium was used(cf. Fig. 1A). However, when the KRB containing 100 μM ACh was started at the 30 sec mark, there was, after the initial wash-out, a rapid rise in the ratio. The peak ratio was attained in approximately 2 min (the ACh-containing KRB perfusion was terminated at the 90 sec mark). Perfusion of ACh-free KRB started again and lasted for 3.5 min during which period the ratio values decreased toward the control level. The same ACh-free KRB perfusion was provided for the subsequent 10 min rest period and the ratio values hovered around the “1” value. Recording RLU values was sometimes extended. But provision of fluids followed a constant format. Immediately at the 15 min mark the process of control, ACh challenge, recovery was repeated. This was followed by a third ACh challenge. The experiments in which there were three successive 100 μM ACh challenges constituted the first group (n = 27). In a second group (n = 35) the initial 100 μM ACh challenge was followed by a second superfusion in which 100 μM ADO was included with the 100 μM ACh. In a third group (n = 20) the ADO was included in the third ACh challenge rather than the second ACh challenge. In a fourth group (n = 33) the standard 100 μM ACh challenge was followed by a second challenge in which the superfusion contained, in addition to the 100 μM ACh and 100 μM ADO, 10 μM of 1, 3 dipropyl-8-cyclopebntylxanthine (DPCPX), the ADO A1 receptor blocker. In a fifth group (n = 21) the second 100 μM ACh challenge contained, instead of ADO, 1 nM of 2-p-(2-carboxyethyl)phenethylamino-5′-N-ethylcarboxamido-adenosine hydrochloride (CGS 21680; Sigma-Aldrich), the ADO A2A receptor agonist. In a sixth group (n = 17) there were three successive 100 μM ADO challenges. In a seventh group (n = 22) an ADO challenge was followed by an ACh challenge and lastly by a challenge superfusion fluid containing both ADO and ACh. In an eighth group (n = 31) the impact of ADO on the GCs being perfused with ACh + hexamethonium. And lastly in a ninth group (n = 12) the effect of atropine on three superfusions of ADO was studied.
Data was recorded for 5 or more min. In each of the three ACh-challenge sequences in the five groups of experiments data was recorded for 5 min. Figures 1A, 2A, 3A, 4A, and 5A are recordings illustrating the emission intensity ratios over the course of the five minutes before, during, and after the ACh-containing superfusions. Peak ratios (maximum intensity in relative light units [RLU]) were selected from each of the three superfusions in each of the five groups. The mean values for the several experiments in each group were calculated, and are displayed as bar graphs in Figures 1B, 2B, 3B, 4B, and 5B (Mean [±SEM]). Since three or more measurements were made from the same cell or cluster of cells, the first test used to detect any differences was a One-Way Repeated Measures Analysis of Variance. This was followed by a Tukey Test. Subsequently a paired t-Test instrument was used when comparing the 1st superfusion with the 2nd or 3rd, or the 2nd with 3rd, etc.
Figures 1C, 2C, 3C, 4C, 5C show the increases in GC[Ca2+]i from the baseline of 1. They were included to visualize the differences more easily. Increases among the three ACh challenges were again determined with a One-Way Repeated Measures Analysis of Variance. If a significant difference was found, and All Pairwise Multiple Comparison Procedure (Tukey Test) was used to locate the difference(s). The paired t-Test procedure followed. The tools were provided by the Sigma Stat Package (Jandel Scientific Software, P.O. Box 7005, San Rafael, CA 94912-7005).
This same formula was followed for the data presented in Figures 7 (three superfusions with 100 μM ADO), 8 (for ACh, ADO, and ACh+ADO), 9 (the effect of hexamethonium), and 10 (the effect of atropine on the response to ADO). In Figures 9B (9C) the maximum signal (increase) was first normalized to the preceding pre-stimulus control when it was determined that these four control values were significantly different from each other, and not 1 as in the previous superfusions. The metanalysis presented in Figure 6 is explained in the text Results.
C. Immunohistological presentation of A2A ADO receptors
The carotid bodies were harvested as described above and immersed in zinc fixative, embedded in paraffin, sectioned at 4-5 μm thickness, and mounted on poly-L-lysine-coated slides. After deparaffinization, the sections were treated in boiling 10 mM citric acid buffer (pH 8.0) for 5 min to retrieve antigens (Shi, et al., 1997). The endogeneous peroxidase was quenched with 1% H2O2 in phosphate buffered saline (PBS). Endogenous biotin was blocked (avidin biotin-blocking kit: Vector Laboratories, CA.), and other nonspecific binding was blocked with normal goat serum (1:75) and casein (CAS block, Zymed Laboratories, CA). A polyclonal antibody against the A2A ADO receptor (Chemicon International, Temecula, CA 92590; dilution 1:100; made in the rabbit) was prepared in PBS containing 8% cat serum and 2% goat serum. These solutions were kept at 4° C for 24 hours before applying to the tissue sections. The tissues were incubated with either the treated anti-A2A ADO receptor antibody or the negative control solution overnight at room temperature followed by an application of biotinylated anti-rabbit IgG made in the goat (1:2,000) for 1 hr at room temperature. Subsequently, standard avidin-biotin peroxidase techniques were applied. As a chromogen, Vector SG (Vector) was used. Between each step, the slides were washed in 0.1M PBS.
Acknowledgments
The authors gratefully acknowledge support for this study from the National Institutes of Health, National Heart Lung Blood Institute, specifically awards HL 50712 and HL 61596.
Footnotes
Publisher's Disclaimer: This is a PDF file of an unedited manuscript that has been accepted for publication. As a service to our customers we are providing this early version of the manuscript. The manuscript will undergo copyediting, typesetting, and review of the resulting proof before it is published in its final citable form. Please note that during the production process errors may be discovered which could affect the content, and all legal disclaimers that apply to the journal pertain.
Literature References
- Correia-de-Sa P, Ribeiro JA. Tonic adenosine A2A receptor activation modulates nicotinic autoreceptor function at the rat neuromuscular junction. Eur J Pharm. 1994a;271:349–355. doi: 10.1016/0014-2999(94)90793-5. [DOI] [PubMed] [Google Scholar]
- Fitzgerald RS, Shirahata M, Wang HY, Jack, Balbir A, Chang I. The impact of adenosine on the release of acetylcholine, dopamine, and norepinephrine from the cat carotid body. Neurosc Lett. 2004;367:304–308. doi: 10.1016/j.neulet.2004.06.019. [DOI] [PubMed] [Google Scholar]
- Giniatullin R, Nistri A, Yakel J. Desensitization of nicotinic ACh receptors: shaping cholinergic signaling. Trends in Neurosc. 2005;28:371–378. doi: 10.1016/j.tins.2005.04.009. [DOI] [PubMed] [Google Scholar]
- Hirasawa S, Mendoza JA, Jacoby DB, Kobayashi C, Fitzgerald RS, Schofield B, Chandrasegaran S, Shirahata M. Diverse cholinergic receptors in the cat carotid chemosensory unit. Adv Exptl Med Biol. 2002;536:313319. doi: 10.1007/978-1-4419-9280-2_41. [DOI] [PubMed] [Google Scholar]
- Kobayashi S, Conforti L, Millhorn DE. Gene expression and function of adenosine A2A receptor in the rat carotid body. Am J Physiol Lung Cell Mol Physiol. 2000;279:L273–L282. doi: 10.1152/ajplung.2000.279.2.L273. [DOI] [PubMed] [Google Scholar]
- Monteiro EC, Ribeiro JA. Ventilatory effects of adenosine mediated by carotid body chemoreceptors in the rat. NaunynSchmied Arch Pharmacol. 1987;335:143–148. doi: 10.1007/BF00177715. [DOI] [PubMed] [Google Scholar]
- Oliveira L, Timoteo MA, Correia-de-Sa P. Modulation by adenosine of both muscarinic M1-facilitation and M2-inhibition of [3H]-acetylcholine release from the rat motor nerve terminals. Eur J Neurosc. 2002;15:1728–1736. doi: 10.1046/j.1460-9568.2002.02020.x. [DOI] [PubMed] [Google Scholar]
- Ribeiro JA. Adenosine A2A receptor interactions with receptors for other neurotransmitters and neuromodulators. Eur J Pharmacol. 1999;375:101–113. doi: 10.1016/s0014-2999(99)00230-7. [DOI] [PubMed] [Google Scholar]
- Sebastiao AM, Ribeiro JA. Fine-tuning neuromodulation by adenosine. TIPS. 2000;21:341–346. doi: 10.1016/s0165-6147(00)01517-0. [DOI] [PubMed] [Google Scholar]
- Shi SR, Cote RJ, Taylor CR. Antigen retrieval immunohistochemistry: past, present, and future. J Histochem Cytochem. 1997;45:327–343. doi: 10.1177/002215549704500301. [DOI] [PubMed] [Google Scholar]
- Shirahata M, Schofield B, Chin BY, Guilarte TR. Culture of arterial chemoreceptor cells from adult cats in defined medium. Brain Res. 1994;658:60–66. doi: 10.1016/s0006-8993(09)90011-7. [DOI] [PubMed] [Google Scholar]
- Shirahata M, Hirasawa S, Okumura M, Mendoza JA, Okumura A, Balbir A, Fitzgerald RS. Identification of M1 and M2 muscarinic acetylcholine receptors in the cat carotid body chemosensory system. Neurosc. 2004;128:635–644. doi: 10.1016/j.neuroscience.2004.06.068. [DOI] [PubMed] [Google Scholar]
- Vandier C, Conway AE, Landauer RC, Kumar P. Presynaptic action of adenosine on a 4-aminopyridine-sensitive current in the rat carotid body. J Physiol. 1999;515:419–429. doi: 10.1111/j.1469-7793.1999.419ac.x. [DOI] [PMC free article] [PubMed] [Google Scholar]
- Xu F, Xu J, Tse FW, Tse A. Adenosine stimulates depolarization and rise in cytoplasmic [Ca2+] in type I cells of rat carotid bodies. AJPCellPhysiol. 2006;290:C1592–C1598. doi: 10.1152/ajpcell.00546.2005. [DOI] [PubMed] [Google Scholar]


