

Abstract
With respect to functional mapping of gene expression signatures, the steady-state mRNA expression level does not always accurately reflect the status of critical signaling proteins. In these cases, control is exerted at the epigenetic level of recruitment of mRNAs to polysomes, the factories of ribosomes that mediate efficient translation of many cellular messages. However, to date, a genome-wide perspective of the effect of carcinogen and chemoprotective bioactive diets on actively translated (polysomal) mRNA populations has not been performed. Therefore, we utilized an established colon cancer model, i.e., the azoxymethane (AOM)-treated rat, in combination with a chemoprotective diet extensively studied in our laboratory, i.e., n-3 polyunsaturated fatty acids (PUFA), to characterize the molecular processes underlying the transformation of normal colonic epithelium. The number of genes affected by AOM treatment 10 wk after carcinogen injection was significantly greater in the polysome RNA fraction compared with the total RNA fraction as determined using a high-density microarray platform. In particular, polysomal loading patterns of mRNAs associated with the Wnt-beta catenin, phospholipase A2-eicosanoid and the MAP kinase signaling axes were significantly up-regulated at a very early period of tumor development in the colon. These data indicate that translational alterations are far more extensive relative to transcriptional alterations in mediating malignant transformation. In contrast, transcriptional alterations were found to be more extensive relative to translational alterations in mediating the effects of diet. Therefore, during early stage colonic neoplasia, diet and carcinogen appear to predominantly regulate gene expression at multiple levels via unique mechanisms.
Keywords: Polysomes, Translation alterations, Gene expression profiling, Azoxymethane
Introduction
Total steady-state messenger RNA (mRNA) levels have utility in the prediction of the expression levels of an array of proteins. However, in many cases the steady-state mRNA expression level does not accurately reflect the expression rate of proteins. This is especially relevant in the case of Ras transformed cells (1-4). Because prolonged activation of p21 Ras drives colonic tumor development (5), it is likely that translational regulation plays an important role in the control of colonic gene expression during malignant transformation.
It has been recently reported that several tumor suppressors and proto-oncogenes can influence the formation of the mature ribosome or regulate the activity of translation factors (6, 7). Traditionally, the differential mobilization of mRNAs onto polyribosomes has been utilized to identify genes whose transcripts are translationally controlled (8). Translational control has been verified by demonstrating the redistribution of mRNAs on polysome gradients at various stages of colon tumor cell line transformation (3). Recently, Provenzani and colleagues (9), using SW480 colon carcinoma cells and their relative, lymph node mestastasis SW620 cells, demonstrated that the colorectal cancer genome acquires changes impacting by far the translational more than the transcriptional control of gene expression. These changes would have been completely missed in a conventional transcriptosome analysis detecting cellular mRNAs irrespective of their degree of polysomal loading.
Although the analysis of cancer cells in tissue culture is informative, it is possible that this model system may not accurately represent the state of cancer cells in vivo. Therefore, we have applied a systems biology approach to the characterization of gene expression changes occurring during carcinogen-induced colon tumorigenesis. Specifically, to take full advantage of the polysomal isolation method, we have combined ribosome-free and polysome-bound mRNAs with an open, high throughput quantitative mRNA analysis detection platform that simultaneously measures and identifies existing mRNA species in order to provide a panoramic overview of gene expression at both the total transcript and post-transcriptional levels. To our knowledge, the effect of a colon-specific carcinogen on the pattern of existing mRNAs that are recruited to polysomes has never been attempted in vivo.
With respect to environmental risk factors, there is growing evidence that long-chain n-3 PUFA, e.g., eicosapentaenoic acid (EPA) and docosahexaenoic acid (DHA), suppress colon cancer risk in humans (10-11). Recently, we have demonstrated that chemoprotective n-3 PUFA reprogram genetic signatures during colon cancer initiation and progression and reduce colon tumor formation (12). Therefore, we further investigated whether n-3 PUFA modulate the levels of actively translated mRNAs in colonic mucosa following carcinogen exposure.
Material and Methods
Animals
Sixty-four 8 wk old male Sprague Dawley rats (Harlan, Houston, TX) were acclimated for two weeks in a temperature and humidity controlled facility on a 12-hour light/dark cycle. The animal use protocol was approved by the University Animal Care Committee of Texas A&M University. The study was a 2 × 2 × 2 factorial design with two types of dietary fat (n-6 PUFA or n-3 PUFA), two types of dietary fiber (cellulose or pectin) and two treatments (injection with the colon carcinogen, AOM, or with saline). Animals (n=6-9 per group) were stratified by body weight after the acclimation period so that mean initial body weights were not different between groups. Body weight was monitored throughout the study.
Diets
After a 1-wk acclimation on standard pelleted diet, rats were assigned to one of four diet groups which differed in the type of fat and fiber as previously described (13). Diets contained (g/100 g diet): dextrose, 51.00; casein, 22.40; D,L-methionine, 0.34; AIN-76 salt mix, 3.91; AIN-76 vitamin mix, 1.12; choline chloride, 0.13; pectin or cellulose, 6.00. The total fat content of each diet was 15% by weight with the n-6 PUFA diet containing 15.0 g corn oil/100 g diet and the n-3 PUFA diet containing 11.5 g fish oil/100g diet plus 3.5 g corn oil/100 g diet as previously described (12).
Carcinogen treatment
After 2 wk on the experimental diets, 9 rats per diet group received injections of saline (control) and 9 rats per diet group received injections of AOM (Sigma, St. Louis, MO) s.c. at 15 mg/kg body weight. Rats received a second AOM or saline injection one week later and were terminated 10 wk after the first injection.
Polysome and total RNA isolation
Upon termination, each colon was cut open longitudinally, flushed clean with PBS, 1 cm from the distal colon was collected for fixation and embedding for immunohistochemical assays, an adjacent cm was taken for total RNA isolation and the remainder of the colon was used for polysome RNA isolation. For total RNA isolation, epithelial cells were scraped from the underlying muscle layer with a glass microscope slide, homogenized on ice in lysis buffer (mirVana miRNA Isolation Kit, Ambion, Austin, TX), and frozen at -80°C until RNA was isolated. Using the mirVana kit, total RNA enriched with microRNA was isolated followed by DNase treatment. For polysome RNA isolation, colons were incubated for 5 min at room temperature in PBS containing 100 μg/ml cycloheximide, an inhibitor of translation which locks the mRNA/ribosome complex, facilitating its isolation and preventing RNA degradation. Following incubation, epithelial cells were scraped with a microscope slide on a chilled glass plate and immediately processed according to the procedure of Ju et al. (14). Briefly, epithelial cells were allowed to swell in LSB (20 mM Tris pH 7.5, 10 mM NaCl and 3 mM MgCl2) containing 1 mM dithiothreitol and 50 U RNase inhibitor for 2 min followed by lysis in LSB containing 0.2 M sucrose and 1.2% Triton X-100. After removal of nuclei by centrifugation, the supernatant was layered over a 15-50% linear sucrose gradient (in LSB) and centrifuged at 247,000 × g for 2 h at 4°C in a swinging bucket rotor. Gradients were fractionated using a pipette, an aliquot was taken for absorbance at 254 nm and 3 vol denaturation solution (Ambion Totally RNA kit) was immediately added to the remainder of each fraction. Samples were frozen at -80°C until RNA was isolated using the Totally RNA kit as per manufacturer's instructions followed by DNase treatment. Both total RNA and polysome RNA were analyzed on an Agilent Bioanalyzer to assess RNA integrity. In select experiments, 10 mM EDTA was added to the post nuclear supernatant in order to examine the shift in elution due to disruption of polyribosome formation by EDTA.
Microarray
CodeLink™ rat whole genome bioarrays (Applied Microarray, Tempe, AZ) were used to assess gene expressionp. For total RNA arrays, the Ambion MessageAmp II-Biotin Enhanced aRNA amplification kit was used to prepare labeled cRNA. For polysome arrays, the Ambion MessageAmp II aRNA amplification kit followed by the MessageAmp II-Biotin Enhanced aRNA amplification kit were used with two rounds of in vitro transcription (IVT) to generate labeled cRNA. For both total RNA and polysome RNA, 10 μg of biotin-labeled cRNA was hybridized to the CodeLink genome array following manufacturer's instructions (12). Slides were scanned with an Axon GenePix 4000B scanner.
Immunohistochemistry
At necropsy, a one cm section of distal colon was removed, fixed in 4% paraformaldehyde for 4 h, and paraffin embedded. Following antigen retrieval in 1X TE containing 0.05% Tween-20 brought to a boil and maintained at sub-boiling temperature for 10 min in a microwave, followed by cooling on the bench for 30 min, sections were treated with 3% hydrogen peroxide in methanol for 15 min to quench endogenous peroxidase activity. Sections were then processed using rabbit eIF4E (Cell Signaling Technology, Danvers, MA) at 1:100 or rabbit phopho-eIF4E (Cell Signaling) at 1:7 to quantify in situ eIF4E and phosphorylated eIF4E staining as previously described (13). Images were quantified using NIS Elements software (Nikon) by collecting staining intensity at the base, middle and top of at least 20 crypts per animal, 8 animals per treatment group (AOM or saline).
Statistics and pathway analysis
Polysome and total RNA expression data were analyzed using GenMapp (www.genmapp.org) and GO (www.geneontology.org) and the approaches described below using the R computation platform (http://www.R-project.org). Raw data were first normalized through a robust procedure that eliminates the intensity-based chip-by-chip bias and reduces the between-chip variation and the potential outlier-effects. Robust local median estimation was applied to all observations from chips of the same treatment and potential outlying observations identified (15). A within-treatment quantile-normalization was then applied to all non-outlying observations (16). An alternative of replacing the within-treatment target distribution in quantile-normalization by the cross-all-chip method was also investigated; testing outcomes remained unchanged between the two alternatives. Mixed-effect ANOVA was applied to normalized logarithm based 2 transformed data to obtain p-values, q-values, and positive false discovery rate (17). Significant genes for the AOM vs saline as well as diet comparisons were identified. Genes that met the criteria of q-value <0.05 were submitted to GenMapp and GO for pathway profiling.
Results
Whole genome polysomal profiles
Colonic mucosa polysome isolation was monitored by examining sucrose gradient fractions on an Agilent Bioanalyzer. As shown in Figure 1, the top of the gradient contained small ribonuclear proteins (region A). Through the remainder of the gradient, the progression to heavier particles was seen first with the elution of the 40S (B) then 60S (C) ribosomal subunits, followed by 80S ribosomes (D) and finally polysomes (E), which eluted as a broad area due to mRNA transcripts loaded with varying numbers of ribosomes. The entire broad region in the second half of the gradient, excluding the final fraction containing RNA granules (18), was collected as the polysome fraction. Addition of EDTA to the sample prior to gradient fractionation resulted in the expected shift away from the bottom of the gradient due to the disruption of polysome and 80S ribosome formation (Supplemental Figure 1).
Figure 1. Isolation of polysomes by sucrose gradient centrifugation.
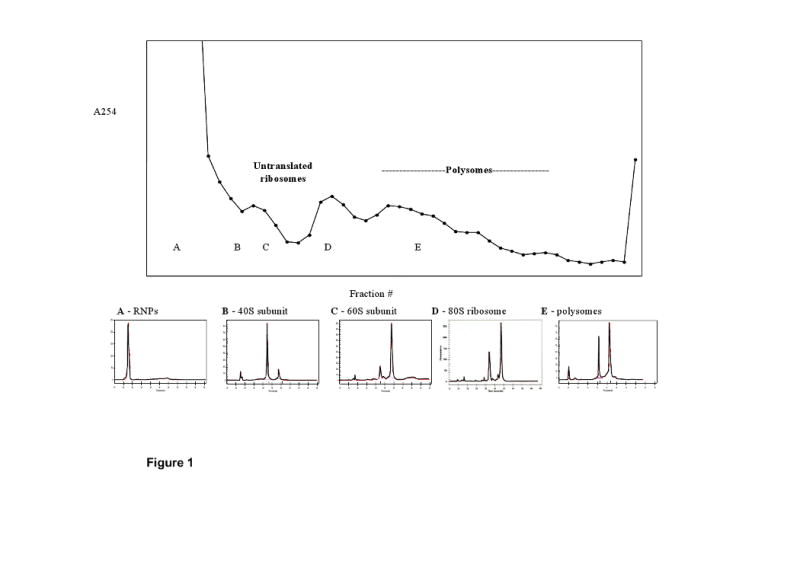
Colonic mucosal cells were lysed and post-nuclear supernatants layered onto 15-50% linear sucrose gradients. Following centrifugation, fractions were analyzed by absorbance at 254 nm and RNA was isolated. Select fractions were analyzed by Agilent Bioanalyzer and identified as (A) small ribonuclear protein complexes, (B) 40S ribosomal subunit, (C) 60S ribosomal subunit, (D) 80S ribosomes, and (E) polysomes.
Carcinogen-induced changes in gene expression differentially affect recruitment of mRNAs to polysomes
Polysome analysis and microarray technology was utilized to assess the impact of a colon-specific carcinogen (azoxymethane) on global mRNA polysome recruitment. Total and polysomal mRNA from scraped colonic mucosa were isolated, processed and hybridized using the Codelink™ (Applied Microarray) microarray platform. The number of genes affected by AOM treatment 10 wk after carcinogen treatment was significantly (p<0.05) greater in the polysome RNA fraction compared with the total RNA fraction. As shown in Figure 2A, 3,239 genes were significantly altered (p<0.05) by AOM vs saline treatment in the polysome RNA fraction. In contrast, the total RNA fraction resulted in only 69 unique genes affected by the AOM treatment. There were 233 genes significantly (p<0.05) affected by the carcinogen treatment identified in both the polysome and total RNA fractions. These data indicate that translational alterations were more extensive (11.5-fold higher) relative to transcriptional alterations in mediating malignant transformation.
Figure 2.


(A) Number of genes significantly affected by treatment with AOM compared to saline (control) in polysome and total RNA fractions. Polysomes were isolated from colonic mucosa by sucrose gradient centrifugation followed by RNA isolation from the polysome fraction. Total RNA was also isolated from the same animals (n=6-9). Following microarray analysis, genes expressed differentially (p<0.05) between the AOM and saline treated rats were compared in the polysome and total RNA fractions. (B) Effect of carcinogen on various biological process gene categories. Data are expressed as the percent of AOM affected genes (p<0.05) in a biological process category for the polysome fraction divided by the percent of genes for the total RNA fraction.
Analysis of translationally activated genes in colonic mucosa
Since an increase in polysomal RNA can reflect changes in mRNA abundance and/or translatability, the relative translatability of each differentially (AOM vs saline) expressed mRNA was calculated. Specifically, data were normalized to determine the change in abundance in polysomal RNA relative to the change in abundance in total RNA for each mRNA (polysome/total) (19). Table 1A shows that 35 genes were translationally enhanced following carcinogen exposure, i.e., polysome-associated mRNAs were enriched in AOM vs saline treated animals. We have defined translationally enhanced mRNAs as those that are significantly increased in AOM polysomes by 30% or greater (poly/total ratio >1.3, p<0.05). These mRNAs are present on polysomes to a greater extent than can be explained by increases in total mRNA abundance alone. Notable genes maintained on polysomes included CD47, involved in regulating neutrophil transepithelial migration (20); phosphatidylinositol-glycan biosynthesis class S protein (PIGS), essential for the transfer of GPI to proteins (21); cyclin G1, associated with G2/M phase arrest in response to DNA damage (22); and SMAD4, a tumor suppressor gene implicated in intestinal cell cycle regulation (23). Our analysis also identified 8 genes (Table 1B) that were reduced by 30% or greater (poly/total ratio <0.7, p<0.05) in AOM vs saline-injected rats. Of interest is the observation that several of these genes are associated with immune response. Among these were C-C motif chemokine 17 (CCL17) (24), Best5 (25), and CXC chemokine ligand (CXCL9) (26).
Table 1A. Translationally up-regulated genes significantly affected by carcinogen exposure.
Abundance of mRNAs in polysome and total RNA fractions in AOM vs saline treatment was quantified by microarray analysis. Translatability index was calculated as the fold change in polysome RNA ratio (AOM/saline) over fold change in total RNA ratio. Genes shown have a translatability index of 1.3 or greater and a false discovery rate < 0.05.
| NCBI Accession # | Polysome RNA AOM/saline | Total RNA AOM/saline | Translatabilit y Index | Polysome RNA p-value | Total RNA p-value | Gene Description |
|---|---|---|---|---|---|---|
| NM_019195 | 2.09 | 1.26 | 1.66 | 1.78E-03 | 4.88E-02 | CD47 antigen (Rh-related antigen, integrin-associated signal transducer) (Cd47) |
| NM_012571 | 1.95 | 1.18 | 1.65 | 4.76E-04 | 2.10E-03 | glutamate oxaloacetate transaminase 1 (Got1) |
| NM_001006602 | 1.78 | 1.11 | 1.60 | 7.27E-06 | 1.68E-02 | phosphatidylinositol glycan, class S (Pigs) |
| NM_012923 | 1.81 | 1.17 | 1.55 | 3.29E-03 | 2.39E-02 | cyclin G1 (Ccng1) |
| NM_019275 | 1.76 | 1.14 | 1.54 | 1.14E-03 | 4.75E-02 | MAD homolog 4 (Drosophila) (Madh4) |
| NM_080907 | 1.75 | 1.15 | 1.52 | 1.72E-04 | 4.47E-02 | protein phosphatase 4, regulatory subunit 1 (Ppp4r1) |
| NM_001079889 | 1.73 | 1.14 | 1.51 | 6.91E-05 | 3.36E-02 | selenophosphate synthetase 2 (Sephs2) |
| NM_001006970 | 1.67 | 1.12 | 1.49 | 7.73E-04 | 4.03E-02 | ubiquinol-cytochrome c reductase core protein II (Uqcrc2) |
| NM_017030 | 1.81 | 1.22 | 1.48 | 1.74E-04 | 4.12E-02 | propionyl coenzyme A carboxylase, beta polypeptide (Pccb) |
| NM_022536 | 1.59 | 1.09 | 1.46 | 4.34E-04 | 2.23E-02 | peptidylprolyl isomerase B (Ppib) |
| NM_175597 | 1.58 | 1.10 | 1.44 | 1.96E-04 | 1.28E-02 | synovial sarcoma, X breakpoint 2 interacting protein (Ssx2ip) |
| NM_022390 | 1.62 | 1.13 | 1.43 | 1.50E-04 | 1.46E-02 | quinoid dihydropteridine reductase (Qdpr) |
| NM_001006989 | 1.56 | 1.11 | 1.41 | 3.33E-03 | 4.88E-02 | scotin (MGC94600) |
| NM_001013197 | 1.61 | 1.15 | 1.40 | 1.84E-03 | 2.78E-02 | serine/threonine kinase 19 (Stk19) |
| NM_022512 | 1.58 | 1.12 | 1.40 | 2.45E-03 | 5.95E-03 | acyl-coenzyme A dehydrogenase, short chain (Acads) |
| NM_001009399 | 1.60 | 1.14 | 1.40 | 1.78E-03 | 3.86E-03 | NAD(P) dependent steroid dehydrogenase-like (Nsdhl) |
| NM_207591 | 1.72 | 1.23 | 1.39 | 1.23E-03 | 2.39E-02 | glioma tumor suppressor candidate region gene 2 (Gltscr2) |
| NM_024392 | 1.55 | 1.12 | 1.38 | 2.27E-04 | 1.03E-02 | hydroxysteroid (17-beta) dehydrogenase 4 (Hsd17b4) |
| NM_012914 | 1.55 | 1.12 | 1.38 | 4.08E-04 | 2.20E-02 | ATPase, Ca++ transporting, ubiquitous (Atp2a3) |
| NM_031328 | 1.62 | 1.18 | 1.38 | 1.48E-02 | 4.08E-02 | B-cell CLL/lymphoma 10 (Bcl10) |
| NM_054004 | 1.53 | 1.11 | 1.37 | 1.56E-03 | 3.17E-02 | TBP-interacting protein 120A (Tip120A) |
| NM_001013046 | 1.50 | 1.09 | 1.37 | 1.83E-05 | 9.17E-03 | RAB35, member RAS oncogene family (Rab35) |
| NM_019163 | 1.67 | 1.22 | 1.37 | 1.63E-03 | 2.52E-02 | presenilin 1 (Psen1) |
| NM_017050 | 1.63 | 1.20 | 1.36 | 5.32E-03 | 4.31E-02 | superoxide dismutase 1 (Sod1) |
| NM_001012152 | 1.49 | 1.11 | 1.34 | 1.60E-03 | 4.83E-02 | TBC1 domain family, member 14 (Tbc1d14) |
| NM_053556 | 1.50 | 1.12 | 1.34 | 3.43E-03 | 3.68E-04 | maternal G10 transcript (G10) |
| NM_001008328 | 1.60 | 1.20 | 1.34 | 8.00E-04 | 1.36E-02 | poly (ADP-ribose) polymerase family, member 3 (Parp3) |
| NM_031146 | 1.57 | 1.18 | 1.33 | 5.28E-04 | 2.14E-02 | actin related protein 2/3 complex, subunit 1A (Arpc1a) |
| NM_053527 | 1.46 | 1.10 | 1.33 | 1.74E-04 | 3.08E-03 | cell division cycle 5-like (S pombe) (Cdc5l) |
| NM_001007731 | 1.61 | 1.21 | 1.33 | 8.80E-03 | 2.33E-02 | golgi autoantigen, golgin subfamily a, 7 (Golga7) |
| NM_022281 | 1.62 | 1.22 | 1.33 | 7.27E-04 | 1.54E-02 | ATP-binding cassette, sub-family C (CFTR/MRP), member 1 (Abcc1) |
| NM_001008519 | 1.54 | 1.17 | 1.31 | 7.45E-03 | 1.36E-02 | leucine-rich PPR-motif containing (Lrpprc) |
| NM_024374 | 1.64 | 1.25 | 1.31 | 6.81E-03 | 4.16E-02 | myotrophin (Mtpn) |
| NM_138896 | 1.54 | 1.18 | 1.31 | 8.24E-04 | 3.00E-02 | praja 2, RING-H2 motif containing (Pja2) |
| NM_001013097 | 1.49 | 1.14 | 1.30 | 3.78E-04 | 4.88E-02 | ribonuclease H1 (Rnaseh1) |
Table 1B. Translationally down-regulated genes significantly affected by carcinogen exposure.
Abundance of mRNAs in polysome and total RNA fractions in AOM vs saline treatment were quantified by microarray analysis. Translatability index was calculated as the fold change in polysome RNA ratio (AOM/saline) over fold change in total RNA ratio. Genes shown have a translatability index of 0.7 or less and a false discovery rate < 0.05.
| NCBI Accession # | Polysome RNA AOM/saline | Total RNA AOM/saline | Translatabilit y Index | Polysome p-value | Total RNA p-value | Gene Description |
|---|---|---|---|---|---|---|
| NM_013069 | 1.22 | 1.76 | 0.70 | 2.01E-02 | 7.95E-03 | CD74 antigen (invariant polpypeptide of major histocompatibility class II antigen-associated) (Cd74) |
| NM_001004273 | 1.17 | 1.71 | 0.68 | 4.82E-02 | 1.14E-02 | zinc finger protein 403 (Znf403) |
| NM_173840 | 1.22 | 1.83 | 0.67 | 3.70E-02 | 2.31E-02 | Williams-Beuren syndrome chromosome region 5 homolog (human) (Wbscr5) |
| NM_138881 | 1.54 | 2.35 | 0.66 | 3.16E-03 | 1.81E-02 | Best5 protein (Best5) |
| NM_138913 | 1.56 | 2.68 | 0.58 | 8.72E-06 | 0.00E+00 | 2′,5′-oligoadenylate synthetase 1, 40/46kDa (Oas1) |
| NM_057151 | 1.19 | 2.30 | 0.52 | 2.89E-02 | 2.76E-02 | small inducible cytokine subfamily A (Cys-Cys), member 17 (Ccl17) |
| NM_145672 | 1.52 | 2.97 | 0.51 | 1.44E-05 | 4.62E-02 | chemokine (C-X-C motif) ligand 9 (Cxcl9) |
| NM_053299 | 1.51 | 3.06 | 0.49 | 7.94E-05 | 4.88E-02 | ubiquitin D (Ubd) |
Microarray chips from a total of 6 rats per treatment were processed and data mining was performed as described in the Methods. Functional analysis of differentially expressed polysome fraction genes was performed by differential pathway analysis (GSEA) (27). The systematic profiling approach shown in Figure 2B, revealed that carcinogen affected gene sets classified into 26 well-defined biological process categories. Interestingly, the top biological processes affected by AOM exposure were related to electron transport, coenzyme and prosthetic group metabolism.
The canonical Wnt cascade has emerged as a critical regulator of stem cells (28). There is also compelling evidence that oncogenic K-ras stimulates Wnt signaling in colon cancer and that Myc is required for the majority of Wnt target gene activation (29, 30). Therefore, we examined the effect of carcinogen (AOM) on gene activation of the Wnt pathway. Colonic mucosal polysome and total RNA were isolated from rats terminated at 10 wk post-injection (saline or AOM). Only significantly (p<0.05) altered genes are shown, n=6-9 rats per group (Figure 3). The data clearly demonstrate the impact of carcinogen on the mobilization of mRNAs onto polyribosomes for genes associated with the Wnt pathway (Figure 3A). Interestingly, at this “early” promotional stage (tumors typically do not appear until 30 wk after carcinogen injection), almost no changes were observed in the total mRNA transcriptosome (Figure 3B), indicating minimal perturbation at the transcriptional level. Furthermore, because cyclooxygenase-2 (COX-2)-derived PGE2 can promote colonic tumor initiation and progression by enhancing cell proliferation, angiogenesis, cell migration and invasion, while inhibiting apoptosis (31), we also investigated the impact of carcinogen exposure on the pattern of eicosanoid-related mRNAs that are recruited to polysomes. Overall, 8 enzymes were significantly (p<0.05) up-regulated at the polysome mRNA level as opposed to only 2 in the total RNA fraction (Figure 4).
Figure 3. Regulated genes in the Wnt signaling pathway following carcinogen treatment at 10 weeks.


See legend to Figure 2 for details. Gene expression in AOM and saline treated rats was compared using GenMAPP pathway analysis. Colors indicate significantly (p < 0.05) up-regulated genes. Numbers show the fold changes. (A) Polysome RNA fraction, (B) Total RNA fraction.
Figure 4. Regulated genes in the eicosanoid biosynthesis pathway following carcinogen treatment at 10 weeks.
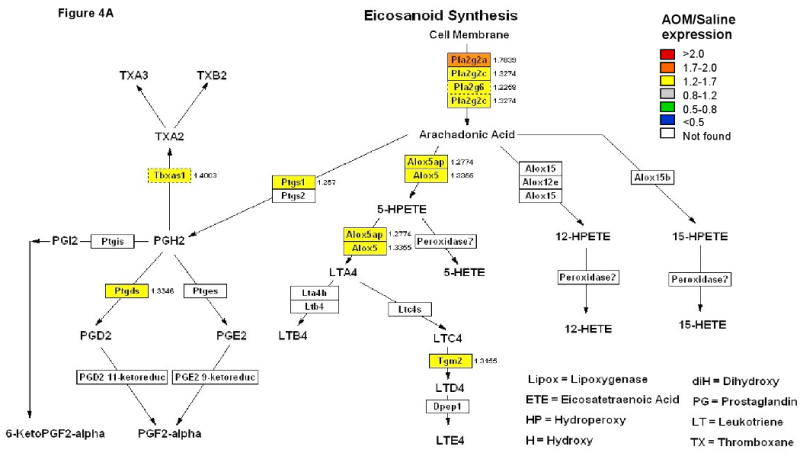

Colors indicate significantly (p < 0.05) up-regulated genes. Numbers show the fold changes. (A) Polysome RNA fraction, (B) Total RNA fraction.
Microarray analysis also revealed that a number of genes associated with Ras and Mitogen-activated protein kinase (MAPK) cascades were significantly (p<0.05) up-regulated (expressed as fold increase - AOM vs saline; e.g., Map2k1/MEK1 − 2.0) predominantly in polysomes (Supplemental Figures 2 & 3). This is noteworthy, because blockade of the MAPK pathway suppresses growth of tumors in vivo (5, 32).
Diet preferentially influences global transcriptional profiles
The number of genes affected by diet (n-3 vs n-6 PUFA) 10 wk following placebo (saline) treatment was much greater in the total RNA fraction compared with the polysome RNA fraction. As shown in Supplemental Figure 4, only 63 genes were significantly altered (p<0.05) by PUFA treatment in the polysome RNA fraction. In contrast, the total RNA fraction contained 328 unique genes affected by diet. In addition, there were 2 genes significantly (p<0.05) affected by diet treatment identified in both the polysome and total RNA fractions. Interestingly, a similar trend was observed in n-3 vs n-6 PUFA fed animals injected with carcinogen (Supplemental Figure 5). These data indicate that transcriptional alterations were more extensive relative to translational alterations in mediating the effects of diet.
In previous experiments, we have shown that diets containing both a fermentable fiber source, e.g., pectin, and n-3 PUFA as the lipid component, e.g., fish oil, are maximally protective against experimentally-induced colon cancer compared to cellulose and corn oil (33, 34). Therefore, we examined the effect of dietary combination chemotherapy on the mucosal translatability index. As shown in Supplemental Table 1, 13 genes were modulated translationally following carcinogen exposure and corn oil + cellulose (CC) relative to fish oil + pectin (FP) feeding. Notably, the tumor suppressor retinoblastoma-associated protein (RB1) gene was translationally suppressed in CC relative to FP-fed animals (translatability index = 0.57). A similar trend was also noted with respect to epoxide hydrolase 2 (Ephx2), a xenobiotic metabolizing phase I enzyme (translatability index = 0.15).
Effect of carcinogen on expression levels of colonocyte eIF4E and phospho-eIF4E
Since elevated eukaryotic translation initiation factor 4E (eIF4E) function can induce malignancy by selectively enhancing translation of key malignancy-related transcripts (35), eIF4E expression in tissue sections was quantified. Expression of eIF4E was higher (p<0.01) in the carcinogen (AOM)-treated compared to saline-control animals (Figure 5). Tissue polysomal mRNA and protein eIF4E levels (AOM/saline ratio) were similar, 1.22 and 1.19, respectively. Interestingly, eIF4E was higher (p<0.01) at the base of the crypt (proliferative zone) and progressively decreased toward the luminal surface (Supplemental Figure 6). We also evaluated whether the phosphorylation status of eIF4E, which typically correlates with the translation rate and growth status of the cell, was affected by carcinogen exposure. Similar to eIF4E, phospho-eIF4E levels were significantly (p<0.01) elevated in carcinogen treated animals (Figure 5).
Figure 5. Carcinogen effect on in situ expression of eIF4E and phosphorylated eIF4E in colonic crypts.

A, Immunhistochemistry of eIF4E and phosphorylated eIF4E (ph-eIF4E) in colon of rats 10 wk after AOM or saline treatment. Negative control, primary antibody was omitted. Magnification, 100×. B, Expression level (staining intensity minus local background) was quantified with image analysis software by taking measurements at the base, middle and top of at least 20 crypts per animal, n=8 rats per treatment group.
Discussion
In this study we examined ribosome-free and polysome-bound mRNAs using a high throughput microarray platform in order to provide a panoramic overview of gene expression at both the total transcript and post-transcriptional levels during the early stages of colon carcinogenesis. To our knowledge, this has never been attempted in the context of a highly relevant in vivo colon cancer model. The AOM-induced rat colon tumor model was selected because it provides a clear distinction between tumor initiation and promotion (36). Similar to humans, tumors from AOM-injected animals exhibit the presence of mutated/nuclear β-catenin (37) and the overexpression of cyclooxygenase-2 (COX-2) (31, 32), consistent with the dramatic up-regulation of the Wnt signaling pathway (32). In addition, rat colonic tumors closely parallel human colonic neoplasia in pathologic features (38). Therefore, in the absence of comprehensive human data, the AOM chemical carcinogenesis model serves as a highly relevant means of assessing human colon cancer risk.
The examination of global alterations in gene expression in colonic mucosa at a very early stage (10 wk post AOM injection) of colorectal cancer development revealed that the colon acquires changes predominantly impacting the translational control of gene expression. This finding is supported by the elevation in eIF4E and phospho-eIF4E in colonic sections, in addition to a previous study in which colon carcinoma cell lines of cancer progression to metastasis was examined (9). Collectively, these data support a model whereby oncogenic signaling leads to cellular transformation by altering the transcriptome and producing a radical shift in the composition of mRNAs associated with actively translating polysomes (2). We argue, therefore, that studies employing polysome purification and microarray analysis are needed in order to fully elucidate the mechanisms of translational deregulation associated with colon tumor development. Indeed, major advancements in genome-wide techniques for systematically monitoring protein translation in response to environmental factors have recently been made (39).
By determining mRNA relative translatability (polysome/total mRNA ratio), we catalogued which mRNAs are translated efficiently under malignant transformation conditions and are thus refractory to translational repression. Our data indicated a profound alteration in translational control following AOM treatment, suggesting that signaling pathways can cooperate to differentially translate existing pools of mRNA. The shift of existing mRNAs into and out of the polysome fraction appears to be more rapid and extensive than the change in the total mRNA pool. Since conditions such as cell stress and malignant transformation often result in a poor correlation between mRNA levels and protein production (9, 40, 41), it is evident that complementary experiments investigating the causal relationship between translational control and oncogenesis are needed. In addition, having determined the level of concordance between steady-state and translated mRNA populations at a very early stage of malignant transformation, future analyses will need to focus on how the expression of translated mRNA is altered in (late stage) tumor samples compared to uninvolved mucosa. This will involve running separate analyses on uninvolved mucosa and tumors, since there is growing evidence that epigenetic perturbations in cancer are not confined to tumor cells but also involve adjacent cells (7).
It is well known that the APC gene is mutated, truncated or deleted in the majority of human colon tumors. This is significant because mutant forms of the APC protein cause activation of Wnt-beta catenin-dependent signaling (42), COX-2 expression/prostaglandin/leukotriene synthesis (43), MAPK signaling (32) and crypt stem cell survival (44). Similarly, colon tumors induced in rodents by chemical alkylating carcinogens, e.g., AOM, exhibit deregulation of the Wnt and MAPK signaling pathways (45). However, from the perspective of the development of a lethal cancer, it is not clear precisely at which point in the evolution of a colonic tumor does Wnt, COX-2 or MAPK-dependent signaling become chronically perturbed. Our data demonstrate that polysomal loading patterns of mRNAs associated with the Wnt-beta catenin, phospholipase A2-eicosanoid and the MAPK signaling axes are significantly up-regulated at a very early period of tumor development in the colon. Interestingly, previous reports indicate that MAPKs are highly activated during late progression of colorectal carcinoma. Indeed, in colorectal cancer, at least 21 pathways have been identified to be enriched in mutations from different pathway databases (46). We have applied a systems biology approach involving simultaneous microarray analysis of rat colonic total (steady-state) mRNA and actively translated (polysomal) mRNA populations to show that 2 pathways (Wnt and eicosanoid) previously implicated in colorectal tumorigenesis, are affected at the level of translation at a very early stage of tumor development. It appears that transcriptional differences seen with AOM-induced signaling alterations are generated secondary to translational effects on mRNAs. It is likely, therefore, that differential recruitment into polysomes of a given pool of mRNA may be sufficient to promote tumor formation. This interpretation is consistent with previous reports indicating that as cancer cells become more transformed they acquire resistance to translation repression (47, 48). To the best of our knowledge, this is the first report demonstrating a profound alteration of translational control in early colorectal progression in vivo. These data complement previous studies using sequencing and transcriptome profiling approaches to examine early stage tumor evolution (49, 50).
Our data also offer insight into the effects of chemoprotective n-3 PUFA on colonic polysomal mRNA and total mRNA profiles. In striking contrast to the effects of AOM, transcriptional alterations were found to be more extensive relative to translational alterations in mediating the effects of diet. This implies that dietary intervention does not simply counteract the effects of carcinogen. Although very little is known regarding the role of diet on post-transcriptional control, the n-3 PUFA, eicosapentaenoic acid (EPA, 20:5n-3) has been shown to inhibit protein synthesis at the level of protein initiation (40). Collectively, therefore, these findings are noteworthy because they provide further inroads into how diet regulates global gene expression during the early stages of colorectal tumorigenesis.
Supplementary Material
Acknowledgments
We thank Evelyn Callaway, Chandra Emani and Carl Raetzsch for technical assistance.
This work was supported in part by NIH grants DK71707, CA59034, CA129444, CA74552, and P30ES09106.
Abbreviations used
- AOM
azoxymethane
- MAPK
mitogen activated protein kinase
- PUFA
polyunsaturated fatty acids
Footnotes
Author disclosures: Laurie A. Davidson, Naisyin Wang, Ivan Ivanov, Jennifer Goldsby, Joanne R. Lupton and Robert S. Chapkin, no conflict of interest.
References
- 1.Prendergast GC. Signal transduction: Putting translation before transcription. Cancer Cell. 2003;4:244–45. doi: 10.1016/s1535-6108(03)00247-2. [DOI] [PubMed] [Google Scholar]
- 2.Rajasekhar VK, Viale A, Socci ND, Wiedmann M, Hu X, Holland EC. Oncogenic ras and akt signaling contribute to glioblastoma formation by differential recruitment of existing mRNAs to polysomes. Mol Cell. 2003;12:889–901. doi: 10.1016/s1097-2765(03)00395-2. [DOI] [PubMed] [Google Scholar]
- 3.Spence J, Duggan BM, Eckhardt C, McClelland M, Mercola D. Messenger RNAs under differential translational control in Ki-ras-transformed cells. Mol Cancer Res. 2006;4:47–60. doi: 10.1158/1541-7786.MCR-04-0187. [DOI] [PubMed] [Google Scholar]
- 4.Xi Y, Shalgi R, Fodstad O, Pilpel Y, Ju Jingfang J. Differentially regulated micro-RNAs and actively translated messenger RNA transcripts by tumor suppressor p53 in colon cancer. Clin Cancer Res. 2006;12:2014–24. doi: 10.1158/1078-0432.CCR-05-1853. [DOI] [PubMed] [Google Scholar]
- 5.Sebolt-Leopold JS, Dudley DT, Herrera R, et al. Blockade of MAP kinase pathway suppresses growth of colon tumors in vivo. Nature Med. 1999;5:810–16. doi: 10.1038/10533. [DOI] [PubMed] [Google Scholar]
- 6.Ruggero D, Pandolfi PP. Does the ribosome translate cancer? Nature Rev Cancer. 2003;3:179–92. doi: 10.1038/nrc1015. [DOI] [PubMed] [Google Scholar]
- 7.Bilanges B, Stokoe D. Mechanisms of translational deregulation in human tumors and therapeutic intervention strategies. Oncogene. 2007;26:5973–90. doi: 10.1038/sj.onc.1210431. [DOI] [PubMed] [Google Scholar]
- 8.Mikulits W, Pradet-Balade B, Habermann B, Beug H, Garcia-Sanz JA, Mullner EW. Isolation of translationally controlled mRNAs by differential screening. Faseb J. 2000;14:1641–52. doi: 10.1096/fj.14.11.1641. [DOI] [PubMed] [Google Scholar]
- 9.Provenzani A, Fronza R, Loreni F, Pascale A, Amadio M, Quattrone A. Global alterations in mRNA polysomal recruitment in a cell model of colorectal cancer progression to metastasis. Carcinogenesis. 2006;27:1323–33. doi: 10.1093/carcin/bgi377. [DOI] [PubMed] [Google Scholar]
- 10.Anti M, Armelao F, Marra G, et al. Effects of different doses of fish oil on rectal cell proliferation in patients with sporadic colonic adenomas. Gastroenterology. 1994;107:1709–18. doi: 10.1016/0016-5085(94)90811-7. [DOI] [PubMed] [Google Scholar]
- 11.Bartram HP, Gostner A, Scheppach W, et al. Effects of fish oil on rectal cell proliferation, mucosal fatty acids, and prostaglandin E2 release in healthy subjects. Gastroenterology. 1993;105:1317–22. doi: 10.1016/0016-5085(93)90135-y. [DOI] [PubMed] [Google Scholar]
- 12.Davidson LA, Nguyen DV, Hokanson RM, et al. Chemopreventive n-3 polyunsaturated fatty acids reprogram genetic signatures during colon cancer initiation and progression in the rat. Cancer Res. 2004;64:6797–6804. doi: 10.1158/0008-5472.CAN-04-1068. [DOI] [PMC free article] [PubMed] [Google Scholar]
- 13.Chang WC, Chapkin RS, Lupton JR. Predictive value of proliferation, differentiation and apoptosis as intermediate markers for colon tumorigenesis. Carcinogenesis. 1997;18:721–30. doi: 10.1093/carcin/18.4.721. [DOI] [PubMed] [Google Scholar]
- 14.Ju J, Huang C, Minskoff SA, Mayotte JE, Taillon BE, Simons JF. Simultaneous gene expression analysis of steady-state and actively translated mRNA populations from osteosarcoma MG-63 cells in response to IL-1α via an open expression analysis platform. Nucleic Acids Research. 2003;31:5157–66. doi: 10.1093/nar/gkg702. [DOI] [PMC free article] [PubMed] [Google Scholar]
- 15.Koenker R, Hallock K. Quantile Regression: An Introduction. Journal of Economic Perspectives. 2001;15:143. [Google Scholar]
- 16.Bolstad BM, Irizarry RA, Astrand M, Speed TP. A comparison of normalization methods for high density oligonucleotide array data based on variance and bias. Bioinformatics. 2003;19:185. doi: 10.1093/bioinformatics/19.2.185. [DOI] [PubMed] [Google Scholar]
- 17.Storey D, Tibshirani R. Statistical significance for genome-wide studies. Proc Natl Acad Sci. 2003;100:9440–45. doi: 10.1073/pnas.1530509100. [DOI] [PMC free article] [PubMed] [Google Scholar]
- 18.Krichevsky AM, Kosik KS. Neuronal RNA granules: a link between RNA localization and stimulation-dependent translation. Neuron. 2001;32:683–96. doi: 10.1016/s0896-6273(01)00508-6. [DOI] [PubMed] [Google Scholar]
- 19.Thomas JD, Johannes GJ. Identification of mRNAs that continue to associate with polysomes during hypoxia. RNA. 2007;13:1–16. doi: 10.1261/rna.534807. [DOI] [PMC free article] [PubMed] [Google Scholar]
- 20.Parkos CA, Colgan SP, Liang TW, et al. CD47 mediates post-adhesive events required for neutrophil migration across polarized intestinal epithelia. J Cell Biol. 1996;132:437–50. doi: 10.1083/jcb.132.3.437. [DOI] [PMC free article] [PubMed] [Google Scholar]
- 21.Nicolas F, Tiveron MC, Davoust J, Reggio H. GPI membrane anchor is determinant in intracellular accumulation of apical plasma membrane proteins in the non-polarized human colon cancer cell HT-29 18. J Cell Sci. 1994;107:2679–89. doi: 10.1242/jcs.107.10.2679. [DOI] [PubMed] [Google Scholar]
- 22.Perez R, Wu N, Klipfel AA, Beart BW. A better cell cycle target for gene therapy of colorectal cancer: cyclin G. J Gastrointest Surg. 2003;7:884–89. doi: 10.1007/s11605-003-0034-8. [DOI] [PubMed] [Google Scholar]
- 23.Chiao PJ, Hunt KK, Grau AM, et al. Tumor suppressor gene SMAD4/DPC4, its downstream target genes, and regulation of cell cycle. Ann NY Acad Sci. 1999;880:31–7. doi: 10.1111/j.1749-6632.1999.tb09507.x. [DOI] [PubMed] [Google Scholar]
- 24.Kanagawa N, Niwa M, Hatanaka Y, et al. CC-chemokine ligand 17 gene therapy induces tumor regression through augmentation of tumor-infiltrating immune cells in a murine model of preexisting CT26 colon carcinoma. Int J Cancer. 2007;121:2013–22. doi: 10.1002/ijc.22908. [DOI] [PubMed] [Google Scholar]
- 25.Grewal TS, Genever PG, Brabbs AC, Birch M, Skerry TM. Best5: a novel interferon-inducible gene expressed during bone formation. FASEB J. 2000;14:523–31. doi: 10.1096/fasebj.14.3.523. [DOI] [PubMed] [Google Scholar]
- 26.Zhang R, Tian L, Chen LJ, et al. Combination of MIG (CXCL9) chemokine gene therapy with low-dose cisplastin improves therapeutic efficacy against murine carcinoma. Gene Ther. 2006;13:1263–71. doi: 10.1038/sj.gt.3302756. [DOI] [PubMed] [Google Scholar]
- 27.Subramanian A, Tamayo P, Mootha VK, et al. Gene set enrichment analysis: A knowledge-based approach for interpreting genome-wide expression profiles. Proc Natl Acad Sci. 2005;102:15545–50. doi: 10.1073/pnas.0506580102. [DOI] [PMC free article] [PubMed] [Google Scholar]
- 28.D'Errico I, Moschetta A. Nuclear receptors, intestinal architecture and colon cancer: an intriguing link. Cell Mol Life Sci. 2008;65:1523–43. doi: 10.1007/s00018-008-7552-1. [DOI] [PMC free article] [PubMed] [Google Scholar]
- 29.Nandan MO, McConnell BB, Ghaleb AM, et al. Kruppel-like factor 5 mediates cellular transformation during oncogenic KRAS-induced intestinal tumorigenesis. Gastroenterology. 2008;134:120–30. doi: 10.1053/j.gastro.2007.10.023. [DOI] [PMC free article] [PubMed] [Google Scholar]
- 30.Haigis KM, Kendall KR, Wang Y, et al. Differential effects of oncogenic K-Ras and N-Ras on proliferation, differentiation and tumor progression in the colon. Nature Genetics. 2008;40:600–8. doi: 10.1038/ngXXXX. [DOI] [PMC free article] [PubMed] [Google Scholar]
- 31.Buchanan FG, DuBois RN. Connecting Cox-2 and Wnt in cancer. Cancer Cell. 2006;9:6–8. doi: 10.1016/j.ccr.2005.12.029. [DOI] [PubMed] [Google Scholar]
- 32.Komatsu K, Buchanan G, Katkuri S, et al. Oncogenic potential of MEK1 in rat intestinal epithelial cells in mediated via cyclooxygenase-2. Gastroenterology. 2005;129:577–90. doi: 10.1016/j.gastro.2005.06.003. [DOI] [PubMed] [Google Scholar]
- 33.Chang WC, Chapkin RS, Lupton JR. Fish oil blocks azoxymethane-induced tumorigenesis by increased cell Differentiation and apoptosis rather than decreased cell proliferation. J Nutr. 1998;18:351–7. doi: 10.1093/jn/128.3.491. [DOI] [PubMed] [Google Scholar]
- 34.Crim KC, Sanders L, Hong MY, et al. Upregulation of p21waf1/cip1 expression in vivo by butyrate administration can be chemoprotective or chemopromotive depending on the lipid component of the diet. Carcinogenesis. 2008;29:1415–20. doi: 10.1093/carcin/bgn144. [DOI] [PMC free article] [PubMed] [Google Scholar]
- 35.Mamane Y, Petroulakis E, Martineau Y, et al. Epigenetic activation of a subset of mRNAs by eIF4E explains its effects on cell proliferation. PLoS ONE. 2007;2:e242. doi: 10.1371/journal.pone.0000242. [DOI] [PMC free article] [PubMed] [Google Scholar]
- 36.Reddy BS, Burill C, Rigotty J. Effect of diets high in ω-3 and ω-6 fatty acids on initiation and postinitiation stages of colon carcinogenesis. Cancer Res. 1991;51:487–91. [PubMed] [Google Scholar]
- 37.Yamada Y, Yoshimi N, Hirose Y, et al. Frequent β-catenin gene mutations and accumulations of the protein in the putative preneoplastic lesions lacking macroscopic aberrant crypt foci appearance, in rat colon carcinogenesis. Cancer Res. 2000;60:3323–27. [PubMed] [Google Scholar]
- 38.Ahnen DJ. Are animal models of colon cancer relevant to human disease. Dig Dis Sci. 1985;30:103S–6S. doi: 10.1007/BF01296987. [DOI] [PubMed] [Google Scholar]
- 39.Ingolia NT, Ghaemmaghami S, Newman JRS, Weissman JS. Genome-wide analysis in vivo of translation with nucleotide resolution using ribosome profiling. Science. 2009;324:218–223. doi: 10.1126/science.1168978. [DOI] [PMC free article] [PubMed] [Google Scholar]
- 40.Palakurthi SS, Fluckiger R, Aktas H, et al. Inhibition of translation initiation mediates the anticancer effect of n-3 polyunsaturated fatty acid eicosapentaenoic acid. Cancer Res. 2000;60:2919–25. [PubMed] [Google Scholar]
- 41.Lu X, de la Pena L, Barker C, Camphausen K, Tofilon PJ. Radiation-induced changes in gene expression involve recruitment of existing messenger RNAs to and away from polysomes. Cancer Res. 2006;66:1052–61. doi: 10.1158/0008-5472.CAN-05-3459. [DOI] [PubMed] [Google Scholar]
- 42.Gregorieff A, Clevers H. Wnt signaling in the intestinal epithelium: form endoderm to cancer. Genes & Dev. 2005;19:877–90. doi: 10.1101/gad.1295405. [DOI] [PubMed] [Google Scholar]
- 43.Araki Y, Okamura S, Hussain SP, et al. Regulation of cyclooxygenase-2 expression by the Wnt and Ras pathways. Cancer Res. 2003;63:728–34. [PubMed] [Google Scholar]
- 44.Barker N, Clevers H. Tracking down the stem cells of the intestine: Strategies to identify adult stem cells. Gastroenterology. 2007;133:1755–60. doi: 10.1053/j.gastro.2007.10.029. [DOI] [PubMed] [Google Scholar]
- 45.Femia AP, Dolara P, Giannini A, Salvadori M, Biggeri A, Caderni G. Frequent mutation of Apc gene in rat colon tumors and mucin-depleted foci, preneoplastic lesions in experimental colon carcinogenesis. Cancer Res. 2007;67:445–9. doi: 10.1158/0008-5472.CAN-06-3861. [DOI] [PubMed] [Google Scholar]
- 46.Lin J, Gan CM, Zhang X, et al. A multidimensional analysis of genes mutated in breast and colon colorectal cancers. Genome Res. 2007;17:1304–18. doi: 10.1101/gr.6431107. [DOI] [PMC free article] [PubMed] [Google Scholar]
- 47.Connolly E, Braunstein S, Formenti S, Schneider RJ. Hypoxia inhibits protein synthesis through 4E-BP1 and elongation factor 2 kinase pathway controlled by mTOR and uncoupled in breast cancer cells. Mol Cell Biol. 2006;26:3955–65. doi: 10.1128/MCB.26.10.3955-3965.2006. [DOI] [PMC free article] [PubMed] [Google Scholar]
- 48.Shaw RJ, Cantley LC. Ras, PI(3)K and mTOR signaling controls tumour cell growth. Nature. 2006;441:424–30. doi: 10.1038/nature04869. [DOI] [PubMed] [Google Scholar]
- 49.Sabates-Beliver J, Van der Flier LG, de Palo M, et al. Transcriptome profile of human colorectal adenomas. Mol Cancer Res. 2007;5:1263–75. doi: 10.1158/1541-7786.MCR-07-0267. [DOI] [PubMed] [Google Scholar]
- 50.Jones S, Chen WD, Parmigiani G, et al. Comparative lesion sequencing provides insights into tumor evolution. Proc Natl Acad Sci. 2008;105:4283–88. doi: 10.1073/pnas.0712345105. [DOI] [PMC free article] [PubMed] [Google Scholar]
Associated Data
This section collects any data citations, data availability statements, or supplementary materials included in this article.