

Abstract
The purpose of this review was to summarize the available information on lipidomic analysis of human meibum and tear film, and critically evaluate the pertinent past and present analytical procedures and results obtained in various laboratories. Human meibum was shown to be a very complex mixture of lipids of various classes. For decades, their exact structures have remained elusive. Because of the limitations of the then-current techniques, most of the complex lipids that constitute meibum could not be analyzed as whole molecules and required prior hydrolysis and/or transesterification of the entire lipid pool. These procedures effectively made it very difficult, and often impossible, to reconstruct the complete structures of the original intact compounds, which prompted us to call this The Meibomian Puzzle. Modern techniques such as high-performance liquid chromatography in combination with mass spectrometry help in solving this puzzle by allowing a researcher to detect and analyze intact molecules of complex lipid compounds, even if present in extremely low concentrations. This current de-facto standard procedure in lipidomic analysis of natural lipids and their mixtures is compared with other experimental techniques such as nuclear magnetic resonance spectroscopy, infrared spectroscopy, gas chromatography, and thin layer chromatography, among the others. The results obtained by older techniques, and their limitations and deficiencies are discussed. It appears that some of the earlier findings did not withstand a scrupulous re-evaluation and need to be modified and/or corrected. The most intriguing development is the virtual absence in meibum of typical phospholipids – an important group of amphiphilic compounds whose role in the human tear film was thought to be to stabilize the entire tear film structure. Instead, another group of previously unidentified compounds, very long chain (O-acyl)-omega-hydroxy fatty acids, appears to be a stabilizing factor which might be related to tear film stability and deterioration. Thus, these compounds may become an important target in biochemistry and (patho)physiology of ocular surface and dry eye research.
Keywords: aqueous tears, cholesteryl esters, dry eye, HPLC, human, lipids, mass spectrometry, meibomian gland secretions, meibum, oleamide, phospholipids, tear film, tear film lipid layer, very long chain (O-acyl)-omega-hydroxy fatty acids, wax esters
I. Introduction
Meibomian glands (or glandulae tarsales), described in 1666 by the German physician and anatomist Heinrich Meibom (Meibom, 1666), are a variety of sebaceous glands that are located at the margins of the upper and lower eyelids of humans and mammals. The glands produce a lipid-rich secretion (Pes, 1897), also called meibum (Nicolaides et al., 1981), which is slowly, but constantly, released from the orifices of the glands, but could also be forced out of the glands in a burst-like manner by squeezing the eyelids upon forced blinking (Tiffany et al., 1998; Bron et al., 2004). The moving eyelids spread meibum across the ocular surface and mix it with aqueous tears (AT), which are produced by lacrimal glands. Mixing and spreading of meibum and AT result in a more or less continuous structure called tear film (TF), which covers the entire ocular surface and serves multiple purposes, including protective, lubricatory, nutritional, and antimicrobial, among others. TF was also linked to visual acuity because it provides a smoother ocular surface which improves the optical properties of the eye (Bron et al., 2004; Goto et al., 2006). However, TF is not homogeneous. This is not surprising considering that lipids do not easily form aqueous solutions and tend to separate by forming a clearly hydrophobic lipid-enriched subphase. A classical view on the TF structure presumes a three-layer organization of TF (Wolff, 1954; Holly, 1973; McCulley and Shine, 1997). As lipids are, typically, less dense than water, they accumulate on the surface of the aqueous subphase thus forming a lipid-enriched outer-most layer of TF [also called tear film lipid layer, or TFLL (McCulley and Shine, 1997)]. Beneath the TFLL is a much more hydrophilic aqueous layer enriched with water-soluble proteins, carbohydrates, salts, and other more or less hydrophilic compounds. The closest to the corneal epithelium is believed to be a relatively hydrophilic mucin-enriched glycocalyx layer, which is formed primarily of membrane-bound mucins (Gipson et al., 1992; Gipson, 2004; Butovich et al., 2008; Ramamoorthy and Nichols, 2008). By using interferometry, the depth of TFLL was estimated to be ~40–90 nanometers, while the aqueous layer was found to be much thicker at about 4 micrometers (King-Smith et al., 2004; King-Smith et al., 2009). It is important to realize that all three layers are soft and dynamic structures, where changes occur as a result of numerous simultaneously manifesting factors, e.g. mechanical movements of the eyelids, continuous secretion of meibum, aqueous tears and mucins, and AT evaporation and drainage through nasal ducts. One can hardly expect that under these conditions TF can preserve its classical three-layer structure for any extended length of time. Indeed, if the eye is forced to stay open without blinking, the human TF quickly deteriorates, thins, and breaks – a phenomenon know as tear break-up. The tear break-up time (TBUT) for humans is measured in seconds (Holly, 1993). It has long been considered an important and objective diagnostic parameter in evaluating the health of the ocular surface (Holly and Lemp, 1977). TBUT is widely used in ophthalmic practice to diagnose dry eye – a multifactorial condition (or disease) whose onset and progress is linked to the deterioration of TF in general, and TFLL in particular (Argueso et al., 2007). When the break-up occurs, the cornea becomes exposed to air, causing a discomfort to the patient. The incomplete coverage of the ocular surface with TF also increases the chances of damage to the corneal epithelium cells because of excessive dehydration, abrasions, irritation, inflammation, infections, etc. Another cause of the TF instability are meibomian glands incapable of secreting enough meibum of the necessary quality, e.g. because of meibomian gland dysfunction associated with meibomian gland inflammation and/or obstruction.
This review will focus on human meibum and its lipid composition. Those interested in other aspects of TF biochemistry and physiology are advised to read earlier comprehensive reviews on the topic (Holly and Lemp, 1977; Holly, 1993; Bron and Tiffany, 1998; Mathers and Lane, 1998; McCulley and Shine, 2004; Ohashi et al., 2006; Argueso et al., 2007; Foulks, 2007; and Tiffany, 2008, among the others).
Before discussing the lipid composition of human meibum, it is important to review lipid classification and nomenclature, and the basics of analytical techniques most frequently used in, or suitable for, meibomian lipid studies. This necessary excursion will help the reader to follow the evolution and compare side-by-side the reliability and informativeness of various experimental approaches used in TF and meibum studies over the period of several decades. The second goal of the manuscript was to help in moving toward finding a solution of what can be called the Meibomian Puzzle – one of the hot areas of ocular surface science dealing with the lipid composition of meibum, TFLL, and TF in general.
Why a puzzle? This question brings us to the major problem that plagued the lipid analyses of meibum for decades. In most of the earlier studies, the lipids (typically, complex molecules) were hydrolyzed to their simpler “building blocks” before the analyses. Deducing the structures of the original compounds from their fragments is similar to solving anagrams, only more difficult. Consider a phrase “Eleven plus two” scrambled to a meaningless set of letters “e, e, e, l, l, n, o, p, s, t, u, w” (from http://www.anagramgenius.com) by means of “linguistic hydrolysis”. The anagram could be solved as “Twelve plus one”, which looks logical, is mathematically and statistically a correct answer, but still is not the correct answer. The second, equally wrong, answer is “To eleven lumps“. Finally, one can arrive to a third (this time correct) answer “Eleven plus two”. But, who is going to tell us which answer is indeed the correct one? Earlier, a researcher who analyzed meibum by using the then-standard experimental techniques that almost always include sample hydrolysis and transesterification faced exactly the same problem with no one to tell in which order to combine the complex mosaic of fragments into the correct starting structures. Consequently, over the period of decades, very little information was published on actual chemical structures of the detected lipids, with most of the researchers resorting to presenting them as lipid classes: note the absence of actual molecular structures in all but a few papers on the topic. Though important as a start, the information on lipid classes only is somewhat limiting as there are countless examples where even a slightest variation in a chemical structure of a compound leads to profound changes in its properties and physiological activity. Recent advances in bioanalytical techniques discussed below are changing this situation for the better as they enable us to perform much more detailed and accurate analyses of biochemical composition of whole meibum and its individual components than were feasible only a decade ago. There is little doubt that we will see rapid developments in the area with emphasis on complete structural characterization of individual meibomian compounds, their quantitation in meibum and TF, and studying the biophysical properties of individual lipids and their mixtures, in order to understand how TFLL and TF are organized and function.
II. Lipid classification and nomenclature
For general information on lipids, the reader is advised to visit the following Web sites: LipidLibrary.co.uk, Cyberlipid.org, hplc-ms.byrdwell.com, Lipidbanks.jp, and LipidMaps.org, among the others.
Lipids are an extremely diverse class of biomolecules, whose complexity manifests itself on several levels. Thus, there are multiple lipid classification systems.
Firstly, the lipids can be divided into simple lipids and complex lipids (Scheme 1). A simple lipid is the one that cannot be (reversibly) hydrolyzed and form two or more molecules. A few common examples of simple lipids are free fatty acids (FA) and alcohols (FAl), cholesterol (Chl), and hydrocarbons. Simple lipids are considered the elementary building blocks of complex lipids, but can also play unique roles as individual compounds. A complex lipid is formed of at least one simple lipid, plus either another simple lipid, or a non-lipid molecule such as glycerol, an amino acid, a carbohydrate, etc. Thus, simple lipids are among the smallest ones in any given biogenic sample. Typical complex lipids routinely found in almost any living cell or tissue are wax esters (WE), cholesteryl esters (CE), mono-, di, and tri-acylglycerols (MAG, DAG, and TAG), ceramides (Cer), phospholipids (PL) etc.
Scheme 1.
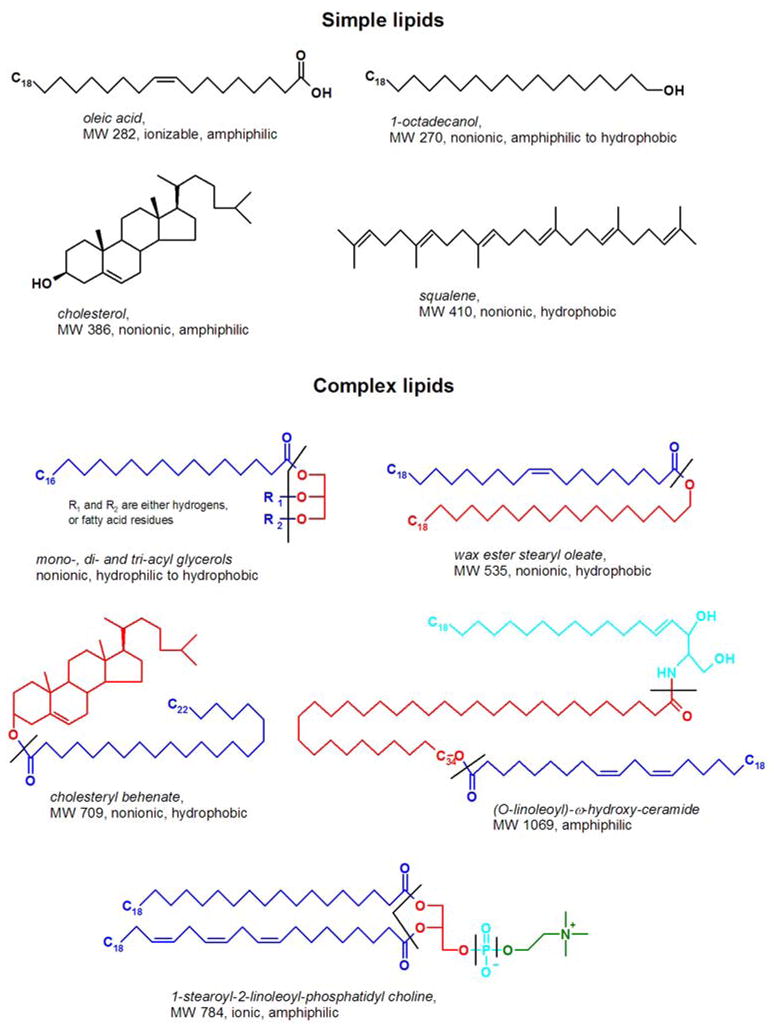
Structures of representative simple and complex lipids relevant to lipidomic analysis of meibum, tear film, and aqueous tears.
Hydrolyzable bonds are marked with dashed lines. Complex lipids are color-coded to show their continuous non-hydrolizable fragments.
Secondly, classification of lipids can be based on their solubility in water, according to which they can be (somewhat arbitrarily) grouped as polar, nonpolar, and amphiphilic lipids (Scheme 2). A typical polar lipid would be a short chain FA, an oxidized polyunsaturated FA (oxy-PUFA), a hydroxy-Cer (HO-Cer), a MAG, a glycolipid, etc. A characteristic common feature of these lipids is a high ratio of polar groups that are capable of ionization and/or formation of hydrogen bonds with molecules of water (e.g. hydroxyl, amino, carboxyl, or phosphoric ones) to their molecular mass. In a two-phase water/oil mixture they typically tend to accumulate in the aqueous phase. Nonpolar lipids are those that are extremely poorly soluble in water: WE, CE, TAG, long-chain acyl-Cer, and hydrocarbons (HC) are characteristic members of this family (see Schemes 1 and 2 for details). They tend to have very few or no polar groups in their structures, and if they do, the ratio is very low. In a water/oil biphasic mixture these lipids would inevitably accumulate in the oil. Amphiphilic (or, more aptly, amphipathic) lipids are those possessing both polar and nonpolar groups. Typical representatives of this group are oxysterols, Cer, PL, and DAG. Many of these compounds would accumulate at an oil/water interface with their polar groups facing the aqueous layer and their nonpolar parts submerged in the oil. Complicating this classification is the fact that the size of the lipid molecules has a strong impact on their solubility – e.g., short chain FA (acetic and propionic ones) are extremely hydrophilic and infinitely miscible with water, while longer chain FA (C10–C14) have a limited solubility in water which depends on the pH of their solutions – the more basic they are, the higher the solubility. Further increase in the carbon chain length will bring us to a category of very long chain FA, whose solubility in water is even less and approaches zero for the compounds of the C20–C30 family and above, though the exact numbers are currently unavailable (Gunstone et al., 2007).
Scheme 2.

Structures of representative polar and amphiphilic lipids relevant to lipidomic analysis of meibum, tear film, and aqueous tears.
Ionizable polar groups are shown in red; nonionizable polar groups – in blue; nonpolar groups – in black.
Thirdly, the lipids can be classified as nonionic (or noncharged) and ionic (ionizable or charged) (Schemes 1 and 2). Nonionic lipids can be polar (MAG, HO-Cer, short chain FAl), nonpolar (CE, WE, TAG), and amphiphilic (DAG, Cer, glycolipids). Ionic lipids are typically either polar (shorter chain FA, lyso-PL) or amphiphilic [PL, sphingomyelins (SM), sulfolipids and such]. Again, the length of FA and FAl chains can dramatically increase or decrease their solubility. Ionic lipids can carry a permanent or acquired positive charge [sphingosines and phosphatidyl ethanolamines (PE)], a negative charge (free FA, phosphatidic acid, phosphatidyl glycerol, cardiolipins, sulfatides), or be electroneutral as a result of having both positively and negatively charged groups in their structures [phosphatidyl cholines (PC) and SM]. PC and SM are also called zwitter-ionic lipids because they have a permanently positively charged quaternary amino group N+(CH3)3 and a negatively charged phosphate. An important property of many ionic lipids is that their overall charge may change in response to the changing environment due to formation of salts, ion pairs, and protonation/deprotonation. For example, FA anions with dissociated carboxylic groups can become progressively electroneutral upon acidification of the media changing their charge from (−1) to 0. PC and SM can change their charge from (+1) to 0, while PE would assume any charge from (−1) to (+1) depending on the pH of its solution and its polarity.
Fourthly, lipids can be classified on the basis of their biosynthetic pathways as fatty acyls, glycerolipids, glycerophospholipids, sphingolipids, sterol lipids, prenol lipids, saccharolipids, and polyketides (see www.LipidMaps.org). Though biochemically sound, this classification is far less practical when it comes to correlating the properties of lipids with their functions as building blocks of cell membranes and other lipid structures, such as TF and TFLL.
Thus, it is advisable to adhere to the first three classification systems when discussing the properties of lipids and methods of lipid analyses, while the fourth classification system should be used for describing the lipid biosynthetic pathways.
III. Methods of sample collection and storage
Since the work of Pes (Pes, 1897), meibomian glands are considered the major sources of lipids of the TF. Collection of meibum and TF samples can be accomplished in several ways. These were described in detail on multiple occasions and include three major techniques: 1) soft and hard expressing of meibum directly from the meibomian glands of the eyelids and collecting samples with a spatula (Butovich et al., 2007a), 2) microcapillary collection of meibum directly from the meibomian gland orifices (Nichols et al., 2007) and AT collection from the TF meniscus (Pholpramool, 1979; Jauhiainen et al., 2005; Okumura et al., 2005; Nichols et al., 2007; Butovich, 2008), and 3) Schirmer’s test strips (Borchman et al., 2007; Butovich, 2008; Yenice et al., 2008) and a similar approach which utilizes cellulose acetate absorbent filters for tear protein collection (Esmaeelpour et al., 2008). For obvious reasons, the forth possible approach, surgical removal of eyelids and/or meibomian glands implemented in a few animal (Greiner et al., 1996a; Greiner et al., 1996b) and human cadaver (Nicolaides and Santos, 1985) studies, is not an option for a living human sample donor.
The soft and hard expressing techniques differ in the force applied to the eyelids, with the latter used primarily for cadavers (Nicolaides et al., 1981). Soft expressing produces the sufficiently large samples of pure meibum [up to one milligram of dry lipid material per donor (Fig. 1)], unless there is a pathological process (e.g. of the gland inflammation or meibomian gland obstruction which would make it difficult to express meibum without applying too much force, or without contaminating the sample with exogenous components. However, this procedure is the most uncomfortable for the donors as ocular structures are richly innervated and very sensitive to the touch.
Figure 1.
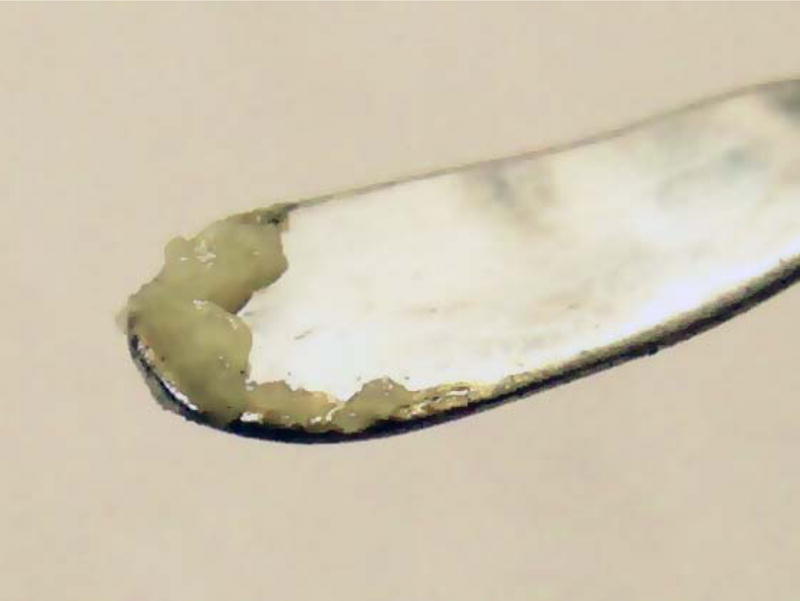
Human meibum collected using the eyelid squeezing method and a spatula. Note meibum solidification at room temperature
The microcapillary technique of the AT collection, on the other hand, is well tolerated by human donors, but provides the smallest samples (in the vicinity of several microliters, or a few milligrams, of watery AT) (Butovich, 2008). The amount of meibum which can be collected directly from individual meibomian gland orifices using microcapillaries is even smaller and does not exceed a few micrograms (Nichols et al., 2007), primarily because of the immediate solidification of meibum in the tip of the capillary at room temperatures, which clogs the microcapillary and prevents meibum from filling it out. The latter observation was originally made by Linton et al (Linton et al., 1961) and was later re-confirmed in our studies (Butovich, 2008).
The Schirmer’s test strip technique and its variants are the safest way of collecting AT. It is also the least traumatic procedure for the vast majority of the donors, though individual responses may vary. The procedures yielded enough human AT lipid material for IR and HPLC-MS studies (Borchman et al., 2007b; Butovich, 2008) and for post-instillation determination of cyclosporine in rabbit AT (Yenice et al., 2008). It regularly yields the samples in the excess of 10 microliters, and can be repeated several times a day with no adverse effects for the donor (Butovich et al, unpublished). However, this technique seems to be inappropriate for collecting meibum, as it requires some sort of a force applied to the eyelids to express meibum before it is absorbed by the strip. Additionally, it increases the chances of cross-contaminating the meibum samples with AT as the latter are more readily absorbed by the Schirmer’s test strips. Thus, one can conclude that soft expressing is, probably, the best procedure for collecting pure meibum from a living donor, while microcapillaries and Schirmer’s strips are better suited for collecting AT.
Sample handling and storage should be done according to the general rules of lipid handling (http://www.avantilipids.com/index.php?option=com_content&view=article&id=1679&Itemid=1398) (2009c)]. The best solvents for making meibum and AT stock solutions are chloroform, methanol, ethanol, iso-propanol, hexane, and their combinations. Greatest care should be taken to avoid any contact of lipid solutions with plasticware and silicone: many polymers and plasticizers can contaminate the sample even after a brief contact of meibum solutions with plastic. However, some solvents (e.g. methanol and ethanol) are less prone to dissolve plastic than the others (e.g. chloroform), and thus are safer to handle. It would be prudent to avoid plasticware altogether and use only glass, stainless steel or noble metals, and Teflon®. Meibum and AT samples should be stored in dry state under nitrogen or argon at −80°C. Under these conditions, the major lipid components of meibum were shown to be stable for months, if not years (Butovich et al, unpublished). However, at this time the long-term stability of minor meibum components is not known, and needs to be evaluated on a case-by-case basis.
IV. Methods of lipid analyses
Analytical procedures used in lipid biochemistry and biophysics are no different from those employed in routine analyses of organic compounds and include a wide variety of chromatographic and spectroscopic techniques, chemical manipulations, elemental analysis, gravimetric analysis, calorimetry, lipid-specific staining, and many others. Let’s consider in more detail the analytical methods relevant to lipidomics in general, and to meibum research in particular.
1. Chromatographic methods
For the reader’s convenience, a diagram that summarizes the methods described below is presented in Scheme 3.
Scheme 3.

Comparison chart of common chromatographic methods of meibum lipid analyses.
During the last century, chromatography became a de-facto standard in separating complex mixtures of lipid compounds. Three major types of chromatography are thin layer chromatography (TLC), gas chromatography (GC) and its sub-variant gas liquid chromatography (GLC), and various forms of liquid chromatography (LC). Note that GLC is technically a variant of GC, and has no relationship to LC, which is a totally different experimental approach.
Thin layer chromatography
TLC is a technique whose strengths are, above all, simplicity and cost-effectiveness. TLC was a popular choice in the earlier studies of meibum (Ehlers, 1965; Nicolaides, 1965; Andrews, 1970; Cory et al., 1973; Nicolaides et al., 1981; Shine and McCulley, 2003), and still is in use as a supplemental technique when a routine and crude separation of mixtures is all that is needed. However, multiple problems arise when using TLC for analyzing small, but complex, samples such as meibum. Those include, but are not limited to, low sensitivity and, typically, poor resolution achieved in the TLC experiments. The latter are caused by several factors intrinsic to the TLC procedure, among which the radial diffusion of the sample on the TLC plate and sample tailing quickly diffuse and dilute the sample, while notorious problems with sample visualization after the chromatography limit our ability to locate all the spots and bends on the plate, and hamper their quantitation. These could be partly overcome by using a variant of TLC called high performance TLC (HPTLC), which minimizes sample diffusion and dilution, but HPTLC accentuates impurities in the sample, the solvent, and the silica gel HPTLC plate. Employment of radioactively labeled standards spiked with samples would be a sound way of increasing the informativeness of TLC analyses. However, this approach may become prohibitively expensive, environmentally hazardous, and, on top of all, limiting in terms of the availability of radioactively labeled lipid standards. Another type of problem which one may encounter in TLC is a quite probable low stability of at least some of the analytes during the prolonged exposure to oxygen, light, and acids and bases often present in TLC solvents. These factors are known to uncontrollably degrade lipid samples through their oxidation, isomerization, hydrolysis/solvolysis, precipitation, etc.
One of the most difficult parts of TLC is identification of the analytes and confirmation of their homogeneity. As lipids can rarely be stained with high selectivity in terms of their individual species or even classes, one typically uses a less specific stain hoping to visualize as many individual lipids and lipid classes as possible. Charring of lipids at high temperatures after treating a silica gel plate with strong acids or oxidants, or the use of TLC plates impregnated with a fluorescent pigment (Nicolaides, 1965) (under the UV light, lipids become visible as dark spots or bends on the glowing TLC plate), or spraying the plate with a hydrophobic fluorescent dye to stain the lipids, are standard but less than perfect techniques. Rarely can a researcher see more that 10 clearly distinctive and quantifiable HPLC spots. In certain cases, selective staining of lipid classes was implemented (Linton et al., 1961; Ehlers, 1965; Andrews, 1970), but as noted by Ehlers (Ehlers, 1965), the specificity of these methods was not overwhelmingly high. A more common approach has been lipid charring after spraying the plates with strong acids and oxidants, which was to visualize the entire lipid pool present on the TLC plate. Unfortunately, quantitation of lipids by this method leaves a lot to be desired in terms of its sensitivity, selectivity and reproducibility. There was no practical way to precisely correlate the degree of charring (or even to measure it) with the physical amount of the charred lipid. Also, it is well known that all other things being equal, the degree of charring strongly depends on the chemical nature of the compounds being analyzed, such as the absence or presence (and the number) of double bonds, hydroxy and amino groups, etc. Thus, the charring technique can hardly be called a quantitative approach, and should only be qualified as a visualization technique. The only truly universal identifying parameter in TLC experiments is the compound’s mobility in the relation to the solvent front (Rf) compared with that of the compound’s putative standard. However, choosing a standard for an unknown analyte in a complex mixture, and determination of their exact Rf values are more of an art (or gambling) than science.
Gas chromatography/gas-liquid chromatography
Analyzing, identifying, and quantifying of individual meibomian lipids, which are predicted to exist as hundreds of various lipid species, by TLC would be an almost impossible venture. Thus, TLC is often combined with other analytical techniques, such as GC and GLC. This combination has proven to be a much more successful approach, because a preliminary fractionation of lipid samples by lipid classes in a TLC experiment followed by a subsequent GC/GLC analysis of the individual lipid TLC bands reduces uncertainties in lipid identification. As GC/GLC provides a much higher resolution, selectivity, and sensitivity than TLC, an apparently TLC-homogeneous fraction could be found to be a complex mixture of various co-eluting compounds. However, the classical GC/GLC approach with a flame ionization detector [a popular choice since its introduction in the fifties of the 20th century (Harley et al., 1958; McWilliam and Dewar, 1958)] also suffers of serious shortcomings.
Firstly, the analyte identification in GC/GLC is based solely on its retention time compared with that of a corresponding standard, which leaves room for the analyte misidentification since: a) there are no commercially available authentic standards for the vast majority of lipids, and b) even a perfect co-elution of an analyte with its putative standard does not guarantee the positive identification of the former.
Secondly, the conditions of GC/GLC are harsh with column temperatures reaching 200 to 400°C and experiments routinely lasting from 30 min to 1 hr or longer, which causes many compounds to partly, or completely, decompose or isomerize before reaching the detector. PUFA and complex lipids, for example, are notoriously unstable at these temperatures. This instability results in the decreased sensitivity of the analysis, increased background noise, and the detection of false GC/GLC peaks formed from the decomposition/isomerization products of the analytes.
Thirdly, GC/GLC requires the analytes to be volatile, which is not the case with the overwhelming majority of complex lipids. The volatility may be increased by hydrolyzing complex lipids and by performing (trans)esterification/silylation of their fragments before the GC/GLC analysis. Unfortunately, these procedures complicate deducing the original combinations of the fragments in the starting, intact compounds.
Presently, the most informative technique of detection and identification of the analytes in GC/GLC experiments is mass spectrometry (MS) (see below). MS significantly improves the reliability of identification of analytes by providing precise information on their molecular masses and fragmentation patterns, but in combination with GC/GLC, it still requires the complex analytes to be hydrolyzed and transesterified or silylated. MS also does not change the temperature requirements for GC/GLC separation, so the sample decomposition/isomerization may still be a limiting factor in the sample analysis.
Liquid chromatography
LC has been known since the early 20th century (Tsvet, 1906). It offers the mildest conditions for sample separation: a) the analysis can be performed at, or below, room temperature; b) intact samples can be routinely analyzed “as is” without a need of sample hydrolysis/transesterification; and c) there is no requirement for the analyte to be volatile. In many cases, individual components of the sample can be isolated in pure form, collected, and re-analyzed by the same, or a different, technique.
A current de-facto standard technique of LC analysis of organic compounds is high performance (or pressure) LC (HPLC) and its newer incarnation – ultra high performance (or pressure) LC (UPLC). Though more expensive than open-column LC or low pressure LC, HPLC/UPLC offers the highest resolution, selectivity, sensitivity, and repeatability of the analyses among all LC and TLC techniques. It is also a very flexible technique in terms of the type of the column and the mobile phase, both of which allow a researcher to adjust the experimental conditions to serve a particular purpose.
There are many variants of HPLC, of which three techniques, namely normal (or straight) phase HPLC (NP HPLC), reverse (or reversed) phase HPLC (RP HPLC), and ion-exchange HPLC (IE HPLC) are most used in lipidomics. The differences between the three techniques lay in the nature of the packing material of HPLC columns and the type of HPLC eluent. The usage of HPLC in meibum research was, apparently, pioneered by McFadden et al (McFadden et al., 1979).
NP HPLC utilizes either uncoated silica gel as the column packing, or certain types of chemically modified silica gels, such as diol or cyanopropyl silica gels. These columns are mostly used to separate lipid classes as the defining factor that determines the order of elution of the analytes and their retention times is the nature of their polar groups, and much less the type of their nonpolar tails. Thus, one can expect that the analytes will be eluted as groups of related compounds, which would greatly simplify their correct identification. In NP HPLC, as a rule, the longer the retention time of the analyte, the more polar the compound: FA esters will elute faster than free FA, CE – faster than free Chl, etc.
RP HPLC, on the other hand, utilizes primarily the overall hydrophobicity of the molecules as the determining factor in the separation of lipid species. Thus, the order of elution of the analytes is, typically (but not always) the opposite of that in NP HPLC – free FA will elute faster than WE, Chl – faster than any CE, etc. Importantly, the individual members of a lipid class (e.g., various WE) will almost always elute in the order of their increasing hydrophobicity: the longer the molecule of WE, the longer its retention time. Several exclusions from this rule can be caused by, e.g. varying degrees of unsaturation, oxidation, and branching (see chapter V. Meibomian Lipids).
IE HPLC can be used in ionic lipids analyses as it allows separation of analytes on the basis of their charge, e.g. phospholipids. However, no reports on using this technique in meibum research have ever been published.
Typical detection techniques used in HPLC/UPLC are ultraviolet and visible range spectrometry (UV-ViS), fluorescent spectrometry (FS), MS, radioactivity monitoring with the help of scintillation counters, and evaporative light-scattering detection (ELSD) technique. A usage of electrical conductivity detectors is limited to ionic lipids, and, to the best of our knowledge, has never been implemented in meibum research. However, it has some potential in evaluating certain ionic lipids which could be in AT and meibum, such as free fatty acids, phospholipids, sulfolipids, etc. Scintillation counters are widely used for in vitro studies, and could be employed for in vivo studying of lipid metabolism in animal models (but not in humans). Their usability for human studies is confined to the area of spiking meibum samples with radioactively labeled standards, thus requiring two analytical techniques to be used in tandem – one for natural, unlabeled compounds, and the second for the radioactively labeled standards.
The two most frequently used detection techniques in lipidomic analysis of meibum are UV-ViS and MS.
UV-ViS is a well-established and relatively economical approach to monitoring HPLC effluents for the presence of compounds that absorb light in the UV/ViS region of the electromagnetic spectrum. Many individual lipid species and lipid classes, which have appropriate chromophores in their structures, can be successfully detected using UV/ViS, for example leukotrienes (Kumlin, 1996), oxy-PUFA (Butovich et al., 2005), tocoferols (Semeraro et al., 2009), and certain PL (Bernhard et al., 1994). However, not every lipid has a chromophore, thus not every lipid can be successfully detected by UV/ViS. Moreover, many HPLC solvents, which proved to be useful in TLC or open-column LC, cause unacceptably high background absorption in the UV range of the spectrum, thus masking the absorption of the analytes. Benzene, toluene, and chloroform are a few examples of such incompatible solvents. Their absorption in the UV region between 200 and 250 nm is too strong to be used for monitoring lipids, most of which require the UV/ViS detector to be tuned to the same wavelength. HPLC-UV was used in several meibum studies, which are discussed below.
MS, on the other hand, relies on the detection of ionized forms of analytes, regardless of whether those are cations (such as choline-containing compounds), anions (dissociated free FA, phosphatidic acid etc), or some sort of ion adducts of the analytes (with proton, sodium, potassium, ammonium, formate, and acetate adducts being among the most common ones). This approach provides unparalleled flexibility in monitoring of an almost infinite range of analytes, and offers an equally unprecedented sensitivity (routinely on nanogram to picogram levels). MS is also compatible with a wide range of HPLC solvents (importantly, MS is compatible with chloroform-containing solvent mixtures – one of the major types of solvent mixtures in lipid studies). During the last decade, HPLC-MS has become an important tool in the arsenal of a lipidologist, and has all but eclipsed HPLC-UV, except for very specific cases when UV absorption spectra recorded by UV/ViS diode-array detectors may provide structural information on the analytes, for example on the cis, trans geometry of their conjugated double bonds (Butovich and Reddy, 2001).
Spectroscopic methods
UV/ViS, FS, IR, NMR, and MS when used as stand alone procedures have a potential to provide invaluable information on the structures of organic compounds, including those found in human meibum (Scheme 4). However, all of them have certain limitations, while their strengths are most apparent when working with pure compounds, not complex lipid mixtures.
Scheme 4.

Comparison chart of common spectroscopic methods of meibum lipid analyses
UV/ViS spectrometry deals with electronic absorption spectra of molecules and is useful in studying cis, trans geometry of conjugated double bonds and their number (Butovich and Reddy, 2001), in identifying tocoferols (Semeraro et al., 2009) and leukotrienes (Kumlin, 1996), and in evaluation of other compounds that possess characteristic chromophores. However, UV/ViS is far less informative when it comes to, e.g., methylene interrupted double bonds, which absorb light only in the far UV region of spectrum, and whose absorption spectra do not vary much from a compound to a compound. The vast majority of common lipids cannot be successfully evaluated by UV/ViS as they do not have any specific chromophores. Typical (non-oxidized) phospholipids, steroids, wax esters, acylglycerols and many others, though absorptive at 205 nm enough to be detected in HPLC experiments (Bernhard et al., 1994), cannot be differentiated one from the other on the basis of their UV/ViS absorption spectra with any degree of certainty, leaving their HPLC retention times as the only identifying parameter. Importantly, UV/ViS spectra provide information only on the chromophores themselves and, possibly, on their immediate surrounding, leaving the distant, UV/ViS-inactive groups uncharacterized. So far, UV/ViS as a stand alone technique has not been used in meibum studies, but was reported to be useful in combination with HPLC to detect certain oxidized lipids (Wojtowicz et al., 2009).
Fluorescent spectrometry is based on the ability of certain molecules to emit light in response to their excitation by electromagnetic radiation with a shorter wavelength. Excitation and emission spectra of normal lipids are not very informative, unless one uses fluorescently labeled lipids. The latter approach is very instrumental in studying lipid conformations and aggregation phenomena, when labeled lipids are mixed with normal ones, but is of little help in structural studies of intact lipids. To the best of the author’s knowledge, no reports on using FS for studying intact meibomian lipids have ever been published.
Infrared spectroscopy is helpful in detecting various lipids as it is sensitive to the vibrational and rotational movements of their groups and provides information on the types of covalent bonds present in their structures, such as various types of carbon-carbon, carbon-hydrogen, carbon-oxygen, and carbon-nitrogen ones. In meibum and TF studies, IR was pioneered by Linton in 1961 (Linton et al., 1961) and then successfully used for detecting various classes of lipids and to evaluate their phase transitions (Borchman et al., 2007a; Borchman et al., 2007b). However, IR rarely provides enough information to deduce a complete structure of a molecule without employing other methods, and it is very difficult, if not impossible, to achieve that goal if the sample is a complex mixture of various molecules, such as meibum. It also does not provide any information on the molecular masses of the analytes, and is difficult to adapt for quantitative analyses of mixtures. Thus, IR is best suited for analyzing pre-purified samples of individual compounds and for conformational analyses of mixtures when the focus is on the mixture as a whole, and not on its individual components.
It is a general consensus that nuclear magnetic resonance spectrometry in its various incarnations is one of the most informative spectroscopic techniques available today. Born in 1938 (Rabi et al., 1938), and perfected several years later (Bloch, 1946; Purcell et al., 1946), NMR became an indispensable tool in structural and conformational analyses of complex organic molecules. Most widely used for lipid analyses are one- and two-dimensional versions of 1H, 13C, 14N/15N, and 31P versions of NMR. However, only a few papers on the lipid profiling of meibum and TF lipids were published (Greiner et al., 1996a; Greiner et al., 1996b). This (largely undeserved) unpopularity of the technique is caused primarily by three factors: 1) high cost and complexity of the NMR equipment and experiments; 2) the complex nature of meibum (again, as with all the techniques discussed above, NMR works best with pre-purified samples of individual compounds when the goal is their structural identification); and 3) a relatively low sensitivity of the method (typically, one milligram or more of a pure compound is needed to keep the length of an experiment reasonable). There is no doubt that with the advancement of the NMR methods these problems will be overcome and NMR will become a routine procedure in lipidomic studies of complex mixtures.
Mass spectrometry has become a key analytical technique in lipid analysis because of its sensitivity and flexibility. There is no other analytical method today that allows analyzing samples of complex organic compounds on micro- to femtogram levels. There is no other method that provides direct information on molecular masses of a range of analytes simultaneously present in a complex sample. There is no other method that enables a researcher to work with a particular component from a complex mixture and study its structure – without the need to pre-purify it first. To further expand the possibilities of MS, one can use deuterated standards of the analytes and study them alongside with the natural compounds. In combination with HPLC (discussed above), MS undoubtedly reigns the field of lipidomics. It comes as no surprise that MS has been extensively used in meibomian lipid studies (McFadden et al., 1979; Krenzer et al., 2000; Sullivan et al., 2000; Sullivan et al., 2002b; Butovich et al., 2007a; Butovich et al., 2007b; Nichols et al., 2007; Butovich, 2008; Butovich, 2009). Currently, it is one of the fastest evolving analytical techniques.
As a rule, a compound needs to be ionized to become suitable for MS analysis. The most appropriate techniques of ionization for lipidomic analysis are various forms of atmospheric pressure ionization (API) MS, which include electrospray ionization (ESI), atmospheric pressure chemical ionization (APCI), atmospheric pressure photoionization (APPI), and matrix assisted laser desorption/ionization (MALDI) techniques (Scheme 5). MALDI and ESI are designed for analyzing polar molecules (been originally developed for protein and carbohydrate analyses), while APCI and APPI are targeting more hydrophobic compounds. Thus, ESI performed well in phospholipid analyses (Postle et al., 2007), while APCI excelled in the studies of nonpolar meibum lipids (Byrdwell, 2001; Isaac et al., 2007). After ionization of the analyte(s), the resulting ions need to be separated and detected. Ion separation is based on their mass-to-charge ratio (m/z) and is achieved by using a range of techniques, the most common of which are quadrupole, ion trap, and time-of-flight (ToF) ones. Ion traps are also called MSn spectrometers with n meaning a number of sequentional MS steps (currently, up to 10 or so). Quadrupole and triple-quadrupole instruments offer wider dynamic range than ion traps, but cannot perform multiple sequentional fragmentations of ions, and are typically limited to just one fragmentation step (so called, MS/MS, or MS2, instruments). A newer design – orbitraps – is a promising, though still expensive, innovation (Hu et al., 2005). Other types of MS analyzers, such as sector (Cottrell and Greathead, 1986) and Fourier transform ion cyclotron resonance instruments (Marshall et al., 1998) are, as of this moment, too expensive and exotic for routine use. MALDI instruments, offering one of the mildest ionization conditions, were developed primarily for the analysis of large molecules such as proteins and polysaccharides. They find their uses in lipidomics in general and TF lipid studies in particular (Ham et al., 2005), but suffer of relatively narrow dynamic range, problems with choosing a suitable matrix, and spotty reproducibility. In addition, they are better suited for analyzing polar compounds, which most lipids are not. We have had good experience with APCI and ESI ion trap MS as these approaches are extremely flexible in terms of experimental designs, work well with both polar and nonpolar lipids, and allowed us to perform multiple sequential fragmentations of parent ions, which proved to be very useful in structural evaluation of meibum lipids (Butovich et al., 2007a; Butovich et al., 2007b; Butovich, 2008; Butovich et al., 2008; Butovich, 2009a, Wojtowicz et al., 2009).
Scheme 5.

Comparison chart of stand-alone mass spectrometric methods in lipid analysis
Used as a stand alone procedure, MS requires a sample to be dissolved in an appropriate solvent or solvent mixture and be continuously infused into an ion source of a mass spectrometer with the help of a syringe pump. The rate of infusion is typically a few microliters a minute. To convert electroneutral molecules in ions, promoters of ionization must be added to the solvent. Those could be donors of protons such as acids, or acceptors of protons, such as bases. Common additives are water, formate, acetate, chloride, and ions of ammonia, sodium, potassium, and lithium, among the others. Depending on the chemical nature of the analytes, one can choose an appropriate solution to form either positively or negatively charged ions of the compounds. Thus, the experiments can be run in the positive, or the negative ion modes. Most of the experiments with meibum compounds were performed in the positive ion mode (McFadden et al., 1979; Krenzer et al., 2000; Sullivan et al., 2000; Sullivan et al., 2002b; Butovich et al., 2007a; Butovich et al., 2007b; Butovich, 2008; Butovich, 2009a, Wojtowicz et al., 2009). However, the negative ion mode was found to be instrumental in the analyses of unusual lipids found in human meibum (Butovich et al., 2007a; Butovich et al., 2007b; Butovich et al., 2009b). The main advantages of the direct infusion experiments are their simplicity and efficiency – it often takes less than a minute and a few microliters of a sample to generate its quality observation spectrum. However, a phenomenon called “ion suppression” may hinder such an experiment. Ion suppression is, in general, poorly understood, but its consequences are severe and may include deviation of the dose-signal curves from linearity, loss of sensitivity, accuracy and precision, and, in some cases, inability to detect certain compounds or whole classes of the compounds [http://chromatographyonline.findanalytichem.com/lcgc/article/articleDetail.jsp?id=327354 and (Nichols et al., 2007)]. A common opinion is that ion suppression is more likely to be observed in concentrated, complex, and poorly prepared samples with high degree of contamination with exogenous compounds. The chances of ion suppression of a particular ion in a complex sample while performing a direct infusion experiment are high because all the components of the mixture are infused simultaneously and their effects on each other’s ionization cannot be predicted beforehand. However, in an HPLC-MS experiment these detrimental effects are minimized (but not completely eliminated), because the components of the mixture get separated during the HPLC step and reach the mass spectrometer as relatively simple mixtures, or even individual compounds. Thus, ion suppression is much less likely to manifest itself, unless it is caused by poor choice of the HPLC solvent or MS conditions.
Summarizing this discussion of some of the major analytical techniques pertinent to lipidomic analysis of meibum and TF, we should conclude that the most potent and informative technique today is MS, especially in conjunction with HPLC. The other spectroscopic and chromatographic techniques, such as NMR, IR, UV/ViS, FS, TLC and GC can provide a wealth of information on certain aspects of the samples and nicely complement MS techniques, but the conclusions from those experiments should be used cautiously if not supported by MS and/or HPLC-MS. With this understanding, let’s consider the information available on lipidomic analysis of meibum and TF.
V. Meibomian lipids
It has long been recognized that meibum is an extremely complex mixture of lipids. Judging from the literature, the theoretical number of individual meibomian lipid species is estimated to be in hundreds, if not thousands. We routinely observe more than a hundred of major individual compounds in our HPLC-MS experiments, the number of which could easily multiply considering the (quite possible) presence of isobaric compounds (i.e. different compounds sharing the same molecular weight and m/z), and the presence of innumerable minor components. As detailed analysis of this massive body of various analytes will probably require more than one experimental approach, a first step in the complete lipidomic analysis of meibum and TF should be characterization and cataloging of their lipids in terms of lipid classes.
Initial characterization of meibum was conducted in 1897 by Pes (Pes, 1897) who used staining to confirm its lipid nature. He came to the conclusion that meibum was rich in fats, free fatty acids and cholesterol. Since the work of Linton et al (Linton et al., 1961) and Ehler (Ehlers, 1965), TLC became a popular procedure that demonstrated that meibum was enriched with neutral fats, steryl and wax esters, and possibly contained other classes of lipids such as acyl glycerols, free sterols and fatty acids, ceramides, phospholipids and other polar lipids (Nicolaides, 1965; Cory et al., 1973; Baron and Blough, 1976; Tiffany, 1978; Nicolaides and Santos, 1985). However, the known limitations of the then-current analytical techniques (discussed above) could have thwarted the positive identification of not only individual lipid species (which is beyond the reach of TLC anyway), but of the entire lipid classes as well.
Simple lipids (Scheme 1) are a minority in human meibomian lipid pool. These mostly include free Chl (Cory et al., 1973), free FA and FAl (Cory et al., 1973; Tiffany, 1978; Shine and McCulley, 2000), and squalene (Tiffany, 1978). However, there are concerns about the methodology implemented in the earlier studies to detect some of these compounds, such as hydrocarbons and squalene. According to Nicolaides et al (Nicolaides et al., 1981), hydrocarbons found in human samples, were of exogenous origin, while squalene was missing. Thus, unusually high amounts of unspecified hydrocarbons (up to 40%) and squalene (between 1 and 7%) reported by in some studies (Holly, 1973), (Tiffany, 1978), could be a result of sample contamination and/or misidentification of the analytes. Recently, squalene was detected by contemporary HPLC-MS technique (Butovich et al., 2007b; Butovich, 2008), but only as a very minor component, and only in a few samples. This was interpreted as an inadvertent contamination of meibum and AT sample with skin lipids. Chl, on the other hand, is a permanent constituent of meibum and AT (Tiffany, 1978; Shine et al., 2003; Butovich, 2008), with AT having a higher ratio of free Chl to CE (Butovich, 2008). The latter is in general agreement with a publication of Wollensak et al (Wollensak et al., 1990) who reported up to 15% of Chl in AT. Our estimation of free Chl in AT is closer to 5 to 10% (w/w) (Butovich et al, unpublished), while in human meibum it is between 0.5 and 1% (Butovich et al., 2007a; Butovich et al., 2007b; Butovich, 2009a ). Chl content in meibum has often been reported in the range of 1 to 2% of the whole meibum. In those reports where free Chl was not found, the sensitivity of the assays might have been an issue. Other simple lipids such as sphingosines, prenol lipids and flavonoids, to the best of our knowledge, have not been reported as meibum components.
The vast majority of lipid species present in human meibum are complex lipids (Scheme 2). When discussing these compounds, one needs to realize that because of the limitations of the then-current experimental techniques, in most of the meibum studies the researchers were not able to analyze intact complex lipids and resorted to the analyses of their hydrolyzation products. Thus, CE were hydrolyzed to Chl and free FA, WE – to free FA and FAl, acylglycerols – to free FA and glycerol, etc. Consequently, if no preliminary separation of individual lipid species or, at least, their classes was performed [as, for example, in (Joffre et al., 2008; Souchier et al., 2008)], it was impossible to reconstruct molecular structures of the initial unmanipulated compounds.
The fatty acid and fatty alcohol components of the complex lipids of human meibum were exhaustively studied and documented by Nicolaides, Tiffany, Stevens Andrews, McFadden, Shine and McCulley, and others in numerous publications. For example, in recent papers on the topic, Joffre et al (Joffre et al., 2008) and Souchier et al (Souchier et al., 2008) studied the overall FA content of human meibomian lipids using GC-MS. The whole meibum samples were traditionally transesterified with a BF3/methanol reagent. The researchers were able to identify more than 20 individual FA species varying in the lengths of their carbon chains, unsaturation, and branching (iso/anteiso) and ranging from C14:0 to C26:0 with three unsaturated FA being C18:1, C18:2, and C18:3. Interestingly, great donor-specific variations in the FA and FAl content were observed by Tiffany (Tiffany, 1978), but not by Joffre et al (Joffre et al., 2008) and Souchier et al (Souchier et al., 2008). It appears that either the sample collection/handling methods, or analytical errors could have been a problem in the early studies of meibum samples collected from individual donors (Cory et al., 1973; Tiffany, 1978). Regardless of the sample variations, Tiffany (Tiffany, 1978) and Nicolaides et al (Nicolaides and Santos, 1985) reported a broad range of total transesterified FA (between C9 and C34), while their estimates for FAl were between C12 and C34. However, none of these FA and FAl could be assigned to any particular lipid, as the information on the structures of the starting molecules had been irreversibly lost during the transesterification step. In an earlier report by Andrews (Andrews, 1970) the major free FA fell in a similar range of C15 to C30, whilst FAl varied between C20 and C28. These variations between the reports are most likely caused by variations in the implemented techniques, sample instability during the analyses, and are mostly insignificant. It remains to be seen if transesterification of very complex meibum lipid molecules and harsh conditions of GC/GLC analyses could, in some cases, have caused sample degradation/isomerization and led to analytical artifacts such as false positives.
It is a general consensus that the combined wax esters and cholesteryl esters fraction represents about 60% of total meibum lipids. However, molecular structures of their individual species have never been studied and/or reported. Indeed, if a mixture of lipids depicted in Schemes 1 and 2 had been hydrolyzed/transesterified without their prior HPLC separation, it would have generated the following free or transesterified FA: C12:0, C16:0, C18:0, C18:1, C18:2, C18:3, C22:0, ω-hydroxy-C18:0, ω-hydroxy-C34:0, 13-hydroxy-C18:2, among the others. Thus, correct assignments of the FA to particular intact lipids would have been impossible to make. Even if the intact lipids had undergone preliminary separation into classes by HPLC or TLC before the hydrolization/transesterification steps, their positive identification would have been very difficult because of the limitations of these methods discussed above. In case of WE and steryl esters, which are notoriously difficult to separate, the hydrolyzate would have contained a mixture of dozens of various FA, FAl, and sterols which would lead to a large number of their possible combinations, of which only a few might have been present in the initial intact sample. In our recent publications (Butovich et al., 2007a; Butovich et al., 2007b) we were able to demonstrate that intact WE of human meibum are mostly oleic acid esters of very long chain saturated FAl. The carbon chain lengths of the major FAl ranged from C18 to C30. CE, on the other hand, were found to be a depot of very long chain C16 – C34 FA (Butovich, 2009). No information on possible branching of the compounds was gathered in our studies, though many of the detected meibum WE and CE coeluted with authentic standards of non-branched (straight-chain) lipids.
Meibum acylglycerols (TAG, DAG, and MAG) (Scheme 1) were observed in multiple studies (Cory et al., 1973; Tiffany, 1978; Mathers and Lane, 1998; Krenzer et al., 2000; Sullivan et al., 2000; Sullivan et al., 2002b; Sullivan et al., 2002c; Shine et al., 2003; Sullivan et al., 2006). When quantitation of TAG was performed, the reported range was between 2 and 40% of meibum (w/w). This apparently a huge variation becomes a much more cohesive 2 to 6% if one excludes a report by Tiffany (Tiffany, 1978) in which the range of TAG was estimated to be 11 to 43%. In a series of publications describing the effects of androgens on lipid metabolism in meibomian glands, Sullivan, Krenzer et al (Krenzer et al., 2000; Sullivan et al., 2000; Sullivan et al., 2002b; Sullivan et al., 2002c; Sullivan et al., 2006) evaluated the changes in the relative lipid profiles, including DAG and TAG (Krenzer et al., 2000), by using HPLC-MS. No actual quantitation or structural characterization of DAG and TAG lipid was attempted, and the lipids were identified on the basis of their retention times. Judging from the reported m/z ratios, TAG were detected as fragments of the parent ions which underwent an in-source neutral loss of one of their fatty acid moieties – a phenomenon well know in mass spectrometry and reported for similar compounds on other occasions too (Butovich, 2008). Thus, assuming that the ions of TAG reported by Krenzer et al (Krenzer et al., 2000) and Sullivan et al (Sullivan et al., 2000) were proton adducts, they could have the following formulas: m/z 551 – C35H66O4 (C16:0:C16:0, or [dipalmitoyl glycerol – H2O + H]+); m/z 577 - C37H69O4 (C16:0:C18:1, or [palmitoyl-oleoyl glycerol – H2O + H]+), etc. As no signals of starting TAG were reported in these papers, one cannot evaluate the nature of their third acyl component(s). The DAG had the same m/z values as TAG, which was quite expected, because in APCI MS experiments proton adducts of DAG undergo loss of water and are detected as [M – H2O + H]+ species (Butovich, 2008).
Lipid epoxides were reported to be present in meibum on at least two occasions (Shine and McCulley, 1993; Sullivan et al., 2000). Considering that a substantial part of meibomian lipids are unsaturated compounds with at least one, or more, double bonds capable of forming epoxides, it was logical to assume that some of them would react with molecular oxygen and form epoxides either enzymatically, or through nonenzymatic pathways (Keeney et al., 1998; Doshi et al., 2006; Schneider et al., 2008; Suzuki et al., 2008). The resulting epoxidized lipids of any class would have become less hydrophobic than their unoxidized precursors, which would create a pool of compounds more readily interacting with aqueous phase of TF – possibly, beneficial to the stability of TF. Epoxidation could also be considered a part of normal and/or pathological metabolism of meibum aimed at the replacement of old TFLL with freshly expressed meibum. On the other hand, fast and uncontrolled epoxidation could cause deterioration of TFLL through the removal of their critical components – a definite minus in terms of the TF stability. To find out more about lipid epoxidation in meibum, we conducted experiments designed to detect and characterize epoxides of typical meibomian lipids by comparing the unmanipulated samples of meibum with chemically epoxidized ones (Butovich et al., 2009b). In vitro epoxidation of meibum with peroxyacetic acid – a standard peroxidizing reagent – led to a quick formation of novel epoxidized lipid species. These species were structurally characterized by using HPLC-MSn and their fragmentation patterns were used to evaluate components of untreated meibum in order to detect these, or similar, epoxy-compounds. It appeared that they were completely absent in normal meibum. Thus, we could not confirm the earlier observations on the presence of various epoxy-lipids at this time.
Meibum ceramides (Scheme 2) were reported by Shine and McCulley (Shine and McCulley, 2003) as noticeable components of human meibum. However, in recent HPLC-MS experiments (Butovich et al., 2007a; Butovich et al., 2007b; Butovich, 2008), these compounds were not observed. Considering that in terms of sensitivity and specificity HPLC-MS has a clear advantage in detecting lipid analytes over TLC and HPLC-UV/ViS used earlier, one can conclude that the earlier results were either based on the analyses of samples contaminated with skin lipids, or the compounds were misidentified because of the low specificity of TLC and HPLC-UV (see section IV. Methods of Lipid Analyses, above). In any case, regular Cer are a very minor component of meibum, if any.
FA amides (FAA) are an interesting group of compounds reported by Nichols et al (Nichols et al., 2007) to be a major lipid family present in meibum. FAA are related biosynthetically to free FA and Cer. The dominant member of the FAA family was identified as oleamide (Scheme 2). Oleamide is the best-known and arguably one of the most important members of this class. Oleamide is a neurotransmitter and a sleep-inducing agent produced by brain (Mendelson and Basile, 2001; Farrell and Merkler, 2008). At least six various FAA were reported by Nichols et al (Nichols et al., 2007): oleamide, myristamide, palmitamide, linoleamide, stearamide, and erucamide. The authors advanced further to propose that oleamide, being a major meibum lipid, played a critical role in TFLL stabilization. Curiously, because of its peculiar surface-active properties, oleamide is widely used in industry as slip-inducing agent to lower friction and traction. It is also used as a common plasticizer in producing various polymeric materials, paper, and other products (2009a; 2009b). Thus, the chances are that oleamide can be found in biological samples as either a compound of biogenic origin, or as an exogenous contaminant (Butovich et al., 2007c; McDonald et al., 2008).
In the case of meibum, it appears to be the latter. Indeed, the observation MS spectra of meibum samples presented by Nichols et al (Nichols et al., 2007) are very dissimilar to MS spectra reported in other papers (Sullivan et al., 2000; Butovich et al., 2007a; Butovich et al., 2007b; Butovich, 2008). Nichols et al did not detect any of the two major classes of meibum lipids – CE and WE, reported in numerous earlier and subsequent publications: note the absence of a characteristic signal of Chl and CE (m/z 369, [Chl – H2O +H]+ and [Chl – fatty acid +H]+, respectively). Also missing are multiple WE signals in the range of m/z 550 to 700 (Sullivan et al., 2000; Butovich et al., 2007a; Butovich et al., 2007b). Instead, the spectra showed signals of FAA, a signal with m/z 411 (possibly, squalene), and a signal m/z 663, later shown to be an oxidized form of a common plasticizer/stabilizer Irgafos 168 (C42H63O4P) (Butovich et al., 2008; Millar et al., 2009). The makeup of the FAA detected in meibum with oleamide being a major component is similar to the makeup of FAA detected in solvents which were in contact with plastic (Carrott, 1998; Butovich, 2007; McDonald et al., 2008; Millar et al., 2009). Recently, oleamide was explicitly declared a contaminant that leaches from plasticware and affects biochemical and bioanalytical experiments (McDonald et al., 2008). Importantly, Nichols et al (Nichols et al., 2007) used plastic Eppendorf tubes to handle and store meibum samples dissolved in chloroform-methanol mixtures known to aggressively dissolve plasticware. Considering 1) the extremely small sizes of meibum samples collected in those experiments; 2) the way the samples were handled; and 3) their unusual chemical composition refuted in later studies, one could conclude that the samples were inadvertently contaminated with dissolved polymers and plasticizers, including oleamide (ion m/z 282), other FAA (ions m/z 228, 256, 280, 284, and 338), and Irgafos 168 (ion m/z 663), which were then reported as major meibum components.
The classes of polar and amphiphilic lipids have long been considered a critical part of TF and TFLL. It was proposed that these compounds form a critical intermediate polar lipid sublayer that separates a much thicker nonpolar lipid sublayer from the aqueous layer which covers the cornea. In that intermediate sublayer the nonpolar tails of polar and amphiphilic lipids are immersed in the nonpolar lipid sublayer, while their polar heads are in contact with the aqueous layer (McCulley and Shine, 1997). This organization of the oil/water interface makes sense as it lowers the surface energy of the system and facilitates spreading of the lipids on the surface of the TF. However, the nature of these polar and amphiphilic lipids is currently a subject of debates.
Originally, the polar lipid sublayer was proposed to be formed from phospholipids (McCulley and Shine, 1997). However, Cer, DAG, MAG, and free FA could also be considered good candidates for such a role. Meibum polar lipids and PL were reported in many papers (Linton et al., 1961; Andrews, 1970; Tiffany, 1978; Nicolaides et al., 1981; Tiffany, 1987; McCulley and Shine, 1997; Nagyova and Tiffany, 1999; Sullivan et al., 2002c; Shine and McCulley, 2003), though the detected compounds never underwent scrupulous structural analyses. In many cases, polar lipids and PL were detected by TLC. Quantitation of polar lipids after TLC was performed mostly by their charring after spraying the plates with strong acids and oxidants. As noted above, this method lacks selectivity, sensitivity and reproducibility, and should not be considered a quantitative approach: minor, but easier to char, compounds could produce more noticeable bands than the major, but less char-prone, analytes, which would skew the observations. Also, there was no guarantee that the observed TLC traces were in fact those of PL: the complex nature of meibum requires a deliberate approach to the structural evaluation of its components.
In response to these limitations of TLC, a more sophisticated analytical approach to meibum PL analysis was proposed, namely HPLC-UV (Shine and McCulley, 1998; McCulley and Shine, 2001; Shine and McCulley, 2003; Shine and McCulley, 2004). The method was widely expected to enhance the analytical capabilities of the PL analysis. However, the major handicap of HPLC-UV was discovered to be the extremely low and nonspecific UV/ViS absorptivity of most PL in most areas of the spectrum except for its far ultraviolet region [around 205 nm (Bernhard et al., 1994)]. This dramatically limited the list of compounds that could be detected by UV/ViS, the dynamic range of the analyses, and the list of useable solvents, many of which have a prohibitively high UV absorptivity. These limitations sometimes went overlooked, and instead of using a more appropriate analytical wavelength of 205 nm, researchers monitored the HPLC elution profiles of meibum PL at 220 nm (Shine and McCulley, 1998; McCulley and Shine, 2001; Shine and McCulley, 2003; Shine and McCulley, 2004), known to provide vastly inferior results (Bernhard et al., 1994). This oversight, along with possible contamination of the samples with plasticizers and other contaminants, could explain the earlier reports on a wide variety of PL species found in meibum samples which were not confirmed in our recent HPLC-MS studies (Butovich et al., 2007a; Butovich et al., 2007b; Butovich, 2008). We detected only extremely minor amounts of typical PL in meibum samples, which were in the range of 0 to 0.05% of the total dry meibum weight, and which could be the minor remnants of the meibomian gland cells. Thus, without being able to further characterize the detected HPLC peaks in any other way except for their retention times, in earlier reports (Shine and McCulley, 1998; McCulley and Shine, 2001; Shine and McCulley, 2003; Shine and McCulley, 2004) any contaminants or coeluting lipids could have been easily mistaken for PL and called as such. Also, those earlier experiments cannot be considered quantitative as no calibration (or dose-signal) curves obtained with authentic lipid standards were ever used.
Yet another approach to PL analysis, the 31P NMR spectroscopy, was tested by Greiner et al (Greiner et al., 1996a; Greiner et al., 1996b). 31P NMR allowed the researchers to identify and quantify seventeen PL species from tarsal plates of rabbit (Greiner et al., 1996a; Greiner et al., 1996b). However, rabbit TF samples are vastly different human samples (Butovich and Millar, 2009). Moreover, the surgical procedure of gland removal utilized in the experiments of Greiner et al was later shown to contaminate the meibum samples with PL originated from surrounding tissues (Butovich et al., 2008). To the best of the author’s knowledge, the NMR approach, though very informative, has never been tested with human meibum.
A range of polar compounds was detected in HPLC-MS experiments with human samples by Sullivan et al (Krenzer et al., 2000; Sullivan et al., 2000; Sullivan et al., 2002b; Sullivan et al., 2002c; Sullivan et al., 2006). However, the compounds were not structurally characterized at the time. In three papers where the m/z values of polar lipids were reported in a tabulated form, the charge-to-mass ratios varied from 204 to 902 (Sullivan et al., 2002b; Sullivan et al., 2002c; Sullivan et al., 2006). Surprisingly, the data presented in these papers for four tested patients groups differed markedly from each other: only one peak (out of more than 40 presented) with m/z value of 449 was reported for all four tested groups, while the other six signals (306, 359, 366, 367, 425, and 448) were reported for three groups. The rest of the signals were observed in either two, or just one group of donors. Such a large intersample variability is in sharp contrast with our experience with meibum and AT collected from multiple donors were individual variations were in the range of 5 to 15% or so (Butovich et al., 2007a; Butovich et al., 2007b; Butovich, 2008; Butovich, 2009a). Also, the MS data of Sullivan et al bear no resemblance to the MS spectra obtained in our experiments (Fig. 2). Considering a disproportionally high number of unusually small species reported by Sullivan et al [most of the reported m/z values were below 400 for polar lipids, and below 200 (sic) for nonpolar ones (Sullivan et al., 2000; Sullivan et al., 2002b; Sullivan et al., 2006)] a sample contamination with lower molecular weight compounds and/or solvent peaks might have been an issue. Indeed, as we discussed above, the vast majority of meibum lipids are complex lipids with molecular masses in the excess of 500. The smallest simple lipids routinely found in meibum are Chl (m/z 369, [M – H2O + H]+) and free FA, with palmitoleic acid being among the shortest one (C16:1, m/z 255, [M + H]+) (Butovich et al., 2007a; Butovich et al., 2007b; Butovich, 2008). However, if we consider the molecular masses of FAA contaminants leached from the plasticware in the experiments of Nichols et al (Nichols et al., 2007) with the signals detected by Sullivan et al (Sullivan et al., 2002b; Sullivan et al., 2002c; Sullivan et al., 2006), it becomes evident that the latter signals in the range between 200 and 400 could be what one would expect of proton and sodium adducts of FAA of C10 to C30 family and/or fragmentation products of native lipids: inadvertent fragmentation of labile complex lipid molecules can occur in situ, for example in the ion source of the mass spectrometer, when the conditions of ionization are too harsh.
Figure 2.

Partial observation APCI-MS spectra of human meibum recorded in the positive (upper panel) and the negative (lower panel) ion modes in an NP HPLC experiment.
The HPLC-MS experiments were performed as described earlier(Butovich et al., 2007a).
Indicatively, no typical CE and WE signals were reported by Sullivan et al, whereas the nonpolar lipid pool produced MS signals mostly in the range of m/z 100 to 150 (sic) (Sullivan et al., 2006). These signals are difficult to interpret biochemically as they cannot be possibly attributed to any particular nonpolar meibomian lipid, or a lipid in general. Indeed, judging from their m/z values, these unidentified nonpolar compounds could only be either short chain FA of C5 to C8 family, or hydrocarbons of similar lengths, which are volatile and/or aggressive and irritating liquids with strong smell. Thus, most likely they were either solvent peaks, or low molecular weight chemical contaminations, but not the compounds of biogenic origin.
VI. Implications and future directions
From a medical standpoint, the critical analysis of the ideas, methods, and results presented above raises a few red flags over the design and implementation of some of the earlier clinical and basic science studies aimed at the determination of the possible differences in meibum lipid composition between different groups of general population. Such studies were conducted to detect the differences in meibomian lipid profiles between men and women (Sullivan et al., 2006), young and elderly (Sullivan et al., 2006), pre- and post-menopausal women (Sullivan et al., 2002d), patients before and after treatment with lipid metabolism-affecting drugs (Krenzer et al., 2000; Sullivan et al., 2000; Sullivan et al., 2002c) or food supplements (Sullivan et al., 2002a) etc. However, surprisingly little unequivocal information can be gathered from those studies if we re-evaluate their results in view of the discussed limitations of the typical analytical techniques implemented there. The latter makes it difficult to agree with some of the published observations on the lipid abnormalities and their physiological significance.
Though the reports on the presence of WE, Chl and CE, TAG, and di- and tri-esters of various kinds in meibum laid solid foundation for current and future lipidomic analyses of human meibum, and call just for more detailed structural elucidation and quantitation, some other observations did not withstand their scrupulous re-evaluation. The latter include communications on oleamide and other FAA (Nichols et al., 2007), epoxides (Shine and McCulley, 1993; Sullivan et al., 2000), Cer (Shine and McCulley, 2003), PL (Shine and McCulley, 1998; McCulley and Shine, 2001; Shine and McCulley, 2003; Shine and McCulley, 2004) and a range of (unnamed) polar compounds (Krenzer et al., 2000; Sullivan et al., 2000; Sullivan et al., 2002b; Sullivan et al., 2002c; Sullivan et al., 2006). Uncertainty in the validity of the HPLC-UV (Shine and McCulley, 1998; McCulley and Shine, 2001; Shine and McCulley, 2003; Shine and McCulley, 2004) and HPLC-MS (Krenzer et al., 2000; Sullivan et al., 2000; Sullivan et al., 2002b; Sullivan et al., 2002c; Sullivan et al., 2006) data and structural assignments calls for their thorough re-evaluation as it appears that the observed changes in the lipid profiles between different groups of sample donors might have been unrelated to a drug treatment or a disease onset, but had to do more with experimental artifacts. This scenario is especially frustrating as polar lipids in general, and PL in particular, are assumed to be absolutely critical for maintaining the integrity of TF and TFLL (McCulley and Shine, 1997; Shine and McCulley, 1998; McCulley and Shine, 2001; Shine and McCulley, 2003; Shine and McCulley, 2004). As those studies are among the very few that focused squarely on dry eye and utilized relatively modern approaches, their impact on the field have been strong, but not necessarily straightforward.
As noted above, PL are extremely minor components of human meibum, and are most likely derived from the cell membranes of the meibomian gland cells. The amount of typical PL detected in our experiments was below 0.05% of the total meibomian lipid, and in many samples PL were not detected at all. From the structural standpoint, these small amounts of PL (less than 1 molecule of PL per 2000 molecules of other lipids) seem to be insufficient to maintain the bulk of nonpolar lipids in the TFLL, where the ratio is estimated to be closer to 1 amphiphilic molecule per 20 nonpolar ones). However, at this time we cannot exclude a possibility that TFLL PL could originate from sources other than meibum, for example aqueous tears, cornea, and conjunctiva. It remains to be seen whether those PL could play a role in the human TFLL formation and/or disintegration, considering the massive amount of lipid secretions produced by meibomian glands. The latter, in turn, requires a constant, well-timed, and dosed supply of amphiphilic lipids to spread meibum across the ocular surface and maintain the TFLL structure, which is easier to achieve if both nonpolar and amphiphilic types of the lipids are produced simultaneously in the controlled environment of meibomian glands and are released in a synchronous manner.
Thus, it appears that we know about the actual differences in the lipid profiles between different groups of patients far less than we thought we did, as even the baselines for such comparisons (i.e. the average lipid profiles and their expected ranges) have yet to be established for normal meibum and TF, not to mention patients of various kinds.
If the results of polar and amphiphilic lipid analyses are so ambiguous, then an inevitable question is “What is the composition of the intermediate polar (or, more precisely, amphiphilic) lipid sublayer, which stabilizes TFLL and, possibly, the entire TF?” Currently, this question has no definite answer, as even the hypothesis on the TFLL structure remain to be experimentally proven. However, if such intermediate amphiphilic sublayer existed, the best candidates for it would be nonionic DAG and the negatively charged very long chain lipids of the (O-acyl)-ω-hydroxy-FA family (Scheme 6 and Fig. 2) which are described in our recent paper (Butovich et al., 2009b). Unlike PL, the latter anionic compounds with m/z values of 729, 757, and 785 are present in substantial quantities in every human meibum sample tested to-date. Judging from the results of our HPLC-MS analyses of human meibum (Butovich et al., 2007a; Butovich et al., 2007b; Butovich et al., 2009b), these lipid species are the only major group of anionic compounds reliably identified in meibum which are capable of ionization at physiological pH. As the aqueous component of the TF has a pH of about 7.6 to 8 (Fischer and Wiederholt, 1982), the free carboxyl groups of the (O-acyl)-ω-hydroxy-FA should be ionized, thus increasing the amphiphilicity of the structures. With no appreciable amount of other polar lipids in meibum, (O-acyl)-ω-hydroxy-FA seem to be the only feasible replacement for PL in the intermediate amphiphilic lipid sublayer. Thus, they may be the missing link that stabilizes the TFLL and TF in general, and which could be affected in dry eye when the TF stability is severely compromised. Detailed qualitative and quantitative studies are needed in order to address this hypothesis. Experiments are in progress to verify this hypothesis.
Scheme 6.

Proposed structure of the tear film (on the left) and the amphiphilic lipid sublayer formed of very long chain (O-acyl)-ω-hydroxy fatty acids and diacyl glycerols (on the right).
*Di- and tri-esters as defined by Nicolaides et al (Nicolaides and Santos, 1985). The locations of double bonds in the structures of the very long chain ω hydroxy fatty acids are tentative (Butovich et al., 2009b).
On the basis of computer-assisted MM2/MMP2 molecular modeling experiments in the MMX parameterization performed as described earlier (Butovich, 1992), we estimate the length of these molecules in a fully extended conformation to be ~6 nm, while in the folded conformation (depicted in Scheme 6) it is about 2 nm. Thus, a condensed monolayer of these compounds should also be within that range. Note that to simplify the scheme, proteins that intercalate the TFLL and accumulate at the air/lipid interface (Butovich et al., 2008) are not shown, and their effects are not discussed at this time.
Summarizing this discussion, one can conclude that though preliminary structural characterization of meibum lipids was performed in the early sixties to mid-eighties of the 20th century, very limited new and reliable information has been gathered since then. We were given a new chance to advance our knowledge of meibum and TF after the advancement in modern HPLC-MS technology. Various NMR techniques also offer a thrilling opportunity to evaluate the intrinsic structural details of meibum and TF components, such as their conformations and stereochemistry, while IR spectroscopy in its various forms might provide valuable information on the lipid packing and interactions of lipid molecules with with each other, and with other components of TF. These approaches are already allowing us to overcome the major limitation that stalled (bio)chemical characterization of meibomian lipids – the necessity to analyze fragments of complex molecules instead of whole intact lipids, no matter how large and complex they are – and start putting together the pieces of the great meibomian puzzle, both figuratively and literally. These are truly exciting times, indeed.
Footnotes
Publisher's Disclaimer: This is a PDF file of an unedited manuscript that has been accepted for publication. As a service to our customers we are providing this early version of the manuscript. The manuscript will undergo copyediting, typesetting, and review of the resulting proof before it is published in its final citable form. Please note that during the production process errors may be discovered which could affect the content, and all legal disclaimers that apply to the journal pertain.
VII. References
- a).Oleamide. 2009 Retrieved 06/01/09, 2009, from http://en.wikipedia.org/wiki/Oleamide.
- b).oleamide.htm. 2009 Retrieved 06/01/09, 2009, from http://www.chemicalland21.com/arokorhi/specialtychem/perchem/OLEAMIDE.htm#.
- c).Storage and handling of lipids. 2009 from http://www.avantilipids.com/index.php?option=com_content&view=article&id=1679&Itemid=1398.
- Andrews JS. Human tear film lipids. I Composition of the principal non-polar component. Exp Eye Res. 1970;10:223–227. doi: 10.1016/s0014-4835(70)80032-x. [DOI] [PubMed] [Google Scholar]
- Argueso P, Beuerman R, Bonini S, Butovich I, Dana R, Dartt D, Gamache D, Gipson IK, Ham B, Jumblatt M, Korb D, Kruse F, Ogawa Y, Paulsen F, Stern M, Sweeney DF, Tiffany J, Ubels J, Willcox M. Research in dry eye: report of the Research Subcommittee of the International Dry Eye WorkShop (2007) Ocul Surf. 2007;5:179–193. doi: 10.1016/s1542-0124(12)70086-1. [DOI] [PubMed] [Google Scholar]
- Baron C, Blough HA. Composition of the neutral lipids of bovine meilbomian secretions. J Lipid Res. 1976;17:373–376. [PubMed] [Google Scholar]
- Bernhard W, Linck M, Creutzburg H, Postle AD, Arning A, Martin-Carrera I, Sewing KF. High-performance liquid chromatographic analysis of phospholipids from different sources with combined fluorescence and ultraviolet detection. Anal Biochem. 1994;220:172–180. doi: 10.1006/abio.1994.1315. [DOI] [PubMed] [Google Scholar]
- Bloch F. Nuclear induction. Physics Review. 1946;70:460–473. [Google Scholar]
- Borchman D, Foulks GN, Yappert MC, Tang D, Ho DV. Spectroscopic evaluation of human tear lipids. Chem Phys Lipids. 2007;147:87–102. doi: 10.1016/j.chemphyslip.2007.04.001. [DOI] [PubMed] [Google Scholar]
- Bron AJ, Tiffany JM. The meibomian glands and tear film lipids. Structure, function, and control. Adv Exp Med Biol. 1998;438:281–295. doi: 10.1007/978-1-4615-5359-5_40. [DOI] [PubMed] [Google Scholar]
- Bron AJ, Tiffany JM, Gouveia SM, Yokoi N, Voon LW. Functional aspects of the tear film lipid layer. Exp Eye Res. 2004;78:347–360. doi: 10.1016/j.exer.2003.09.019. [DOI] [PubMed] [Google Scholar]
- Butovich IA. Study by reverse-phase high-performance liquid chromatography of the adsorption of linoleic acid and of methyl linoleate on the interface between polar and nonpolar phases. Russ J Phys Chem. 1992;66:988–991. [Google Scholar]
- Butovich IA. On the lipid composition of human meibum and tears: comparative analysis of nonpolar lipids. Invest Ophthalmol Vis Sci. 2008;49:3779–3789. doi: 10.1167/iovs.08-1889. [DOI] [PMC free article] [PubMed] [Google Scholar]
- Butovich IA. Cholesteryl esters as a depot for very long chain fatty acids in human meibum. J Lipid Res. 2009a;50:501–513. doi: 10.1194/jlr.M800426-JLR200. [DOI] [PMC free article] [PubMed] [Google Scholar]
- Butovich IA, Hamberg M, Radmark O. Novel oxylipins formed from docosahexaenoic acid by potato lipoxygenase--10(S)-hydroxydocosahexaenoic acid and 10,20-dihydroxydocosahexaenoic acid. Lipids. 2005;40:249–257. doi: 10.1007/s11745-005-1379-z. [DOI] [PubMed] [Google Scholar]
- Butovich IA, Millar TJ. In search for a better animal model of human tear film: comparative lipidomic analysis of human and animal meibum ARVO 2009 [Google Scholar]
- Butovich IA, Millar TJ, Ham BM. Understanding and analyzing meibomian lipids--a review. Curr Eye Res. 2008;33:405–420. doi: 10.1080/02713680802018419. [DOI] [PMC free article] [PubMed] [Google Scholar]
- Butovich IA, Uchiyama E, Di Pascuale MA, McCulley JP. Liquid chromatography-mass spectrometric analysis of lipids present in human meibomian gland secretions. Lipids. 2007a;42:765–776. doi: 10.1007/s11745-007-3080-2. [DOI] [PubMed] [Google Scholar]
- Butovich IA, Uchiyama E, McCulley JP. Lipids of human meibum: mass-spectrometric analysis and structural elucidation. J Lipid Res. 2007b;48:2220–2235. doi: 10.1194/jlr.M700237-JLR200. [DOI] [PubMed] [Google Scholar]
- Butovich IA, Uchiyama E, McCulley JP. On the presence of oleamide in human meibum: quantification by LC/MS. Invest Ophthalmol Vis Sci 2007c [Google Scholar]
- Butovich IA, Wojtowicz J, Molai M. Human tear film and meibum. I. Very long chain wax esters and (O-acyl)-omega-hydroxy fatty acids of meibum. J Lipid Res. 2009b doi: 10.1194/jlr.M900252-JLR200. (in press) [DOI] [PMC free article] [PubMed] [Google Scholar]
- Cory CC, Hinks W, Burton JL, Shuster S. Meibomian gland secretion in the red eyes of rosacea. Br J Dermatol. 1973;89:25–27. doi: 10.1111/j.1365-2133.1973.tb01912.x. [DOI] [PubMed] [Google Scholar]
- Cottrell JS, Greathead RJ. Extending the mass range of a sector mass spectrometer. Mass Spectrom Rev. 1986;17:1–34. [Google Scholar]
- Ehlers N. The Precorneal Film. Biomicroscopical, Histological and Chemical Investigations. Acta Ophthalmol Suppl. 1965;(SUPPL 81):81–134. [PubMed] [Google Scholar]
- Esmaeelpour M, Cai J, Watts P, Boulton M, Murphy PJ. Tear sample collection using cellulose acetate absorbent filters. Ophthalmic Physiol Opt. 2008;28:577–583. doi: 10.1111/j.1475-1313.2008.00603.x. [DOI] [PubMed] [Google Scholar]
- Fischer FH, Wiederholt M. Human precorneal tear film pH measured by microelectrodes. Graefes Arch Clin Exp Ophthalmol. 1982;218:168–170. doi: 10.1007/BF02215658. [DOI] [PubMed] [Google Scholar]
- Foulks GN. The correlation between the tear film lipid layer and dry eye disease. Surv Ophthalmol. 2007;52:369–374. doi: 10.1016/j.survophthal.2007.04.009. [DOI] [PubMed] [Google Scholar]
- Greiner JV, Glonek T, Korb DR, Booth R, Leahy CD. Phospholipids in meibomian gland secretion. Ophthalmic Res. 1996a;28:44–49. doi: 10.1159/000267872. [DOI] [PubMed] [Google Scholar]
- Greiner JV, Glonek T, Korb DR, Leahy CD. Meibomian gland phospholipids. Curr Eye Res. 1996b;15:371–375. doi: 10.3109/02713689608995827. [DOI] [PubMed] [Google Scholar]
- Gunstone FR, Harwood JL, Dijkstra AJ. The lipid handbook. Boca Raton, FL: CRC Press. Taylor and Francis Group; 2007. [Google Scholar]
- Ham BM, Jacob JT, Cole RB. MALDI-TOF MS of phosphorylated lipids in biological fluids using immobilized metal affinity chromatography and a solid ionic crystal matrix. Anal Chem. 2005;77:4439–4447. doi: 10.1021/ac058000a. [DOI] [PMC free article] [PubMed] [Google Scholar]
- Harley J, Nel W, Pretorius V. Flame ionization detector for gas chromatography. Nature (London) 1958;181:177–178. [Google Scholar]
- Holly FJ. Formation and rupture of the tear film. Exp Eye Res. 1973;15:515–525. doi: 10.1016/0014-4835(73)90064-x. [DOI] [PubMed] [Google Scholar]
- Holly FJ. Diagnostic methods and treatment modalities of dry eye conditions. Int Ophthalmol. 1993;17:113–125. doi: 10.1007/BF00942924. [DOI] [PubMed] [Google Scholar]
- Holly FJ, Lemp MA. Tear physiology and dry eyes. Surv Ophthalmol. 1977;22:69–87. doi: 10.1016/0039-6257(77)90087-x. [DOI] [PubMed] [Google Scholar]
- Hu Q, Noll RJ, Li H, Makarov A, Hardman M, Graham Cooks R. The Orbitrap: a new mass spectrometer. J Mass Spectrom. 2005;40:430–443. doi: 10.1002/jms.856. [DOI] [PubMed] [Google Scholar]
- Jauhiainen M, Setala NL, Ehnholm C, Metso J, Tervo TM, Eriksson O, Holopainen JM. Phospholipid transfer protein is present in human tear fluid. Biochemistry. 2005;44:8111–8116. doi: 10.1021/bi050151k. [DOI] [PubMed] [Google Scholar]
- Joffre C, Souchier M, Gregoire S, Viau S, Bretillon L, Acar N, Bron AM, Creuzot-Garcher C. Differences in meibomian fatty acid composition in patients with meibomian gland dysfunction and aqueous-deficient dry eye. Br J Ophthalmol. 2008;92:116–119. doi: 10.1136/bjo.2007.126144. [DOI] [PubMed] [Google Scholar]
- Krenzer KL, Dana MR, Ullman MD, Cermak JM, Tolls DB, Evans JE, Sullivan DA. Effect of androgen deficiency on the human meibomian gland and ocular surface. J Clin Endocrinol Metab. 2000;85:4874–4882. doi: 10.1210/jcem.85.12.7072. [DOI] [PubMed] [Google Scholar]
- Kumlin M. Analytical methods for the measurement of leukotrienes and other eicosanoids in biological samples from asthmatic subjects. J Chromatogr A. 1996;725:29–40. doi: 10.1016/0021-9673(95)01125-0. [DOI] [PubMed] [Google Scholar]
- Linton RG, Curnow DH, Riley WJ. The Meibomian Glands: An Investigation into the Secretion and Some Aspects of the Physiology. Br J Ophthalmol. 1961;45:718–723. doi: 10.1136/bjo.45.11.718. [DOI] [PMC free article] [PubMed] [Google Scholar]
- Marshall AG, Hendrickson CL, Jackson GS. Fourier transform ion cyclotron resonance mass spectrometry: a primer. Mass Spectrom Rev. 1998;17:1–35. doi: 10.1002/(SICI)1098-2787(1998)17:1<1::AID-MAS1>3.0.CO;2-K. [DOI] [PubMed] [Google Scholar]
- Mathers WD, Lane JA. Meibomian gland lipids, evaporation, and tear film stability. Adv Exp Med Biol. 1998;438:349–360. doi: 10.1007/978-1-4615-5359-5_50. [DOI] [PubMed] [Google Scholar]
- McCulley JP, Shine W. A compositional based model for the tear film lipid layer. Trans Am Ophthalmol Soc. 1997;95:79–88. discussion 88–93. [PMC free article] [PubMed] [Google Scholar]
- McCulley JP, Shine WE. The lipid layer: the outer surface of the ocular surface tear film. Biosci Rep. 2001;21:407–418. doi: 10.1023/a:1017987608937. [DOI] [PubMed] [Google Scholar]
- McCulley JP, Shine WE. The lipid layer of tears: dependent on meibomian gland function. Exp Eye Res. 2004;78:361–365. doi: 10.1016/s0014-4835(03)00203-3. [DOI] [PubMed] [Google Scholar]
- McDonald GR, Hudson AL, Dunn SM, You H, Baker GB, Whittal RM, Martin JW, Jha A, Edmondson DE, Holt A. Bioactive contaminants leach from disposable laboratory plasticware. Science. 2008;322:917. doi: 10.1126/science.1162395. [DOI] [PubMed] [Google Scholar]
- McFadden WH, Bradford DC, Eglinton G, Hajlbrahim SK, Nicolaides N. Application of combined liquid chromatography/mass spectrometry (LC/MS): analysis of petroporphyrins and meibomian gland waxes. J Chromatogr Sci. 1979;17:518–522. doi: 10.1093/chromsci/17.9.518. [DOI] [PubMed] [Google Scholar]
- McWilliam IG, Dewar RA. Flame ionization detector for gas chromatography. New York: Academic Press; 1958. [Google Scholar]
- Meibom H. De vasis palpebrarum novis epistolae. Helmstadt: H. Muller; 1666. [Google Scholar]
- Nichols KK, Ham BM, Nichols JJ, Ziegler C, Green-Church KB. Identification of fatty acids and fatty acid amides in human meibomian gland secretions. Invest Ophthalmol Vis Sci. 2007;48:34–39. doi: 10.1167/iovs.06-0753. [DOI] [PubMed] [Google Scholar]
- Nicolaides N. Skin Lipids. II Lipid Class Composition of Samples from Various Species and Anatomical Sites. J Am Oil Chem Soc. 1965;42:691–702. doi: 10.1007/BF02540042. [DOI] [PubMed] [Google Scholar]
- Nicolaides N, Kaitaranta JK, Rawdah TN, Macy JI, Boswell FM, 3rd, Smith RE. Meibomian gland studies: comparison of steer and human lipids. Invest Ophthalmol Vis Sci. 1981;20:522–536. [PubMed] [Google Scholar]
- Nicolaides N, Santos EC. The di- and triesters of the lipids of steer and human meibomian glands. Lipids. 1985;20:454–467. doi: 10.1007/BF02534237. [DOI] [PubMed] [Google Scholar]
- Ohashi Y, Dogru M, Tsubota K. Laboratory findings in tear fluid analysis. Clin Chim Acta. 2006;369:17–28. doi: 10.1016/j.cca.2005.12.035. [DOI] [PubMed] [Google Scholar]
- Okumura N, Kojima K, Hashida M, Koura Y, Fukushima A, Ueno H. Platelet-activating factor in human normal tears. Curr Eye Res. 2005;30:891–896. doi: 10.1080/02713680591001629. [DOI] [PubMed] [Google Scholar]
- Pes O. Ricerche microchimiche sulla secrezione delle ghiandole sebacee palpebrali. Arch Ottal. 1897;5:82–91. [Google Scholar]
- Pholpramool C. Secretory effect of prostaglandins on the rabbit lacrimal gland in vivo. Prostaglandins Med. 1979;3:185–192. doi: 10.1016/0161-4630(79)90102-2. [DOI] [PubMed] [Google Scholar]
- Postle AD, Wilton DC, Hunt AN, Attard GS. Probing phospholipid dynamics by electrospray ionisation mass spectrometry. Prog Lipid Res. 2007;46:200–224. doi: 10.1016/j.plipres.2007.04.001. [DOI] [PubMed] [Google Scholar]
- Purcell EM, Torey HC, Pound RV. Resonance absorption by nuclear magnetic moments in a solid. Physical Review. 1946;69:37. [Google Scholar]
- Rabi II, Zacharias JR, Millman STK. A new method of measuring nuclear magnetic moments. Physics Review. 1938;70:460–473. doi: 10.1002/jmri.1880020203. [DOI] [PubMed] [Google Scholar]
- Shine WE, McCulley JP. Role of wax ester fatty alcohols in chronic blepharitis. Invest Ophthalmol Vis Sci. 1993;34:3515–3521. [PubMed] [Google Scholar]
- Shine WE, McCulley JP. Keratoconjunctivitis sicca associated with meibomian secretion polar lipid abnormality. Arch Ophthalmol. 1998;116:849–852. doi: 10.1001/archopht.116.7.849. [DOI] [PubMed] [Google Scholar]
- Shine WE, McCulley JP. Polar lipids in human meibomian gland secretions. Curr Eye Res. 2003;26:89–94. doi: 10.1076/ceyr.26.2.89.14515. [DOI] [PubMed] [Google Scholar]
- Shine WE, McCulley JP. Meibomianitis: polar lipid abnormalities. Cornea. 2004;23:781–783. doi: 10.1097/01.ico.0000133995.99520.1f. [DOI] [PubMed] [Google Scholar]
- Souchier M, Joffre C, Gregoire S, Bretillon L, Muselier A, Acar N, Beynat J, Bron A, D’Athis P, Creuzot-Garcher C. Changes in meibomian fatty acids and clinical signs in patients with meibomian gland dysfunction after minocycline treatment. Br J Ophthalmol. 2008;92:819–822. doi: 10.1136/bjo.2007.133900. [DOI] [PubMed] [Google Scholar]
- Sullivan BD, Cermak JM, Sullivan RM, Papas AS, Evans JE, Dana MR, Sullivan DA. Correlations between nutrient intake and the polar lipid profiles of meibomian gland secretions in women with Sjogren’s syndrome. Adv Exp Med Biol. 2002a;506:441–447. doi: 10.1007/978-1-4615-0717-8_62. [DOI] [PubMed] [Google Scholar]
- Sullivan BD, Evans JE, Cermak JM, Krenzer KL, Dana MR, Sullivan DA. Complete androgen insensitivity syndrome: effect on human meibomian gland secretions. Arch Ophthalmol. 2002b;120:1689–1699. doi: 10.1001/archopht.120.12.1689. [DOI] [PubMed] [Google Scholar]
- Sullivan BD, Evans JE, Dana MR, Sullivan DA. Impact of androgen deficiency on the lipid profiles in human meibomian gland secretions. Adv Exp Med Biol. 2002c;506:449–458. doi: 10.1007/978-1-4615-0717-8_63. [DOI] [PubMed] [Google Scholar]
- Sullivan BD, Evans JE, Dana MR, Sullivan DA. Influence of aging on the polar and neutral lipid profiles in human meibomian gland secretions. Arch Ophthalmol. 2006;124:1286–1292. doi: 10.1001/archopht.124.9.1286. [DOI] [PubMed] [Google Scholar]
- Sullivan BD, Evans JE, Krenzer KL, Reza Dana M, Sullivan DA. Impact of antiandrogen treatment on the fatty acid profile of neutral lipids in human meibomian gland secretions. J Clin Endocrinol Metab. 2000;85:4866–4873. doi: 10.1210/jcem.85.12.7066. [DOI] [PubMed] [Google Scholar]
- Tiffany JM. Individual variations in human meibomian lipid composition. Exp Eye Res. 1978;27:289–300. doi: 10.1016/0014-4835(78)90164-1. [DOI] [PubMed] [Google Scholar]
- Tiffany JM. The normal tear film. Dev Ophthalmol. 2008;41:1–20. doi: 10.1159/000131066. [DOI] [PubMed] [Google Scholar]
- Tiffany JM, Bron AJ, Mossa F, Dikstein S. Delivery of meibomian oil using the Clinical Meibometer. Adv Exp Med Biol. 1998;438:333–338. [PubMed] [Google Scholar]
- Tsvet MS. Physical chemical studies on chlorophyll adsorption. Berichte der Deutschen Botanischen Gessellschaft. 1906;24:316–323. [Google Scholar]
- Wojtowicz JC, Molai M, Butovich IA. Comparative lipidomic analysis of mono- and polyunsaturated lipids found in human meibum and aqueous tears using HPLC-UV/MS/MS. ARVO; Fort Lauderdale, FL: 2009. [Google Scholar]
- Wollensak G, Mur E, Mayr A, Baier G, Gottinger W, Stoffler G. Effective methods for the investigation of human tear film proteins and lipids. Graefes Arch Clin Exp Ophthalmol. 1990;228:78–82. doi: 10.1007/BF02764296. [DOI] [PubMed] [Google Scholar]
- Yenice I, Mocan MC, Palaska E, Bochot A, Bilensoy E, Vural I, Irkec M, Hincal AA. Hyaluronic acid coated poly-epsilon-caprolactone nanospheres deliver high concentrations of cyclosporine A into the cornea. Exp Eye Res. 2008;87:162–167. doi: 10.1016/j.exer.2008.04.002. [DOI] [PubMed] [Google Scholar]