Abstract
Osteonecrosis of the femoral head remains a challenging orthopaedic problem. The disease frequently progresses to femoral head collapse, leading to debilitating osteoarthritis in the affected hip(s). Since a major goal of pre-collapse interventions is to forestall the need for hip arthroplasty, it is important that any animal models used to develop or study such interventions also have a natural history of progression to femoral head collapse. The emu (Dromaius novaehollandiae), a large flightless bird native to Australia, consistently progresses to femoral head collapse when osteonecrosis is experimentally induced cryogenically. Full biomechanical characterization of the demands this animal places on its hip is an important consideration in future usage of this model. This study reports in vitro measurement of the contact stress distributions on the emu femoral head during stance phase of the gait cycle, using Fuji pressure-sensitive film. Applied hip loadings were based upon ground reaction forces and hip flexion angles recorded in vivo. The contact stress data showed reasonable homology with the human hip, both in terms of stress magnitude and sites of habitual loading on the femoral head.
INTRODUCTION
Osteonecrosis (ON) of the hip remains an important unsolved problem in orthopaedic surgery. In the United States 20,000 – 25,000 new cases are diagnosed each year, with an average patient age of 38 years (Mont et al., 1998). This disorder is caused by reduction or disruption of blood perfusion to the cancellous bone in the femoral head, and results in the death of weight-bearing bone, with subsequent weakening and collapse. Once collapse has occurred, the joint usually progresses to painful secondary osteoarthritis, and a total hip arthroplasty (THA) is typically indicated. Since the ON patient population is much younger and typically more active than the general THA recipient population, there is a very high rate of prosthesis loosening. The current standard of care, therefore, is to attempt to preserve the affected hip(s), with the goal of forestalling femoral head collapse for as long as possible.
Following a vascular insult to the femoral head, collapse is fundamentally mechanical in nature. Many of the head-preserving treatments utilized are, correspondingly, designed to either reduce stress in the affected bone (e.g. rotational osteotomies), or to augment and/or mechanically strengthen the affected region of the femoral head (e.g. fibular grafts). Individual clinical series have reported varying degrees of success with these procedures (e.g. Nozawa et al., 2008; Berend et al., 2003), and there is no consensus as to which treatments work best. This controversy is due, in part, to the lack of ability to systematically compare treatments in an animal model whose natural history is progression to human-like femoral head collapse.
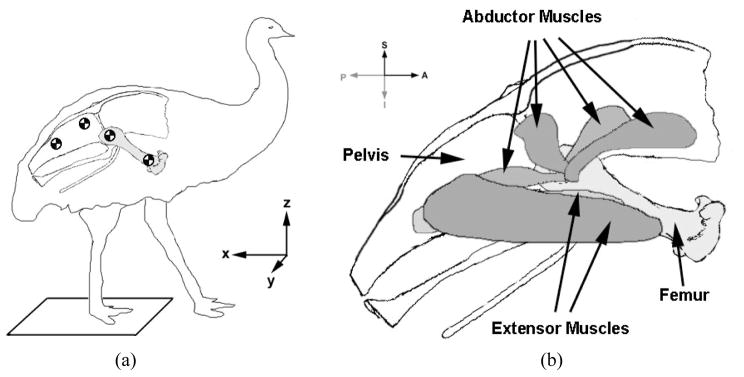
Recently the emu (Dromaius novaehollandiae), a large flightless avian native to Australia, has come under investigation as a bipedal animal model in which osteonecrosis progresses to femoral head collapse (Conzemius et al., 2002). Mature emus typically stand 1.5 meters tall and weigh around 400 N (Figure 1). Besides their femoral heads collapsing in osteonecrosis, another prerequisite to their serving as a meaningful model for the human disorder is that the patterns of load transmission through the emu hip be reasonably homologous with those in humans. Since forestalling juxta-articular collapse is such a major consideration in treating osteonecrosis, one obviously necessary aspect of load transmission concordance is the magnitude and distribution of intra-articular contact stress.
Figure 1.
(a) Locations of skin fiducials and force mat to measure hip joint excursion and ground reaction force (right side shown) (b) Locations of abductor and extensor muscles modeled for testing (right femur shown). From left to right, abductor muscles are: M. ilioishiofemoralis, M. iliotrochantericus medius, M. iliofemoralis, and M. iliotrochantericus cranialis.
Recent contact stress measurement work for human hips (Bay et al., 1997) has highlighted the importance of maintaining physiologically realistic peri-acetabular deformations. Key considerations in that regard are to simulate (muscle) traction loads on the pelvis, and to avoid artifactual reinforcement retro-acetabularly (i.e., no polymethylmethacrylate, PMMA, potting of the acetabulum). We have developed an “emu version” of the human hip loading apparatus established by Olson, Bay, and co-workers (Bay et al., 1997), augmented to include the capability for capturing contact stress data for various joint configurations spanning the stance phase of the emu gait cycle. This has enabled Fuji film contact stress measurements for the range of hip joint loadings encountered during emu ambulation.
METHODS
With protocols approved by the Iowa State University Institutional Care and Use Committee, vertical ground reaction forces were estimated by inducing a skeletally mature young adult emu to walk normally across a force mat (Tekscan, Inc. South Boston, MA). Force/time data were averaged from five different trials of a single healthy animal. Kinematic data were obtained by digital video tracking (16 frames/second) of skin markers on the feather-plucked hip, knee, and pelvis (Figure 1a). Frames were captured from the video, and joint excursion angles were calculated, at 10% time increments throughout the stance phase. These gait data (Figure 2) were compiled into a table of flexion angle and ground reaction force values for each increment.
Figure 2.
Hip flexion angles and ground reaction forces during the stance phase of the emu gait cycle
Based upon existing literature that describes emu leg musculature (Patak and Baldwin, 1998) and gait characteristics (Aubourachid and Renous, 2000; Gatesy and Biewener, 1991), plus our own exploratory dissections, it was decided for purposes of in vitro hip joint contact stress measurements that loadings from two principal muscle groups should to be included: hip abductors and hip extensors. The hip abductors were modeled as inserting just distal to the greater trochanter, originating at four locations on the pelvis: anterior and superior to the acetabulum, directly superior to the acetabulum, and posterior and superior to the acetabulum. These origin points correspond to muscles described by Patak as the iliotrochantericus medius and iliotrochantericus cranialis (combined), the iliofemoralis externus, and the ilioischiofemoralis, respectively (Figure 1b).
Due to the high degree of hip flexion seen throughout the gait cycle in emus (early in stance phase the femur axis orientation approaches 90° from vertical), the other muscle group modeled was the hip extensors. These track from the distal femur to the caudal end of the pelvis. Primary extensor muscles modeled were the puboischiofemoralis p. medialis and puboischiofemoralis lateralis. Their attachment points were chosen so as to provide an appropriately directed resultant extensor force, but without explicit replication of their individual muscle lines of action.
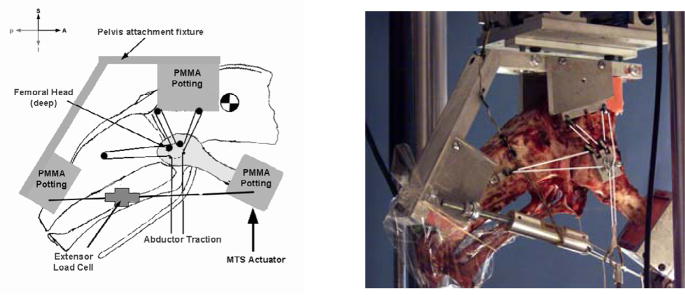
The loading fixture (Figure 3) consisted of two aluminum assemblies to which the PMMA-potted pelvis and femur were attached. Since the emu pelvis consists of a single bone with no structure similar to the sacral-iliac joint, no additional structural support beyond the potting was used on the pelvis. Minimal joint capsule tissue was removed when separating the femur from the pelvis, and the acetabular labrum was left fully intact. The pelvis had three small pulleys attached at the abductor muscle insertion points. The femur also had pulleys attached at the abductor origins. A 1-mm diameter spectra cord was used to apply simulated abductor muscle forces. Cord was looped through the pulleys as shown in Figure 3, and both ends of the cord were attached to a small custom load cell mounted in series with a pneumatic actuator. Simulated muscle tension was controlled by adjusting the pressure within the actuator. Extensor muscles were modeled with another spectra cord that ran from the distal femur to the caudal pelvis on the same side, in series with another small custom load cell and a turnbuckle. Hip flexion angle was set by adjusting the length of the simulated extensor muscle (by tightening or loosening the turnbuckle).
Figure 3.
Schematic (a) and photograph (b) of emu hip loading fixture (right femur shown). The pelvis attachment fixture (aluminum struts, plus two PMMA pots) freely moved in A–P and M-L translation, and in rotation about A–P and M-L axes; S-I translation, and rotation about the S-I and M-L axes, were constrained. The distal femur potting block was subjected to S-I force from the MTS actuator and was allowed rotational freedom along the M-L axis; all other degrees of freedom were constrained. Abductor traction was applied by a pneumatic actuator.
The PMMA-potted distal femur was loaded with the measured ground reaction force, while the pelvis was allowed full translational freedom, plus rotational freedom in the sagittal plane. To maintain balance, the abductors (in series with their custom-built load cell) were progressively counter-weighted as the hip was loaded.
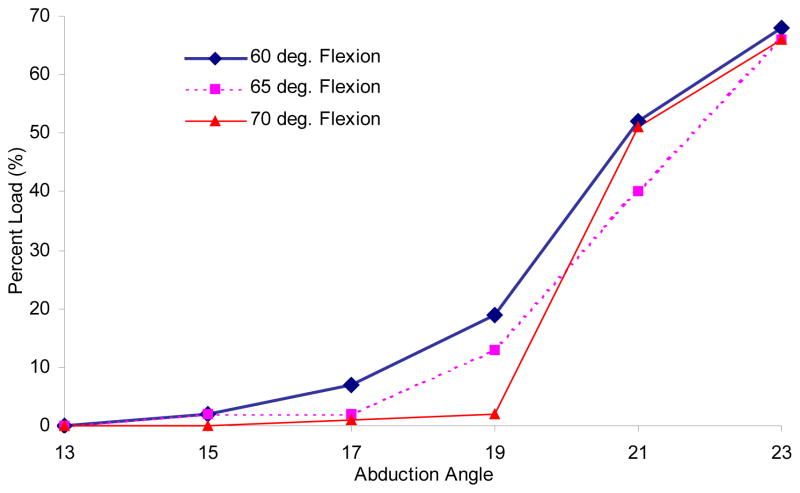
The anatomy of the emu proximal femur includes an intriguing morphologic feature, in that the greater trochanter (which is relatively larger than the greater trochanter of the human proximal femur) is cartilage-covered. In avians, this is referred to as the antitrochanter, and is generally believed to come into play during landings of flighted species (Wess et al., 1997). In flightless species, the circumstances under which the antitrochanter contacts the pelvis is unknown, although the vestigial presence of cartilage teleologically suggests that contact sometimes occurs. Seemingly, conditions of high hip abduction would favor such engagement. To elucidate the function of this (secondary) surface during normal gait, a preliminary series of loading experiments was performed with abduction angles ranging from 13° to 23° (dislocation occurred outside of this range), at each of three flexion angles: 60°, 65°, and 70°. The percent of total load on the femoral head versus on the antitrochanter was quantified by integrating the respective Fuji film contact stress distributions at each abduction/flexion combination (Figure 4).
Figure 4.
Percent load carried by the antitrochanter over a range of abduction angles in a single specimen.
For subsequent emu gait stance-phase simulations, a constant abduction angle of 15° was utilized to eliminate any potential dependence of contact stress distributions on hip abduction. At this degree of abduction, the above preliminary trials revealed that little if any contact was made between the antitrochanter and the pelvis, regardless of flexion angle.
Contact stress distributions within the hip joint were measured with Fuji Prescale Film (Fujifilm NDT Systems, Inc., Hanover Park, IL). Each Fuji-packet set consisted of one piece of Low range, and one piece of Super-Low range film, sandwiched together. Combining the two ranges of film allowed for registry of a larger range of stresses than could otherwise be obtained. Each combination of hip flexion and ground reaction force (corresponding to each 10% increment during the stance-phase of the gait cycle) was modeled, with two replicate trials performed. Two separate emu hip specimens from skeletally mature young adult animals (each consisting of a single animal’s right femur and pelvis) were tested, resulting in at least four independent film sets at each increment of the gait cycle.
Each grade of Fuji film (Low and Super Low) was calibrated by using a 6.31 mm-diameter circular indenter. A range of forces (25 to 250 N, which corresponds to 0.8 to 8.0 MPa) were applied, using the same temporal protocol as was used for the experimental film recordings: 30 second ramp up to the final load, hold at load for 30 seconds, and 30 seconds ramp back to an unloaded state. This resulted in a series of circular impressions on each grade of film, whose staining intensity spanned the range of recordable stresses. Calibration stains were recorded for each range of film (again, sandwiched together) at the end of each day’s testing. These calibration films were digitized and converted to grayscale, along with the experimental films from that day. A 3×3-pixel boxcar smoothing filter was applied to reduce the speckling (Hale and Brown, 1992) that occurred in some lower pressure ranges due to isolated microcapsule rupture. From the calibration films, grayscale values corresponding to stress levels 0.5 MPa to 8 MPa were then determined, and were used to quantify experimental results.
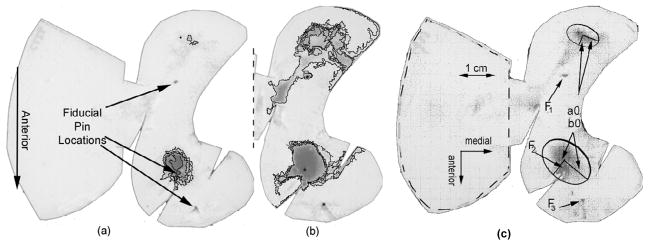
Once the stained films from hip joint loading were digitized and low-pass filtered, the number of pixels in each stress range was quantified (using NIH-Image/Scion ImagePC). A small number of films showed crinkle artifacts, which were eliminated using a grayscale gradient-based compensation algorithm (Caldwell et al., 1993). This allowed numerical integration of the contact stress distribution, so as to register the total joint reaction force recovery from the films (Figure 5a and 5b). Fiducial markers (pins) were embedded at three sites on the articular surface of the femoral head and two sites on the antitrochanter, so that the recorded contact stress distributions could be mapped back onto the anatomic surface.
Figure 5.
Digitized low range (a), and super low range (b) Fuji film showing fiducial pin locations and contours deliniating contact stress isobars. The left-hand portion of (a) covers the antitrochanter and shows no stress in this recording (this portion omitted in (b) for clarity). Film (c) shows fiducial locations (F), contact patches, and major and minor ellipsoidal axes (a0 and b0).
A three-dimensional equipollence approach was used to calculate the resultant force on the femoral head. Free body diagram (FBD) calculations were made based on the geometry, forces, and degrees of freedom in the experimental set-up. Independent variables were: ground reaction force, load on the extensor muscles, load on the abductor muscles, and the muscle insertion points, bone lengths, and femur flexion, abduction, and endo/exorotation angles. Dependent variables were the components (x, y, and z directions) of the joint reaction force at the hip, and moments applied at the knee. A MATLAB program was written to expedite the calculations. (Details are documented in the Appendix). For each stance-phase increment these resultant joint reaction forces were then compared to the total force recovered from integration of the Fuji film.
For purposes of pooling contact stress data across trials and specimens, each contact patch was approximated by a (manually fitted) ellipse (Figure 5c). Each ellipse was defined by semi-major and minor axes, intersecting at particular center point. Each ellipse had a major axis oriented in a particular direction relative to a line connecting the posterior-most and middle of the three femoral head fiducial marker imprints.
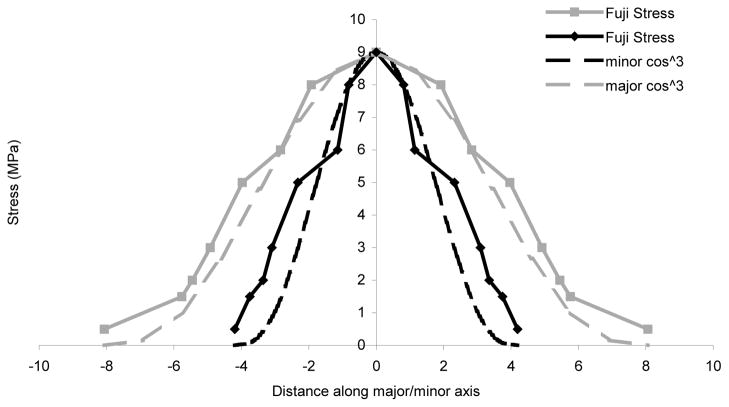
A program was written that allowed the user to manually identify these features on each digitized film. These numerical data were then tabulated and normalized, such that films from different specimens (containing fiducial pins in different locations) could be pooled. Based on previous literature (Baker et al., 1989), it was postulated that the load distribution within any one of these contact ellipses could be approximated by a cosine cubed equation. Comparison of typical contact patch data to an idealized cosine cubed distribution showed good agreement (Figure 6).
Figure 6.
Raw and polynomial-approximated stress distributions along major and minor ellipsoidal axes, for a typical contact patch
RESULTS
The data convincingly showed that although emus load their hips at a high degree of flexion, the femoral head contact stress is nonetheless concentrated at a region similar to that in humans. This is because of the large flexion moments (due to loading at the knee) that the hip extensors must balance to maintain sagittal plane moment equilibrium. At the instant of peak ground reaction force a net extension force of 1211 N and abduction force of 153 N was required to maintain equilibrium of the pelvis and femur. These large hip extensor muscle tensions concurrently act to forcefully axially compress the femur into the acetabulum, causing contact stress to be concentrated on the proximal/superior rather than anterior aspect of the femoral head.
In the preliminary series that explored the effect of hip abduction angle on antitrochanter load distribution, it was found that antitrochanter contact forces remained nearly zero until a critical abduction angle of around 19° was reached. As the abduction angle was increased beyond this critical angle, the predominance of total load carriage rapidly shifted from the femoral head to the antitrochanter. At maximum abduction, the antitrochanter transmitted 68% of the total load to the femur (Figure 4). It should be noted, however, that such a large degree of abduction probably does not occur physiologically, since in vitro the femoral head in such a configuration was on the borderline of being medially dislocated. Similarly, the femoral head tended to dislocate laterally when the abduction angle was smaller than about 13°.
Trial to trial, the Fuji film sets were highly consistent with one another. Each contained two distinct contact patches. The main patch was located antero-proximally, while a smaller secondary patch was located on the postero-lateral aspect of the femoral head (Figure 5). Depending on the flexion angle and ground reaction force, the main contact patch’s larger dimension ranged from 8 to 28 mm (the circumference of an emu femoral head being about 85 mm). The total recovered force (calculated by summing pixels of various ranges of grayscale values and multiplying them by the corresponding stress levels) was compared to that predicted by the equipollence calculation for the same loading condition (Table 1). Estimated extensor and abductor forces depended on both specimen orientation and applied ground reaction force, for any given trial. While specimen geometry (pelvis orientation relative to vertical, for example) was kept as consistent as possible between trials, small variations in geometric parameters probably contributed to the observed variation between films for the same stance-phase increment. Corresponding equipollence calculations showed generally similar variation, and overall matched the Fuji force integrations reasonably well. The equipollence calculations showed the resultant reaction force to be directed approximately along the shaft of the femur, towards the knee, but with modest components in the posterior and lateral directions.
Table 1.
Average recovered and calculated hip contact forces during the gait stance phase, at 10% increments (parenthesized values are standard deviations). FBD posterior and lateral angles refer to the lateral and posterior offset angles of the free-body calculated resultant reaction force vectors, relative to the femoral shaft.
| % Stance (N) | GRF (N) | Flex Ang. (deg) | Avg Recov. Force (N) | Avg FBD Force (N) | FBD posterior angle (deg) | FBD lateral angle (deg) |
|---|---|---|---|---|---|---|
| 0 | 0 | 62 | 0 | 0 | 0 | 0 |
| 10 | 160 | 62 | 608 (362) | 771 (223) | 17 | 19 |
| 20 | 241 | 66 | 977 (238) | 970 (55) | 21 | 17 |
| 30 | 301 | 58 | 1402 (307) | 1377 (114) | 17 | 20 |
| 40 | 335 | 65 | 1029 (210) | 1183 (116) | 15 | 12 |
| 50 | 353 | 67 | 1161 (269) | 1180 (126) | 19 | 13 |
| 60 | 370 | 71 | 1124 (233) | 1081 (202) | 10 | 9 |
| 70 | 280 | 74 | 630 (78) | 676 (42) | 10 | 5 |
| 80 | 172 | 76 | 392 (82) | 414 (70) | 7 | 5 |
| 90 | 65 | 75 | 182 (40) | 168 (30) | 1 | 5 |
| 100 | 0 | 76 | 0 | 0 | 0 | 0 |
All film recordings from each stance-phase increment were cataloged in terms of the above-noted contact ellipse parameters. Contact stress data were summarized for the two contact patches during each stance-phase increment (Table 2). These idealized contact stress distributions were then averaged and mapped onto the femoral head using fiducial markers (Figure 7).
Table 2.
Elliptical contact patch resultants, contact areas, and average patch pressures. Patch 1 is located on the postero-lateral aspect of the femoral head, and patch 2 is located antero-proximally. Maximum pressure occurred on patch 2 in all cases.
| % Stance | Patch # | Resultant (N) | Contact Area (mm2) | Average Pres. (MPa) | Max Pres. (MPa) | Increment avg. Pres. |
|---|---|---|---|---|---|---|
| 10 | 1 | 203 | 48 | 4.27 | 10.2 | 4.8 |
| 2 | 672 | 136 | 4.92 | |||
| 20 | 1 | 203 | 97 | 2.10 | 11.5 | 3.5 |
| 2 | 766 | 183 | 4.19 | |||
| 30 | 1 | 159 | 83 | 1.91 | 10.3 | 3.7 |
| 2 | 1218 | 287 | 4.24 | |||
| 40 | 1 | 199 | 111 | 1.80 | 9.8 | 4.0 |
| 2 | 984 | 182 | 5.40 | |||
| 50 | 1 | 234 | 116 | 2.03 | 10.7 | 3.9 |
| 2 | 946 | 191 | 4.96 | |||
| 60 | 1 | 223 | 84 | 2.65 | 10.3 | 3.1 |
| 2 | 859 | 260 | 3.30 | |||
| 70 | 1 | 122 | 32 | 3.80 | 8.3 | 3.5 |
| 2 | 554 | 162 | 3.42 | |||
| 80 | 1 | 136 | 58 | 2.35 | 7.2 | 2.9 |
| 2 | 278 | 84 | 3.30 | |||
| 90 | 1 | 94 | 128 | 0.73 | 8.3 | 1.0 |
| 2 | 74 | 36 | 2.03 | |||
Figure 7.
Idealized ellipsoidal contact patches on the right femur for 10%, 30%, 50%, 70% and 90% stance-phase increments.
DISCUSSION
Despite the much higher degree of habitual hip flexion seen in emus, proximal femoral contact stress distributions were generally similar to those seen in humans (Brown and Shaw, 1983). This can be attributed to very high forces in the emu hip extensor muscles, necessary to provide resistance to the rotational moment about the hip caused by the high degree of hip flexion. Recent data indicate that during gait the muscles around the emu hip can and do produce forces similar to what was measured here (Goetz et al., 2008). The extensor muscles exerted a compressive force roughly aligned with the long axis of the femur, causing the resulting hip contact force to be of a similar relative magnitude (around 3.5 body weights maximum), direction (pointing distally along the axis of the femur), and location (on the anteroproximal surface of the femoral head) to those seen in humans. For humans, Bay et al. (Bay et al., 1997) remarked upon the existence of an elliptical contact patch, whose total recovered force was around three body weights for single-legged stance. Emu hip joint contact forces have been estimated as high as 5.5 body-weights during gait (Goetz et al, 2008). The ground reaction forces measured in that study were higher than those measured here, possibly due to differences in the animals’ walking speed.
The contact patch measured here extended from the anterior to the posterior acetabular wall regions. Typical spatial mean contact stress values found in that human study were 4–6 MPa. In the present study, the corresponding values for the emu were 4–6 MPa during peak stance (increments 30–60%, Table 2). Like humans, the emu possesses a well-defined primary trabeculation system running from the superior aspect of the femoral head to the medial femoral cortex (Conzemius et al., 2002).
Emu and human femoral heads have radii of roughly 13 mm and 26 mm respectively. The average contact patch size for intact human acetabulae has been reported as 467 mm2 (5.5% of the femoral head surface, if idealized as a sphere), and peak pressures around 11 MPa. In the present emu study, average contact patch size during peak stance phase (30–60% of stance phase) was 327 mm2 (15% of the idealized head sphere), and averaged 254 mm2 over the entire gait cycle (about 12% of the idealized sphere surface). Peak pressures in the emu hip were 10 to 11 MPa. The joint reaction force vector acting on the human femur was inclined 25° laterally (Hak et al., 1998). The emu joint reaction force was also laterally inclined, at angles ranging from 12° to 20° during this same peak force portion of stance phase (Table 1).
As expected, antitrochanter loading was highly dependent on the degree of hip abduction, although the sites of engaged femoral head cartilage did not change substantially when the hip was abducted. The cartilage-covered antitrochanter surface, which has no counterpart in the human, bore anywhere from 0% to 68% of the total load transmitted through the hip. In the present in vitro preparation, substantial levels of antitrochanter loading ensued only during extreme abduction. Abduction angles of 15° to 19°, which fall in the middle of the total range of motion allowed for up to 20% of the total joint load to be carried by the antitrochanter. Unfortunately, no formal data on emu hip abduction angles during ambulation are yet available, although videotape motion studies of habitual emu activity levels (Troy et al., 2007) reveal that the femurs stay at low abduction angles during walking. In order to eliminate any potential dependence of the present proximal femur contact stress distributions on abduction angle, based on the results of the preliminary series, all subsequent contact stress measurements and equilibrium calculations were performed with a fixed abduction angle of 15°.
Although only a small number of specimens are reported here, additional specimens were tested using the above-described methods. However, this data included specimens whose abduction angle was not held at 15° and were, therefore, not reported here. Thus, while the total number of specimens tested under the conditions reported here is small, the contact stress distributions observed, (two patches, located antero-proximally and posteriorly), appear to be representative of emu hips in general.
One limitation to the present of study is the level of variability inherent in the force mat data that were gathered. Peak ground reaction force in both humans and in emus depends on the walking speed (higher peak forces are seen for faster speeds). The peak ground reaction force used in this study was an average of several trials, all performed at a relatively sedate pace, self-selected by the emu and probably representing the preferred walking speed. Another limitation is that only the vertical component of the ground reaction force was modeled in the in vitro experimental setup. Small horizontal components were measured in vivo, but they were negligible when compared to the vertical component of ground reaction force. Yet another limitation of the analysis comes from the method by which kinematics were tracked, which restricted data to two dimensions. Additional sources of imprecision include movement of skin surface markers relative to the underlying bone, and the fact that the camera direction that was only approximately orthogonal to the path of the walking bird. The presence of Fuji film within the joint space necessarily alters the contact within the joint. Also, because the contact areas involved were relatively modest, for simplicity the Fuji film stress integrations did not compensate for directionality; thus, the spatially integrated contact stresses would tend to slightly overestimate the actual resultant contact force. Despite these limitations, the present data expand our understanding of emu hip biomechanics. This is important in the context of developing interventions to forestall necrotic femoral head collapse in humans.
Figure 8.
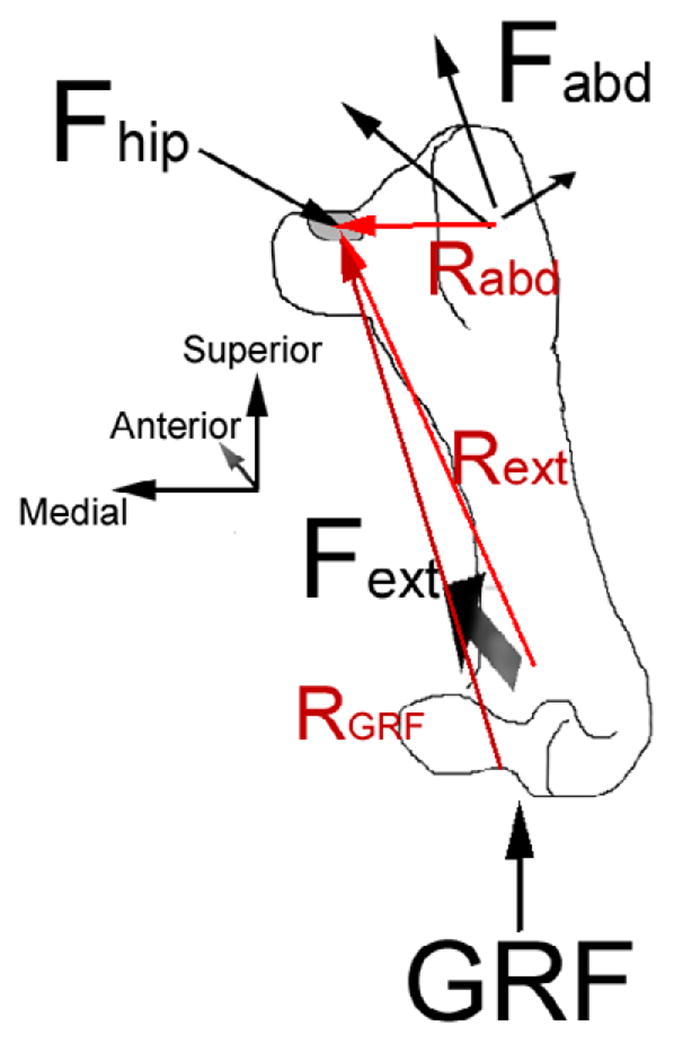
Figure 1 Forces acting on the right femur during Fuji-film testing (femur is flexed away the viewer and slightly abducted, as if the animal is facing away from the viewer and standing normally). Fhip is the resultant hip force, which acts on the gray contact patch. Fabd is the resultant abductor force, shown here as separate lines of action for each muscle. Fext is the extensor force and has mainly posterior, but also medial, and superior components.
Acknowledgments
We appreciate the technical assistance of Mr. Tom Baer in developing the loading fixture. Additional technical help was provided by Mr. Todd Howatt and Dr. Wanda Gordon. Financial assistance was provided by an NSF Graduate research fellowship (KLT), by a grant from the Roy J. Carver Foundation (TDB, MGC), and by NIH grants #AR46601 and #AR49919 (TDB, MGC).
Appendix
The MATLAB program applied the following equilibrium equations:
where Fext was the resultant extensor force vector, Fabd was the resultant abductor force vector, GRF was the ground reaction force (directed superiorly), Rext (magnitude: 10 cm) was the vector distance from the extensor action point to the location at which Fhip, the hip reaction force, acts, Rabd (magnitude: 4 cm) was the vector distance from the abductor action point to Fhip, RGRF (magnitude: 12 cm) was the vector distance from the knee to Fhip, and Mknee was the moment applied by the fixture holding the potted femur.
Footnotes
Publisher's Disclaimer: This is a PDF file of an unedited manuscript that has been accepted for publication. As a service to our customers we are providing this early version of the manuscript. The manuscript will undergo copyediting, typesetting, and review of the resulting proof before it is published in its final citable form. Please note that during the production process errors may be discovered which could affect the content, and all legal disclaimers that apply to the journal pertain.
References
- Aubourachid A, Renous S. Bipedal locomotion in ratites (paleognathiform): Examples of cursorial birds. Ibis. 2000;142:538–549. [Google Scholar]
- Bay BK, Hamel AJ, Olson SA, Sharkey NA. Statically equivalent load and support conditions produce different hip joint contact pressures and periacetabular strains. J Biomech. 1997;30:193–196. doi: 10.1016/s0021-9290(96)00120-0. [DOI] [PubMed] [Google Scholar]
- Baker K, Brown T, Brand R. A finite element analysis of the effects of intertrochanteric osteotomy on stresses in femoral head osteonecrosis. Clin Orthop. 1989;249:183–198. [PubMed] [Google Scholar]
- Berend KR, Gunneson EE, Urbaniak JR. Free vascularlized fibular grafting for the treatment of postcollapse osteonecrosis of the femoral head. J Bone Joint Surg Am. 2003;85-A(6):987–93. doi: 10.2106/00004623-200306000-00001. [DOI] [PubMed] [Google Scholar]
- Brown TD, Shaw DT. In vitro contact stress distributions in the natural human hip. J Biomech. 1983;16:373–384. doi: 10.1016/0021-9290(83)90071-4. [DOI] [PubMed] [Google Scholar]
- Caldwell NJ, Hale JE, Rudert MJ, Brown TD. An algorithm for approximate crinkle artifact compensation in pressure-sensitive film recordings. J Biomech. 1993;26:1001–1009. doi: 10.1016/0021-9290(93)90060-r. [DOI] [PubMed] [Google Scholar]
- Conzemius M, Brown T, Zhang Y, Robinson R. A new animal model of femoral head osteonecrosis: One that progresses to human-like mechanical failure. Journal of Orthopaedic Research. 2002:303–309. doi: 10.1016/S0736-0266(01)00108-5. [DOI] [PubMed] [Google Scholar]
- Gatesy S, Biewener A. Bipedal locomotion: Effects of speed, size, and limb posture in birds and humans. J Zool Lond. 1991;224:127–147. [Google Scholar]
- Goetz JE, Derrick TR, Pedersen DR, Robinson DA, Conzemius MG, Baer TE, Brown TD. Hip joint contact force in the emu (Dromaius novaehollandiae) during normal level walking. J Biomech. 2008;41:770–778. doi: 10.1016/j.jbiomech.2007.11.022. [DOI] [PMC free article] [PubMed] [Google Scholar]
- Hak DJ, Hamel AJ, Bay BK, Sharkey NA, Olson SA. Consequences of transverse acetabular fracture malreduction on load transmission across the hip joint. J Orthop Trauma. 1998;12:90–100. doi: 10.1097/00005131-199802000-00005. [DOI] [PubMed] [Google Scholar]
- Hale JE, Brown TD. Contact stress gradient detection limits of pressensor film. J Biomech Eng. 1992;114:352–357. doi: 10.1115/1.2891395. [DOI] [PubMed] [Google Scholar]
- Mont MA, Jones LC, Einhorn TA, Hungerford DS, Reddi AH. Osteonecrosis of the femoral head. Potential treatment with growth and differentiation factors. Clin Orthop. 1998:S314–335. [PubMed] [Google Scholar]
- Nozawa M, Matsuda K, Maezawa K, Kim S, Maeda K, Ikegami T, Kubota R, Hayashi K, Nagayama M, Kaneko H. Rapid resolution of femoral head osteonecrosis after rotational acetabular osteotomy. J Orthop Traumatol. 2008:221–4. doi: 10.1007/s10195-008-0032-4. [DOI] [PMC free article] [PubMed] [Google Scholar]
- Patak A, Baldwin J. Pelvic limb musculature in the emu dromaius novaehollandiae (aves: Struthioniformes: Dromaiidae): Adaptations to high-speed running. Journal of Morphology. 1998;238:23–37. doi: 10.1002/(SICI)1097-4687(199810)238:1<23::AID-JMOR2>3.0.CO;2-O. [DOI] [PubMed] [Google Scholar]
- Troy KL, Lundberg HJ, Conzemius MG, Brown TD. Habitual hip joint activity level of the penned Emu (Dromaius novaehollandie) Iowa Orthop J. 2007;27:17–23. [PMC free article] [PubMed] [Google Scholar]
- Wess TJ, Wess L, Hocking PM. The structure of avian cartilage: a combined X-ray and biochemical analysis. J Comp Pathol. 1997;116(2):145–55. doi: 10.1016/s0021-9975(97)80072-2. [DOI] [PubMed] [Google Scholar]


