Abstract
Glutathione S-transferase μ-1, GSTM1, belongs to a superfamily of glutathione-S-transferases that metabolize a broad range of reactive oxygen species (ROS) and xenobiotics. Across species, genetic variants that result in decreased expression of the Gstm1 gene are associated with increased susceptibility for vascular diseases, including atherosclerosis in humans. We previously identified Gstm1 as a positional candidate in our gene mapping study for susceptibility to renal vascular injury characterized by medial hypertrophy and hyperplasia of the renal vessels. To determine the role of Gstm1 in vascular smooth muscle cells (VSMCs), we isolated VSMCs from mouse aortas. We demonstrate that VSMCs from the susceptible C57BL/6 mice have reduced expression of Gstm1 mRNA and its protein product compared to that of the resistant 129 mice. After serum stimulation, C57BL/6 VSMCs proliferate and migrate at a much faster rate than 129 VSMCs. Furthermore, C57BL/6 VSMCs have higher levels of ROS, and exhibit exaggerated p38 MAPK phosphorylation after exposure to H2O2. To establish causality, we show that knockdown of Gstm1 by siRNA results in increased proliferation of VSMCs in a dose dependent manner, as well as in increased ROS levels and VSM cell migration. Moreover, Gstm1 siRNA causes increased p38 MAPK phosphorylation, and attenuates the anti-proliferative effect of TEMPOL. Our data suggest that Gstm1 is a novel regulator of VSMC proliferation and migration through its role in handling ROS. Genetic variants that cause a decremental change in expression of Gstm1 may permit an environment of exaggerated oxidative stress, leading to susceptibility to vascular remodeling and atherosclerosis.
Keywords: Glutathione S-transferase μ-1, vascular smooth muscle cells, proliferation, migration, reactive oxygen species
INTRODUCTION
Glutathione S-transferase μ-1, GSTM1, belongs to a superfamily of glutathione-S-transferases that metabolize a broad range of reactive oxygen species (ROS) and xenobiotics. There are 8 distinct classes of soluble GSTs that have been identified thus far according the substrate specificity, chemical affinity, structure and kinetic behavior of the enzyme (1, 2). GSTM1 belongs to the Mu (μ) class, and is one of the 5 μ class of GST genes in humans (3). In mice there are 7 Gstm genes, (4, 5) and Gstm1 is the most abundantly expressed among all Gst genes in the kidney (6).
In humans, a GSTM1 deficiency state exists in those carrying the null allele, GSTM1(0), that arose from a recombination event during evolution between two highly homologous regions flanking this locus, resulting in deletion of a 20 kb segment (7, 8). The prevalence of subjects carrying this allele in the homozygous state ranges from 30–50% in different human populations (9). The significance of this genetic variation in human was first recognized in cancer studies demonstrating that patients carrying the GSTM1(0) allele were at increased risks for colon and lung cancers (10),(11). In subsequent studies undertaken in cardiovascular disease, subjects homozygous for the GSTM1(0) allele were shown to have increased risks of hypertension (12) and atherosclerosis (13), and increased DNA alterations in atherosclerotic lesions of the abdominal aorta (14). Despite the circumstantial evidence for a role of the variant of the GSTM1 gene in human disease, the exact contribution of this gene in the vasculature has not been well characterized.
In genetic studies of hypertension, genome-wide scans performed on several rat crosses identified QTLs involved in blood pressure regulation (15). Subsequently, congenic strains were derived to isolate one of these QTLs, and comparisons of microarray expression profiling of a congenic strain versus the original parental strains identified Gstm1 as a positional and functional candidate gene (16). Gstm1 mRNA expression was found to be reduced in the stroke-prone spontaneously hypertension rat (SHR) compared to the congenic and normotensive Wistar Kyoto (WKY) rats (17). The differences in mRNA expression levels were reflected at the protein levels in the kidney, and were inversely correlated with renal levels of ROS, suggesting that the pathophysiological role Gstm1 in hypertension is likely to involve defense against oxidative stress (17).
In previous studies, we identified a single locus, Msrvh1, on chromosome 3 that was linked to renal vascular injury in a mouse model, the AT1A receptor-deficient model, with vascular lesions characterized by medial hypertrophy and hyperplasia of the renal vasculature (18). As part of our screening process for possible positional candidate modifier gene(s), we first prioritized candidate genes as those that are differentially expressed between the susceptible (C57BL/6) and resistant (129S6) mouse strains. Within the critical interval of the Msrvh1 region containing ~ 50 genes, only Gstm1 exhibited robust and statistically significant differences in expression levels between the two strains. We found that the resistant 129 mice had twice the level of Gstm1 expression compared to the susceptible C57BL/6.
Taken together, the evidence suggests that Gstm1 plays a role in vascular homeostasis. The naturally occurring strain variation in Gstm1 expression would provide a powerful model for testing the functional role of Gstm1 in the vasculature. In this report, we determined strain differences in Gstm1 expression in vascular smooth muscle cells (VSMCs), and assessed the role of Gstm1 in VSMC proliferation, reactive oxygen species production, and migration.
MATERIALS AND METHODS
An expanded Materials and Methods section can be found online at http://hyper.ahajournals.org.
Primary vascular smooth muscle cell culture
VSMCs from aortas of 3–4 week old wild-type C57BL/6 (Jackson Laboratory, Bar Harbor, ME) and 129S6 (Taconic) were isolated by enzymatic digestion using collagenase, 1.5 mg/mL (Sigma), while suspended in Dulbecco’s Modified Eagle Medium (DMEM) (GIBCO Laboratories) containing, L-glutamine, HEPES, penicillin and streptomycin. Cells were washed and grown in DMEM supplemented with 10% heat inactivated calf serum, penicillin (100 U/mL), streptomycin (100ug/mL) in 75 cm2 Corning tissue culture flasks at 37°C in a humidified environment of 5% CO2 and air.
Cell proliferation assays
Cell proliferation was measured using both MTS and BrdU assays.
Real-time RT-PCR
Total RNA was isolated from VSMCs or aorta by RNeasy Mini Kit (Invitrogen). One microgram of DNase I-treated RNA sample was reverse transcribed using SuperScript II First-Strand Synthesis System for RT-PCR (Gibco BRL) in a total reaction volume of 20 μL. Real-time RT-PCR was performed as described in the supplemental data.
DHE staining
VSMCs were seeded at 2 × 10⁴/well in 24-well plate and allowed to grow overnight. Medium was then removed and cells were rinsed twice with HHBS, followed by addition of 1 mL HBSS to each well with 2.0 uM DHE. Cells were incubated at 37°C for 30 minutes in the dark. DHE was removed and cells were rinsed with HBSS twice, followed by addition of fresh HBSS. Fluorescence microscopy was performed after 30 min incubation.
Detection of H2O2 with DCF-DA
H2O2 in VSMC was measured using 2′7′dichlorofluorescein diacetate (DCFH-DA) (Sigma) probe. VSMCs at 5 × 10³ per well were plated in a 96 wells plate, and allowed to grow overnight in DMEM medium. The medium was then removed and the cells were rinsed twice with HHBS. Cells were then incubated with 10 um DCFDA at 37°C with 5% CO2 for 30 min. The fluorescent signal was detected by a microplate reader (FLUOstar, OPTIMA, BMG Labtech, Germany) at 485 nm excitation and 535 nm emission.
Detection of Superoxide by lucigenin assay
Production of superoxide was measured by lucigenin-enhanced chemiluminescence response. Briefly, for cultured VSMCs, cell suspension was created by detachment with 0.25% trypsin and 0.02% EDTA. Cells were washed with modified Krebs buffer containingNaCl (130 mM), KCl (5 mM), MgCl2 (1 mM), CaCl2 (1.5 mM), K2HPO4 (1 mM), and HEPES (20 mM), pH 7.4, and were resuspended in Krebs buffer with 1 mg/mL BSA containing lucigenin (0.25 mmol/L). The cell concentration was then adjusted to 1 × 10⁷/mL. To measure ROS production, the cell suspension was transferred into polypropylene tubes and assessed in a luminometer (OPTOCOMP I, GEM Biomedical Inc.). Counts were obtained at 10 minutes of incubation. Background counts determined in cell-free preparations were subtracted from total count.
RNA Interference and Cell Transfection
High-performance purity grade (>90% pure) small interfering RNAs (siRNAs) against Gstm1 (Gstm1-siRNA) was obtained from Ambion, Inc. siRNA, with a nonsilencing oligonucleotide sequence (nonsilencing siRNA) that does not recognize any knownhomology to mammalian genes, are used as a negative control (Control-siRNA). VSMCs were seeded at a density of 5 × 10⁴ cells/well in 6-well plates and grown in DMEM containing 10% FCS. One day after seeding, cells are transfected with 100 pmol of Control-siRNA, or 100 pmol of Gstm1-siRNA using lipofectomine NAiFect Transfection Reagent (Qiagen Inc) according to the manufacturer’s instructions. Seventy-two hours post-transfection, the cells were then analyzed by Western blot, cell proliferation, DHE staining and Lucigenin, or migration assays.
Western Blot
The method used has been previously described (19). VSMC were lyzed in RIPA buffer with protease inhibitors. Rabbit anti-GSTM1 (generous gift of Dr. John Hayes (5)) was used at 1:2000 dilution.
Cell migration assay
Cell migration was assessed using 24-well plates with Transwell inserts (8.0 μm pore, Costar) as previously described (20).
Statistical analysis
Data are expressed as mean ± standard error (SE). For comparisons between strains, n = 3 aortas for each strain of 129 and C57BL/6 used for isolation of primary VSMCs. All experiments were performed in triplicates, and repeated 3–4 times. Student’s t-test was used for all comparisons between two groups, and ANOVA was used for comparisons between three groups.
RESULTS
Strain differences in expression of Gstm1 in VSMCs
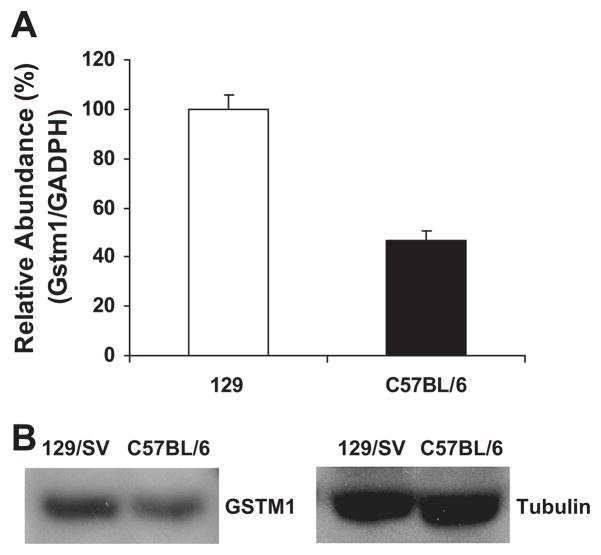
Based on our previous gene mapping study demonstrating that Gstm1 is a candidate gene for susceptibility to renal vascular pathology (18), we asked whether expression of Gstm1 in vascular smooth muscle cells (VSMCs) is different between the susceptible C57BL/6 strain versus the resistant 129S6 (129) strain. We isolated VSMCs from the aorta from wild-type C57BL/6 and 129 mice and grew them in culture. By real-time RT-PCR and Western analysis, Gstm1 mRNA and protein levels, respectively, were significantly decreased by 50% in C57BL/6 VSMCs compared to 129 VSMCs (Figure 1).
Figure 1. Strain differences in expression of Gstm1 in vascular smooth muscle cells.
A. Real time RT-PCR, expression of Gstm1 is compared to GAPDH housekeeping gene. Values are expressed as relative abundance, with 129 value used as reference value, p = 0.005 between 129 vs. C57BL/6, n = 3 each, performed in triplicates. B. Western blot, showing abundance of GSTM1 enzyme is lower in C57BL/6 compared to 129 VSMCs.
Strain differences in VSMC proliferation and reactive oxygen species production
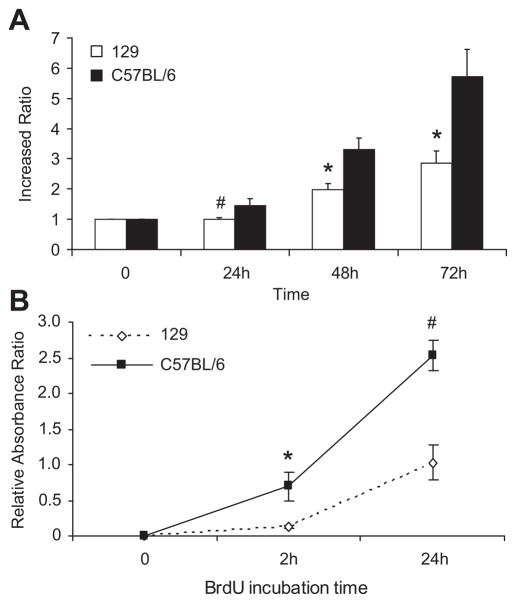
While culturing primary VSMCs from the two different strains (n = 3 each), we noted that C57BL/6 VSMCs in culture proliferated and reached confluence at a much faster rate than 129 VSMCs. To better quantitate their growth rate, we measured VSMCs proliferation. By MTS assay (Figure 2A), starting at same cell number plating on day 0, with 10% serum, at 48 and 72 hours, C57BL/6 VSMCs proliferated two times faster than 129 VSMCs (p ≤ 0.03). To confirm our observations, we also determined cell proliferation using the BrdU cell proliferation assay (Figure 2B). This assay also demonstrated a higher cell proliferation rate in the C57BL/6 VSMCs, and the difference was highly statistically significant by 24 hours.
Figure 2. Strain differences in VSMC proliferation.
A. By MTS assay, C57BL/6 VSMCs have higher proliferation rates compared to 129 VSMCs, # p = 0.09 at 24hr, * p ≤ 0.03 at 48 and 72 hr. B. By BrdU assay, differences in cell proliferation between strains were detected as early as 2 hr, * p = 0.01, # p = 0.001. VSMCs were obtained from aortas from 3 separate mice from each strain. Cell proliferation assays were done using serum, performed in triplicates, and repeated 4 times in separate experiments. Cell passages between 1–3 were used and matched between strains.
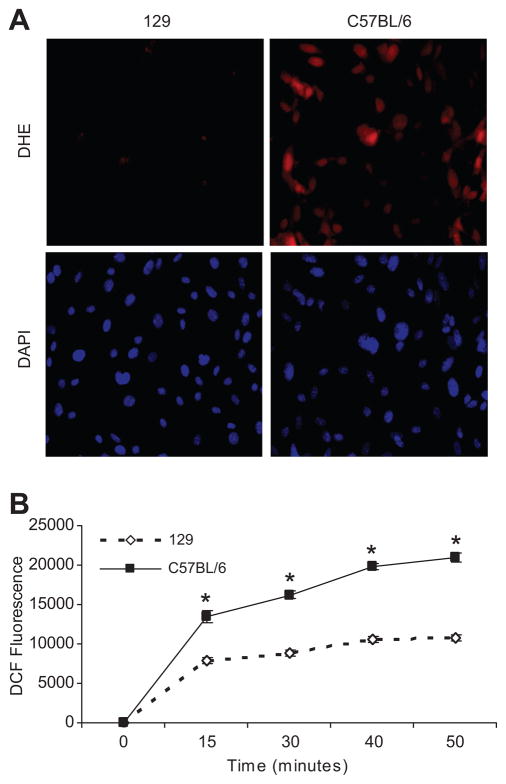
Because a previous study showed that lower renal expression of Gstm1 in stroke-prone SHR was associated with higher renal ROS levels compared to WKY rats (17), we examined ROS levels in our two different murine VSMC lines. As an indirect measure of superoxide levels, we performed dihydroethidium (DHE) staining of VSMCs in culture. At equal cell density by DAPI staining, DHE staining was significantly increased in C57BL/6 VSMCs compared to 129 VSMCs, suggesting increased superoxide levels (Figure 3A). We also assessed ROS (H2O2) generation in VSMCs using 2′7′dichlorofluorescein diacetate (DCFH-DA) probe. By detection of DCF fluorescence (Figure 3B) over a 50 minute interval, C57BL/6 VSMCs have much higher levels of ROS production compared to 129 VSMCs.
Figure 3. Strain differences in ROS production.
A. DHE staining At relatively equal cell density determined by DAPI nuclear staining (lower left and right panels), there is very low level of DHE staining in the 129 cells (top left panel). However, in C57BL/6 VSMCs, there is dramatically higher level of DHE staining (top right panel), suggesting higher levels of superoxide. B. DCF-DA assay. The DCF fluorescent signal, a measure of H2O2 levels, is significantly higher in C57BL/6 VSMCs compared to 129, * p ≤ 0.001; n = 3 each, performed in triplicates in 3 experiments.
Reduction in Gstm1 causes increased cell proliferation and ROS production
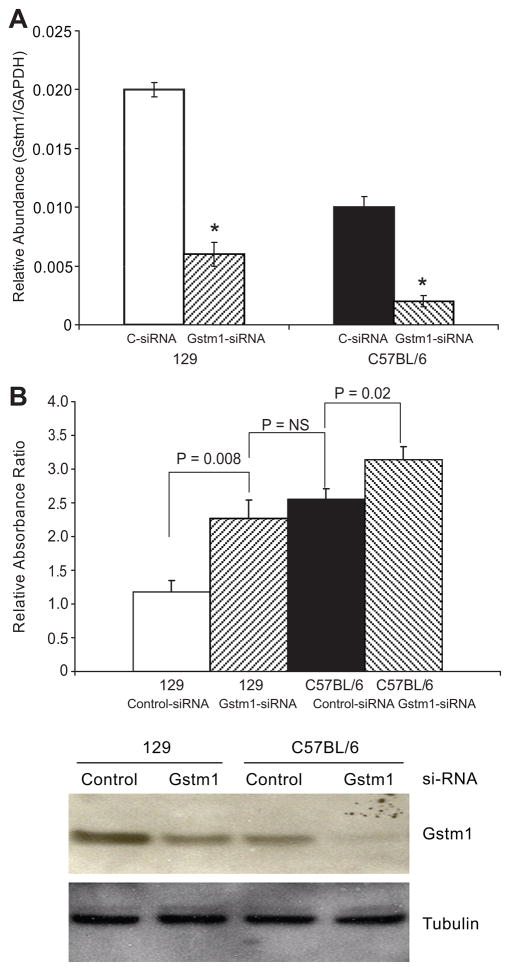
To determine whether the difference in expression of Gstm1 between the two different strains of VSMCs could directly cause differences in cell proliferation and ROS production, we used siRNA targeting Gstm1 (Ambion, Inc). Using Gstm1-siRNA, we successfully knocked down Gstm1 mRNA levels in both 129 and C57BL/6 VSMCs by 60–80% (p < 0.05) (Figure 4A). We next examined the effect of Gstm1 knockdown by siRNA on cell proliferation. As shown in Figure 4B, top panel, in both 129 and C57BL/6 VSMCs, compared to scrambled siRNA, Gstm1-siRNA resulted in significantly increased VSMC proliferation. Specifically, after 72 hours, 129 VSMC treated with Gstm1-siRNA had similar proliferation rate as C57BL/6 cells treated with scrambled-siRNA. Moreover, C57BL/6 cells treated with Gstm1-siRNA had significantly higher proliferation rate than cells treated with control-siRNA. Western blotting (Figure 4B, bottom panel) demonstrated that GSTM1 protein level in 129 Gstm1-siRNA treated cells were very similar to that of C57BL/6 control-siRNA condition. Furthermore, C57BL/6 cells treated with Gstm1-siRNA had barely detectable GSTM1 by Western analysis. Our data suggest that Gstm1 exerts an anti-proliferative effect in a dose dependent manner.
Figure 4. Effect of knockdown of Gstm1 by si-RNA.
A. Gstm1-siRNA successfully decreased Gstm1 expression in both 129 and C57BL/6 VSMCs by 60–80%, * p < 0.0005 compared to control (C-siRNA); n = 3 each, performed in triplicates. B. Upper panel: Gstm1-siRNA resulted in significantly increased VSMC proliferation. 72 hours after si-RNA transfection, 129 VSMC treated with Gstm1-siRNA had significantly higher proliferation rate as 129 cells treated with control-siRNA (p = 0.008 129 Control-siRNA vs 129 Gstm1-siRNA), but similar proliferation rate as C57BL/6 cells treated with Control-siRNA (p = 0.40 129 Gstm1-siRNA vs C57BL/6 Control-siRNA). C57BL/6 cells treated with Gstm1-siRNA had an even higher proliferation rate than cells treated with control-siRNA (p = 0.02 C57BL/6 Control-siRNA vs C57BL/6 Gstm1-siRNA). N = 3 for each condition, performed in triplicates, in 3 separate experiments. Lower panel: Western analysis demonstrates successful knockdown of the enzyme in both cell lines compared to control-siRNA. Of note, Gstm1-siRNA reduced GSTM1 protein expression of 129 VSMCs to similar level as seen in C57BL/6 cells treated with control-siRNA. C57BL/6 cells treated with Gstm1-siRNA had barely detectable GSTM1 protein levels.
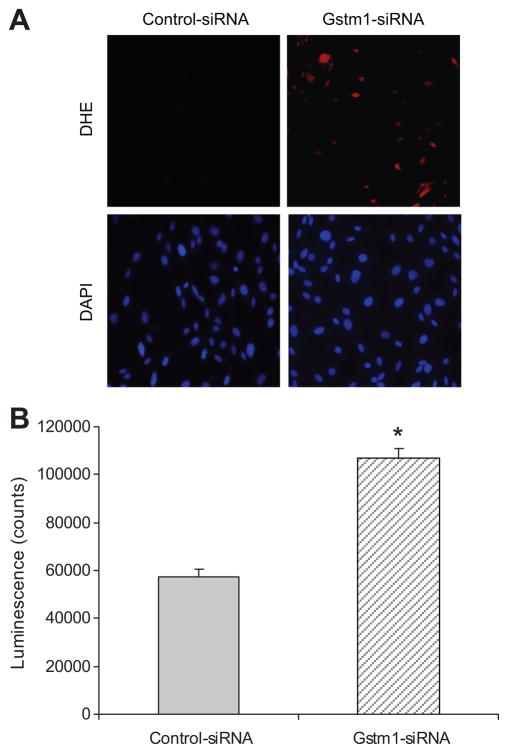
We next determined whether knockdown of Gstm1 expression in 129 VSMCs would affect ROS production. By DHE staining (Figure 5A), Gstm1-siRNA causes marked increase in superoxide production compared to control-siRNA. To better quantitate the differences, we performed an assay using lucigenin chemiluminescence. As shown in Figure 5B, in 129 VSMCs, Gstm1-siRNA caused a significant increase in superoxide production as measured by increased luminescence levels in VSMCs compared to control-siRNA.
Figure 5. Effect of Gstm1 knockdown on superoxide levels in 129 VSMCs.
A. DHE staining Compared to control-siRNA, Gstm1-siRNA resulted in significantly enhanced DHE staining (top panels) in 129 VSMCs. The bottom panels represent DAPI staining, showing relatively equal cell density. B. Lucigen-enhanced chemiluminescence assay. After transfection with Gstm1-siRNA, 129 VSMCs display significantly higher lucigenenin luminescence counts than 129 VSMCs transfected with control-siRNA, * p < 0.005, n = 3 each condition, performed in triplicates in 3 separate experiments.
Strain differences in p38 phosphorylation and effect of Gstm1 knockdown after exposure to hydrogen peroxide
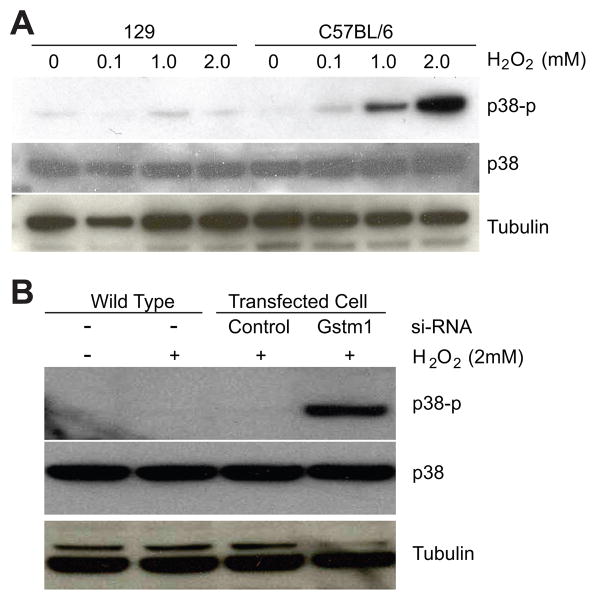
ROS are thought to serve as second messengers that activate downstream kinases such as p38 MAP kinase (21). With two distinct VSMC lines with naturally occurring strain-dependent expression levels of Gstm1, we posited that the 129 VSMCs with higher expression levels of Gstm1 would be more resistant than C57BL/6 VSMCs to p38 phosphorylation following H2O2 treatment. As expected, VSMCs from 129 demonstrated significantly less p38 phosphorylation compared to C57BL/6 after H2O2 exposure (Figure 6A). We next determined the effect of Gstm1 knockdown on p38 phosphorylation in 129 VSMCs. As shown in Figure 6B, Gstm1 siRNA resulted in a significant increase in p38 phosphorylation in 129 VSMCs after treatment with H2O2 compared to untransfected wild-type cells, or cells transfected with control-siRNA.
Figure 6. Activation of p38 kinase in response to H2O2. A. Strain differences in p38 MAP kinase phosphorylation.
129 VSMCs, with higher levels of Gstm1, demonstrated attenuated p38 phosphorylation after treatment with H2O2 compared to C57BL/6 VSMCs. B. Effect of Gstm1 knockdown on p38 phosphorylation in 129 VSMCs. Gstm1-siRNA transfection resulted in significant increase in p38 phosphorylation compared to control-siRNA or un-transfected conditions in 129 VSMCs exposed to H2O2.
Reduction of Gstm1 attenuates anti-proliferative effects of TEMPOL
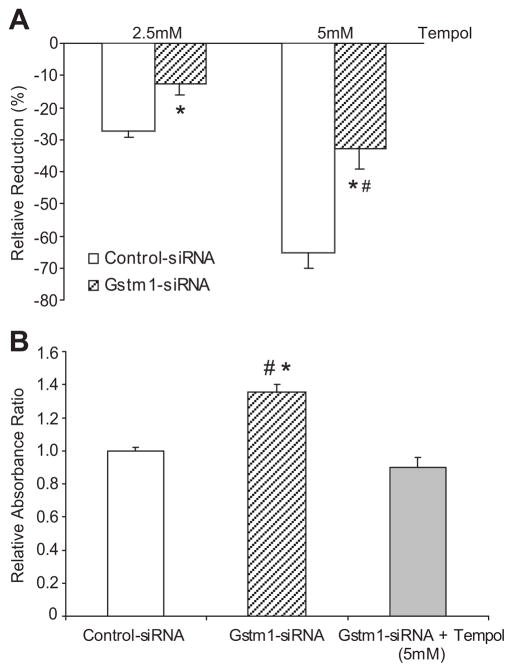
To determine whether the effect of Gstm1 on cell proliferation is mediated through its regulation of superoxide levels, we next assessed the effect of TEMPOL with and without Gstm1 knockdown. As shown in Figure 7A, Gstm1-siRNA blunted the inhibition of cell proliferation by TEMPOL by approximately 50% at both lower dose (2.5 mM) and higher dose (5 mM) of TEMPOL. Furthermore, with Gstm1-siRNA, the higher dose of TEMPOL was required to achieve similar degree of inhibition of cell proliferation as in the lower dose with control-siRNA. Conversely, TEMPOL attenuated the proliferative effect of Gstm1-siRNA (Figure 7B). Our data suggest that the effect of Gstm1 is mediated at least in part through its regulation of superoxide levels; loss of GSTM1 results in decreased clearance of superoxide, increased oxidative stress, and hence increased vascular smooth muscle cell proliferation.
Figure 7. A. Effect of Gstm1 knockdown on inhibition of VSMCs proliferation by TEMPOL.
Gstm1-siRNA attenuates the anti-proliferative effect of TEMPOL by ~ 50%, * p ≤ 0.008 vs. control-siRNA, # p = NS for Gstm1-siRNA at 5 mM TEMPOL vs. control-siRNA at 2.5 mM TEMPOL. B: Effect of TEMPOL on proliferative effect of Gstm1 knockdown. TEMPOL blunts the proliferative effect of Gstm1-siRNA, * p = 0.006 versus control-siRNA, # p = 0.001 versus Gstm1-siRNA + TEMPOL (5 mM), p = NS for control-siRNA vs. Gstm1-siRNA + TEMPOL (5 mM). N = 3 for each condition, performed in triplicates in 3 separate experiments.
Effects of Gstm1 on vascular smooth muscle cell migration
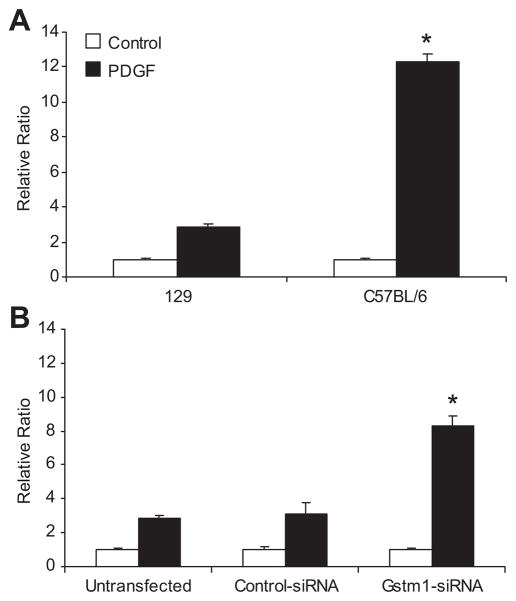
It has been shown that ROS are key mediator for PDGF signal transduction, since blockade of H2O2 accumulation by catalase inhibits PDGF-induced migration of VSMCs (22). Since reduction of Gstm1 results in increased superoxide and H2O2 levels, we queried whether Gstm1, through its role in handling oxidative stress, regulates VSMC migration. We first examined migration rates between C57BL/6 and 129 VSMCs with low and high Gstm1 expression, respectively. As shown in Figure 8A, the cell migration rates in untreated cells were similar between 129 and C57BL/6 cells. However, after stimulation with PDGF, cell migration rate was much faster in C57BL/6 VSMCs than 129 VSMCs. To determine if this difference might be contributed by differences in Gstm1 expression, we used Gstm1-siRNA in 129 VSMCs to demonstrate causality. After Gstm1 knockdown with siRNA, 129 VSMCs migrated at a much faster rate compared to control-siRNA and untransfected conditions (Figure 8B).
Figure 8. A. Strain differences in vascular smooth muscle cell migration.
Basal VSMC migration was equivalent in 129 and C57BL/6 cell lines. However, after PDGF-BB stimulation, C57BL/6 VSMCs migrated at a much faster rate than 129 VSMCs, * p = 0.002, n = 3 each condition performed in triplicates. B. Effect of Gstm1 knockdown on migration of 129 VSMCs. Basal VSMC migration was similar between untransfected 129 cells and cells transfected with control- or Gstm1-siRNA. However, after stimulation with PDGF-BB, 129 VSMCs transfected with Gstm1-siRNA migrated at a much faster rate compared to untransfected or control-siRNA transfected cells, * p = 0.009, ANOVA, n = 3 each condition performed in triplicates in 3 separate experiments.
DISCUSSION
Our studies demonstrate that genetic variation in expression of Gstm1 is associated with differences in VSMC proliferation, ROS production, and cell migration. Furthermore, we establish a functional role of Gstm1, as we find that reduction of Gstm1 in VSMC using siRNA directly causes increased cell proliferation, oxidative stress, and migration. Our findings of differences in proliferation between the 129 and C57BL/6 murine VSMCs are very similar to the earlier studies reporting that VSMCs isolated from thoracic aorta from the SHR strain proliferate faster than those from the WKY rats (23–27). More recently, Gstm1 was identified as a positional and functional candidate gene for hypertension (15, 16) and was found to be reduced in kidney tissues from stroke-prone SHR strain compared to the congenic and normotensive WKY rats (17). We suggest that the differences in cell proliferation between these two rat strains are also due, at least in part, to differences in Gstm1 expression.
One important consideration is whether the effect we observe is specific to Gstm1 or is due to combined effects of other differentially expressed Gstm genes. In this regard, we find that, in the mouse aorta, along with Gstm1, Gstm4, Gstm5 are also more significantly highly expressed in 129 than C57BL/6 mice. However, similar to previous studies describing the relative expression of all Gst genes in the kidney (6), we also find that, in the aorta in both strains, the expression of Gstm1 gene, relative to GAPDH, is significantly and several times higher than any other Gstm genes (Supplemental Figure S1), suggesting that, in the vasculature, Gstm1 plays the most dominant role within its class, and perhaps among all the Gst classes, as GSTM1 is the most predominant glutathione s-transferase in both the mouse kidney (6) and lung (28), accounting for 45% and 60% of the total GST content, respectively. Moreover, we found no change in expression of the other 5 Gstm genes (Gstm2 – Gstm6) in VSMCs after reduction of Gstm1 by siRNA knockdown (data not shown). This suggests that the effect we observe in vitro is specifically due to knockdown of Gstm1, and that there is no loss or compensatory changes from other Gstm genes that could account for our observations. It is worth noting here that, while Gstm7 has been reported, we have not been able to confirm expression of this gene using previously reported primers (29). We have re-designed primers for Gstm7, but have not successfully identified its expression in either mouse aortic tissues or isolated VSMCs.
Compared to the 129 strain, the C57BL/6 strain is more susceptible to atherosclerosis (30) and ocular neovascularization (31). In our genetic model of AT1A receptor deficiency, we found that the C57BL/6 strain is more susceptible to renal vascular injury (18). Taken together, we speculate that the lower expression of Gstm1 in the vasculature in the C57BL/6 strain contributes to their generalized increased susceptibility to vascular injury and remodeling.
Approximately 30–50% of individuals in most human populations completely lack the activity of the detoxifying enzyme gluthathione S-transferase M1. This results from homozygous inheritance of the GSTM1 null allele, GSTM1(0), resulting in a 20 kb segment deletion of the gene (7, 8). The three genotypes, homozygously active GSTM1/GSTM1, heterozygously deficient GSTM1/GSTM1(0), and homozygously deficient GSTM1(0)/GSTM1(0), are associated with a trimodal distribution of glutathione-conjugator activity, with high, intermediate and non conjugators, respectively (7, 32). Examination of public databases reveals that GSTM1 lies within a cluster with 4 other GSTM genes on human chromosome 1, and this region is a hot spot for gene copy number variation. Thus, it is likely that other GSTM1 polymorphisms may also contribute to expression differences of GSTM1 in humans. The exact polymorphism causing Gstm1 expression differences in stroke prone SHR and WKY rats is unknown (17). We have sequenced the putative promoter region of the murine Gstm1 gene, as well as all the exons, introns, and 3′ UTR region, and have not detected any sequence variation between the 129 and C57BL/6 mouse strains. Based on our gene mapping study (18), it is likely that the regulating variant affecting Gstm1 expression, and that of Gstm4 and Gstm5, is cis-acting and lies in a yet to be discovered regulatory region of the gene cluster.
In disease states such as atherosclerosis and arterial injury-induced neointimal hyperplasia, it is generally thought that a key component involves medial smooth muscle cell proliferation and migration into the arterial intima. We demonstrate here that VSMCs with lower Gstm1 expression, from either naturally occurring genetic variation or si-RNA knockdown, have increased cell proliferation and migration rates. Our studies provide a possible mechanistic link for increased susceptibility to atherosclerosis in those carrying the GSTM1(0) allele.
The exact mechanism(s) by which Gstm1 influences cell proliferation, ROS production and cell migration is unknown. We find that reduction of Gstm1 expression results in increased production of ROS, which are thought to function as second messengers that activate the phosphorylation of downstream kinases such as p38 MAP kinase (21). We show that, with serum stimulation, Gstm1 directly and dose-dependently affects vascular smooth muscle cell growth; the lower the Gstm1 expression level, the higher the cell proliferation rate. Suh et al. previously showed that serum-induced proliferation of VSMCs is mediated by Nox1, a member of the NAD(P)H oxidase (33). NADPH oxidases are generally recognized to be the major contributor to ROS production in the vasculature (34). The pro-growth effect on VSMCs by the hormones angiotensin II, platelet derived-growth factor (PDGF), and thrombin, and the cytokine tumor necrosis factor alpha (TNFα) is thought to be via the common activation of NADPH oxidase (21). The result is an increased level of NADPH oxidase-derived O2•− that increases the activity of downstream kinases such as p38 MAP kinase and Akt (21). We find that C57BL/6 VSMCs are more susceptible to p38 phosphorylation compared to 129 when exposed to H2O2. Furthermore, p38 phosphorylation is virtually undetectable in 129 VSCMs at baseline, or even after exposure to H2O2, but is significantly enhanced after exposure to H2O2 in the presence of Gstm1 siRNA. Taken together, we postulate that Gstm1 modulates the NADPH oxidase-induced signaling pathway, perhaps through its role in regulating ROS levels.
Whether GSTM1 has superoxide dismutase and/or catalase-like activity remains to be determined. In our studies using low doses of TEMPOL, the addition of Gstm1 siRNA resulted in reduced effectiveness of TEMPOL to suppress cell proliferation. Moreover, TEMPOL attenuates the proliferative effect of Gstm1 siRNA. One alternative explanation is that GSTM1 reduces the effectiveness of TEMPOL simply through its metabolism of the compound. However, in 129 VSMCs, Gstm1-siRNA caused significant p38 phosphorylation after exposure to H2O2. These observations suggest that GSTM1 directly regulates ROS levels. It is possible that GSTM1 regulates intracellular ROS through its well-known catalytic activity in intracellular glutathione conjugation and metabolism, thereby regulating the redox state. In addition to its active catalytic site, GSTM1 also has a functional non-catalytic domain that inhibits activation of the ASK1-p38 signaling pathway. Under normal conditions, GSTM1, via its non-catalytic site, binds to the apoptosis signaling-regulating kinase-1 (ASK1), thereby inhibiting ASK1 activation (35). In conditions of stress such as heat shock or exposure to H2O2, GSTM1 is thought to be released from ASK1, leading to activation of ASK1 and downstream kinases (36). Our finding that Gstm1 expression regulates p38 phosphorylation is consistent with these earlier observations. Another possibility is that Gstm1 modulates VSMC proliferation and migration through its role in protection against accumulation of lipid peroxidation products that are now recognized to influence cell proliferation and migration (37). It has been demonstrated that human subjects homozygous for GSTM1(0) have higher plasma levels of malondialdehyde (MDA), a product of lipid peroxidation (38).
Supplementary Material
Acknowledgments
Sources of Funding
This work was supported by NIH grant DK075035 to T.H.L.
We thank Dr. Neil J. Freedman for helpful advice on cell migration studies.
Footnotes
Disclosures
None.
Perspectives
Gene mapping and association studies have demonstrated that, across human rat and murine species, genetic variations of Gstm1 gene are associated with cardiovascular diseases. The present study describes a novel function of Gstm1 in the regulation of vascular smooth muscle cell proliferation and migration, perhaps through its role in handling oxidative stress. These findings implicate that genetic variants that cause even a modest decremental change in expression of Gstm1 gene provide a permissive environment of exaggerated oxidative stress, leading to enhanced susceptibility to vascular remodeling and atherosclerosis. Gstm1 may serve as a modifier of phenotype in disease states.
References
- 1.Landi S, Norppa H, Frenzilli G, Cipollini G, Ponzanelli I, Barale R, Hirvonen A. Individual sensitivity to cytogenetic effects of 1,2:3,4-diepoxybutane in cultured human lymphocytes: influence of glutathione S-transferase M1, P1 and T1 genotypes. Pharmacogenetics. 1998;8:461–471. [PubMed] [Google Scholar]
- 2.Strange RC, Faulder CG, Davis BA, Hume R, Brown JA, Cotton W, Hopkinson DA. The human glutathione S-transferases: studies on the tissue distribution and genetic variation of the GST1, GST2 and GST3 isozymes. Ann Hum Genet. 1984;48:11–20. doi: 10.1111/j.1469-1809.1984.tb00829.x. [DOI] [PubMed] [Google Scholar]
- 3.Takahashi Y, Campbell EA, Hirata Y, Takayama T, Listowsky I. A basis for differentiating among the multiple human Mu-glutathione S-transferases and molecular cloning of brain GSTM5. J Biol Chem. 1993;268:8893–8898. [PubMed] [Google Scholar]
- 4.Guo J, Zimniak L, Zimniak P, Orchard JL, Singh SV. Cloning and expression of a novel Mu class murine glutathione transferase isoenzyme. Biochem J. 2002;366:817–824. doi: 10.1042/BJ20020041. [DOI] [PMC free article] [PubMed] [Google Scholar]
- 5.Hayes JD, Flanagan JU, Jowsey IR. Glutathione transferases. Annu Rev Pharmacol Toxicol. 2005;45:51–88. doi: 10.1146/annurev.pharmtox.45.120403.095857. [DOI] [PubMed] [Google Scholar]
- 6.Mitchell AE, Morin D, Lakritz J, Jones AD. Quantitative profiling of tissue- and gender-related expression of glutathione S-transferase isoenzymes in the mouse. Biochem J. 1997;325:207–216. doi: 10.1042/bj3250207. [DOI] [PMC free article] [PubMed] [Google Scholar]
- 7.Sprenger R, Schlagenhaufer R, Kerb R, Bruhn C, Brockmoller J, Roots I, Brinkman U. Characterization of the glutathione S-transferase GSTT1 deletion: Discrimination of all genotypes by polymerase chain reaction indicates a trimodular genotype-phenotype correlation. Pharmacogenetics. 2000;10:557–565. doi: 10.1097/00008571-200008000-00009. [DOI] [PubMed] [Google Scholar]
- 8.Xu SJ, Wang Y, Roe B, Pearson WR. Characterization of the Human Class Mu Glutathione S-Transferase Gene Cluster and the GSTM1 Deletion. J Biol Chem. 1998;273:3517–3527. doi: 10.1074/jbc.273.6.3517. [DOI] [PubMed] [Google Scholar]
- 9.Garte S, Gaspari L, Alexandrie AK, Ambrosone C, Autrup H, Autrup JL, Baranova H, Bathum L, Benhamou S, Boffetta P, Bouchardy C, Breskvar K, Brockmoller J, Cascorbi I, Clapper ML, Coutelle C, Daly A, Dell’Omo M, Dolzan V, Dresler CM, Fryer A, Haugen A, Hein DW, Hildesheim A, Hirvonen A, Hsieh L, Ingelman-Sundberg M, Kalina I, Kang D, Kihara M, Kiyohara C, Kremers P, Lazarus P, Le Marchand L, Lechner MC, van Lieshout EM, London S, Manni JJ, Maugard CM, Morita S, Nazar-Stewart V, Noda K, Oda Y, Parl FF, Pastorelli R, Persson I, Peters WH, Rannug A, Rebbeck T, Risch A, Roelandt L, Romkes M, Ryberg D, Salagovic J, Schoket B, Seidegard J, Shields PG, Sim E, Sinnet D, Strange RC, Stucker I, Sugimura H, To-Figueras J, Vineis P, Yu MC, Taioli E. Metabolic gene polymorphism frequencies in control populations. Cancer Epidemiol Biomarkers Prev. 2001;10:1239–1248. [PubMed] [Google Scholar]
- 10.Cotton SC, Sharp L, Little J, Brockton N. Glutathione S-transferase polymorphisms and colorectal cancer: a HuGE review. Am J Epidemiol. 2000;151:7–32. doi: 10.1093/oxfordjournals.aje.a010124. [DOI] [PubMed] [Google Scholar]
- 11.Hou SM, Ryberg D, Falt S, Deverill A, Tefre T, Borresen AL, Haugen A, Lambert B. GSTM1 and NAT2 polymorphisms in operable and non-operable lung cancer patients. Carcinogenesis. 2000;21:49–54. doi: 10.1093/carcin/21.1.49. [DOI] [PubMed] [Google Scholar]
- 12.Delles C, Braga-Marcano AC, Munroe PB, Padmanabhan S, McClure JD, Brain NJ, Brown MJ, Samani NJ, Clayton D, Farrall M, Webster J, Connell JM, Caulfield MJ, Dominiczak AF. Association between Variants of the Human GSTM Gene Family and Hypertension. Hypertension. 2006;48:A. [Google Scholar]
- 13.Wang XL, Greco M, Sim AS, Duarte N, Wang J, Wilcken DE. Glutathione S-transferase mu1 deficiency, cigarette smoking and coronary artery disease. J Cardiovasc Risk. 2002;9:25–31. doi: 10.1177/174182670200900104. [DOI] [PubMed] [Google Scholar]
- 14.Izzotti A, Cartiglia C, Lewtas J, De Flora S. Increased DNA alterations in atherosclerotic lesions of individuals lacking the GSTM1 genotype. Faseb J. 2001;15:752–757. doi: 10.1096/fj.00-0312com. [DOI] [PubMed] [Google Scholar]
- 15.Rapp JP. Genetic analysis of inherited hypertension in the rat. Physiol Rev. 2000;80:135–172. doi: 10.1152/physrev.2000.80.1.135. [DOI] [PubMed] [Google Scholar]
- 16.McBride MW, Carr FJ, Graham D, Anderson NH, Clark JS, Lee WK, Charchar FJ, Brosnan MJ, Dominiczak AF. Microarray analysis of rat chromosome 2 congenic strains. Hypertension. 2003;41:847–853. doi: 10.1161/01.HYP.0000047103.07205.03. [DOI] [PubMed] [Google Scholar]
- 17.McBride MW, Brosnan MJ, Mathers J, McLellan LI, Miller WH, Graham D, Hanlon N, Hamilton CA, Polke JM, Lee WK, Dominiczak AF. Reduction of Gstm1 expression in the stroke-prone spontaneously hypertension rat contributes to increased oxidative stress. Hypertension. 2005;45:786–792. doi: 10.1161/01.HYP.0000154879.49245.39. [DOI] [PubMed] [Google Scholar]
- 18.Le TH, Fogo AB, Salzler HR, Vinogradova T, Oliverio MI, Marchuk DA, Coffman TM. Modifier locus on mouse chromosome 3 for renal vascular pathology in AT1A receptor-deficiency. Hypertension. 2004;43:445–451. doi: 10.1161/01.HYP.0000112423.28987.00. [DOI] [PubMed] [Google Scholar]
- 19.Malakauskas SM, Quan H, Fields TA, McCall SJ, Yu MJ, Kourany WM, Frey CW, Le TH. Aminoaciduria and altered renal expression of luminal amino acid transporters in mice lacking novel gene collectrin. Am J Physiol Renal Physiol. 2007;292:F533–544. doi: 10.1152/ajprenal.00325.2006. [DOI] [PubMed] [Google Scholar]
- 20.Zhang L, Peppel K, Sivashanmugam P, Orman ES, Brian L, Exum ST, Freedman NJ. Expression of tumor necrosis factor receptor-1 in arterial wall cells promotes atherosclerosis. Arterioscler Thromb Vasc Biol. 2007;27:1087–1094. doi: 10.1161/ATVBAHA.0000261548.49790.63. [DOI] [PMC free article] [PubMed] [Google Scholar]
- 21.Brandes RP. Role of NADPH oxidases in the control of vascular gene expression. Antioxid Redox Signal. 2003;5:803–811. doi: 10.1089/152308603770380115. [DOI] [PubMed] [Google Scholar]
- 22.Sundaresan M, Yu ZX, Ferrans VJ, Irani K, Finkel T. Requirement for generation of H2O2 for platelet-derived growth factor signal transduction. Science. 1995;270:296–299. doi: 10.1126/science.270.5234.296. [DOI] [PubMed] [Google Scholar]
- 23.Berk BC, Vallega G, Muslin AJ, Gordon HM, Canessa M, Alexander RW. Spontaneously hypertensive rat vascular smooth muscle cells in culture exhibit increased growth and Na+/H+ exchange. J Clin Invest. 1989;83:822–829. doi: 10.1172/JCI113964. [DOI] [PMC free article] [PubMed] [Google Scholar]
- 24.Hadrava V, Tremblay J, Hamet P. Abnormalities in growth characteristics of aortic smooth muscle cells in spontaneously hypertensive rats. Hypertension. 1989;13:589–597. doi: 10.1161/01.hyp.13.6.589. [DOI] [PubMed] [Google Scholar]
- 25.Owens GK, Schwartz SM. Alterations in vascular smooth muscle mass in the spontaneously hypertensive rat. Role of cellular hypertrophy, hyperploidy, and hyperplasia. Circ Res. 1982;51:280–289. doi: 10.1161/01.res.51.3.280. [DOI] [PubMed] [Google Scholar]
- 26.Resink TJ, Scott-Burden T, Jones CR, Baur U, Buhler FR. Atrial natriuretic peptide: binding and cyclic GMP response in cultured vascular smooth muscle cells from spontaneously hypertensive rats. Am J Hypertens. 1989;2:32–39. doi: 10.1093/ajh/2.1.32. [DOI] [PubMed] [Google Scholar]
- 27.Singh A, Sventek P, Lariviere R, Thibault G, Schiffrin EL. Inducible nitric oxide synthase in vascular smooth muscle cells from prehypertensive spontaneously hypertensive rats. Am J Hypertens. 1996;9:867–877. doi: 10.1016/s0895-7061(96)00104-5. [DOI] [PubMed] [Google Scholar]
- 28.Lemercier JN, Meier BW, Gomez JD, Thompson JA. Inhibition of glutathione S-transferase P1-1 in mouse lung epithelial cells by the tumor promoter 2,6-di-tert-butyl-4-methylene-2,5-cyclohexadienone (BHT-quinone methide): protein adducts investigated by electrospray mass spectrometry. Chem Res Toxicol. 2004;17:1675–1683. doi: 10.1021/tx049811x. [DOI] [PubMed] [Google Scholar]
- 29.Chanas SA, Jiang Q, McMahon M, McWalter GK, McLellan LI, Elcombe CR, Henderson CJ, Wolf CR, Moffat GJ, Itoh K, Yamamoto M, Hayes JD. Loss of the Nrf2 transcription factor causes a marked reduction in constitutive and inducible expression of the glutathione S-transferase Gsta1, Gsta2, Gstm1, Gstm2, Gstm3 and Gstm4 genes in the livers of male and female mice. Biochem J. 2002;365:405–416. doi: 10.1042/BJ20020320. [DOI] [PMC free article] [PubMed] [Google Scholar]
- 30.Kuhel DG, Zhu B, Witte DP, Hui DY. Distinction in genetic determinants for injury-induced neointimal hyperplasia and diet-induced atherosclerosis in inbred mice. Arterioscler Thromb Vasc Biol. 2002;2:955–960. doi: 10.1161/01.atv.0000017994.77066.75. [DOI] [PubMed] [Google Scholar]
- 31.Ikeda S, Hawes NL, Chang B, Avery CS, Smith RS, Nishina PM. Severe ocular abnormalities in C57BL/6 but not in 129/Sv p53-deficient mice. Invest Ophthalmol Vis Sci. 1999;40:1874–1878. [PubMed] [Google Scholar]
- 32.Seidegard J, DePierre JW, Pero RW. Hereditary interindividual differences in the glutathione transferase activity towards trans-stilbeen oxide in resting human mononuclear leukocytes are due to a particular isozymes(s) Carcinogenesis. 1985;6:1211–1216. doi: 10.1093/carcin/6.8.1211. [DOI] [PubMed] [Google Scholar]
- 33.Suh YA, Arnold RS, Lassegue B, Shi J, Xu X, Sorescu D, Chung AB, Griendling KK, Lambeth JD. Cell transformation by the superoxide-generating oxidase Mox1. Nature. 1999;401:79–82. doi: 10.1038/43459. [DOI] [PubMed] [Google Scholar]
- 34.Cai H, Griendling KK, Harrison DG. The vascular NAD(P)H oxidases as therapeutic targets in cardiovascular diseases. Trends Pharmacol Sci. 2003;24:471–478. doi: 10.1016/S0165-6147(03)00233-5. [DOI] [PubMed] [Google Scholar]
- 35.Cho SG, Lee YH, Park HS, Ryoo K, Kang KW, Park J, Eom SJ, Kim MJ, Chang TS, Choi SY, Shim J, Kim Y, Dong MS, Lee MJ, Kim SG, Ichijo H, Choi EJ. Glutathione S-transferase mu modulates the stress-activated signals by suppressing apoptosis signal-regulating kinase 1. J Biol Chem. 2001;276:12749–12755. doi: 10.1074/jbc.M005561200. [DOI] [PubMed] [Google Scholar]
- 36.Dorion S, Lambert H, Landry J. Activation of the p38 signaling pathway by heat shock involves the dissociation of glutathione S-transferase Mu from Ask1. J Biol Chem. 2002;277:30792–30797. doi: 10.1074/jbc.M203642200. [DOI] [PubMed] [Google Scholar]
- 37.Squadrito F, Minutoli L, Esposito M, Bitto A, Marini H, Seminara P, Crisafulli A, Passaniti M, Adamo EB, Marini R, Guarini S, Altavilla D. Lipid peroxidation triggers both c-Jun N-terminal kinase (JNK) and extracellular-regulated kinase (ERK) activation and neointimal hyperplasia induced by cessation of blood flow in the mouse carotid artery. Atherosclerosis. 2005;178:295–302. doi: 10.1016/j.atherosclerosis.2004.10.013. [DOI] [PubMed] [Google Scholar]
- 38.Liu CS, Tsai CS. Enhanced lipid peroxidation in epileptics with null genotype of glutathione S-transferase M1 and intractable seizure. Jpn J Pharmacol. 2002;90:291–294. doi: 10.1254/jjp.90.291. [DOI] [PubMed] [Google Scholar]
Associated Data
This section collects any data citations, data availability statements, or supplementary materials included in this article.


