

Abstract
Single nucleotide polymorphisms (SNPs) within the gene encoding the serine/threonine kinase KIS (Kinase Interacting with Stathmin, also known as UHMK1) have recently been associated with schizophrenia. As none of the disease associated SNPs are coding, they may confer susceptibility by altering some facet of KIS expression. Here we have characterised the cellular distribution of KIS in human brain using in situ hybridisation and immunohistochemistry, and quantified KIS protein and mRNA in two large brain series to determine if KIS expression is altered in schizophrenia or bipolar disorder or in relation to a schizophrenia-associated SNP (rs7513662). Post-mortem tissue from the superior temporal gyrus of schizophrenia and control subjects, and also dorsolateral prefrontal cortex, anterior cingulate cortex, and cerebellum from schizophrenia, bipolar disorder, and control subjects were used. KIS expression was measured by quantitative PCR (mRNA) and immunoautoradiography (protein), and was also quantified by immunoblot in lymphoblast cell lines derived from schizophrenia and control subjects. Our results demonstrate that KIS is expressed in neurons, and its encoded protein is localised to the nucleus and cytoplasm. No difference in KIS expression was found between diagnostic groups, or in the lymphoblast cell lines, and no effect of rs7513662 genotype on KIS expression was found. Hence, these data do not provide support for the hypothesis that altered expression is the mechanism by which genetic variation of KIS may increase susceptibility to schizophrenia, nor evidence that KIS expression is altered in the disease itself, at least in terms of the parameters studied here.
Keywords: bipolar disorder, gene expression, psychosis, schizophrenia, UHMK1
1. Introduction
Two recent genetic association studies of British case-control samples have identified several schizophrenia-associated single nucleotide polymorphisms (SNPs) within the gene encoding the serine/threonine kinase KIS (Kinase Interacting with Stathmin, also known as UHMK1 and P-CIP2; Puri et al., 2007, 2008). The KIS gene is located between the RGS4 and CAPON genes at chromosome 1q23.3, a region that has previously been identified as a susceptibility locus for schizophrenia (Brzustowicz et al., 2000; Gurling et al., 2001; Ng et al., 2008). The schizophrenia-associated SNPs are located in non-coding regions of the gene (see Fig. 1), so any effect on disease susceptibility is likely to occur by altering some facet of KIS expression.
Fig. 1.
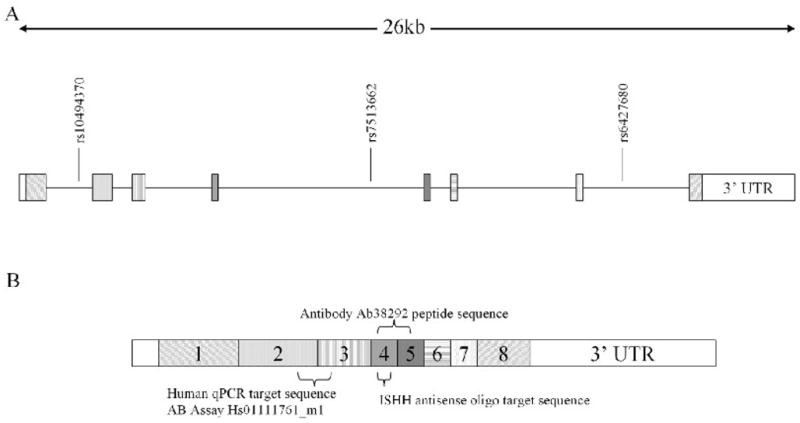
(A) Structure of the KIS gene showing three schizophrenia-associated SNPs located within the gene. rs7513662 was chosen for study as it is the only SNP associated with schizophrenia in two individual studies and also when the data from these two studies were combined (Puri et al., 2007, 2008). rs7513662 also tags a haplotype block which covers the entire KIS gene and surrounding sequence (Haploview version 4.0, Broad Institute, USA). (B) Diagram of the KIS transcript with exons labelled showing the location of target sequences for the ISHH oligo probe, TaqMan qPCR probe, and the region containing the peptide sequence targeted by the anti-KIS antibody (Ab38292).
KIS is expressed throughout the body, with its highest levels in the brain (Bièche et al., 2003; Caldwell et al., 1999; Maucuer et al., 1995, 1997). KIS was first discovered through its interaction with the microtubule regulatory protein stathmin (Maucuer et al., 1995), with phosphorylation of stathmin by KIS promoting stathmin degradation (Langenickel et al., 2008). Though there are no data concerning KIS expression or function in schizophrenia, alterations in stathmin have been detected in the anterior cingulate cortex (ACC) and dorsolateral prefrontal cortex (DLPFC) in schizophrenia (Clark et al., 2006; English et al., 2009). A role of KIS in the regulation of microtubules offers a potential mechanism through which altered KIS could confer schizophrenia susceptibility via the hypothesis of altered microtubule function in the pathophysiology of schizophrenia (Kerwin et al., 1993; Eastwood et al., 2007, 2009).
In this study we aimed to characterise the regional and cellular distribution of KIS within the adult human brain and quantify KIS protein and mRNA to determine if KIS expression is altered in schizophrenia, or in relation to a schizophrenia-associated SNP (rs7513662; Fig. 1). Subjects with bipolar disorder were also included to examine diagnostic specificity.
2. Results
2.1. Human KIS distribution
Using in situ hybridisation histochemistry (ISHH), immunohistochemistry (IHC) and immunoautoradiography, KIS expression was detected in all brain regions examined. Minimal background signal was detected after in situ hybridisation with a probe in the sense direction (see Fig. 2), and antibody specificity was confirmed by western blotting, with a single band of the predicted size for recombinant KIS protein with a GST tag (64kDa; Fig. 3A), and human KIS (46.5kDa; Maucuer et al., 1997; Fig. 3B) being detected.
Fig. 2.
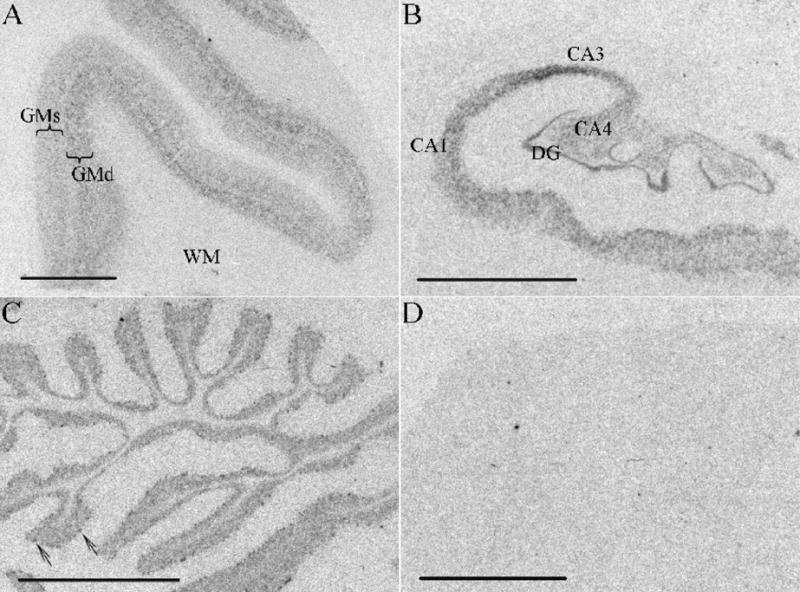
Autoradiographs of KIS mRNA in the human brain. (A) Frontal cortex, (B) hippocampus, (C) cerebellum (arrows indicate Purkinje cells), (D) cerebellum sense control. CA: cornu ammonis; DG: dentate gyrus; GMd: deeper layers of the grey matter; GMs: superficial layers of the grey matter; WM: white matter. Scale bar =5mm.
Fig. 3.
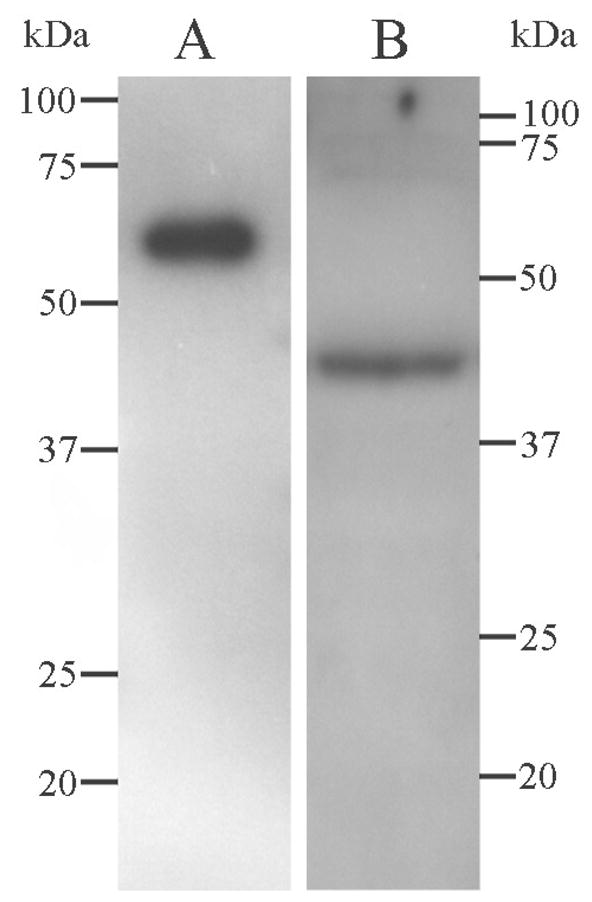
Western blot using the anti-KIS antibody (Ab38292). (A) Recombinant KIS protein with GST tag. (B) Human cerebellum. Molecular weight markers shown are in kDa.
KIS mRNA signal was detected in all brain regions examined. Higher KIS mRNA expression was observed in the deeper cortical layers (Fig. 2A). There was strong KIS mRNA signal in the dentate gyrus, CA1, CA3, and CA4 regions of the hippocampus (Fig. 2B), and KIS expression was also observed in Purkinje cells and in the granule cell layer of the cerebellum (Fig. 2C). There was negligible signal in the white matter (Fig. 2A).
Examination of emulsion-dipped ISHH sections demonstrated that KIS mRNA was expressed sparsely in the cells of the superficial layers of the cortex (Fig. 4A), but was more strongly expressed in pyramidal cells in layer 3 (Fig. 4B) and also some smaller cells, possibly interneurons (Fig. 4B). In agreement with the regional distribution of KIS mRNA, stronger mRNA signal was detected over pyramidal neurons of deeper cortical layers (data not shown). KIS mRNA was widely detected in the hippocampus, particularly in the pyramidal cells of the CA3 region (Fig. 4C) and the granule cells of the dentate gyrus (Fig. 4E), and also in Purkinje cells and granule cells of the cerebellum (Fig. 4G). No signal was detected in the white matter (not shown), and the sense orientation control probe for ISHH showed minimal signal (Fig. 4G insert).
Fig. 4.
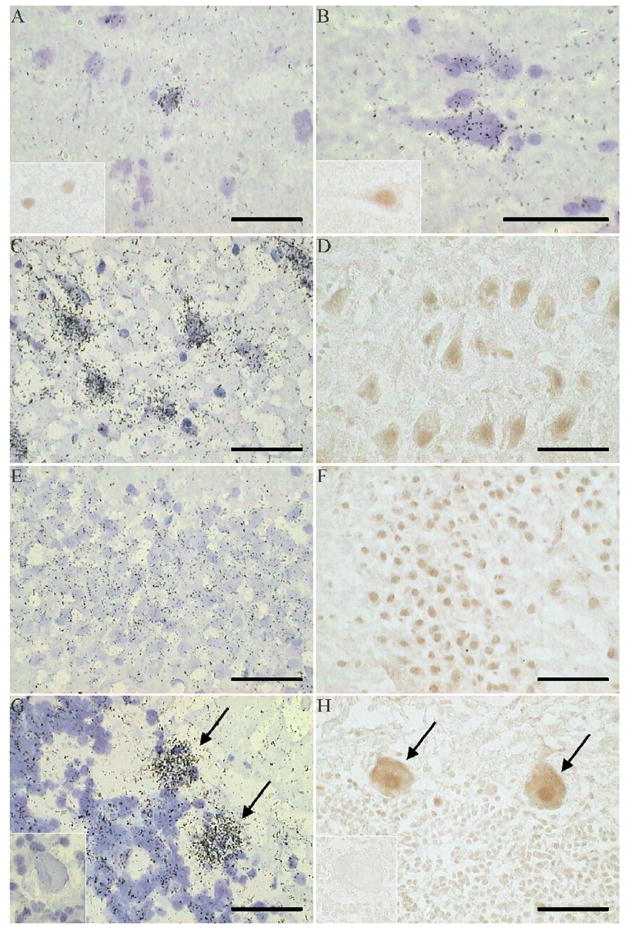
Cellular distribution of KIS mRNA and immunoreactivity, in human brain. (A) KIS mRNA and immunoreactivity (insert) in superior temporal gyrus, layer 2. (B) KIS mRNA and immunoreactivity (insert), in superior temporal gyrus, layer 3. (C) KIS mRNA in CA3. (D) KIS immunoreactivity in CA3. (E) KIS mRNA in dentate gyrus. (F) KIS immunoreactivity in dentate gyrus. (G) KIS mRNA in cerebellum, showing Purkinje cells (arrows); insert shows sense control. (H) KIS immunoreactivity in cerebellum, showing Purkinje cells (arrows); insert shows absence of staining after omission of the primary antibody. Scale bar =50μm.
The distribution of KIS immunoreactivity corresponded to that of its mRNA, as can be seen in the cortex (Fig. 4A and 4B inserts, Fig. 5), hippocampus (Fig. 4D and 4F) and cerebellum (Fig. 4H). No KIS immunoreactivity was found in the white matter (not shown), and IHC in the absence of the KIS primary antibody showed minimal staining (Fig. 4H insert). At the cellular level both nuclear and cytoplasmic KIS immunoreactivity was detected, as can be seen in pyramidal neurons (Fig. 4B insert and 4D) and Purkinje cells, where it appears to extend into some proximal dendrites (Fig. 4H). KIS immunoreactivity detected using immunoautoradiaography also detected KIS through the depth of the cortex, with some enhancement of immunoautoradiographic signal observed in deeper cortical layers (Fig. 5).
Fig. 5.
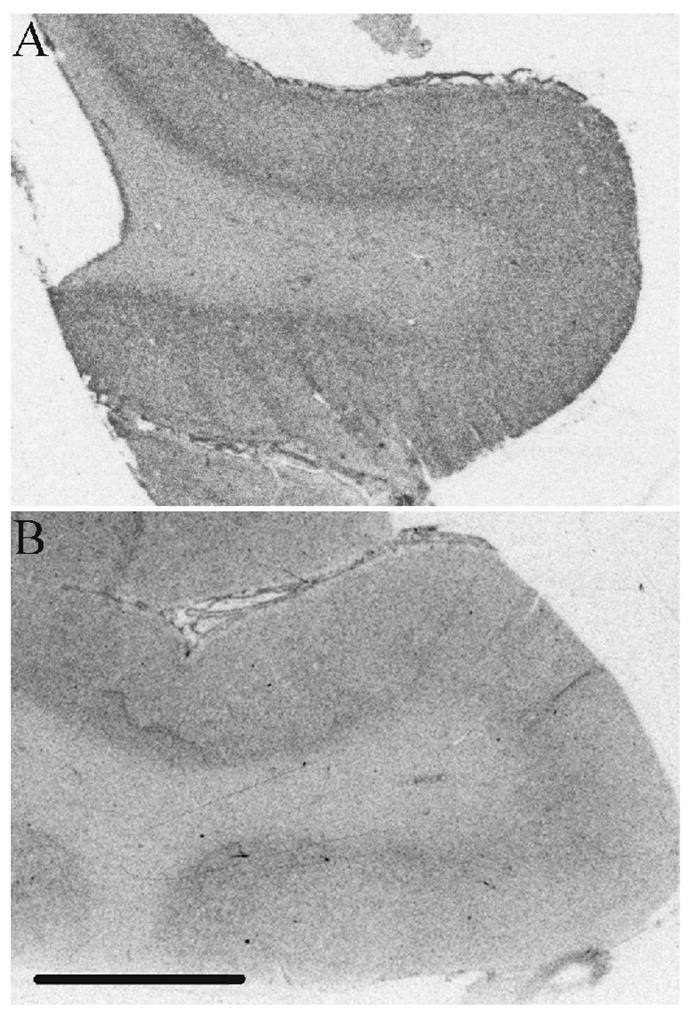
Representative examples of KIS immunoautoradiography in (A) the dorsolateral prefrontal cortex and (B) the superior temporal gyrus. Scale bar =5mm.
2.2. KIS quantification in diagnostic groups
Superior Temporal Gyrus (STG)
STG KIS qPCR data were normalised to β-2-microglobulin (B2M). One control subject was excluded as an outlier (> 3 S.D. from the mean). KIS mRNA was normally distributed and correlated with the RNA integrity number (RIN; Pearson correlation, R=0.24, p=0.02) which was thus included as a covariate in the ANOVA. No difference in KIS mRNA was found between diagnostic groups (Table 1). Immunoautoradiography did not detect any diagnostic differences of cortical KIS (Table 1).
Table 1.
KIS mRNA and immunoreactivity in controls, schizophrenia, and bipolar disorder
| Control | Schizophrenia | Bipolar | ||||
|---|---|---|---|---|---|---|
| mRNA | ||||||
| STG1 | Mean ± SEM | 0.73 ± 0.06 | 0.70 ± 0.07 | n/a | F1,89=0.134 | P=0.716 |
| N | 55 | 39 | ||||
| ACC2 | Mean ± SEM | 1.29 ± 0.15 | 1.01 ± 0.08 | 1.25 ± 0.09 | F2,95=1.575 | P=0.212 |
| N | 35 | 35 | 32 | |||
| CB | Mean ± SEM | 2.94 ± 0.45 | 2.86 ± 0.38 | 2.51 ± 0.36 | - | P=0.6663 |
| N | 35 | 34 | 33 | |||
| Protein | ||||||
| STG | Mean ± SEM | 175 ± 4 | 168 ± 6 | n/a | F1,113=0.835 | P=0.363 |
| N | 75 | 42 | ||||
| DLPFC | Mean ± SEM | 272 ± 6 | 270 ± 5 | 275 ± 7 | F2,98= 0.072 | P=0.930 |
| N | 35 | 35 | 34 |
KIS mRNA data are normalised to housekeeping gene(s). Immunoreactivity values are 35SnCi/g tissue equivalents. STG, superior temporal gyrus; ACC, anterior cingulate cortex; CB, cerebellum; DLPFC, dorsolateral prefrontal cortex.
RIN included as covariate,
pH included as covariate,
Kruskal-Wallis test.
Anterior Cingulate Cortex (ACC)
ACC KIS mRNA qPCR data was normalised to the geometric mean of the four housekeeping genes (B2M, glyceraldehyde 3-phosphate dehydrogenase (GAPDH), glucuronidase beta (GUSB) and transferrin receptor (TFRC)), which has been reported to be an accurate normalisation factor for qPCR (Vandesompele et al., 2002). Two bipolar disorder subjects were excluded from analysis as the samples failed to amplify. KIS mRNA was normally distributed and correlated with pH (Pearson correlation, R=0.318, p=0.001), which was included as a covariate in the ANOVA. No change in KIS mRNA between diagnostic groups was found (Table 1).
Cerebellum (CB)
One subject with schizophrenia and one bipolar disorder subject were excluded from analysis as the samples failed to amplify. CB KIS qPCR data were normalised to B2M alone, as one-way ANOVA and post-hoc t-tests of GAPDH, GUSB, and TFRC expression each showed significant difference between diagnostic groups (data not shown). KIS normalised to B2M was not normally distributed so the data were analysed using Kruskal-Wallis test, which showed no effect of diagnosis (Table 1).
Dorsolateral Prefrontal Cortex (DLPFC)
KIS immunoautoradiography in the DLPFC showed no effect of diagnosis (Table 1).
Lymphoblast Cell Lines (LCL)
Immunoblot of KIS in LCLs showed no difference in levels of KIS between cases and controls (Table 2).
Table 2.
Quantification of KIS immunoreactivity in diagnostic and genotype groups in lymphoblast cell lines.
| Diagnosis | Control | Schizophrenia | |||
|---|---|---|---|---|---|
| Mean ± SEM | 8729 ± 330 | 7797 ± 616 | F1,57=2.027 | P=0.160 | |
| N | 39 | 22 | |||
| Genotype | A/A | A/G or G/G | |||
| Mean ± SEM | 8294 ± 562 | 8466 ± 348 | F1,57=0.005 | P=0.942 | |
| N | 26 | 35 |
Units shown are integrated density value.
2.3. Genotype and KIS expression
No significant effect of rs7513662 genotype on KIS mRNA or protein was found in any brain region (Table 3) or in LCLs (Table 2), although there was a trend (p=0.089) for an increase in KIS immunoreactivity in the DLPFC of subjects who carried at least one G-allele. There were no significant interactions of diagnosis with genotype (data not shown).
Table 3.
KIS mRNA and immunoreactivity and rs7513662 SNP genotype.
| A/A | A/G or G/G | ||||
|---|---|---|---|---|---|
| mRNA | |||||
| STG1 | Mean ± SEM | 0.71 ± 0.05 | 0.72 ± 0.09 | F1,89=0.189 | P=0.665 |
| N | 64 | 30 | |||
| ACC2 | Mean ± SEM | 1.19 ± 0.11 | 1.18 ± 0.08 | F1,95=0.000 | P=0.985 |
| N | 45 | 57 | |||
| CB | Mean ± SEM | 3.06 ± 0.37 | 2.55 ± 0.28 | - | P=0.3223 |
| N | 45 | 57 | |||
| Immunoreactivity | |||||
| STG | Mean ± SEM | 174 ± 4 | 170 ± 7 | F1,113=0.231 | P=0.632 |
| N | 82 | 35 | |||
| DLPFC | Mean ± SEM | 264 ± 6 | 278 ± 4 | F1,98=2.95 | P=0.089 |
| N | 45 | 59 |
KIS mRNA data are normalised to housekeeping gene(s), immunoreactivity is 35SnCi/g tissue equivalents. STG, superior temporal gyrus; ACC, anterior cingulate cortex; CB, cerebellum; DLPFC, dorsolateral prefrontal cortex.
RIN included as covariate,
pH included as covariate,
Mann-Whitney test.
2.4. Antipsychotic drug treatment and KIS expression
KIS mRNA in the frontal and cerebellar regions of rat brain was measured by qPCR and normalised to the geometric mean of three housekeeping genes (GAPDH, GUSB, and hypoxanthine-guanine phosphoribosyltransferase [HPRT]) and showed no effect of antipsychotic treatment (Table 4). In the patient groups, no correlation was detected between lifetime antipsychotic exposure and KIS expression in any brain region examined (data not shown).
Table 4.
KIS mRNA after antipsychotic administration in rats.
| Saline | Haloperidol | Clozapine | ||||
|---|---|---|---|---|---|---|
| Frontal Cortex | Mean ± SEM | 0.84 ± 0.16 | 0.80 ± 0.14 | 0.95 ± 0.10 | F2,21=0.319 | P=0.731 |
| N | 8 | 8 | 8 | |||
| CB | Mean ± SEM | 1.19 ± 0.15 | 1.01 ± 0.13 | 0.90 ± 0.07 | F2,21=1.537 | P=0.238 |
| N | 8 | 8 | 8 |
KIS mRNA normalised to geometric mean of housekeeping genes.
3. Discussion
In this study we have characterised the regional and cellular distribution of KIS mRNA and protein in the adult human brain. We have quantified KIS mRNA and protein expression in post-mortem tissue from several brain regions of patients with schizophrenia, bipolar disorder, and matched control subjects. KIS immunoreactivity was also measured in lymphoblast cell lines derived from patients with schizophrenia and control subjects.
3.1 KIS distribution in the adult human brain
To our knowledge, the distribution of KIS in the human brain has not been previously characterised. KIS mRNA and immunoreactivity were detected through the grey matter of the cortex (Fig. 2A, Fig. 5), with the mRNA particularly expressed in deeper cortical layers (Fig. 2A). No signal for KIS mRNA (Fig. 2A) or immunoreactivity was detected in the white matter, suggesting that KIS is not expressed in glia, at least in this compartment. KIS expression was detected in dentate gyrus, CA1, CA3, and CA4 regions of the hippocampus (Fig. 2B, 4C–F), and also in both Purkinje cells and the granule cell layer of the cerebellum (Fig. 4G, H). Our findings of widespread KIS mRNA expression in the human brain confirm and extend previous studies which reported the regional distribution of KIS mRNA in rats using ISHH and qPCR (Biéche et al., 2003; Caldwell et al., 1999) and also showed KIS mRNA in neurons by ISHH (Alam et al., 1996; Caldwell et al., 1999).
KIS immunoreactivity was strongest in the nucleus, as can be seen in both pyramidal neurons and Purkinje cells (see Fig. 4B, D, and H). The nuclear localisation is in agreement with a previous report of KIS in serum stimulated NIH 3T3 cells (Boehm et al., 2002). In these dividing cells the nuclear localisation of KIS is important as phosphorylation of the cyclin dependent kinase inhibitor p27kip1 by KIS in the nucleus leads to the export of p27kip1 to the cytoplasm and cell cycle progression, though a role for KIS as a promoter of cell cycle progression is neurons is unlikely in these post-mitotic cells. Another target which may explain the nuclear localisation of KIS is the splicing factor SF1, which is a nuclear protein whose phosphorylation by KIS, at least in vitro, enhances binding of SF1 to U2AF65 protein and the 3′ splice site during spliceosome formation (Manceau et al., 2006).
KIS immunoreactivity was also observed in the cytoplasm of the soma (Fig. 4B, D, and H), extending into the proximal dendrites of some Purkinje cells (Fig. 4H). As KIS is required for normal neurite outgrowth in cultured cortical neurons (Cambray et al., 2009), a cytoplasmic localisation of KIS likely to be necessary for this action, potentially through an interaction of KIS with the microtubule regulatory protein stathmin (Maucuer et al, 1995, 1997; Langenickel et al., 2008) or through its purported role as a modulator of transport and local translation of β–actin mRNA (Cambray et al., 2009).
Our findings of both nuclear and cytoplasmic KIS immunoreactivity confirms previous reports of the subcellular distribution of KIS in cell lines (Alam et al., 1996; Boehm et al., 2002; Manceau et al., 2008; Maucuer et al., 1997), although it does not correspond with another study which reported no nuclear KIS immunoreactivity in neurons of the medulla oblongata in rats (Caldwell et al., 1999). Possible explanations of this difference between our findings and those of Caldwell et al., 1999, could be the use of a different antibody, the study of differing brain regions, or a species difference. Further investigation of these contradictory findings could be carried out subcellular fractionation of human tissue.
3.2. KIS expression in schizophrenia
No significant difference between diagnostic groups was found in KIS mRNA or immunoreactivity in a post-mortem series of STG tissue comprised of schizophrenia and matched control subjects, or in a further post-mortem series of ACC, cerebellum, and DLPFC tissue that included control, schizophrenia, and bipolar disorder subjects. KIS immunoreactivity in LCLs derived from schizophrenia and control subjects also showed no effect of diagnosis. The data in schizophrenia cases are unlikely to have been confounded by medication since there was no evidence of a change in KIS expression in rats treated with typical or atypical antipsychotic medication, and no correlation between any measure of KIS mRNA or protein in human tissue with patient antipsychotic history was found (data not shown).
It remains a possibility that aberrant expression of KIS during development could confer susceptibility to schizophrenia later in life. KIS expression dramatically increases during brain development (Bièche et al., 2003) and the KIS phosphorylation target p27kip1 is thought to play an important role in proliferation, differentiation, and migration of cortical neurons in mice (Goto et al., 2004; Nguyen et al., 2006). This, along with the evidence for the involvement of KIS in neurite outgrowth (Cambray et al., 2009), indicates that KIS activity is likely to be important for normal brain development.
3.3. Genotype and KIS expression
The SNP rs7513662 has been associated with schizophrenia in two separate studies, with the G-allele of this SNP found to be less common in schizophrenic subjects compared to controls (Puri et al., 2007; 2008). A recent study in a Bulgarian population failed to replicate this, although they did report equivocal association with a decrease in frequency of the A-allele in schizophrenia (Betcheva et al., 2009). We found a trend increase of KIS immunoreactivity in the DLPFC of subjects with at least one G-allele (p=0.089), but no significant effect of genotype on KIS mRNA or immunoreactivity was found in any brain region or in lymphoblast protein. These results together indicate that SNP rs7513662 does not demonstrably influence KIS expression, and as such the biological basis for any genetic involvement of KIS in schizophrenia remains unknown. However, this conclusion is subject to several qualifications. First, it is limited to the comparison between A/A subjects and those carrying a G allele, since the small number of G/G homozygotes (e.g. for our STG samples, N=2 cases, N=4 subjects with schizophrenia) means that we could not test for a recessive effect of the G allele on KIS expression. Second, rs7513662 might modulate KIS expression at an earlier age (e.g. during fetal development or childhood), or in brain regions not examined here. Thirdly, it is possible that rs7513662 is in linkage disequilibrium with a coding SNP which affects the activity of KIS rather than its expression, or which is involved in the expression of an as yet unknown splice variant of KIS.
4. Experimental procedures
4.1. Study subjects
Normative distribution of KIS was investigated using human post-mortem brain tissue of selected controls from the collections described below and limited tissue collected in Oxford. For the quantitative studies, tissue was available from the STG (Brodmann area 22), ACC, DLPFC and CB. The STG tissue came from the National Institute of Mental Health (NIMH; Table 5). For the qPCR study, only STG samples with RNA integrity number (RIN) ≥3.5, age ≤80 years, post-mortem interval (PMI) <72 hours, and 6.0<pH<6.9 were included in order to exclude low quality samples while keeping the diagnostic groups matched for demographic variables (see Lipska et al., 2006). The other brain areas (ACC, DLPFC, CB) were from the Stanley Medical Research Institute (SMRI) array collection, consisting of 35 subjects with schizophrenia, 34 with bipolar disorder, and 35 healthy comparison subjects. Their demographics were as described (Eastwood et al., 2008: http://www.stanleyresearch.org/dnn/Portals/0/Stanley/Array%20Collection%20Demographic%20Details%20Chart-Final.pdf).
Table 5.
Demographics of superior temporal gyrus tissue.
| N | Sex | Race | Age | pH | PMI | RIN | |
|---|---|---|---|---|---|---|---|
| mRNA | |||||||
| Control | 56 | 41M, 15F | 19C, 31AA, 3H, 3A | 44.1 (14.9) | 6.52 (0.23) | 33.7 (14.7) | 5.97 (0.95) |
| Schizophrenia | 39 | 29M, 10F | 15C, 21AA, 2H, 1MD | 45.6 (14.5) | 6.45 (0.24) | 33.8 (13.4) | 6.09 (1.24) |
| Protein | |||||||
| Control | 75 | 51M, 24F | 23C, 46AA, 3H, 3A | 42.1 (15.0) | 6.55 (0.31) | 32.0 (14.7) | 5.39 (1.62) |
| Schizophrenia | 42 | 25M, 17F | 17C, 23AA, 2H | 49.3 (17.1) | 6.38 (0.33) | 39.6 (19.3) | 4.40 (1.92) |
Mean values are given with standard deviation in brackets. M: Male; F:, Female; C: Caucasian; AA: African American; H: Hispanic; A: Asian Pacific; MD: missing data. Age given in years; PMI: post-mortem interval (hours); RIN: RNA integrity number.
Lymphoblast cell lines (LCLs) were available from 22 schizophrenia and 39 control subjects, as described previously (Sei et al., 2007).
4.2. In situ hybridisation histochemistry (ISHH)
14μm frozen tissue sections were pre-treated as follows: fixation in phosphate buffered saline (PBS) with 4% paraformaldehyde (5min), PBS (2 rinses), deacetylation in TEA (0.1M triethanolamine, 0.15M NaCl, pH 8.0) with 0.25% acetic anhydride (10min), dehydration through serial alcohols (70%, 80% (both 1min), 95% (2min), 100% ethanol (1min)), chloroform (10min), and partial rehydration in alcohol (100% and 95% ethanol, 1min each).
8pmol of the anti-sense oligonucleotide probe to KIS mRNA (5′ GGC TGG AAT TGC GGC ATT CAC CAC TGC TTT ACT GG 3′ (Genbank accession number NM_175866; Fig. 1) was 3′ labeled with 35S dATP (Perkin Elmer, Beaconsfield, UK) using terminal deoxynucleotide transferase (Promega, Southampton, UK). The labelled probe was purified using Nick Columns (GE Healthcare, Chalfont, UK).
Sections were hybridised overnight at 32°C in hybridisation buffer (10% dextran sulphate, 50% deionised formamide, 4X standard saline citrate (SSC) (1X SSC = 15mM tri-sodium citrate, 150mM sodium chloride, pH 7.4), 5X Denhardts solution, 0.208mg/ml salmon sperm, 0.1mg/ml polyadenylic acid, 0.125mg/ml Heparin, 25mM sodium phosphate buffer pH 7.4, 1mM sodium pyrophosphate) with 50mM dithiothreitol and 106c.p.m. of labelled probe per section. 3×20min post-hybridisation washes were carried out in 1X SSC at 56°C followed by 2×60min 1X SSC washes at room temperature. The sections were placed against Biomax MS Film (Sigma-Aldrich, Poole, UK) for 14–19 days. A selection of sections were emulsion dipped (Hypercoat LM-1, GE Healthcare), developed after 30–84 days, and stained with 0.5% Cresyl Violet Acetate. Experimental controls consisted of ISHH with a sense orientation probe and ISHH in the presence of 50-fold molar excess of unlabeled probe.
4.3. Western blotting
Western blots of 0.075μg recombinant KIS protein (amino acids 1 to 344; Abnova, Taiwan) and 30μg human cerebellum protein were performed. Protein was extracted using standard methods and separated by sodium dodecyl sulphate (SDS) polyacrylamide gel electrophoresis (PAGE) before being transferred to a polyvinylidene difluoride (PVDF) membrane. The membrane was blocked in 2% milk and probed with KIS antibody (Ab38292, Abcam, Cambridge, UK, see Fig. 1) diluted to 1:1000, followed by goat anti-rabbit IgG horse radish peroxidase (HRP) conjugate (Bio-Rad, Hemel Hempstead, UK) at 1:5000. Antibody binding was visualised using ECL Plus Western Blotting Detection System (GE Healthcare).
4.4. Immunohistochemistry (IHC)
Frozen tissue sections of 14μm thickness were fixed in PBS with 4% paraformaldehyde, dehydrated in increasing concentrations of industrial methylated spirits (IMS), then placed in methanol with 3% hydrogen peroxide for 30 minutes, and re-hydrated in decreasing concentrations of IMS. Non-specific binding sites were blocked by incubation with 5% goat serum in PBS with 0.3% Triton X-100 (PBS-T) for 1 hour at room temperature. Sections were incubated at 4°C overnight with the KIS antibody diluted to 1:100 in solution of 1% goat serum and PBS-T. After PBS washes (3×10min), bound antibody was visualised using Vectastain ABC kit rabbit IgG, (Vector Laboratories, Peterborough, UK) and diaminobenzidine. Control sections were incubated without KIS antibody.
4.5. Quantitative polymerase chain reaction (qPCR)
RNA expression was measured by qPCR in the STG, ACC, and CB. RNA was extracted using Tri Reagent (Sigma-Aldrich) and established methods. The RIN of the RNA from each case was measured using an Agilent Bioanalyzer 2100 and RNA 6000 Nano kit (Agilent Technologies, Wokingham, UK). For each case and brain region RNA was DNase treated (1 unit RNase-free DNase, 24 units ribonuclease inhibitor, both Promega) and reverse transcribed (30ng oligo dT, 200 units M-MLV reverse transcriptase, 24 units ribonuclease inhibitor, 0.5mM of each dNTP). KIS and four human housekeeping genes were quantified using Taqman assays (Applied Biosystems, Warrington, UK: KIS: assay Hs01111761_m1 (Fig. 1); β-2-microglobulin: assay Hs99999907_m1; GAPDH: assay Hs99999905_m1; GUSB: assay Hs99999908_m1; TFRC: assay Hs00951094_m1). Housekeeping genes were excluded from the analysis if there was any significant difference in their expression between diagnostic groups, and the number of housekeeping genes measured varied between brain regions (dependent on the total amount of RNA available for each region). Each qPCR reaction contained 10ng (human ACC) or 20ng (human CB and STG) cDNA. STG samples were quantified using the average of four reactions; ACC and CB were measured in triplicate. qPCR conditions were: initial denaturing step of 10 minutes at 95°C, followed by 40 cycles of 15 seconds denaturing at 95°C and 60 seconds anneal/extend at 60°C. Samples were quantified using a standard curve and SDS v2.2.2 software with a 7900HT qPCR system (Applied Biosystems).
4.6. Immunoautoradiography
Immunoautoradiography was carried out in STG and DLPFC. Frozen tissue sections of 14μm thickness, two from each subject, were fixed using 4% paraformaldehyde in PBS (5min) and washed in PBS (2×5min). Non-specific binding sites were blocked by incubating sections with 10% donkey serum (Sigma-Aldrich) in PBS-T for 1 hour. Sections were incubated at 4°C overnight with KIS antibody diluted to 1:100 with 1% donkey serum in PBS-T. After PBS washes (3×10min) sections were incubated for 1 hour with 0.5μCi/ml 35S-labelled donkey anti-rabbit IgG (GE Healthcare) in PBS-T with 1% donkey serum, followed by PBS washes (3×10min). DLPFC sections were placed against Biomax MR Film (Sigma-Aldrich) for 13 days, and STG sections against Hyperfilm ECL (GE Healthcare) for 24 days, both alongside 14C microscales (GE Healthcare). The autoradiographs were measured using an MCID Elite version 7.0 image analysis system (Interfocus, Haverhill, UK), calibrated to the 14C microscales. KIS immunoreactivity was measured through the depth of the cortex. Non-specific binding, determined using sections incubated without KIS antibody, was subtracted from each measure.
4.7. Immunoblot of lymphoblast cell line (LCL) protein
LCLs were maintained in RPMI 1640 media (Lonza, Basel, Switzerland) containing 1% L-glutamine (200mM) and 10% heat inactivated fetal bovine serum (Cambrex, New Jersey, USA) until they reached 5×10⁵ cells/ml (logarithmic growth phase). 10×106 cells were lysed by boiling for 10 minutes in suspension buffer (0.1M NaCl, 0.01M TrisHCl, 1μM EDTA, 1μg/ml aprotinin, 100 μg/ml phenylmethylsulphonyl fluoride, 1% SDS) with protease inhibitor (Roche, Welwyn Garden City, UK). Protein content was determined by Bradford assay (Sigma-Aldrich). Pilot studies established the linear range over which KIS could be quantified (data not shown). 2μg protein for each case was dried onto Immobilon-P PVDF Transfer Membrane (Millipore) in duplicate. The membranes were blocked (1 hour 2% milk in PBS with 0.1% Tween20 (PBS-Tw)), incubated with KIS antibody (1:1000) for 1 hour, washed (3×15min, PBS-Tw), incubated for 30min with Goat anti-Rabbit IgG HRP conjugate (Bio-Rad) at 1:5000, and washed again (3×15min, PBS-Tw). Antibody binding was visualised using ECL Plus Western Blotting Detection System and Hyperfilm ECL (both GE Healthcare). The signal was measured using AlphaEraseFC software (version 3.1.2, Alpha Innotech Corporation, California, USA). Background signal, measured using a second membrane which was not exposed to KIS antibody, was subtracted from the average of the duplicate readings for each subject.
4.8. SNP genotyping
rs7513662 is an intronic A/G SNP located between exons 4 and 5 of the KIS gene (Fig. 1). Genomic DNA was extracted from each subject (brain tissue: Nucleon Genomic DNA Extraction Kit (Tepnel Life Sciences, Manchester, UK), LCLs: DNeasy Blood and Tissue kit (Qiagen, Crawley, UK)). rs7513662 SNP genotype was determined using TaqMan SNP Genotyping Assay C___3033929_20, a 7900HT Real-Time PCR system and SDS 2.2.2 software (all Applied Biosystems). All genotypes were confirmed with a duplicate sample.
4.9. Effect of antipsychotic medication on KIS expression
To examine the effects of antipsychotic medication on KIS expression, male Sprague-Dawley rats (8 weeks, 250–300g) received an intraperitoneal injection once daily for 14 days of haloperidol (1mg/kg/d) as an example of typical antipsychotic medication, clozapine (25mg/kg/d) as an example of atypical antipsychotics, or saline as a control (Law et al., 2004). There were 8 animals in each treatment group.
RNA was extracted from coronal sections of rat tissue at the level of the frontal cortex and the cerebellum. Reverse transcription was as described for humans and qPCR performed using powerSYBR Green (Applied Biosystems) with 0.2μM of each primer (KIS: F: 5′ TTG CCA GTA AAG CAG TGG TG, R: 5′ CAA AAG GAA TGC TAA AGA ATG G, and published primers for GAPDH (Yoshikawa et al., 2004), GUSB, and HPRT (both Yamaguchi et al., 2005)). Each reaction contained 7.5ng cDNA, and PCR conditions were identical to those used for human samples except the anneal/extend temperature for KIS was 58°C. All samples were measured in triplicate.
4.10. Data and statistical analysis
All experiments were performed and analysed blind to diagnosis and genotype. All statistical analyses were performed using SPSS software (version 16). Effects of diagnosis and genotype were analysed using a univariate ANOVA unless the data did not have a normal distribution (determined by Kolmogorov-Smirnov test), in which case nonparametric tests were used. Potential influences of continuous variables (pH, PMI, RIN, and age) were measured using either the Pearson or Spearman coefficient, depending on the normality of the data. Any variable showing a significant (p<0.05) correlation was included as a covariate for that dataset. Due to the small number of G/G homozygotes for SNP rs7513662, G/G and A/G subjects were grouped together and compared to A/A subjects.
Acknowledgments
Work supported by the UK Medical Research Council. We thank Dr Phil Burnet for provision of animal tissue. Some of the post-mortem tissue was provided by the Stanley Medical Research Institute courtesy of Drs Michael B Knable, E Fuller Torrey, Maree J Webster, Serge Weis, and Robert H Yolken. This research would not have been possible without the participation of patients with schizophrenia and bipolar disorder, their families, and control subjects, and we are grateful for their generosity.
Footnotes
Publisher's Disclaimer: This is a PDF file of an unedited manuscript that has been accepted for publication. As a service to our customers we are providing this early version of the manuscript. The manuscript will undergo copyediting, typesetting, and review of the resulting proof before it is published in its final citable form. Please note that during the production process errors may be discovered which could affect the content, and all legal disclaimers that apply to the journal pertain.
References
- Alam MR, Caldwell BD, Johnson RC, Darlington DN, Mains RE, Eipper BA. Novel proteins that interact with the COOH-terminal cytosolic routing determinants of an integral membrane peptide-processing enzyme. J Biol Chem. 1996;271:28636–28640. doi: 10.1074/jbc.271.45.28636. [DOI] [PubMed] [Google Scholar]
- Betcheva ET, Mushiroda T, Takahashi A, Kubo M, Karachanak SK, Zaharieva IT, et al. Case-control association study of 59 candidate genes reveals the DRD2 SNP rs6277 (C957T) as the only susceptibility factor for schizophrenia in the Bulgarian population. J Hum Genet. 2009;54:98–107. doi: 10.1038/jhg.2008.14. [DOI] [PubMed] [Google Scholar]
- Bieche I, Manceau V, Curmi PA, Laurendeau I, Lachkar S, Leroy K, et al. Quantitative RT-PCR reveals a ubiquitous but preferentially neural expression of the KIS gene in rat and human. Brain Res Mol Brain Res. 2003;114:55–64. doi: 10.1016/s0169-328x(03)00132-3. [DOI] [PubMed] [Google Scholar]
- Boehm M, Yoshimoto T, Crook MF, Nallamshetty S, True A, Nabel GJ, et al. A growth factor-dependent nuclear kinase phosphorylates p27(Kip1) and regulates cell cycle progression. EMBO J. 2002;21:3390–3401. doi: 10.1093/emboj/cdf343. [DOI] [PMC free article] [PubMed] [Google Scholar]
- Brzustowicz LM, Hodgkinson KA, Chow EW, Honer WG, Bassett AS. Location of a major susceptibility locus for familial schizophrenia on chromosome 1q21-q22. Science. 2000;288:678–682. doi: 10.1126/science.288.5466.678. [DOI] [PMC free article] [PubMed] [Google Scholar]
- Caldwell BD, Darlington DN, Penzes P, Johnson RC, Eipper BA, Mains RE. The novel kinase peptidylglycine alpha-amidating monooxygenase cytosolic interactor protein 2 interacts with the cytosolic routing determinants of the peptide processing enzyme peptidylglycine alpha-amidating monooxygenase. J Biol Chem. 1999;274:34646–34656. doi: 10.1074/jbc.274.49.34646. [DOI] [PubMed] [Google Scholar]
- Cambray S, Pedraza N, Rafel M, Gari E, Aldea M, Gallego C. Protein kinase KIS localizes to RNA granules and enhances local translation. Mol Cell Biol. 2009;29:726–735. doi: 10.1128/MCB.01180-08. [DOI] [PMC free article] [PubMed] [Google Scholar]
- Clark D, Dedova I, Cordwell S, Matsumoto I. A proteome analysis of the anterior cingulate cortex gray matter in schizophrenia. Mol Psychiatry. 2006;11:459–470. doi: 10.1038/sj.mp.4001806. [DOI] [PubMed] [Google Scholar]
- Eastwood SL, Lyon L, George L, Andrieux A, Job D, Harrison PJ. Altered expression of synaptic protein mRNAs in STOP (MAP6) mutant mice. J Psychopharmacol. 2007;21:635–644. doi: 10.1177/0269881106068825. [DOI] [PubMed] [Google Scholar]
- Eastwood SL, Harrison PJ. Decreased mRNA expression of netrin-G1 and netrin-G2 in the temporal lobe in schizophrenia and bipolar disorder. Neuropsychopharmacology. 2008;33:933–945. doi: 10.1038/sj.npp.1301457. [DOI] [PMC free article] [PubMed] [Google Scholar]
- Eastwood SL, Hodgkinson CA, Harrison PJ. DISC-1 Leu607Phe alleles differentially affect centrosomal PCM1 localization and neurotransmitter release. Mol Psychiatry. 2009;14:556–557. doi: 10.1038/mp.2009.13. [DOI] [PubMed] [Google Scholar]
- English JA, Dicker P, Föcking M, Dunn MJ, Cotter DR. 2-D DIGE analysis implicates cytoskeletal abnormalities in psychiatric disease. Proteomics. 2009;9:3368–3382. doi: 10.1002/pmic.200900015. [DOI] [PubMed] [Google Scholar]
- Goto T, Mitsuhashi T, Takahashi T. Altered patterns of neuron production in the p27 knockout mouse. Dev Neurosci. 2004;26:208–217. doi: 10.1159/000082138. [DOI] [PubMed] [Google Scholar]
- Gurling HM, Kalsi G, Brynjolfson J, Sigmundsson T, Sherrington R, Mankoo BS, et al. Genomewide genetic linkage analysis confirms the presence of susceptibility loci for schizophrenia, on chromosomes 1q32.2, 5q33.2, and 8p21-22 and provides support for linkage to schizophrenia, on chromosomes 11q23.3-24 and 20q12.1-11.23. Am J Hum Genet. 2001;68:661–673. doi: 10.1086/318788. [DOI] [PMC free article] [PubMed] [Google Scholar]
- Kerwin RW. Glutamate receptors, microtubule associated proteins and developmental anomaly in schizophrenia: an hypothesis. Psychol Med. 1993;23:547–551. doi: 10.1017/s0033291700025319. [DOI] [PubMed] [Google Scholar]
- Langenickel TH, Olive M, Boehm M, San H, Crook MF, Nabel EG. KIS protects against adverse vascular remodeling by opposing stathmin-mediated VSMC migration in mice. J Clin Invest. 2008;118:3848–3859. doi: 10.1172/JCI33206. [DOI] [PMC free article] [PubMed] [Google Scholar]
- Law AJ, Hutchinson LJ, Burnet PW, Harrison PJ. Antipsychotics increase microtubule-associated protein 2 mRNA but not spinophilin mRNA in rat hippocampus and cortex. J Neurosci Res. 2004;76:376–382. doi: 10.1002/jnr.20092. [DOI] [PubMed] [Google Scholar]
- Lipska BK, Deep-Soboslay A, Weickert CS, Hyde TM, Martin CE, Herman MM, et al. Critical factors in gene expression in postmortem human brain: Focus on studies in schizophrenia. Biol Psychiatry. 2006;60:650–658. doi: 10.1016/j.biopsych.2006.06.019. [DOI] [PubMed] [Google Scholar]
- Manceau V, Swenson M, Le Caer JP, Sobel A, Kielkopf CL, Maucuer A. Major phosphorylation of SF1 on adjacent Ser-Pro motifs enhances interaction with U2AF65. FEBS J. 2006;273:577–587. doi: 10.1111/j.1742-4658.2005.05091.x. [DOI] [PMC free article] [PubMed] [Google Scholar]
- Manceau V, Kielkopf CL, Sobel A, Maucuer A. Different requirements of the kinase and UHM domains of KIS for its nuclear localization and binding to splicing factors. J Mol Biol. 2008;381:748–762. doi: 10.1016/j.jmb.2008.06.026. [DOI] [PMC free article] [PubMed] [Google Scholar]
- Maucuer A, Camonis JH, Sobel A. Stathmin interaction with a putative kinase and coiled-coil-forming protein domains. Proc Natl Acad Sci U S A. 1995;92:3100–3104. doi: 10.1073/pnas.92.8.3100. [DOI] [PMC free article] [PubMed] [Google Scholar]
- Maucuer A, Ozon S, Manceau V, Gavet O, Lawler S, Curmi P, et al. KIS is a protein kinase with an RNA recognition motif. J Biol Chem. 1997;272:23151–23156. doi: 10.1074/jbc.272.37.23151. [DOI] [PubMed] [Google Scholar]
- Ng MY, Levinson DF, Faraone SV, Suarez BK, Delisi LE, Arinami T, et al. Meta-analysis of 32 genome-wide linkage studies of schizophrenia. Mol Psychiatry. 2008 doi: 10.1038/mp.2008.135. [DOI] [PMC free article] [PubMed] [Google Scholar]
- Nguyen L, Besson A, Heng JI, Schuurmans C, Teboul L, Parras C, et al. p27kip1 independently promotes neuronal differentiation and migration in the cerebral cortex. Genes Dev. 2006;20:1511–1524. doi: 10.1101/gad.377106. [DOI] [PMC free article] [PubMed] [Google Scholar]
- Puri V, McQuillin A, Choudhury K, Datta S, Pimm J, Thirumalai S, et al. Fine mapping by genetic association implicates the chromosome 1q23.3 gene UHMK1, encoding a serine/threonine protein kinase, as a novel schizophrenia susceptibility gene. Biol Psychiatry. 2007;61:873–879. doi: 10.1016/j.biopsych.2006.06.014. [DOI] [PubMed] [Google Scholar]
- Puri V, McQuillin A, Datta S, Choudhury K, Pimm J, Thirumalai S, et al. Confirmation of the genetic association between the U2AF homology motif (UHM) kinase 1 (UHMK1) gene and schizophrenia on chromosome 1q23.3. Eur J Hum Genet. 2008;16:1275–1282. doi: 10.1038/ejhg.2008.76. [DOI] [PubMed] [Google Scholar]
- Sei Y, Ren-Patterson R, Li Z, Tunbridge EM, Egan MF, Kolachana BS, et al. Neuregulin1-induced cell migration is impaired in schizophrenia: association with neuregulin1 and catechol-o-methyltransferase gene polymorphisms. Mol Psychiatry. 2007;12:946–957. doi: 10.1038/sj.mp.4001994. [DOI] [PubMed] [Google Scholar]
- Vandesompele J, De Preter K, Pattyn F, Poppe B, Van Roy N, De Paepe A, et al. Accurate normalization of real-time quantitative RT-PCR data by geometric averaging of multiple internal control genes. Genome Biol. 2002;3:research0034.1–research0034.11. doi: 10.1186/gb-2002-3-7-research0034. [DOI] [PMC free article] [PubMed] [Google Scholar]
- Yamaguchi M, Yamauchi A, Nishimura M, Ueda N, Naito S. Soybean oil fat emulsion prevents cytochrome P450 mRNA down-regulation induced by fat-free overdose total parenteral nutrition in infant rats. Biol Pharm Bull. 2005;28:143–147. doi: 10.1248/bpb.28.143. [DOI] [PubMed] [Google Scholar]
- Yoshikawa M, Oka T, Kawaguchi M, Hashimoto A. MK-801 upregulates the expression of d-amino acid oxidase mRNA in rat brain. Brain Res Mol Brain Res. 2004;131:141–144. doi: 10.1016/j.molbrainres.2004.08.017. [DOI] [PubMed] [Google Scholar]