

Abstract
Lifelong treatment of phenylketonuria (PKU) includes a phenylalanine (phe) restricted diet that provides sufficient phe for growth and maintenance plus phe-free amino acid formula to meet requirements for protein, energy and micronutrients. Phe tolerance (mg phe/kg body weight/day) is the amount of phe those with PKU can consume and maintain acceptable blood phe levels; it requires individual assessment because of varying phenylalanine hydroxylase activity. The objective was to reassess phe tolerance in 8 adults with PKU considering phe requirements, blood phe levels, genotype and phe tolerance at 5 years of age. Subjects had not received a personalized assessment of phe tolerance in several years, and 5 subjects were overweight, body mass index (BMI) 25–28. With the guidance of a metabolic dietitian, 7 subjects increased phe tolerance (by 15–173%) without significantly increasing blood phe concentration. Increased phe tolerance was associated with both improved dietary compliance and inadequate phe intake at the onset of the protocol compared with current requirements. Improved dietary compliance reflected increased consumption of protein equivalents from amino acid formula and increased frequency of formula intake, from 2.2 to 3 times per day. Predictors of higher final phe tolerance following reassessment included being male and having a lower BMI (R2=0.588). This suggests that the rising trend of overweight and obesity may affect assessment of phe tolerance in adults. Therefore, interaction with the metabolic dietitian to reassess phe tolerance in relation to body mass is essential throughout adulthood to insure adequate intake of phe to support protein synthesis and prevent catabolism.
Keywords: PKU, amino acid requirements, genotype-phenotype relationship, low-phenylalanine diet
1. INTRODUCTION
Phenylketonuira (PKU), the most common inborn error of amino acid (AA) metabolism, is caused by mutations in phenylalanine hydroxylase (PAH; EC 1.14.16.1), which is required to convert phenylalanine (phe) to tyrosine. For infants with PKU fed a normal diet, phe accumulates in blood and can cross the blood brain barrier, causing irreversible cognitive impairment [1]. The PKU diet, which prevents cognitive impairment and is recommended throughout the life span [2], has two main principles: 1) intake of sufficient phe to promote growth and protein turnover without increasing phe in blood and 2) consumption of an AA formula that does not contain phe and provides the majority of protein needs. The amount of phe consumed varies from individual to individual based on their metabolic phenotype or ability to maintain blood phe levels within an acceptable range [3]. Metabolic phenotype is also referred to as an individual’s phe tolerance; which is expressed as mg phe/kg body weight/day in order to compare to standards for nutritional adequacy [4, 5]. Clinical determination of tolerance relies on frequent assessment of blood phe concentrations in relation to phe intake from food records to establish an individual’s dietary phe prescription in mg phe per day [6–9].
Over 500 mutations of the PAH gene have been identified with causing PKU [10] and most individuals with PKU are compound heterozygotes. Numerous studies have reported a relationship between genotype and phenotype; however, given the complexity of the PKU phenotype [11] not all mutations follow the expected outcome [1, 12–14]. Based on the metabolic phenotype and genotype relationships observed in 184 subjects at 5 years of age, Guldberg et al. [15] devised a classification system to determine an expected phenotype for 105 mutations. This classification system has been used to predict a genotype-phenotype relationship in infants and young children [2, 16–20] however, the relationship between genotype and an adult’s metabolic phenotype has not been reported.
Many adolescence and adults with PKU are noncompliant with the PKU diet [21–23], despite the known benefit of lifelong adherence [2, 7]. Those adults with PKU who continue to consume a low-phe diet often do so without regular follow up to a metabolic clinic, and they assume their total daily allowance of phe is unchanged. However, from adolescence to adulthood phe tolerance may change as individuals gain body mass with changes in body composition. Thus, what individuals with PKU consider as their phe allowance may be insufficient to meet needs.
Reassessment of phe tolerance is becoming increasingly important as individual phe tolerance can improve with tetrahydrobiopterin treatment and future advances with phenylalanine ammonia-lyase treatment [24–27]. Assessment of phe tolerance by van Spronsen et al. [28] found that an individual’s phe tolerance at age 2 predicts tolerance at age 10; however, the correlation of childhood phe tolerance to adult phe tolerance has not been reported. The objective of the current study was to reassess phe tolerance in adults with PKU considering phe requirements, blood phe levels, genotype and phe tolerance at 5 years of age.
2. MATERIALS AND METHODS
2.1 Subjects
Eight adults with PKU (4 males, 4 females; mean age 27 y, range 20 y- 31 y) followed by the Waisman Center, Biochemical Genetics Program, University of Wisconsin-Madison were recruited for a 6-day inpatient metabolic study at the Clinical and Translational Research Core (CTRC), University of Wisconsin Hospital and Clinics [29]. In order to achieve stable blood phe levels prior to admission, the phe tolerance for each subject was established. All subjects were diagnosed with classical PKU in infancy, based on phe concentrations of ≥1200 μmol/L before initiation of dietary treatment. At study initiation, all subjects were following a low phe diet and consuming phe free AA formula(s). One subject had discontinued the PKU diet for a period of 10 years as an adolescent and experienced various complications [30]. All other subjects had followed a PKU diet throughout childhood and adulthood, although a thorough assessment of their phe tolerance had not been completed in 2–18 years. Of the 8 subjects, 5 were overweight based on a body mass index (BMI) of 25–28 [4]; ideal body weight (IBW) was calculated for these subjects [31]. Prior to initiation of this study, the University of Wisconsin-Madison Health Sciences Institutional Review Board approved all project protocols and informed consent was obtained.
2.2 Dietary Evaluation and Phe Tolerance
Initial phe tolerance was determined using 3-day food records completed by each subject and a blood phe concentration measured on the last day of the food record. Food records were analyzed by the Food Processor® computer program (ESHA Research; Salem, OR, version 8.7), supplemented with information from the Low Protein Food List [32] and Nutrient Database for Standard Reference [33]. Blood spots were collected on filter paper and analyzed by tandem mass spectroscopy [34].
With the guidance of the metabolic dietitian, each subject changed his/her dietary phe intake, completed a 3-day food record and collected a blood spot for determination of phe concentration. If the blood phe concentration remained within an agreed-upon acceptable range, phe intake was increased until blood phe concentration exceeded the acceptable range. For some subjects, menus and/or food was provided to aid in the accurate determination of phe tolerance. A subset of two females (subjects 7 and 10) were followed more intensively. They provided daily food records and obtained blood phe concentrations every other day. The subset followed a systematic protocol in which dietary phe intake was stable for 10–14 days followed by a 10–25% increase in phe for 10–14 days.
All subjects continued the dietary protocol for 2–4 months prior to admission to the CTRC. Final phe tolerance was based on an average of three days of pre-weighed food that was provided to each subject and consumed just before admission to the CTRC. Provision of foods to each subject provided for controlled intake of phe, energy, and protein.
Phe tolerance at 5 years of age was determined utilizing body weight, dietary phe intake based on food records, and two blood phe concentrations recorded in the medical record within 3 months after each subjects’ fifth birthday. Blood phe levels indicated that subjects showed acceptable control of PKU in accordance with phe tolerance. The mean blood phe concentration for the 8 subjects at 5 years of age was 343 ± 157 μmol phe/L.
2.3 Mutation analysis and classification
Mutation analysis for each subject was conducted at the Texas Department of State Health Services Lab. The exons and splice junctions, which harbor approximately 95% of the >500 known mutations in PAH gene, were sequenced using established primers [35]. Following mutation analysis an expected phenotype of classical, moderate or mild PKU was determined for each subject using the classification system designed by Guldberg et al [15], Table 1.
Table 1.
Individual Characteristics of 8 Adult Subjects with PKU
| Childhood tolerance |
Adult tolerance |
||||||
|---|---|---|---|---|---|---|---|
| Subject/Sex | Age | BMIa | Genotype | Expected Phenotypeb | Age 5c | Initial | Final |
| y | kg/m2 | mg phe/kg wt | mg phe/kg wt | mg phe/kg wt | |||
| 1/M | 27 | 24 | R408W IVS12nt1g->a | Classic | 13 (248)d | 6.9 (505) | 15.7 (1149) |
| 2/M | 29 | 23 | R261Q R408W | Moderate | 11.5 (215) | 9.8 (658) | 26.8 (1793) |
| 6/F | 23 | 21 | R408W IVS12nt1g->a | Classic | 9 (151) | 8.1 (423) | 10.8 (550) |
| 7/F | 28 | 25 | L242F R408W | Classic | 14 (241) | 4.7 (304) | 8.5 (545) |
| 8/M | 27 | 26 | R261Q E280K | Moderate | 17 (332) | 10.4 (787) | 12.8 (971) |
| 9/F | 20 | 26 | L48S F299C | Mild | 16 (273) | 4.1 (265) | 4.8 (305) |
| 10/F | 31 | 28 | F299C R408W | Classic | 10.4 (179) | 2.6 (188) | 6.5 (457) |
| 11/M | 28 | 28 | IVS1nt5g->t IVS12nt1g->a | Classic | 14.2 (310) | 9.2 (840) | 7.7 (697) |
| Meane | 27 ± 1 | 25 ± 0.9 | 13.1 ± 1 | 7.0 ± 1.0*† | 11.7 ± 2.5 | ||
Body mass index, BMI
Expected phenotype based on individual mutations as described in Guldberg et al [15].
Childhood tolerance at age 5 based on a chart review of clinic records. All subjects were in good phe control based on an average of 2 phe concentrations within 3 months of each subject’s fifth birthday.
mg phe/day shown in parentheses
Values are mean ± SEM
Indicates significantly different from childhood tolerance, two-tailed paired t-test, pairing on subject; P=0.002
Indicates different from final adult tolerance; two-tailed paired t-test, pairing on subject; P=0.055
2.4 Statistical Analysis
All statistical analysis was conducted with the statistical program R for Mac OS X version 2.9 (R Project for Statistical Computing, Wirtschaftsuniversität, Vienna, Austria; http://www.r-project.org). Primary analyses were performed using two-tailed paired t-tests, pairing on subject. Changes in blood phe concentration and dietary parameters were compared with respect to increasing phe tolerance. Individual phe tolerance was compared at age 5, at the start of the study (initial), and after completing the dietary protocol to assess phe tolerance (final). Comparisons were considered statistically significant at P≤0.05. The “leaps” procedure was used for finding the best subset based on model size for the dependent variables of final phe tolerance and change in phe tolerance due to reassessment. Independent variables included: sex, BMI, genotype, protein intake from food, protein intake from formula, frequency of formula intake, blood phe levels, and phe tolerance. Following subset analysis, multiple regression was then conducted on the best model for each dependent variable based on R2 values. Linear regression was used to examine the effect of genotype on phe tolerance at age 5 and adulthood, as well as the relationship between phe tolerance at age 5 and adulthood.
3. RESULTS
3.1. Reassessment of Adult Phe Tolerance
All 8 adult subjects were compound heterozygotes and two siblings had the same genotype, Table 1. Each subject worked with a metabolic dietitian to stabilize blood phe levels and determine dietary phe tolerance (expressed as mg phe/kg body weight/day). Over the course of 2–4 months there was an increase in mean dietary phe intake (Figure 1A, p=0.055) without a significant increase in blood phe concentrations (Figure 1B, p=0.36). Following the dietary protocol to reassess phe tolerance, 3 subjects increased their phe tolerance by 15–33% (+39 to +184 mg phe/day) while 4 subjects increased 79–173% (+241 to +1135 mg phe/day). Analysis of predictors for final phe tolerance showed that an individual’s sex and BMI had a good predictive capacity and, although it was not the only possible model, being male and having a lower BMI, consistent with a lower fat mass, were more predictive of a higher phe tolerance (R2=0.588, p=0.047) than genotype alone (R2=0.391, p=0.125).
Figure 1. Following reassessment of phe tolerance subjects significantly increased their dietary phe intake without significantly increasing blood phe concentrations.

A: Dietary phe intakes at initial and final time points. Line represents adult phe requirement of 9.1 mg/kg/day as determined by direct amino acid oxidation [41]. Subjects increased dietary phe intake, P=0.055, two tailed paired t-test, pairing on subject. B: Effect of blood phe concentration in response to increased dietary intake. Although there was a significant increase in dietary phe intake there was not a significant change in blood phe concentration; P=0.36, two tailed paired t-test, pairing on subject.
Individual subjects showed a range of blood phe concentrations in response to increases in phe intake, Figure 2. Only one subject decreased his phe intake (Subject 11) and he did so because his initial blood phe levels were well outside the recommended range [7] and he wanted to improve his metabolic control. His blood phe concentration decreased 24% with a 16% decrease in dietary phe intake.
Figure 2. Range of blood phe concentrations during reassessment of phe tolerance.
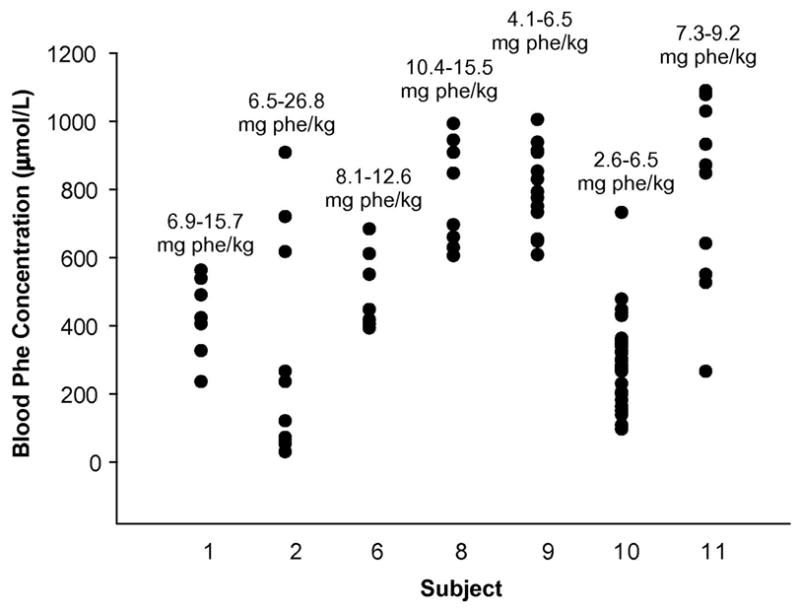
The ranges of phe intakes (mg phe/kg body weight) and blood phe concentrations during the dietary protocol are shown for each subject. Phe concentrations and intakes for Subject 7 are shown in Figure 3.
Mean phe tolerance at initial adult assessment was significantly lower than tolerance at age 5. A comparison of final phe tolerance with phe tolerance at age 5 showed that 3 subjects increased their tolerance and 5 decreased their tolerance. The 3 subjects (2 male and a female) who showed an increase in phe tolerance from age 5 to adulthood may not have been receiving the minimum phe allowance for children (14 mg phe/kg/day), which has been determined recently by indicator AA oxidation [36]. The 5 subjects (3 female, 2 male) who showed a significant 30–75% decrease in phe tolerance from age 5 to adulthood (P=0.009) were overweight during the study.
Two subjects (subjects 7 and 10) recorded daily food intake and monitored phe concentration every other day to provide more extensive data on the relationship of phe intake to blood phe concentration. The time course of blood phe concentrations with increased dietary phe intake for subject 7 is shown in Figure 3. Her last assessment of phe tolerance at age 11 indicated a tolerance of 8.3 mg phe/kg and since that time she had been restricting her diet to 270 mg phe/day. At the start of our study she was 28 years old and following a diet that provided 4.7 mg phe/kg, an intake well below the current minimum requirement of 9.1 mg phe/kg body weight as determined in adults without PKU [37]. As subject 7 increased phe intake according to the dietary protocol, her blood phe levels fell below 61μmol/L until phe tolerance was established at 8.5 mg phe/kg (540 mg phe/day, 10.6 mg phe/kg IBW), at which point phe concentrations increased. The results of the dietary protocol to increase phe intake and mean phe consumption based on analyzed food records for subject 7 is shown in Figure 3. During the dietary protocol phe consumption was 4.3% greater than prescribed (n= 83 food records, SD = 25%) indicating adequate adherence to the diet overall with a high day-to-day variation in phe intake.
Figure 3. Pattern of blood phe concentrations in Subject 7 with biweekly increases in dietary phe intake.
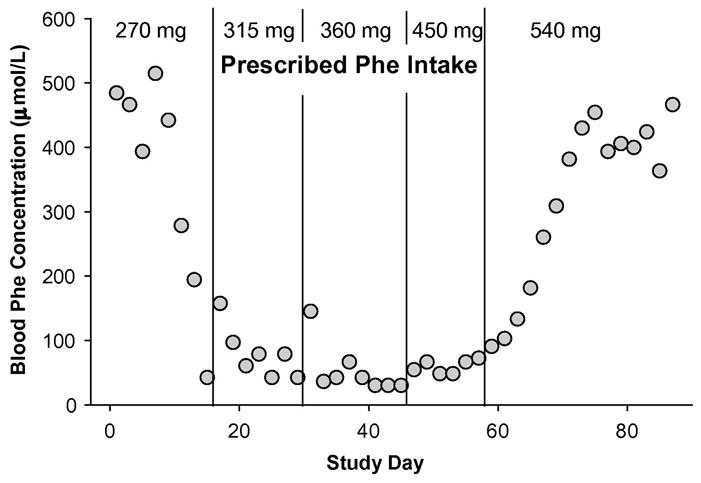
The prescribed phe intake is shown at the top. Agreement between prescribed and analyzed phe intake based on food records was good (4.3% ± 25, n=83): 270 mg prescribed phe, 306 mg ± 43 analyzed phe, n=14; 315 mg prescribed phe, 331 mg ± 54 analyzed phe, n=15; 360 mg prescribed phe, 352 mg ± 98 analyzed phe, n=15; 450 mg prescribed phe, 491 mg ± 155 analyzed phe, n=11; 540 mg prescribed phe, 566 mg ± 103 analyzed phe, n=28. Phe intake values are mean ± SD.
The range of phe concentrations of the second subject to follow this protocol (subject 10) is shown in Figure 2. The pattern of phe concentrations during the protocol to reassess phe tolerance was similar to that of subject 7. At the start of our study Subject 10 was following a diet that provided 2.6 mg phe/kg. An initial drop in phe concentration with increasing phe intake was followed by an increase in blood phe concentrations at an intake of 5.7 mg/kg and a final phe tolerance was established at 6.5 mg/kg (9.2 mg phe/kg ideal body weight). This subject did not want to increase her phe intake further because she did not want to risk a high phe concentration to plan for pregnancy. At the final time point subject 10 had the lowest blood phe concentration among the 8 subjects (188 μmol/L, Figure 1B).
3.2 Improved Dietary Compliance
Increased frequency of AA formula consumption was the best single predictor of the extent to which subjects were able to increase their phe tolerance from the initial to final time point (R2= 0.52, p=0.026). At the start of dietary reassessment only half of the subjects consumed their formula three times a day, 2 consumed formula 2 times a day and 2 subjects consumed formula less then once a day. After 2–4 months of reassessment and interactions with the metabolic dietitian, all subjects were consuming formula three times a day.
The mean proportion of total energy from protein and fat between the initial and final time points of the dietary reassessment of phe tolerance was not significantly different; although, carbohydrate intake was significantly greater, Table 2. At final phe tolerance, mean intake of protein equivalents from formula (p=0.04) and frequency of formula intake (p=0.055) were increased. These factors are consistent with improved dietary compliance in the 8 adult subjects.
Table 2.
Changes in dietary intake before and after a dietary protocol to reassess phe tolerance in adults with PKU
| Initial Phe Tolerancea | Final Phe Toleranceb | P valuec | |
|---|---|---|---|
| Caloric Intake (kcal/kg) | 28 ± 1.4 | 33 ± 2.5 | 0.02 |
| Protein from Food (g/kg) | 0.2 ± 0.04 | 0.3 ± 0.05 | 0.22 |
| Protein Equivalents from Formula (g/kg) | 0.6 ± 0.07 | 0.7 ± 0.06 | 0.04 |
| Total Protein Intake (%kcal) | 12.8 ± 1.0 | 12.6 ± 1.2 | 0.90 |
| Carbohydrate Intake (%kcal) | 54.0 ± 3.1 | 62.2 ± 1.9 | 0.02 |
| Fat Intake (%kcal) | 25.2 ± 2.1 | 24.6 ± 1.8 | 0.71 |
| Dietary Phe Intake (mg/kg) | 7.0 ± 1.0 | 11.7 ± 2.5 | 0.055 |
| Frequency of Formula (times/day) | 2.17 ± 0.4 | 3.00 ± 0 | 0.055 |
All values are mean ± SEM, n=8
Based on 3-day food records.
Based on 3 days of pre-weighed and measured food sent to the subject’s home.
Two-tailed paired t-test, pairing on subject.
3.3 Phe Tolerance and Genotype
Genotype predicted metabolic phenotype at age 5 and adulthood only in the 5 subjects who were classified with classical PKU; i.e., 63% of the study sample of 8 subjects. In comparison, Guldberg et al showed that genotype predicted metabolic phenotype in 79% of cases [15]. Moreover in this small sample of 8 subjects, there was no correlation between phe tolerance at age 5 and final adult phe tolerance (R2=−0.119, p=0.597). The one subject with an expected mild genetic phenotype (Subject 9) had the second highest tolerance at age 5 but the lowest as an adult. Her expected mild phenotype was due to the L48S mutation, which although classified as a mild mutation [15] has been noted to result in a classical phenotype [20].
4. DISCUSSION
The central feature of the PKU diet is the allowance for total daily phe intake which is determined by assessment of phe tolerance. Adult phe tolerance is especially important given evidence that lifelong adherence to a low-phe diet is essential for improved cognitive and health outcomes [2]. However, few studies have assessed phe tolerance in the growing population of adults with PKU treated with a low phe diet since infancy. The allowance for total dietary phe is assumed to stay constant in adults with stable body weight with the exception of increased phe to support tissue accretion during pregnancy [38]. Because PKU is a heterogenous disorder with individuals having variable residual PAH activity, phe tolerance is empirically determined based on the response of individual blood phe concentrations to dietary phe intake. We examined adult phe tolerance in two ways: 1) a historical evaluation of eight adults, comparing their adult phe tolerance with their tolerance at 5 years of age, their individual genotype, and current standards for phe requirements [36, 37] and 2) an in depth dietary protocol to reassess if the phe tolerance these adults had followed for years was appropriate. During the dietary protocol to reassess phe tolerance, all subjects except one, who wanted to reduce his blood phe concentrations, showed an increase in phe tolerance without a significant increase in blood phe concentrations compared with initial adult phe tolerance. Inadequate phe intake or improved dietary compliance may account for the increased phe tolerance in adults noted in this study.
The requirement for phe from the diet is not different for those with PKU than for individuals with normal PAH activity [39]. Thus, phe intake should provide the minimum requirement for phe needed to support protein turnover. Tolerable intake may be greater depending on the individual’s residual PAH activity and therefore conventional determination of phe tolerance is based on individual phe concentrations in relation to reported phe intake [6–9]. One explanation for greater than expected phe tolerance in our adult subjects is that their intake of dietary phe was not adequate to support protein turnover and synthesis for their current body mass. This is illustrated by subjects 7 and 10 who both showed an initial reduction in blood phe concentration with increasing phe intake, consistent with stimulation of protein synthesis, and then with further increases in phe intake blood phe concentrations increased suggesting that sufficient dietary phe was provided to support protein synthesis [1, 36, 37]. Current phe requirements reflect the combination of phe and tyrosine intake and have increased from 14 mg/kg/day to 25–27 mg/kg/day [4, 5]. The requirement for phe alone is difficult to interpret because of the wide reported range for conversion of phe to tyrosine in those with normal PAH activity [1, 40, 41]. Therefore, given current phe requirements and variable PAH activity, interpretation to individuals with PKU is difficult and has resulted in a wide range of recommendations for total daily phe intake [9].
Measurement of phe flux and oxidation with L-[1-13C]phe in the presence of excess tyrosine demonstrates that the mean phe requirement is 9.1 mg/kg/day with 95% confidence limits of 4.6–13.6 mg phe/kg/day in adults without PKU [37]. According to this direct and sensitive method, only three of our eight subjects (2 with moderate and 1 with classical PKU) were meeting the phe requirement at the initial time point of our study. After the dietary protocol to reassess phe tolerance, half were approaching the requirement and the other half were well above. The 4 subjects who consumed less than 9.1 mg phe/kg, were all overweight based on a BMI of 25–28 [4]. Amino acid requirements are based on individuals at a healthy weight. Therefore, a lower proportion of body weight as fat free mass (FFM) in adults with PKU who are overweight may account for a phe tolerance of less than 9.1 mg phe/kg body weight. In support of lower FFM and greater fat mass reducing the expression of phe tolerance, determination of final phe tolerance using IBW rather than actual body weight [31] showed that three of the four subjects with BMI of 25–28 now met or exceeded the minimum adult requirement of 9.1 mg phe/kg IBW. These data suggest that 9.1 mg phe/kg/day is a suitable reference for the minimum phe requirement in adults with PKU who are at IBW [37].
Although studies have shown no difference in energy expenditure or FFM in children with PKU [42, 43], this has never been examined in adults. Sex differentially affects the deposition of fat and muscle during puberty resulting in greater gains of FFM in males [44]. In fact, in our study being male and having a lower BMI were significant predictors of higher final phe tolerance. Compliance with the low-phe diet, especially consumption of natural protein and intake of AA formula three times a day, predicts the proportion of FFM in children [42]. Thus, efforts to increase and maintain FFM and avoid accumulation of excess body fat through dietary compliance and monitoring are likely to increase phe tolerance during adulthood.
Throughout the dietary protocol, subjects had extensive contact with a metabolic dietitian, which helped improve their ability to increase their dietary phe intake without increasing blood phe concentrations. Most importantly the metabolic dietitian acted as a resource to re-educate the subjects on some aspects of the diet, such as use of a gram scale, phe content of new food items, and the importance of consuming AA formula and distributing it throughout the day [45, 46]. At the start of the study, only half of the 8 subjects consumed the required amount of formula or distributed it throughout the day. With the support and guidance of a metabolic dietitian, all were able to consume their full formula prescription in 3 divided doses, which was associated with an increase in phe tolerance. The metabolic dietitian was particularly important as some of the subjects increased their phe tolerance well above what they thought was possible, and needed assistance to choose higher phe foods. Such dietary counseling has also become important for individuals with PKU who have responded to tetrahydrobiopterin therapy [26]. Maintaining or reestablishing an on-going relationship with a dietitian can help reeducate clients about the diet and provide weight management counseling, when necessary. Overall, ongoing interactions with the metabolic dietitian improved dietary compliance and metabolic control, and could potentially enhance long-term health for adults with PKU.
The ability to predict lifelong phe tolerance based on tolerance as a child is of clinical interest for the treatment of PKU. A recent study of 213 subjects with PKU found tolerance at age 10 could be predicted by tolerance at as early as age 2, but not tolerance as an infant [28]. Changes in phe tolerance during and after adolescence have not been reported. In our 8 adult subjects, phe tolerance at age 5 did not correlate with adult phe tolerance; a larger sample size is needed to further address this relationship. These findings support the need to reassess phe tolerance in individuals with PKU following critical times of development and changes in body mass.
5. CONCLUSION
Lifelong compliance with the restrictive PKU diet is a challenge and there is a need for comprehensive guidelines and new management approaches to engage the adult PKU population and improve their long-term health [47]. New advances in the treatment of PKU [24, 25, 27] and new dietary options such as glycomacropeptide [29] have made reassessment of phe tolerance with a metabolic dietitian even more important. As individuals with PKU age, it is essential to reassess his/her phe intake and tolerance in relation to individual body weight and current sensitive measures of phe requirements (9.1 mg phe/kg ideal body weight/day) to insure adequate intake of phe to support protein synthesis and prevent catabolism. In addition, the overall assessment of phe tolerance may be affected by BMI and change when individuals become overweight. Periodic reassessment of phe tolerance with input from a metabolic dietitian may ultimately improve lifelong adherence to the PKU diet and overall health. Further research on the growing population of adults with PKU is necessary to provide evidence-based guidelines to optimize lifelong treatment of PKU.
Acknowledgments
This research was supported by NIH grants R03-DK-071534 and P30-HD-03352. The authors would like to thank Dr. Murray Clayton for guidance with statistical analysis; Dr. Gregory Rice and Lisa Bingen, MS, RD for reviewing the manuscript; and all of the subjects with PKU who participated in the study.
List of abbreviations
- PKU
phenylketonuria
- PAH
phenylalanine hydroxylase
- AA
amino acid
- phe
phenylalanine
- BMI
body mass index
- IBW
ideal body weight
- FFM
fat free mass
- CTRC
Clinical and Translational Research Core
References
- 1.Donlon J, Levy H, Scriver C. Chapter 77: Hyperphenylalaninemia: Phenylalanine Hydroxylase Deficiency. In: Scriver C, Beaudet A, Sly W, Valle D, editors. Metabolic and Molecular Basis of Inherited Disease. McGraw-Hill; 2007. [Google Scholar]
- 2.Koch R, Burton B, Hoganson G, Peterson R, Rhead W, Rouse B, Scott R, Wolff J, Stern AM, Guttler F, Nelson M, de la Cruz F, Coldwell J, Erbe R, Geraghty MT, Shear C, Thomas J, Azen C. Phenylketonuria in adulthood: a collaborative study. J Inherit Metab Dis. 2002;25:333–46. doi: 10.1023/a:1020158631102. [DOI] [PubMed] [Google Scholar]
- 3.Guttler F, Guldberg P. The influence of mutations of enzyme activity and phenylalanine tolerance in phenylalanine hydroxylase deficiency. Eur J Pediatr. 1996;155(Suppl 1):S6–10. doi: 10.1007/pl00014253. [DOI] [PubMed] [Google Scholar]
- 4.IOM, Dietary Reference Intakes for Energy. Carbohydrates, Fiber, Fat, Protein and Amino Acids (Macronutrients) Washington, D.C.: 2002. [Google Scholar]
- 5.WHO. Protein and amino acid requirements in human nutrition. Geneva: 2007. [PubMed] [Google Scholar]
- 6.Cleary M, Walter JH. Assessment of adult phenylketonuria. Ann Clin Biochem. 2001;38:450–8. doi: 10.1177/000456320103800502. [DOI] [PubMed] [Google Scholar]
- 7.NIH. Phenylketonuria (PKU): screening and management, NIH Consensus Statement. 2000;17:1–33. [PubMed] [Google Scholar]
- 8.Smith I. Recommendations on the dietary management of phenylketonuria. Report of Medical Research Council Working Party on Phenylketonuria. Arch Dis Child. 1993;68:426–7. doi: 10.1136/adc.68.3.426. [DOI] [PMC free article] [PubMed] [Google Scholar]
- 9.Acosta P, Yannicelli S Protocol 1- Phenylketonuria (PKU) The Ross Metabolic Formula System Nutrition Support Protocols. 4. Ross Products Division/Abbot Laboratories; Columbus: 2001. [Google Scholar]
- 10.Scriver CR, Hurtubise M, Prevost L, Phommarinh M, Konecki D, Erlandsen H, Stevens RC, WPJ, Ryan S, McDonald D, Sarkissian C. A PAH gene knowledge base: content, informatics, utilization. Heilbronn; Germany: 2006. [Google Scholar]
- 11.Scriver CR, Waters PJ. Monogenic traits are not simple: lessons from phenylketonuria. Trends Genet. 1999;15:267–72. doi: 10.1016/s0168-9525(99)01761-8. [DOI] [PubMed] [Google Scholar]
- 12.Kayaalp E, Treacy E, Waters PJ, Byck S, Nowacki P, Scriver CR. Human phenylalanine hydroxylase mutations and hyperphenylalaninemia phenotypes: a metanalysis of genotype-phenotype correlations. Am J Hum Genet. 1997;61:1309–17. doi: 10.1086/301638. [DOI] [PMC free article] [PubMed] [Google Scholar]
- 13.Scriver CR. The PAH gene, phenylketonuria, and a paradigm shift. Hum Mutat. 2007;28:831–45. doi: 10.1002/humu.20526. [DOI] [PubMed] [Google Scholar]
- 14.Sarkissian CN, Gamez A, Scriver CR. What we know that could influence future treatment of phenylketonuria. J Inherit Metab Dis. 2009;32:3–9. doi: 10.1007/s10545-008-0917-7. [DOI] [PubMed] [Google Scholar]
- 15.Guldberg P, Rey F, Zschocke J, Romano V, Francois B, Michiels L, Ullrich K, Hoffmann GF, Burgard P, Schmidt H, Meli C, Riva E, Dianzani I, Ponzone A, Rey J, Guttler F. A European multicenter study of phenylalanine hydroxylase deficiency: classification of 105 mutations and a general system for genotype-based prediction of metabolic phenotype. Am J Hum Genet. 1998;63:71–9. doi: 10.1086/301920. [DOI] [PMC free article] [PubMed] [Google Scholar]
- 16.Guttler F, Azen C, Guldberg P, Romstad A, Hanley WB, Levy HL, Matalon R, Rouse BM, Trefz F, de la Cruz F, Koch R. Relationship among genotype, biochemical phenotype, and cognitive performance in females with phenylalanine hydroxylase deficiency: report from the Maternal Phenylketonuria Collaborative Study. Pediatrics. 1999;104:258–62. doi: 10.1542/peds.104.2.258. [DOI] [PubMed] [Google Scholar]
- 17.Jennings IG, Cotton RG, Kobe B. Structural interpretation of mutations in phenylalanine hydroxylase protein aids in identifying genotype-phenotype correlations in phenylketonuria. Eur J Hum Genet. 2000;8:683–96. doi: 10.1038/sj.ejhg.5200518. [DOI] [PubMed] [Google Scholar]
- 18.Kasnauskiene J, Cimbalistiene L, Kucinskas V. Validation of PAH genotype-based predictions of metabolic phenylalanine hydroxylase deficiency phenotype: investigation of PKU/MHP patients from Lithuania. Med Sci Monit. 2003;9:CR142–6. [PubMed] [Google Scholar]
- 19.Bercovich D, Elimelech A, Zlotogora J, Korem S, Yardeni T, Gal N, Goldstein N, Vilensky B, Segev R, Avraham S, Loewenthal R, Schwartz G, Anikster Y. Genotype-phenotype correlations analysis of mutations in the phenylalanine hydroxylase (PAH) gene. J Hum Genet. 2008;53:407–18. doi: 10.1007/s10038-008-0264-4. [DOI] [PubMed] [Google Scholar]
- 20.Stojiljkovic M, Jovanovic J, Djordjevic M, Grkovic S, Cvorkov Drazic M, Petrucev B, Tosic N, Karan Djurasevic T, Stojanov L, Pavlovic S. Molecular and phenotypic characteristics of patients with phenylketonuria in Serbia and Montenegro. Clin Genet. 2006;70:151–5. doi: 10.1111/j.1399-0004.2006.00650.x. [DOI] [PubMed] [Google Scholar]
- 21.Brenton DP, Tarn AC, Cabrera-Abreu JC, Lilburn M. Phenylketonuria: treatment in adolescence and adult life. Eur J Pediatr. 1996;155(Suppl 1):S93–6. doi: 10.1007/pl00014261. [DOI] [PubMed] [Google Scholar]
- 22.Koch R, Azen C, Friedman EG, Fishler K, Baumann-Frischling C, Lin T. Care of the adult with phenylketonuria. Eur J Pediatr. 1996;155(Suppl 1):S90–2. doi: 10.1007/pl00014260. [DOI] [PubMed] [Google Scholar]
- 23.van Spronsen FJ, Ahring KK, Gizewska M. PKU-what is daily practice in various centres in Europe? Data from a questionnaire by the scientific advisory committee of the European Society of Phenylketonuria and Allied Disorders. J Inherit Metab Dis. 2009;32:58–64. doi: 10.1007/s10545-008-0966-y. [DOI] [PubMed] [Google Scholar]
- 24.Burlina A, Blau N. Effect of BH(4) supplementation on phenylalanine tolerance. J Inherit Metab Dis. 2009;32:40–5. doi: 10.1007/s10545-008-0947-1. [DOI] [PubMed] [Google Scholar]
- 25.Sarkissian CN, Gamez A, Wang L, Charbonneau M, Fitzpatrick P, Lemontt JF, Zhao B, Vellard M, Bell SM, Henschell C, Lambert A, Tsuruda L, Stevens RC, Scriver CR. Preclinical evaluation of multiple species of PEGylated recombinant phenylalanine ammonia lyase for the treatment of phenylketonuria. Proc Natl Acad Sci U S A. 2008;105:20894–9. doi: 10.1073/pnas.0808421105. [DOI] [PMC free article] [PubMed] [Google Scholar]
- 26.Singh R, Jurecki E, Rohr F. Recommendations for Personalized Dietary Adjustments Based on Patient Response to Tetrahydrobiopterin (BH4) in Phenylketonuria. Topics in Clinical Nutrition. 2008;23:149–157. [Google Scholar]
- 27.Blau N, Belanger-Quintana A, Demirkol M, Feillet F, Giovannini M, MacDonald A, Trefz FK, van Spronsen FJ. Optimizing the use of sapropterin (BH(4)) in the management of phenylketonuria. Mol Genet Metab. 2009;96:158–63. doi: 10.1016/j.ymgme.2009.01.002. [DOI] [PubMed] [Google Scholar]
- 28.van Spronsen FJ, van Rijn M, Dorgelo B, Hoeksma M, Bosch AM, Mulder MF, de Klerk JB, de Koning T, Rubio-Gozalbo ME, de Vries M, Verkerk PH. Phenylalanine tolerance can already reliably be assessed at the age of 2 years in patients with PKU. J Inherit Metab Dis. 2009;32:27–31. doi: 10.1007/s10545-008-0937-3. [DOI] [PubMed] [Google Scholar]
- 29.Van Calcar SC, Macleod EL, Gleason ST, Etzel MR, Clayton MK, Wolff JA, Ney DM. Improved nutritional management of phenylketonuria by using a diet containing glycomacropeptide compared with amino acids. Am J Clin Nutr. 2009;89:1068–1077. doi: 10.3945/ajcn.2008.27280. [DOI] [PMC free article] [PubMed] [Google Scholar]
- 30.Ney DM, Gleason ST, van Calcar SC, Macleod EL, Nelson KL, Etzel MR, Rice GM, Wolff JA. Nutritional management of PKU with glycomacropeptide from cheese whey. J Inherit Metab Dis. 2009;32:32–39. doi: 10.1007/s10545-008-0952-4. [DOI] [PMC free article] [PubMed] [Google Scholar]
- 31.Pai MP, Paloucek FP. The origin of the “ideal” body weight equations. Ann Pharmacother. 2000;34:1066–9. doi: 10.1345/aph.19381. [DOI] [PubMed] [Google Scholar]
- 32.Schuett V. Low protein food list for PKU. Vol. 2. Seattle, WA: 2002. [Google Scholar]
- 33.A.R.S. U.S. Department of Agriculture. USDA Nutrient Database for Standard Reference, Release. 2005;18 [Google Scholar]
- 34.Rashed MS, Ozand PT, Bucknall MP, Little D. Diagnosis of inborn errors of metabolism from blood spots by acylcarnitines and amino acids profiling using automated electrospray tandem mass spectrometry. Pediatr Res. 1995;38:324–31. doi: 10.1203/00006450-199509000-00009. [DOI] [PubMed] [Google Scholar]
- 35.Guldberg P, Romano V, Ceratto N, Bosco P, Ciuna M, Indelicato A, Mollica F, Meli C, Giovannini M, Riva E, et al. Mutational spectrum of phenylalanine hydroxylase deficiency in Sicily: implications for diagnosis of hyperphenylalaninemia in southern Europe. Hum Mol Genet. 1993;2:1703–7. doi: 10.1093/hmg/2.10.1703. [DOI] [PubMed] [Google Scholar]
- 36.Courtney-Martin G, Bross R, Raffi M, Clarke JT, Ball RO, Pencharz PB. Phenylalanine requirement in children with classical PKU determined by indicator amino acid oxidation. Am J Physiol Endocrinol Metab. 2002;283:E1249–56. doi: 10.1152/ajpendo.0319.2001. [DOI] [PubMed] [Google Scholar]
- 37.Zello GA, Pencharz PB, Ball RO. Phenylalanine flux, oxidation, and conversion to tyrosine in humans studied with L-[1–13C]phenylalanine. Am J Physiol. 1990;259:E835–43. doi: 10.1152/ajpendo.1990.259.6.E835. [DOI] [PubMed] [Google Scholar]
- 38.Acosta PB, Matalon K, Castiglioni L, Rohr FJ, Wenz E, Austin V, Azen C. Intake of major nutrients by women in the Maternal Phenylketonuria (MPKU) Study and effects on plasma phenylalanine concentrations. Am J Clin Nutr. 2001;73:792–6. doi: 10.1093/ajcn/73.4.792. [DOI] [PubMed] [Google Scholar]
- 39.Kindt E, Halvorsen S. The need of essential amino acids in children. An evaluation based on the intake of phenylalanine, tyrosine, leucine, isoleucine, and valine in children with phenylketonuria, tyrosine amino transferase defect, and maple syrup urine disease. Am J Clin Nutr. 1980;33:279–86. doi: 10.1093/ajcn/33.2.279. [DOI] [PubMed] [Google Scholar]
- 40.Kaufman S. A model of human phenylalanine metabolism in normal subjects and in phenylketonuric patients. Proc Natl Acad Sci U S A. 1999;96:3160–4. doi: 10.1073/pnas.96.6.3160. [DOI] [PMC free article] [PubMed] [Google Scholar]
- 41.Bross R, Ball RO, Clarke JT, Pencharz PB. Tyrosine requirements in children with classical PKU determined by indicator amino acid oxidation. Am J Physiol Endocrinol Metab. 2000;278:E195–201. doi: 10.1152/ajpendo.2000.278.2.E195. [DOI] [PubMed] [Google Scholar]
- 42.Huemer M, Huemer C, Moslinger D, Huter D, Stockler-Ipsiroglu S. Growth and body composition in children with classical phenylketonuria: results in 34 patients and review of the literature. J Inherit Metab Dis. 2007;30:694–9. doi: 10.1007/s10545-007-0549-3. [DOI] [PubMed] [Google Scholar]
- 43.Allen JR, McCauley JC, Waters DL, O’Connor J, Roberts DC, Gaskin KJ. Resting energy expenditure in children with phenylketonuria. Am J Clin Nutr. 1995;62:797–801. doi: 10.1093/ajcn/62.4.797. [DOI] [PubMed] [Google Scholar]
- 44.Wells JC. Lessons from Body Composition Analysis. In: Russell BABaRM., editor. Present Knowledge in Nutrition. International Life Sciences Institute; Washington, DC: 2006. pp. 23–33. [Google Scholar]
- 45.MacDonald A, Rylance G, Davies P, Asplin D, Hall SK, Booth IW. Administration of protein substitute and quality of control in phenylketonuria: a randomized study. J Inherit Metab Dis. 2003;26:319–26. doi: 10.1023/a:1025186217369. [DOI] [PubMed] [Google Scholar]
- 46.Crone MR, van Spronsen FJ, Oudshoorn K, Bekhof J, van Rijn G, Verkerk PH. Behavioural factors related to metabolic control in patients with phenylketonuria. J Inherit Metab Dis. 2005;28:627–37. doi: 10.1007/s10545-005-0014-0. [DOI] [PubMed] [Google Scholar]
- 47.van Spronsen FJ, Burgard P. The truth of treating patients with phenylketonuria after childhood: the need for a new guideline. J Inherit Metab Dis. 2008;31:673–9. doi: 10.1007/s10545-008-0918-6. [DOI] [PubMed] [Google Scholar]