

Abstract
The goal of this study was to quantify the micromechanics of the cement-bone interface under tensile fatigue loading using finite element analysis (FEA) and to understand the underlying mechanisms that play a role in the fatigue behavior of this interface. Laboratory cement-bone specimens were subjected to a tensile fatigue load, while local displacements and crack growth on the specimen's surface were monitored. FEA models were created from these specimens based upon micro-computed tomography data. To accurately model interfacial gaps at the interface between the bone and cement, a custom-written erosion algorithm was applied to the bone model. A fatigue load was simulated in the FEA models while monitoring the local displacements and crack propagation. The results showed the FEA models were able to capture the general experimental creep damage behavior and creep stages of the interface. Consistent with the experiments, the majority of the deformation took place at the contact interface. Additionally, the FEA models predicted fatigue crack patterns similar to experimental findings. Experimental surface cracks correlated moderately with FEA surface cracks (r2=0.43), but did not correlate with the simulated crack volume fraction (r2=0.06). Although there was no relationship between experimental surface cracks and experimental creep damage displacement (r2=0.07), there was a strong relationship between the FEA crack volume fraction and the FEA creep damage displacement (r2=0.76). This study shows the additional value of FEA of the cement-bone interface relative to experimental studies and can therefore be used to optimize its mechanical properties.
Keywords: bone, bone cement, interface, finite element, damage
INTRODUCTION
The most common cause of failure in cemented total hip arthroplasty (THA) is aseptic loosening of the hip reconstruction (Huiskes, 1993). Aseptic loosening is initiated by failure of the implant-cement interface (Verdonschot and Huiskes, 1996), the bulk cement mantle (Jasty et al., 1991) or the cement-bone interface (Gardiner and Hozack, 1994; Jasty et al., 1991), although early loosening of a femoral implant may be concentrated in the interdigitated area of the cement-bone interface (Race et al., 2003).
The cement-bone interface is an interlaced structure with great morphological complexity and a highly variable interlock between the cement bulk and the bone. Laboratory studies of the mechanical behavior of the cement-bone interface have focused on static parameters such as interface strength (Bean et al., 1987; Mann et al., 1997). Research on the fatigue response of the cement-bone interface has focused mostly on documenting the overall structural response such as permanent creep damage (Arola et al., 2006; Kim et al., 2004a; Kim et al., 2004b; Stoffel et al., 2008), although recently the shear fatigue response has been studied on a more detailed scale (Mann et al., 2008). The results of the latter study showed that fatigue failure of the interface arose at the contact interface between cement and bone. Fatigue cracks were mainly found in the cement, emanating from the contact interface. Creep damage was not presumed to be manifested as traditional creep, but as gapping and sliding between the cement and the bone at the contact interface.
A limitation of these laboratory experiments is that the mechanism of failure is observational, but cannot be attributed to a particular feature of the material constituents. In addition, only deformation on the outer surface of the test specimen can be examined. Whether this reflects failure inside the specimen is questionable. On the other hand, finite element analysis (FEA) has proven to be a convenient tool to gain more insight into the (micro) mechanics of cemented THA (Lennon et al., 2007; Stolk et al., 2007; Zant et al., 2008). Combining experimental studies of the fatigue damage response of the cement-bone interface with micromechanical finite element analysis (μFEA) models is an approach that could be used to understand the mechanisms of failure of the cement-bone interface. Recently, the static behavior of the cement-bone interface (Mann et al., 2008) has been simulated by means of μFEA models (Janssen et al., 2008; Janssen et al., 2009). In such μFEA models, additional micro-phenomena could potentially be investigated, such as crack formation in the cement mantle (Stolk et al., 2003). Currently, the fatigue failure response of the cement-bone interface has only been simulated on a macro scale (Moreo et al., 2006).
The goal of this study was to quantify the micromechanics of the cement-bone interface under tensile fatigue loading and to determine if the fatigue damage response could be explained using μFEA models that incorporated detailed geometry of the structure and provision for failure of the cement. We put forward three research questions: (1) Can the μFEA models reproduce the creep damage behavior as observed in the experiments in terms of crack patterns and creep displacements?; (2) Does the majority of peak motion of the experimental specimens and of the μFEA models take place at the contact interface?; and (3) Is there a relationship between the length of cracks found on the experimental specimen surfaces and the crack volume fraction in the μFEA models?
METHODS
Experimental protocol
Ten rectangular-prism shaped specimens (~8×8×4mm) containing the cement-bone interface were fabricated from laboratory-prepared, cemented femoral hip replacements, using a previously described method (Mann et al., 2008). Specimens were scanned in a microCT scanner (Scanco Medical AG, Basserdorf, Switzerland) at an isotropic resolution of 12μm. Specimens were placed in a 37° saline bath apparatus of a mechanical test frame (MTS Systems, Eden Prairie, MN). The initial stiffness of the specimens was determined by applying a small tensile load. Next, the static strength of each specimen was estimated based on an established stiffness-strength relationship (Mann et al., 2008). The magnitude of the applied fatigue tensile load was set to 50% of the estimated static tensile strength for each specimen.
Specimens were sinusoidally loaded in tension using an R-ratio of 0.1 at 3Hz for 50,000 load cycles. Local deformations were measured by tracking sampling points on the interface using digital image correlation (DIC) techniques (Mann et al., 2008; Mann et al., 2009) at 10, 100, 1k, 3k, 5k, 33k, and 50k cycles (Figure 1). Stress-displacement plots were determined at each of the seven sampling times and were used to calculate the creep damage displacement (δcd) which served as the primary outcome variable. Here, the creep damage displacement was defined as the permanent deformation at zero applied load. If a specimen reached a global displacement of 72μm before 50k cycles, the test was terminated to prevent complete fracture of the specimen.
Figure 1.
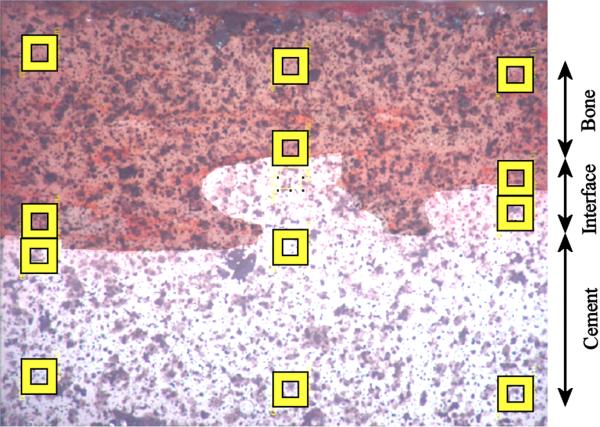
The locations of the DIC measurements consisted of three columns of four sampling points. For each column, two sampling were located in the bone and two in the cement. The local displacements were subsequently averaged to obtain a `global' deformation of the bone, cement and contact interface.
The initial (pre-test) and final microcrack damage present on the four exposed surfaces of the cement and bone was determined using a previously described approach (Mann et al., 2008). Briefly, high resolution (5.8μm) reflected white light and epifluoresence images were obtained after calcein staining of the bone and use of a fluorescing dye penetrant for the cement. Cracks were divided into pre-existing cracks (before loading), growth from preexisting cracks, new cracks and total crack growth (growth from pre-existing and new cracks).
FEA modeling
The FEA models of the specimens comprised two parts: bone and cement. The bone FEA meshes were created from μCT-data using MIMICS 11.0 (Materialise, Leuven, Belgium; Figure 2a). First, the μCT-data was segmented based on the image grayscale, ranging from −1,024 to 3,071 (Figure 2b). Next, the 3D voxel meshes were transformed to triangular surface meshes, using a 6×6×6 voxel interpolation with smoothing, and remeshed to reduce the number of triangles and to remove low quality triangles. The surface meshes were meshed as a tetrahedral 3D solid (Patran 2005r2, MSC Software Corporation, Santa Ana, CA, USA) and mapped back to the μCT-data set (Figure 2c), after which the weighted average of the grayscale was calculated for each solid element using MIMICS.
Figure 2.

a) μCT-data of the cement-bone interface.
b) Segmentation of the μCT-data into bone (1,000 to 3,071) and cavities (−1,024 to 100). Remaining gaps in the bone were filled manually.
c) Solid mesh of the bone and cement plotted on top of the μCT-data.
d) Zoomed node-to-node interface from figure c.
FEA meshes of the cement were based on the triangular surface mesh of the bone and not on the segmentation of the μCT-data. First, a surface mesh of the cement was created using node-to-node contact between the bone and cement (Figure 2d). Next, to create appropriate gaps at the cement-bone contact interface, an `erosion' algorithm was applied to the bone mesh. Nodes on the bone surface were displaced away from the interface with a magnitude dependent on the nodal equivalent Hounsfield Unit (eqHU). The parameter eqHU was determined as: (Figure 3a). The magnitude of the nodal erosion was determined by a piece-wise linear relation between the eqHU and the applied erosion (Figure 3b). The direction of the nodal erosion (dero) was determined as: (Figure 3c). The final erosion vector (vero) was defined by the magnitude and direction of erosion: .
Figure 3.

a) The parameter of `eqHU' is dependent on the Hounsfield Units of the surrounding elements.
b) Piece-wise linear relation between eqHU and the applied erosion. The maximum erosion was set to 20μm and HUmin and HUmax to 100 and 1500, respectively.
c) Direction of nodal erosion. The unit edge lengths, v1_i and v2_i, were the unit element edges. The unit normal vector of the element face, ui, was always pointing outwards.
d) The eroded solid mesh of the bone and the solid mesh of the cement plotted on top of the μCT-data.
e) Zoomed interface of figure d. with bone (dark grey), cement (light grey) and gaps (black).
The erosion procedure resulted in a new surface mesh with physical gaps at the interface. Subsequently, the eroded surface mesh was meshed in PATRAN to create a solid tetrahedron-based mesh and the average grayvalues were calculated again for each solid element in MIMICS (Figure 3d–e). To simulate the experimental boundary conditions and distribute the applied load gradually over the bone, a layer of homogeneous bone and a stiff top layer were manually added to the top of the bone (Figure 4). The resulting models of the complete bone and cement contained, on average, approximately 480,000 tetrahedral elements and 110,000 nodes.
Figure 4.
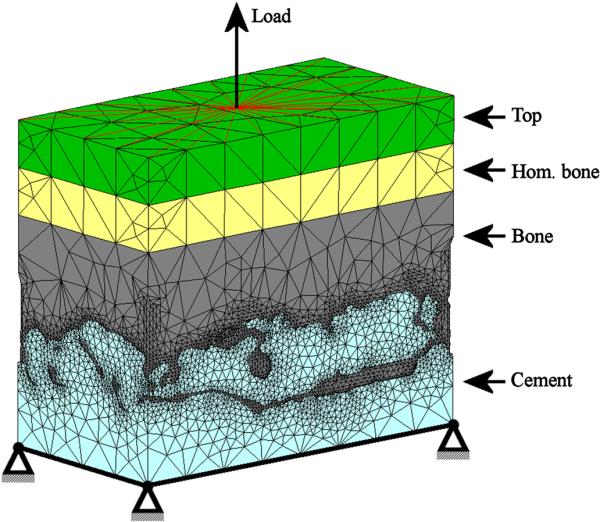
The cement model was fixed in all three directions at the bottom plane. A tensile load, representing the applied stress in the experiment, was applied to a single node at the top plane. All other nodes in the same plane were connected to the loaded node with rigid links to prevent the top plane from tilting, while displacements in the transverse and axial direction were allowed. The top and homogeneous bone layers both had a thickness of 1mm.
The bone and cement were considered as isotropic linear elastic materials. The bone material properties were based on the local average element gray value, which was converted to an equivalent HA-density using a calibration phantom. The elastic modulus was assumed to be linearly dependent on the equivalent HA-density (Lotz et al., 1991) and resulted in bone modulus values ranging from 0.1 to 20,000MPa (ν=0.3). The cement, homogeneous bone and top layer were assumed to have constant material properties with an elastic modulus of 3,000, 20,000 and 210,000MPa, respectively (ν=0.3).
A double-sided node-to-surface contact algorithm was used to simulate contact between bone and cement. Contact was assumed to be debonded; no tensile loads could be transferred at the contact interface. Interfacial friction was modeled using a bilinear Coulomb friction model with a friction coefficient of 0.3 (Janssen et al., 2008; Janssen et al., 2009).
Tensile fatigue loading was simulated for a total of 50,000 cycles in each model. Fatigue failure was calculated by means of a custom-written FEA algorithm that simulated separately creep and damage accumulation in the cement using a previously described method (Stolk et al., 2004). In this method, the element's deformation, {ε}, was calculated as {ε}= [S]{σ} + {εc}, in which [S] was the compliance matrix which also included the damage by locally reducing the element stiffness to zero. The creep strain tensor, {εc}, was determined as: εc = 7.985·10−7 · n0.4113–0.116·log(σ) · σ1.9063 (Verdonschot and Huiskes, 1995). Both cement damage and creep was predicted based on the local stress level, stress orientation, and number of loading cycles.
During the first increment of loading, the static displacement was calculated by mimicking the DIC-measurements from the experiments. Subsequently, the creep damage displacement (δcd) was calculated, defined here as the difference between the actual displacement and the static displacement. To account for the experimental pre-conditioning and running-in phenomena, the FE-creep damage displacement that arose in the first load cycle was ignored. The peak motion (second research question) was defined as the displacement of the bone, interface and cement at 50,000 cycles, when the specimen was maximally loaded. The crack volume fraction (Vcr) of the cement was also monitored during the simulation: . In this formula, Vtot was the total volume of the bulk cement and ni and Vi were the number of cracks in the element and the element volume, respectively.
Linear regression analysis was used to determine relationships between the experimental and FEA creep damage displacements, experimental cement crack growth and FEA crack volume fraction, experimental cement crack growth and FEA surface cracks and experimental cement and bone cracks.
RESULTS
The interfacial creep damage displacements found in the experiments and FEA models both displayed the typical phase I and II of a creep curve (Figure 5a). However, there were distinct differences between the progression of interfacial creep damage displacements in the various models (Figure 5b). In the FEA simulations and experiments, two specimens failed (displacement>72μm); in one case this concerned the same specimen (specimen 8, Table 1). This specimen failed experimentally after 10,000 cycles, whereas the FEA simulation failed within 2,000 cycles. For the seven non-broken specimens, six displayed a higher final FEA interfacial creep damage displacement, while one model had a lower creep damage displacement (Table 1). Incorporating all the data collection points, this resulted in a moderate correlation (r2=0.49) between FEA and experiment (Figure 6). However, if the results of specimen 9 would not be incorporated in this analysis, the correlation would increase to r2=0.89.
Figure 5.

a) FEA and Experimental creep damage displacement of specimen 5.
b) All the ten predicted FEA creep damage responses. The FEA simulations of specimen 7 and 8 failed within 2,000 cycles. Note that the simulations predict a considerable variety in creep responses, despite variation in the applied fatigue tensile load (50% of the estimated stiffness as measured in the experiments).
Table 1.
Experimental and FEA interfacial creep damage displacements at N=50,000. There was a moderate correlation between these values (r2=0.41). Relation between the total crack growth in the cement and crack volume fraction.
| Creep damage displacement [μm] | Cracks in the cement | |||
|---|---|---|---|---|
| Specimen | Experiment | FEA | Total crack growth, Experiment [mm] | Crack volume fraction, FEA [%] |
| 1 | 3.1 | 7.3 | 10.68 | 0.31 |
| 2 | 4.2 | 5.0 | 1.64 | 0.17 |
| 3 | 0.7 | 2.5 | 3.03 | 0.09 |
| 4 | 2.1 | 2.4 | 4.37 | 0.05 |
| 5 | 6.0 | 7.4 | 9.27 | 0.18 |
| 6 | 14.2 | 21.0 | 5.66 | 0.38 |
| 7 | 14.9 | 218.9* | 12.19 | 0.43* |
| 8 | 23.4† | 197.8* | 2.72† | 1.89* |
| 9 | 11.3 | 1.4 | 8.49 | 0.02 |
| 10 | 33.5† | 14.6 | −1.06† | 0.45 |
measured at N=10,000, specimen failed afterwards
measured at N=1,870, model failed afterwards
Figure 6.
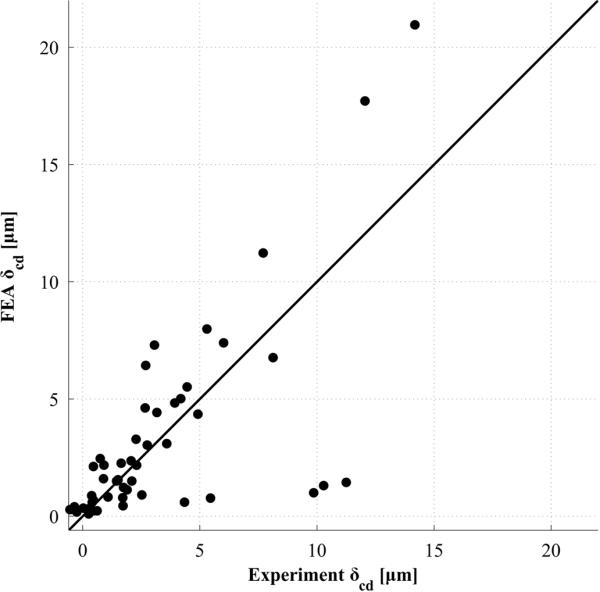
Comparison of the FEA-predicted and experimental creep damage displacements at the various data-gathering points of the seven non-failed specimens (r2=0.49). Note that the correlation is affected by the outliers of specimen 9; the seven measurement points parallel to the x-axis. The solid line represents `Experiment δcd' = `FEA δcd'.
The experiments and FEA simulations displayed a permanent displacement at the cement-bone contact interface, which increased with time as a result of creep and crack accumulation in the cement (Figure 7). In most specimens, cracks were predicted to occur at locations where cracks were found in the experimental specimens (Figure 8). However, in the experimental specimens additional cracks were found at other locations in the cement. More cracks were predicted in models with a relatively high creep damage displacement. These simulated cracks usually corresponded to big clusters of cracks found in the experimental specimens. Small, isolated, cracks found in the experiments were rarely created in the FEA results.
Figure 7.

Crack growth and deformation in a cutting plane of specimen 6. Cracks originated at the contact surface and grew into the bulk cement as the number of cycles increased. The bar next to each cutting plane presents the specimen's initial length (white), static displacement (grey) and creep damage displacement (black). The deformation scale was set to 10.
Figure 8.

Similarities in crack location at the surface of specimen 1 at the end of the loading history. The experiment (left) shows cracks emanating from preexisting cracks (white) and new cracks (black). The simulation (right) shows elements with one or two cracks.
In the experiments and in the simulations, the majority of the peak motion occurred at the contact interface. However, the experiments also showed some deformation in the bone and cement, while these deformations were negligible in the simulations (Table 2).
Table 2.
Average peak motion over the seven non-broken specimens in tension at N=50,000.
| Average peak motion [μm] (S.D.) | |||
|---|---|---|---|
| Bone | Interface | Cement | |
| Experiment | 1.6 (2.8) | 12.7 (5.7) | 2.6 (2.8) |
| FEA | 0.002 (0.24) | 13.7 (9.62) | 0.1 (0.62) |
The average experimental cement crack growth and the FEA-predicted crack volume fraction of the seven non-failed specimens was 6.2mm (S.D. 3.4) and 0.17% (S.D. 0.13), respectively (Table 1). There appeared to be no correlation (r2=0.06) between the experimental cement crack growth and the predicted crack volume fraction (Figure 9a). However, the correlation improved (r2=0.43) when cracks generated at the surface of the FEA model were compared to the number of experimental cement crack growth (Figure 9b). In the experiment, cracks were also found in the bone, but to a much smaller extent (average=0.53 mm, S.D.=0.44). No correlation was found between the experimental total growth of cement and bone cracks (r2=0.02).
Figure 9.

a) Correlation between the experimental cement crack growth as measured on the surfaces of the specimens and the predicted crack volume fraction (r2=0.06).
b) Correlation between the experimental cement crack growth as measured on the surface of the specimens and the cracked surface area of the FEA model (r2=0.43).
DISCUSSION
The objective of the current study was to quantify the micromechanics of the cement-bone interface under tensile fatigue loading and determine if the fatigue creep damage response could be explained using μFEA models. The FEA modeling of the cement-bone interface was based on a newly developed erosion procedure to avoid peak stress artifacts that occurred previously (Janssen et al., 2008; Janssen et al., 2009). This resulted in a gradual distributed load transfer over the contact interface. Additionally, it promoted gapping and sliding between the bone and cement.
The experimental and computational creep damage displacements both showed the typical phase I and II of the three-phase creep response. FEA simulated cracks localized at the contact interface and resulted in crack patterns similar to the experiments. Concurrent with the experiments, the majority of FEA-mesh displacement occurred at the contact interface. Only for specimen 9 the predicted displacement was much smaller than in the experiments. Analysis of the specimen's morphological parameters, FE-model and experiment could not clarify the discrepancy. Possibly, the specimen was damaged in the experiment before testing what resulted in high displacement response.
After 50,000 cycles, there appeared to be a very large variation in creep damage displacement for as well the experiments as the simulations (Table 1), despite the equal load-stiffness ratio for all the specimens. Therefore, the initial stiffness cannot be used as a prediction of the subsequent creep rate.
Obviously, there were limitations to both our experimental and computational study. Because the experiments were unable to capture biological phenomena, the creep-damage behavior displayed would be representative of the immediate post-operative situation. Biological phenomena were also not included in the FEA simulations.
The geometrical accuracy of the FEA models was limited by the resolution of the μCT scan data. Morphological features below 12μm could therefore not be reproduced. In addition, the surface triangulation was based on an interpolation over six voxels in 3D and subsequently remeshed. However, this was necessary to reduce the computational costs.
An additional limitation of this study was that no bone damage was simulated, although the experiments did show limited crack formation in the bone. Previous studies have also demonstrated that trabecular and cortical bone do show some creep damage behavior in fatigue loading (Cotton et al., 2005; Michel et al., 1993). Bone damage was not simulated here because the phenomena of fatigue damage in bone has not been studied in sufficient detail to provide a basis for constitutive modeling (Stolken and Kinney, 2003). Furthermore, the majority of the experimental cracks occurred in the cement rather than in the bone suggesting that our models should be able to capture most of the creep damage response seen experimentally.
The location of the cracks predicted by the FEA simulations corresponded to experimental crack locations, indicating the models were able to reproduce some of the fatigue crack formation phenomena. However, in other areas, additional cracks were found as well in the experimental specimens that were not predicted in the simulations. This discrepancy is likely due to pre-existing cracks present in the experimental specimens from polymerization shrinkage or specimen preparation. These pre-cracks were not simulated because of lack of experimental guidance on distribution of pre-cracks in 3D.
There was a moderate correlation between the experimental total crack growth and the FE crack growth at the surfaces of the specimen for the seven specimens that did not fail, suggesting a reasonable validation of these types of models in terms of micro-crack predictions. The simulated cracked area of the outer surface was weakly correlated with the simulated crack volume fraction inside the simulated specimens (r2=0.21). Hence, this indicates that the interpretation of surface crack measurements as typically done in experiments towards internal (volumetric) material damage is precarious. In addition, there appeared no correlation between the experimental creep damage displacement and the experimental total crack growth of the cement (r2=0.07), while a strong correlation existed between the simulated creep damage displacement and the calculated crack volume fraction (r2=0.76). This also emphasizes the importance of considering the total volumetric morphology, rather than relying solely on surface measurements.
From a clinical perspective, these results suggest that damage to the cement-bone interface from tensile fatigue loading will localize to the contact interface, thereby increasing micro-motion locally between the cement and bone. Greater amounts of creep damage displacement at the contact interface will also be associated with more localized damage to the cement in terms of cement cracking. Minimizing cement damage at the contact interface could reduce risk of failure of these interfaces and improve outcomes of cemented joint replacement procedures.
In conclusion, (1) non-linear micro-FEA models that incorporate the morphology of the contact interface, include friction of the interface, and allow for cement creep and cement damage due to fatigue loading can to a reasonable extent predict fatigue crack patterns similar to experimental findings, and are able to capture the general creep damage behavior of the cement-bone interface; (2) The majority of the motion took place at the contact interface, both in the experiments and in the FEA models; (3) There is no relationship between the experimental total length of cement crack growth found at the interface and the crack volume fraction in the FEA models, although there is a moderate correlation between experimental total length of cement cracks and FEA cracked area on the cement surface. Additionally, there is a strong relationship between the FEA creep damage displacement and the crack volume fraction calculated in FEA.
ACKNOWLEDGMENTS
This work was funded by the NIH grant AR42017.
REFERENCES
- Arola D, Stoffel KA, Yang DT. Fatigue of the cement/bone interface: the surface texture of bone and loosening. J.Biomed.Mater.Res.B Appl.Biomater. 2006;76:287–297. doi: 10.1002/jbm.b.30364. [DOI] [PubMed] [Google Scholar]
- Bean DJ, Convery FR, Woo SL, Lieber RL. Regional variation in shear strength of the bone-polymethylmethacrylate interface. J.Arthroplasty. 1987;2:293–298. doi: 10.1016/s0883-5403(87)80062-1. [DOI] [PubMed] [Google Scholar]
- Cotton JR, Winwood K, Zioupos P, Taylor M. Damage rate is a predictor of fatigue life and creep strain rate in tensile fatigue of human cortical bone samples. J.Biomech.Eng. 2005;127:213–219. doi: 10.1115/1.1865188. [DOI] [PubMed] [Google Scholar]
- Gardiner RC, Hozack WJ. Failure of the cement-bone interface. A consequence of strengthening the cement-prosthesis interface? J.Bone Joint Surg.Br. 1994;76:49–52. [PubMed] [Google Scholar]
- Huiskes R. Failed innovation in total hip replacement. Diagnosis and proposals for a cure. Acta Orthop.Scand. 1993;64:699–716. doi: 10.3109/17453679308994602. [DOI] [PubMed] [Google Scholar]
- Janssen D, Mann KA, Verdonschot N. Micro-mechanical modeling of the cement-bone interface: The effect of friction, morphology and material properties on the micromechanical response. J.Biomech. 2008;41:3158–3163. doi: 10.1016/j.jbiomech.2008.08.020. [DOI] [PMC free article] [PubMed] [Google Scholar]
- Janssen D, Mann KA, Verdonschot N. Finite element simulation of cement-bone interface micromechanics: A comparison to experimental results. J.Orthop.Res. 2009 doi: 10.1002/jor.20882. in press. [DOI] [PMC free article] [PubMed] [Google Scholar]
- Jasty M, Maloney WJ, Bragdon CR, O'Connor DO, Haire T, Harris WH. The initiation of failure in cemented femoral components of hip arthroplasties. J.Bone Joint Surg.Br. 1991;73:551–558. doi: 10.1302/0301-620X.73B4.2071634. [DOI] [PubMed] [Google Scholar]
- Kim DG, Miller MA, Mann KA. A fatigue damage model for the cement-bone interface. J.Biomech. 2004a;37:1505–1512. doi: 10.1016/j.jbiomech.2004.01.011. [DOI] [PubMed] [Google Scholar]
- Kim DG, Miller MA, Mann KA. Creep dominates tensile fatigue damage of the cement-bone interface. J.Orthop.Res. 2004b;22:633–640. doi: 10.1016/j.orthres.2003.09.007. [DOI] [PubMed] [Google Scholar]
- Lennon AB, Britton JR, MacNiocaill RF, Byrne DP, Kenny PJ, Prendergast PJ. Predicting revision risk for aseptic loosening of femoral components in total hip arthroplasty in individual patients--a finite element study. J.Orthop.Res. 2007;25:779–788. doi: 10.1002/jor.20346. [DOI] [PubMed] [Google Scholar]
- Lotz JC, Gerhart TN, Hayes WC. Mechanical properties of metaphyseal bone in the proximal femur. J.Biomech. 1991;24:317–329. doi: 10.1016/0021-9290(91)90350-v. [DOI] [PubMed] [Google Scholar]
- Mann KA, Ayers DC, Werner FW, Nicoletta RJ, Fortino MD. Tensile strength of the cement-bone interface depends on the amount of bone interdigitated with PMMA cement. J.Biomech. 1997;30:339–346. doi: 10.1016/s0021-9290(96)00164-9. [DOI] [PubMed] [Google Scholar]
- Mann KA, Miller MA, Cleary RJ, Janssen D, Verdonschot N. Experimental micromechanics of the cement-bone interface. J.Orthop.Res. 2008;26:872–879. doi: 10.1002/jor.20575. [DOI] [PMC free article] [PubMed] [Google Scholar]
- Mann KA, Miller MA, Race A, Verdonschot N. Shear fatigue micromechanics of the cement-bone interface: An in vitro study using digital image correlation techniques. J.Orthop.Res. 2009;27:340–346. doi: 10.1002/jor.20777. [DOI] [PMC free article] [PubMed] [Google Scholar]
- Michel MC, Guo XD, Gibson LJ, McMahon TA, Hayes WC. Compressive fatigue behavior of bovine trabecular bone. J.Biomech. 1993;26:453–463. doi: 10.1016/0021-9290(93)90009-4. [DOI] [PubMed] [Google Scholar]
- Moreo P, Perez MA, Garcia-Amar JM, Doblare M. Modelling the mixed-mode failure of cement-bone interfaces. Engineering Fracture Mechanics. 2006;73:1379–1395. [Google Scholar]
- Race A, Miller MA, Ayers DC, Mann KA. Early cement damage around a femoral stem is concentrated at the cement/bone interface. J.Biomech. 2003;36:489–496. doi: 10.1016/s0021-9290(02)00460-8. [DOI] [PubMed] [Google Scholar]
- Stoffel KA, Yang DT, Arola D. The influence of surface topography on wear debris generation at the cement/bone interface under cyclic loading. J.Mater.Sci.Mater.Med. 2008;19:1935–1943. doi: 10.1007/s10856-007-3273-5. [DOI] [PubMed] [Google Scholar]
- Stolk J, Janssen D, Huiskes R, Verdonschot N. Finite element-based preclinical testing of cemented total hip implants. Clin.Orthop.Relat Res. 2007;456:138–147. doi: 10.1097/BLO.0b013e31802ba491. [DOI] [PubMed] [Google Scholar]
- Stolk J, Verdonschot N, Mann KA, Huiskes R. Prevention of mesh-dependent damage growth in finite element simulations of crack formation in acrylic bone cement. J.Biomech. 2003;36:861–871. doi: 10.1016/s0021-9290(03)00003-4. [DOI] [PubMed] [Google Scholar]
- Stolk J, Verdonschot N, Murphy BP, Prendergast PJ, Huiskes R. Finite element simulation of anisotropic damage accumulation and creep in acrylic bone cement. Engineering Fracture Mechanics. 2004;71:513–528. [Google Scholar]
- Stolken JS, Kinney JH. On the importance of geometric nonlinearity in finite-element simulations of trabecular bone failure. Bone. 2003;33:494–504. doi: 10.1016/s8756-3282(03)00214-x. [DOI] [PubMed] [Google Scholar]
- Verdonschot N, Huiskes R. Dynamic creep behavior of acrylic bone cement. J.Biomed.Mater.Res. 1995;29:575–581. doi: 10.1002/jbm.820290504. [DOI] [PubMed] [Google Scholar]
- Verdonschot N, Huiskes R. Mechanical effects of stem cement interface characteristics in total hip replacement. Clin.Orthop.Relat Res. 1996:326–336. doi: 10.1097/00003086-199608000-00040. [DOI] [PubMed] [Google Scholar]
- Zant NP, Heaton-Adegbile P, Hussell JG, Tong J. In vitro fatigue failure of cemented acetabular replacements: a hip simulator study. J.Biomech.Eng. 2008;130:021019. doi: 10.1115/1.2904466. [DOI] [PMC free article] [PubMed] [Google Scholar]